 Yuri Geraldo Gomes Ribeiro1,2*
 Rodrigo Matta Bastos3
 Beatriz Oliveira Silva3
 Silvio Marchini2
 Rafael Batista Morais2Mariana Labão Catapani1,4
 Pedro Luiz Pizzigatti Corrêa3
 Ricardo Luís Azevedo da Rocha3Ariana Moura da Silva3
 Katia Maria Paschoaletto Micchi Barros Ferraz2
- 1Wild Animal Conservation Institute (ICAS), Campo Grande, Mato Grosso do Sul, Brazil
- 2Wildlife Ecology, Management and Conservation Lab (LEMaC), Forest Science Department, Luiz de Queiroz College of Agriculture, University of São Paulo, Piracicaba, São Paulo, Brazil
- 3Politechnical School of University of São Paulo, São Paulo, Brazil
- 4Chester Zoo, Chester, United Kingdom
Introduction: There has been a gradual increase in studies of social media data usage in biodiversity conservation. Social media data is an underused source of information with the potential to maximize the outcomes of established conservation measures. In this study, we assessed how structured social media data can provide insight into species conservation through a species conservation plan, based on predefined actions.
Methods: We established a framework centered on a set of steps that go from defining social media platforms and species of interest to applying general analysis of data based on data dimensions—three W’s framework (What, When, Who) and the public engagement that posts received. The final and most important step in our proposed framework is to assess the overlap between social media data outcomes and measures established in conservation plans. In our study, we used the Brazilian National Action Plan (BNAP) for big cats as our model. We extracted posts and metrics about jaguars (Panthera onca) and pumas (Puma concolor) from two social media platforms, Facebook and Twitter.
Results: We obtained 159 posts for both jaguars and pumas on Facebook (manually) and 23,869 posts for the jaguar and 14,675 posts for the puma on Twitter (through an application user interface). Data were categorized for content and users (only Facebook data) based on analysis of the content obtained and similarities found between posts. We used descriptive statistics for analyzing the metrics extracted for each data dimension (what, when, who, and engagement). We also used algorithms to predict categories in the Twitter database. Our most important findings were based on the development of a matrix summarizing the overlapping actions and dimensions of the data. Our findings revealed that the most prominent category of information for jaguars on Facebook was the sighting of wildlife outside protected areas, while for pumas, it was the trespassing of property by wildlife. From the Twitter dataset, we observed that the most prominent category of information for jaguars was: the sighting of wildlife outside protected areas, while for pumas, it was wildlife depredation by direct or indirect means. We found temporal trends that highlight the importance of categories in understanding information peaks on Facebook and Twitter.
Discussion: When we analyze online engagement, we see a predominance of positive reactions on Facebook, and on Twitter, we see a balanced reaction between positive and negative. We identified 10 of 41 actions in the BNAP that might benefit from social media data. Most of the actions that could benefit from our dataset were linked to human–wildlife conflicts and threats, such as wildlife–vehicle collisions. Communication and educational actions could benefit from all dimensions of the data. Our results highlight the variety of information on social media to inform conservation programs and their application to conservation actions. We believe that studies on the success of applying data to conservation measures are the next step in this process and could benefit from input from decision-makers.
1 Introduction
With the advent of the Anthropocene and its deleterious consequences, conserving biodiversity requires attention and innovative ways to implement it. This requires the use of new technologies and other means that can support applied conservation, bringing vital improvements to the field. In this context, exploring data created outside of traditional ecology can contribute to better outcomes that are more closely connected to real-world challenges. Species vary in their online representation in the online data; this includes the different perceptions of species and the threats linked to them (Rose et al., 2018; Lenzi et al., 2020). It also includes significant cultural influences and misconceptions about species. In a sense, the media can provide an excellent opportunity to inform conservationists about the actual representation of species and to involve people in the conservation world. Social media data represent one of the possibilities for acquiring and using this expanding field (Di Minin et al., 2015; Toivonen et al., 2019).
Social media has a large amount of data related to biodiversity, from simple records of species to complex people and nature interactions (Spalding et al., 2017; Campbell and Engelbrecht, 2018; Pereira et al., 2018). Online data usage is still new, with increasing progress in recent years. Studies exploring social media content can include analytics using different dimensions of data, for instance, verifying users’ interactions with nature-related content, spatial clusters of users’ data, recording species distributions, and more general studies (Richards and Friess, 2015; ElQadi et al., 2017; Väisänen et al., 2021). More recently, the large amount of information available online was defined as part of conservation culturomics. The concept considers multiple dimensions of information that could lead to substantial contributions to outcomes of conservation actions. Efforts to use social media data in applied conservation benefit from well-conceived and comparable analysis. Umbrella concepts such as conservation culturomics, data dimensions or levels based on the five W’s (Who, What, Where, When and Why), and well-structured frameworks can improve the integration of this type of data (Di Minin et al., 2015; Toivonen et al., 2019; Correia et al., 2021).
The use of a systematic approach to exploring species databases remains a developing effort. The steps in acquiring data for analysis may have different drawbacks depending on the purpose of their use. Studies describing the strengths and weaknesses of a species-specific social media database are increasing. This could be a broad approach to the representation of a species in the digital dimension. There were early efforts to explore trends in online species information on search engines such as Google (Proulx et al., 2014; Nghiem et al., 2016). However, there are limits to searching for a word and getting trends or searching for a species with a limited number of categories offered by automated search platforms. General trends for engagement in species content are not readily available. While this type of analysis has been explored in areas related to marketing (Jussila et al., 2014; Sajid, 2016), its planning potential is still underestimated in conservation science.
One way to apply this information could be to include it in the conservation of iconic threatened species. Iconic species play an important role in culture and media and are often under threat. The salience, measuring the importance of a species in online content, facilitates access to broad social media databases. Representation of these species can range from reported threats to educational content. For instance, big cats are well-known species and may differ in their cultural salience depending on the region of the world. A consequence of this is how events related to them may reverberate in the digital dimension with different reactions, like in the case of the lion named Cecil (Macdonald et al., 2016). This case has been the subject of controversy over the trophy hunt.
Most of these species, including emblematic carnivores, are represented in action plans with clear conservation objectives. However, the measures set out in these plans often do not explore the benefits of using social media data. Global species strategic planning has proven successful in reversing conservation status in many cases (Byers et al., 2022). It is difficult to know whether the lack of inclusion of social media data is a consequence of the novelty of these datasets or the absence of structured framework analysis. In fact, in many circumstances, plans include actions that refer directly to communication. In most cases, conservation plans contain multiple defined actions targeting well-defined threats to species. Here, we highlight the results of social media data collection and content exploration for two different iconic species, the jaguar (Panthera onca) and the puma (Puma concolor). We wanted an overview of how both species are perceived in the digital environment. Our main goal in this study was to evaluate how actions from a local conservation plan (the Brazilian National Action Plan (BNAP) for big cats) could benefit from simple data analysis. We believe that even though not all actions overlap with the use of social media data, those that have a clear application from our data set could have maximized results.
2 Methods
2.1 Analysis framework
We built an analysis framework for social media data analysis in the context of our species (jaguar and puma) conservation planning (Figure 1). To build the framework, we considered previous research on the topic, mainly those focused on exploring social media post data and their use for applied conservation. Our study framework consisted of the following steps: (1) We first decided on the species of interest and the social media platform to be explored. (2) Species-specific search in social media requires adequation and tests on the terms used to ensure specificity (data related to the selected target) and appropriateness (relevant data captured). Some species might present difficulties in obtaining data related to mismatches or the species name being used informally in different contexts. In order to test how data may fit our context, we opted for using two iconic species and their colloquial names as search entries (in Portuguese): jaguar (Panthera onca) and puma (Puma concolor). (3) The third step consisted of data extraction, as a means of focusing the data analysis of national and international conservation plans guiding further conservation actions. (4) We defined the following stage of data structuring. Data, despite the social media platform choice, is extracted in its raw state early on. When collecting manually, the process of structuring data happens together with the extraction. Meanwhile, for automized extraction (e.g., Twitter data), data is obtained unstructured, here called raw data. We suggest that applying the five W’s, which consist of different data dimensions for describing and exploring—What, When, Who, Where, and Why (Di Minin et al., 2015; Toivonen et al., 2019)—represents an appropriate procedure for structuring data that could be adopted by institutions where the complex analyses would take a long time to conduct. We did not include the dimensions where and why in this study as we understood it would require a specific study for analyzing both. Moreover, we considered the conservation culturomics perspective as an established methodology for guiding data structuring and data analysis (Ladle et al., 2016; Correia et al., 2021). We finally separated data into collected posts and written post interactions (e.g., comments). Other metrics for data analysis were available from metadata, and others were obtained (data mining) through classification. Here, we tested our adapted analysis framework on two different social media platforms: Facebook and Twitter. (5) Finally, we chose to explore how social media data fits in each official action determined in the BNAP, to understand how this type of database may be considered in the planning process.
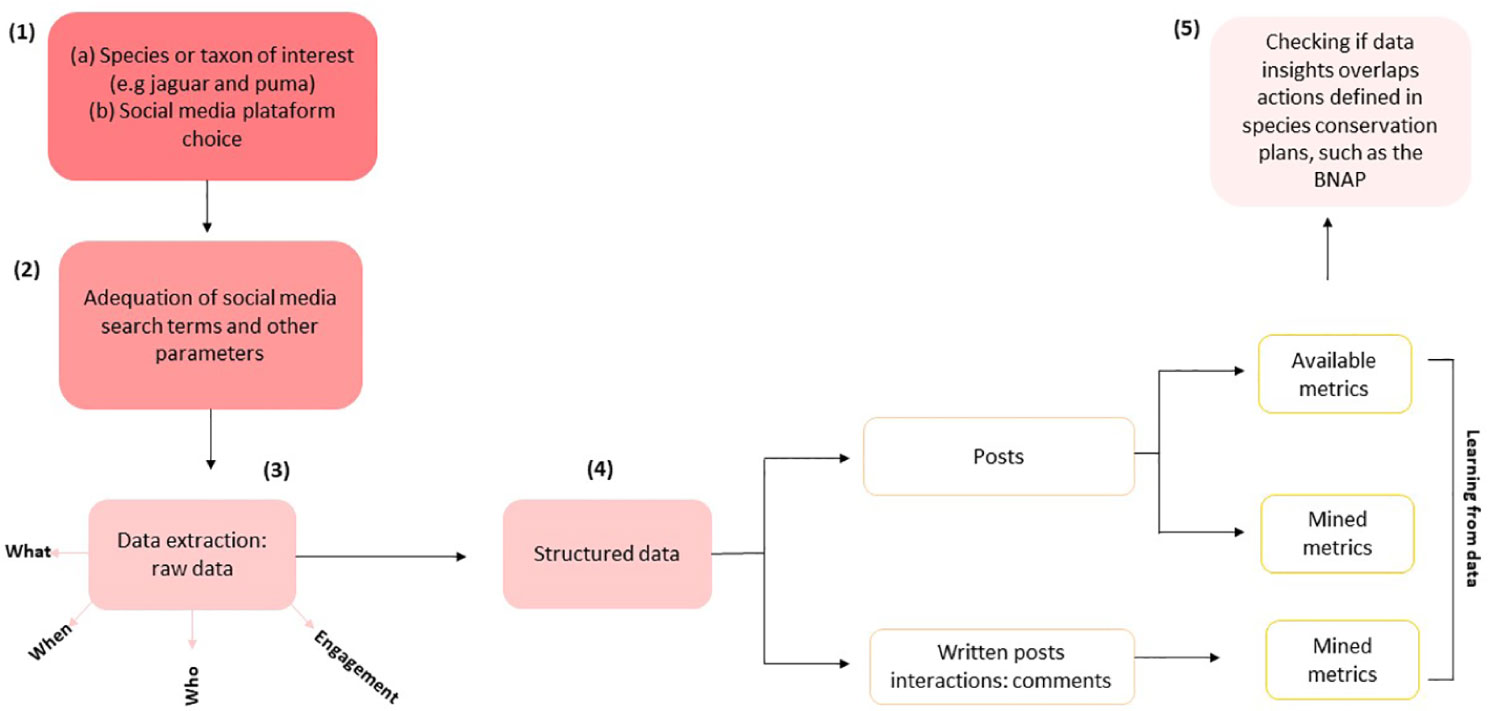
Figure 1 Proposed framework showing six different steps: from the selection of species and social media platforms to data application in species conservation plans.
2.2 Limits to study and social media platforms
We defined different study areas for each platform (Figure 2). For searches performed on Facebook, the area is defined as São Paulo state. We chose to limit the spatial scale for Facebook searches to avoid data dispersion through many states, due to the limitations in obtaining a satisfactory volume of data manually. The state of São Paulo is considered the most industrialized and economically developed Brazilian state and is home to one of the largest areas of preserved Atlantic Forest in Brazil, with a territory length of 248,209 km² and a population estimated at 42,9 million inhabitants in 2019 (IBGE, 2019). The state has the largest number of people with internet access (14,486 households) (IBGE, 2022). Regarding its landscape, São Paulo state has also undergone a rapid conversion of its land use, mainly due to the exacerbated population growth and agricultural advances. Currently, the state has intense land use based on sugar cane plantations and alcohol production (Ogura et al., 2022). Approximately 4.7 million ha of native vegetation remains in the state, distributed in small fragments (Sparovek et al., 2010).
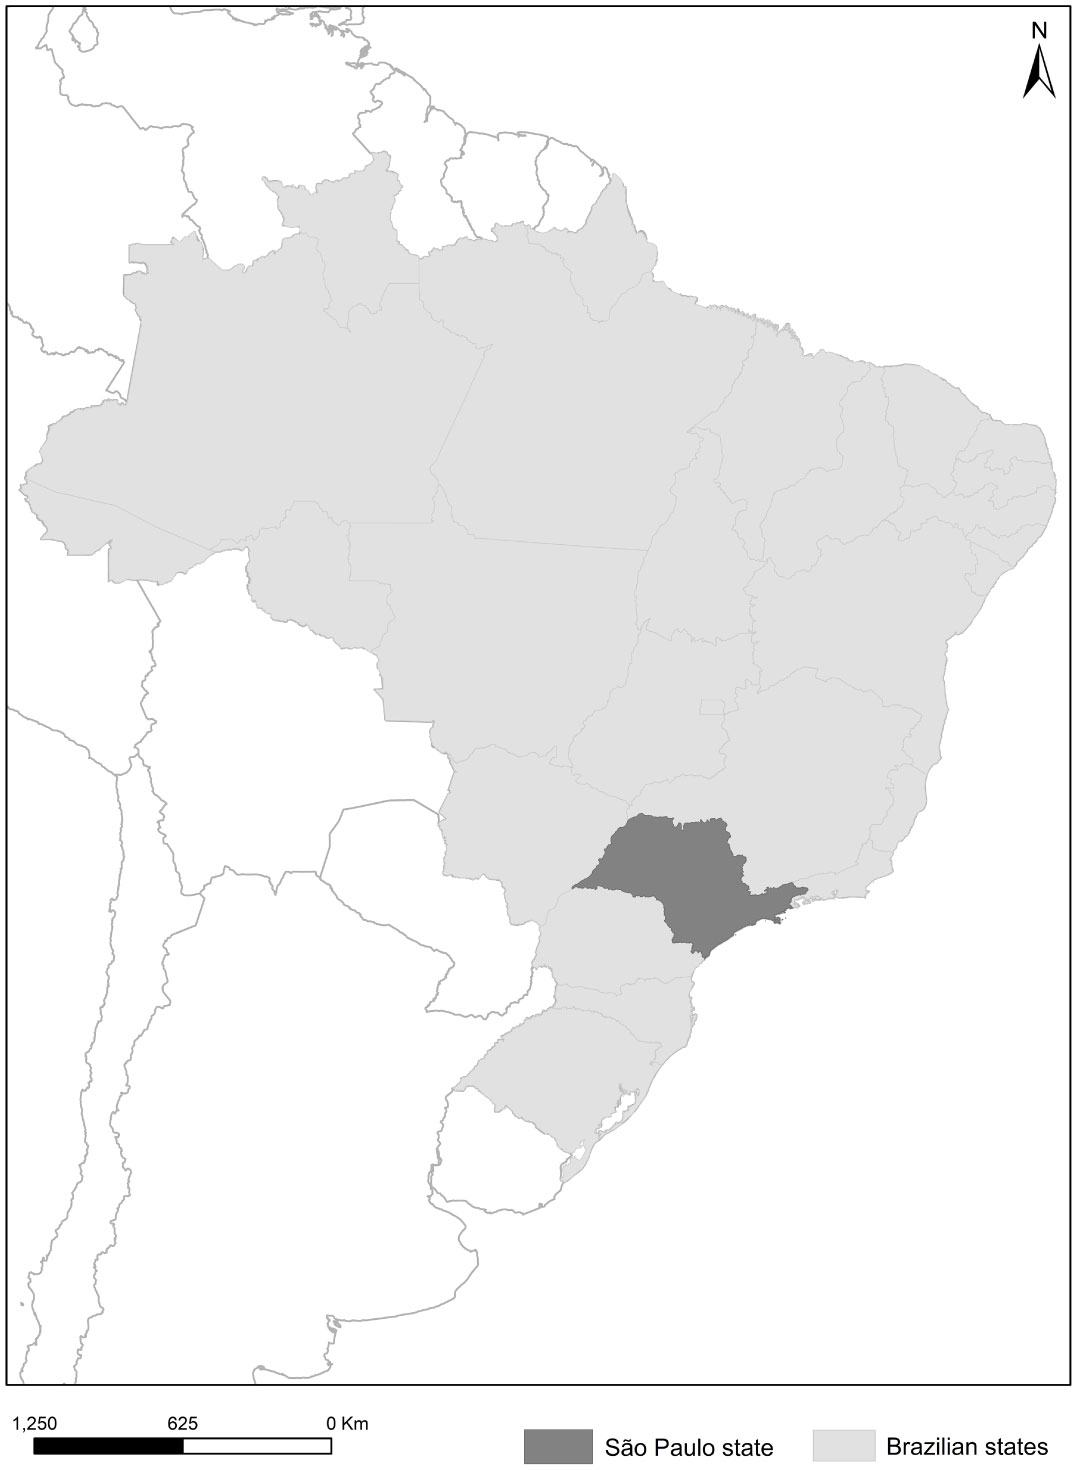
Figure 2 Limits adopted for searches on social media in this study. The dark gray area represents the state of São Paulo, used in Facebook searches, and the light gray area, Brazil, used in Twitter searches.
For Twitter, data selection was based on the territorial limits of Brazil, since the search for the API did not allow the inclusion of an adjacent word for location, such as “São Paulo”. Brazil has a territorial extension of ~8,514,876 km², with a total population of 209.3 million (IBGE, 2019). Currently, the country have 59,763 households with microcomputers connected to the internet, and 67.168% with mobile phones (IBGE, 2022). Twitter, although globally known, reaches only 5% of the population that uses social media in Brazil (We Are Social; Hootsuite, 2019); the social media platform has around 8.5 million users in Brazil.
The social media platforms selected for this study were Facebook and Twitter. We selected social media platforms based on usage (Facebook has high usage in Brazil) and data availability (Twitter policies for data sharing with researchers). Known worldwide, the two social media platforms have different challenges and potential for use (Ruas et al., 2019). Dealing with Facebook data is laborious since this social media platform does not allow access to its full data. Thus, many of the studies based on Facebook require manual data collection (Papworth et al., 2015). Twitter, on the other hand, was launched as a social media platform created for microblogging. Twitter has more restricted use in Brazil compared to Facebook. Unlike Facebook, studies using Twitter tend to have a wider range of resources for obtaining and storing data, since it provides an exclusive API (application user interface) service.
2.3 Data collection
Through personal accounts, we searched using the terms “onça-pintada são paulo” and “onça-parda são paulo”. We tested the terms in comparison to different species names, to verify if our search would return specific and appropriate results. We used the terms in Portuguese because we were concerned with obtaining data that could be used on a national scale. Also, we decided to use colloquial words after testing using the species names without a hyphen. We used the personal accounts of two different users in order to minimize the effect of the Facebook algorithm. The algorithm may cause a repetition of topics by favoring the display of posts that potentially correspond to the user’s interests (Schäfer, 2020).
Based on the search terms, we analyzed public posts in the “Publications,” “Photos,” and “Videos” sections of the Facebook search tool. We only considered posts related to the species and events that occurred in the state of São Paulo in the data collection, so content with a different location and/or not directly related to the species was discarded. We also excluded the collection of posts with inconsistent locations. A total of 159 posts were collected, including texts, photos, and videos, 80 for jaguars and 79 for pumas. The number of publications collected was determined by the effect of the Facebook algorithm and the absence of new posts. The search was reviewed to check if any new post was found. We believe that since this study shows a range of possibilities of how to use social media data combined with species action plans, the number of posts obtained was also sufficient. Moreover, in the specific case of jaguars, the social media algorithm generated a repetition of topics, so we obtained a large number of similar photos of individuals in captivity at the São Paulo Zoo.
To obtain data from Twitter, we used a Twitter API service. An API allows developers to interact with the social media platform programmatically (Clarke, 2004). The Twitter API is an interface that allows registered users to access social media services. The API allows users to search the history of Tweets (posts on the platform), streaming Tweets (or obtaining them as they are generated), integrating services into the online platform, as well as automated publishing, among others. We used the function of searching through Tweet history (Search API). The function allows a set of keywords to be specified for searching the entire Twitter database. The search result returned a JSON (Java Script Object Notation) containing posts; we used the premium version for obtaining messages posted at any time.
Specifically for Twitter, we made successive attempts with terms for checking returned tweets. Initially, we used the combination “species name + location,” the same way we did on Facebook. This strategy did not result in tweets related to the species. We did all the searches in Portuguese, using names related to how the species is known in Brazil. For jaguar and puma, we found 90% of related posts in the returned database. Data organization and cleaning brought some difficulties, given the number of posts extracted from Twitter. In total, 23,869 posts were extracted for jaguars and 14,675 for pumas.
2.4 Social media metrics overview
2.4.1 Categorization of data
In the case of Facebook, in addition to variables common to many social media such as sharing and number of comments, it also provides reactions. Reactions correspond to feelings and generally have different meanings, offering more layers of information about public engagement on a given topic. The Twitter variable sets were chosen based on the Facebook set of shared variables and exclusive variables for each social media platform. Based on these variables, we integrated the jaguar and puma databases. The list of variables is described in Table 1. We organized the variables following the proposed classification by Di Minin et al. (Di Minin et al., 2015).
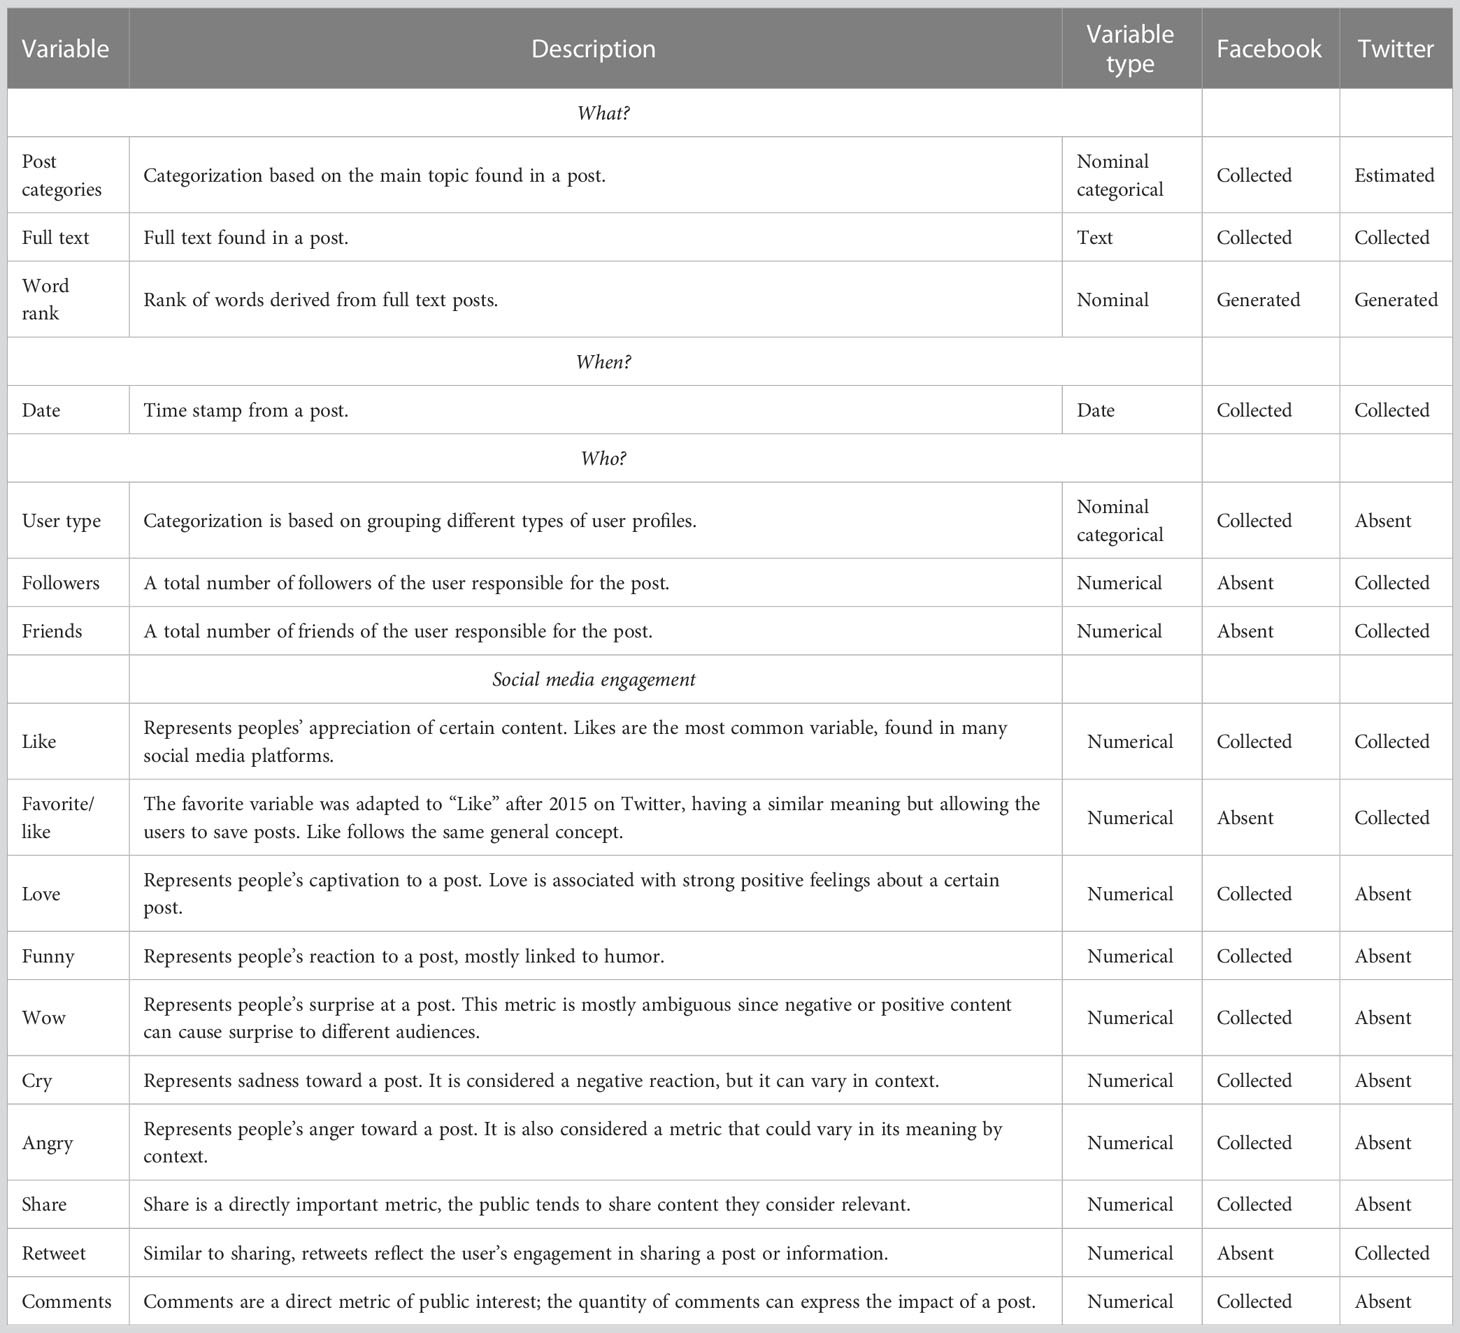
Table 1 List of variables from Facebook and Twitter.
To generate the variable “post categories,” we opted for a categorization based on the available post information (Maxwell, 2012). The approach adopted considers the content present in the text to define codes for categories, followed by grouping data that shares the same type of content. Categorization in all cases was carried out by part of the team; later, authors not involved in this specific process verified categories, certifying authenticity. The topics were summarily grouped using content as the main criteria for their organization. The main text was divided into topics related to the nature of the event that motivated the posting, and each category division was properly described. For instance, a roadkill-related post was placed in the category of wildlife depredation by direct or indirect means. Thus, six final categories were obtained. Categories with a low number of posts were grouped based on their relationship. For the variable “type of user,” we followed the same categorization model for the types of users found in the database, leaving eight final categories. The categories are described in Table 2.
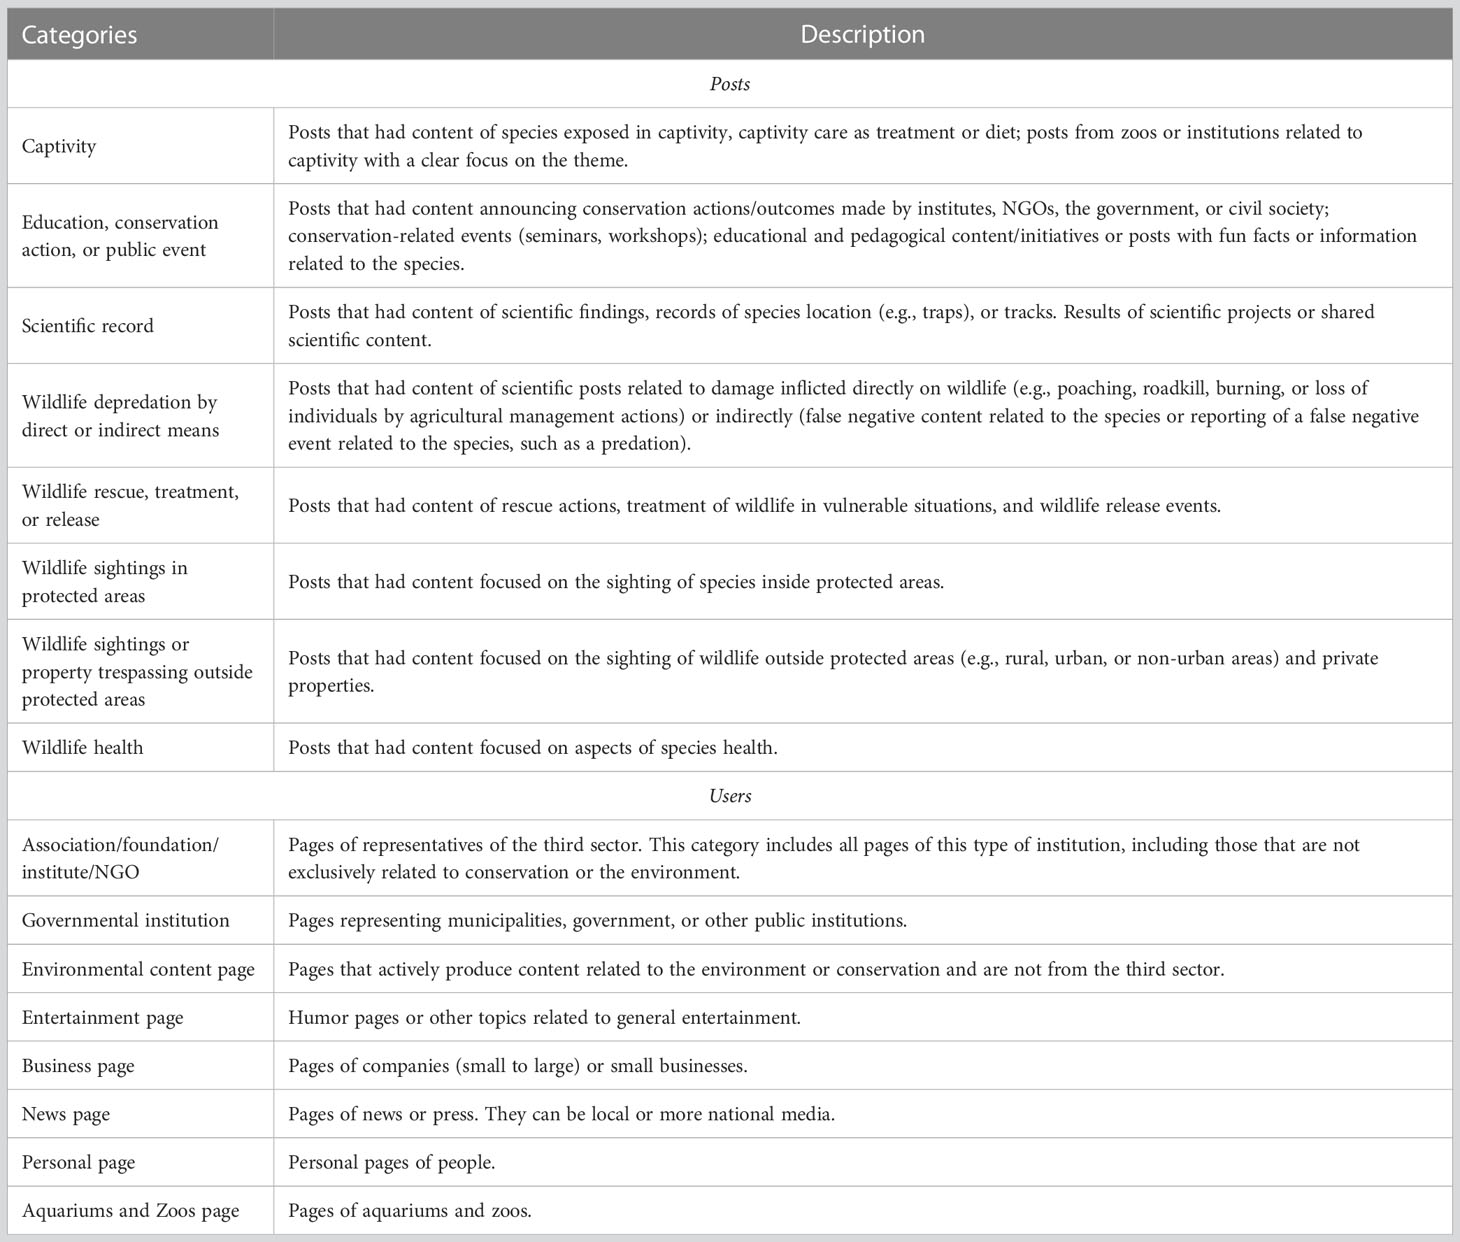
Table 2 List of categories generated from Facebook data.
2.4.2 Automated categorization performance
For Twitter specifically, we made a random selection of a 1,000- post sample for classifying data using the same category system developed manually in Facebook. We used Natural Language Processing techniques and Supervised Learning to train classifiers in the Twitter categorized data. We chose a set of different algorithms to evaluate performance and selected the algorithm based on the best predicted results. Specifically, we trained classifiers to identify categories in the entire Twitter database. Afterward, we assessed the success of our classification through cross-validation techniques (more details in Supplementary Material 1).
2.4.3 General data characterization
We chose to analyze, specifically, each variable by social media. We used descriptive statistics for most of the analyses, and for the organization of the data and its processing, we used R software (R Core Team, 2017) and Atlas ti.8 (Friese, 2019). Below is an analysis description for each dimension:
2.4.3.1 What
We chose to analyze the frequency by category and general frequency for the variable “post categories”. We used histograms based on the frequency of the number of words to represent the variable “word count”. We used the Atlas ti.8 software to analyze the frequency of words for all posts by species, related to the “text” variable. Twitter analyses followed the same procedure.
2.4.3.2 When
For this dimension, we have created time-series graphs by species. In the case of Facebook data, we used categories over time series.
2.4.3.3 Who
For this dimension, we followed the same approach used for the “post categories” variable with Facebook data. Regarding Twitter data, we opted for the graphical representation of the data distribution for the variables “friends” and “followers”.
2.4.3.4 Engagement
For this dimension, we followed the same approach of describing frequencies by variable.
2.5 Species national plan assessment
The Brazilian National Action Plans for the Conservation of Endangered Species are defined as management and planning instruments, built collaboratively, for the ordering and prioritization of actions aiming for the conservation of biodiversity and its natural environments, with well-defined objectives and time frames. The BNAP is part of a series of taxon-based plans. BNAP requires multiple engagement efforts for achieving conservation targets and could benefit greatly from different data sources (https://www.gov.br/icmbio/pt-br/assuntos/biodiversidade/pan/pan-grandes-felinos). Therefore, based on our results, we analyzed each of the 41 actions established by Chico Mendes Institute for the Conservation of Biodiversity (ICMBio) in the BNAP for the conservation of big felids.
We took an initial step by evaluating whether each action had an interface that could benefit from social media data. The first evaluation was solely based on the description given in the BNAP. We determined through this evaluation if there was any link between the action and communication strategies. We also used the category names for selecting the first round of actions. We understand that institutions could find different uses for our database in actions, as well as define a different set of actions that could benefit from our data. However, as a guide, we decided to explore the actions selected from the plan and discuss how each of them could benefit from our different data dimensions. We developed a matrix summarizing our findings, including considerations specifically about impacts on people, considering behavior and attitude.
3 Results
3.1 Social media overview metrics: Facebook
From 159 corresponding posts on Facebook, analyzed per species, the two main categories found for jaguars were “Education, conservation action, or public event” (16.25%) and “Captivity” (62.5%). For pumas, the two main categories were “Scientific record” (17.72%) and “Wildlife sightings or property trespassing outside protected areas” (36.71%). Regarding word rankings, some terms were repeated between species, e.g.: “zoo” or “zoo park”, “conservation”, “forest”, “environmental”, “photo”, “offspring”, “interior”, “city”, and mention of the road system (road and highway). In some cases, cities, such as “Apiaí” for jaguars and “Piracicaba” for pumas, featured prominently in the ranking. Other words highlighted by species were, for jaguars: “highway”, “cub”, and “large”; and for pumas: “city”, “park”, and “secretariat”.
Regarding “when” for jaguars, “Captivity” remained the predominant category. We notice a peak in posts related to the “Wildlife sightings or property trespassing outside protected areas” category, between November and January 2019 (Figures 3, 4). Regarding “who,” we found that the three categories of users with the highest representation in the data set were: “Personal pages” (42.59%), “News page” (14.51%), and “Business page” (8.52%). The categories showed similar values by species, with “Personal pages” being the dominant category for jaguars (75%). For pumas, “Personal pages” was also the dominant category (32.91%), followed by “News pages” (22.78%).
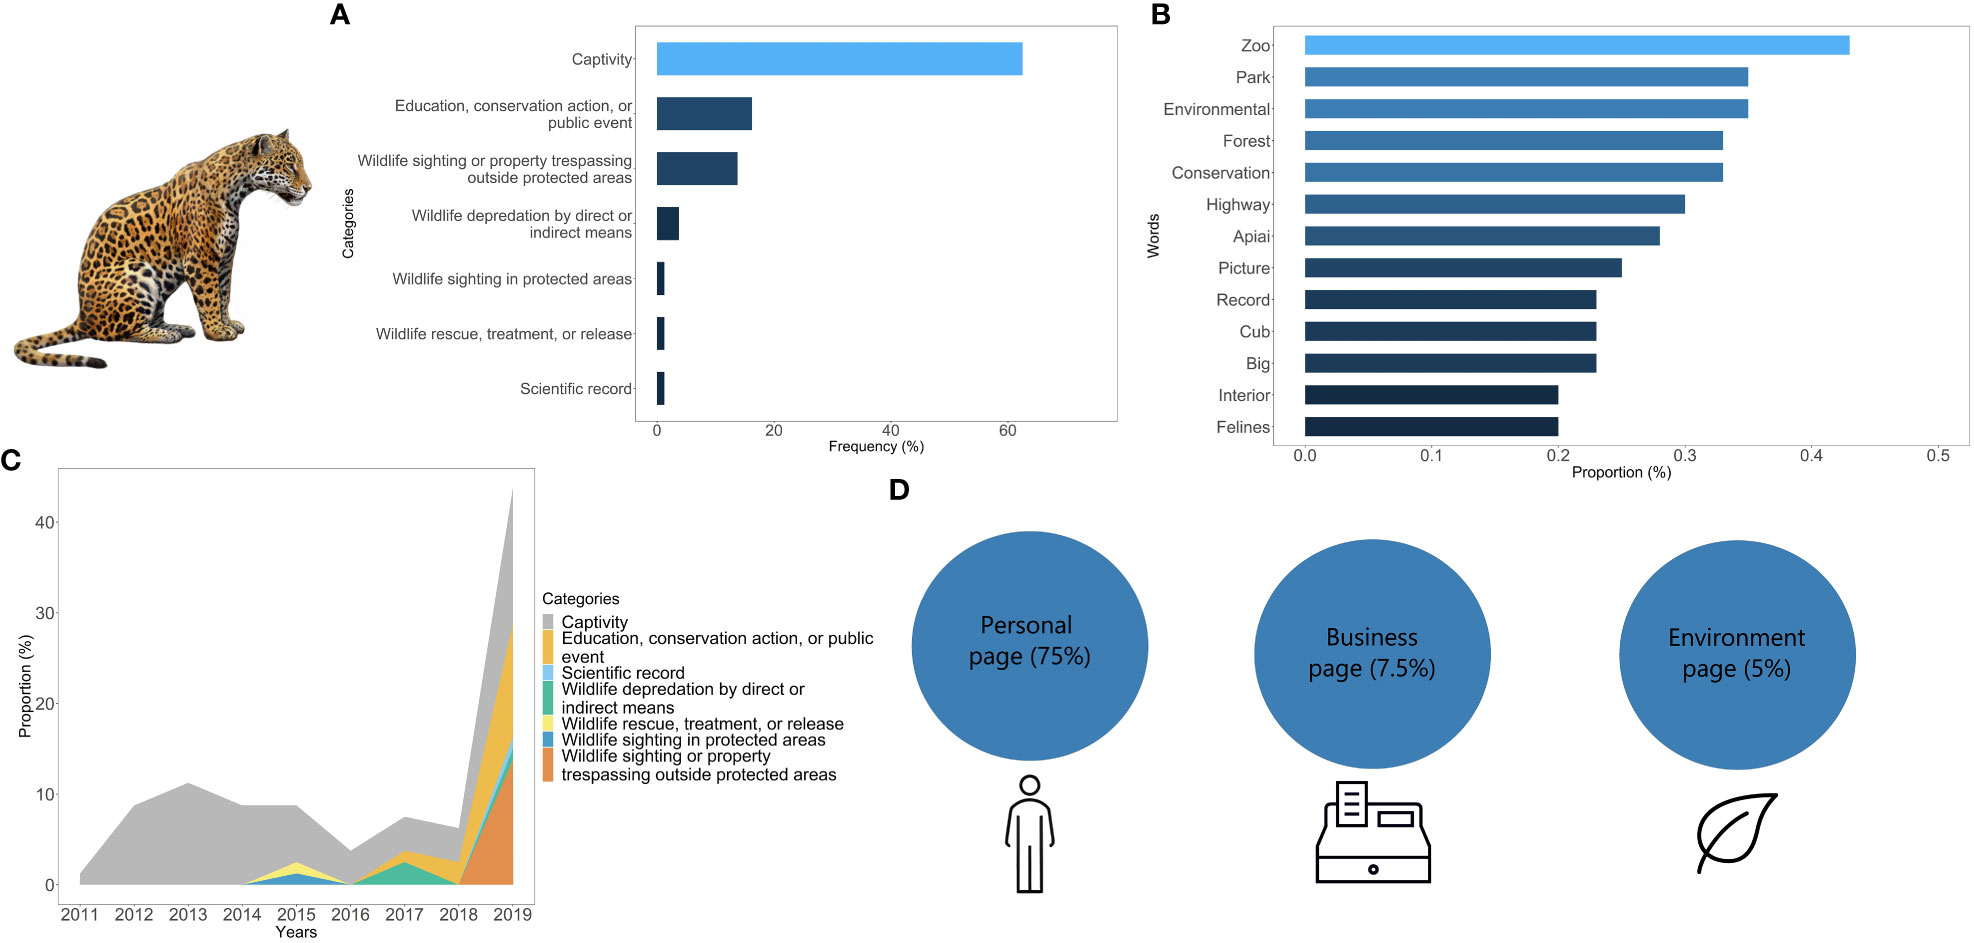
Figure 3 Facebook dashboard representing data synthesis for jaguars. The dashboard includes the proportion of posts by categories for each species (A); proportion of prevalent words (B); timeline of categories in the sample (C); types of users sharing the species content (D).
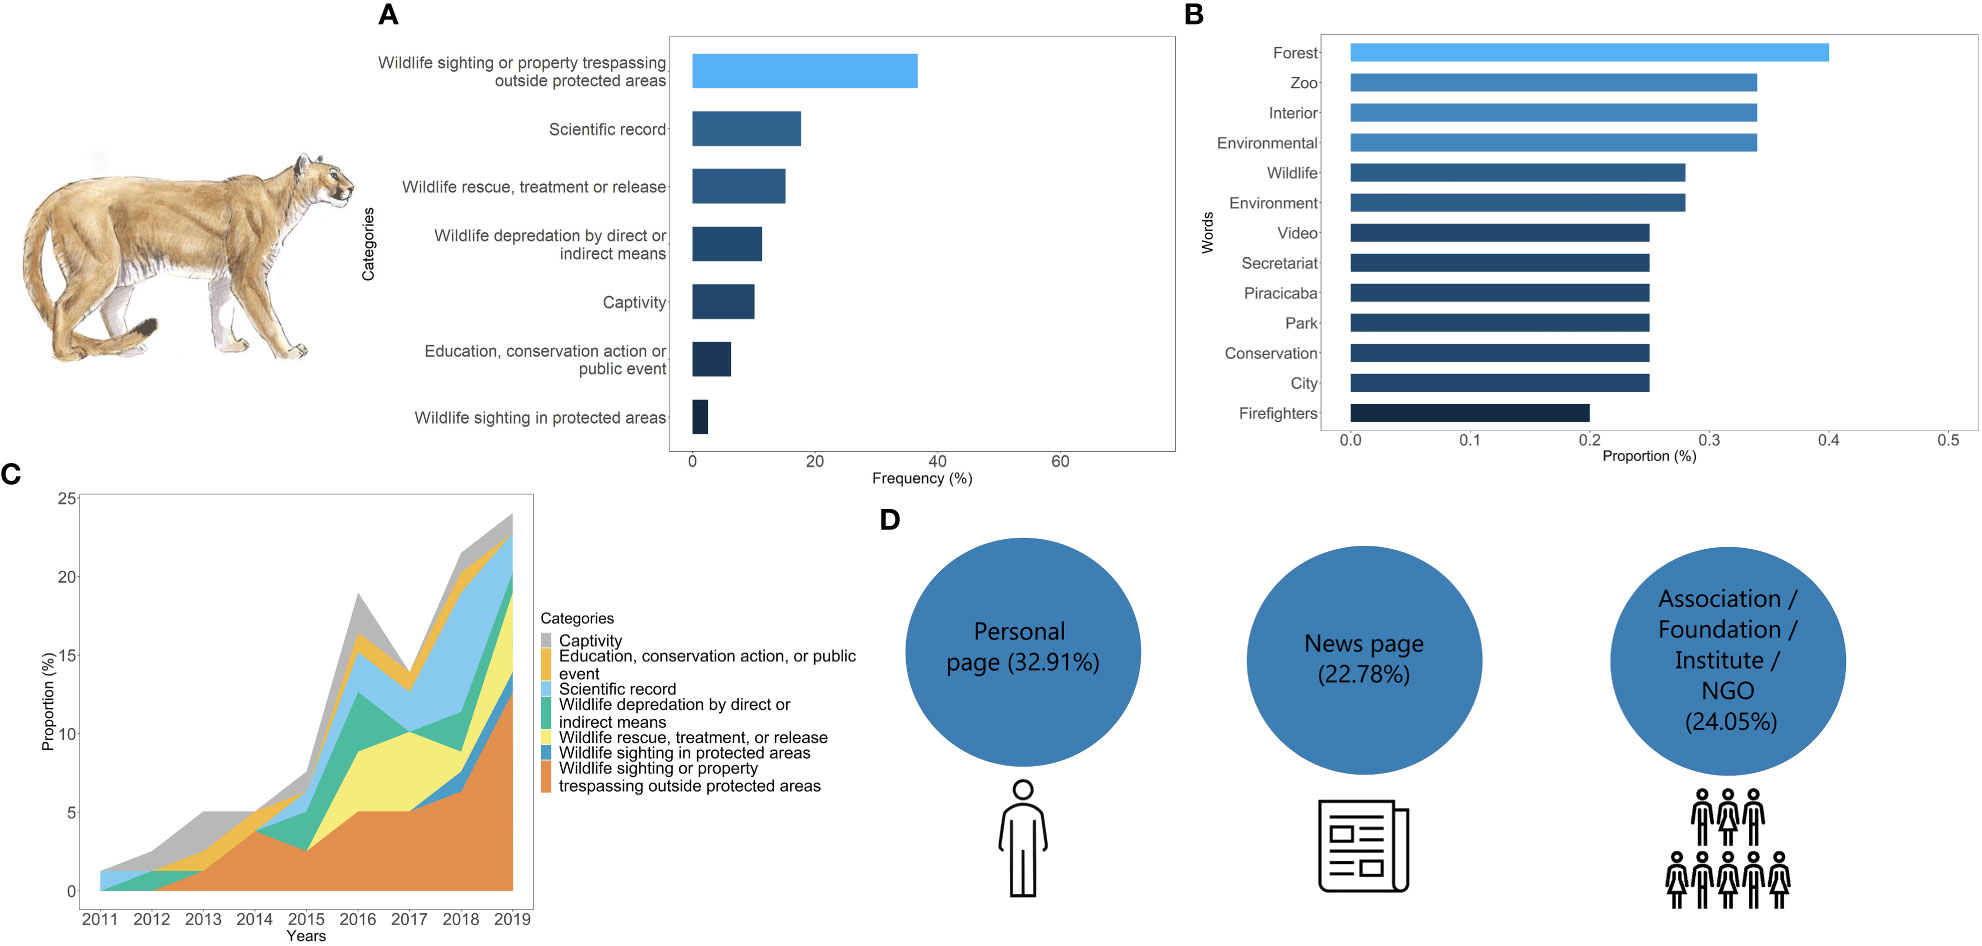
Figure 4 Facebook dashboard representing data synthesis for pumas The dashboard includes the proportion of posts by categories for each species (A); proportion of prevalent words (B); timeline of categories in the sample (C); types of users sharing the species content (D).
From engagement variables collected in the Facebook database, we found considerable variation, with the variables like, sharing, and love presenting the most expressive values. For jaguars, likes had a median of 8.5, with the highest observed value being 698. The second highest median value found for jaguars was sharing (1), with 1,622 being the highest value found. For comments, we found a median of 0.5, with 80 being the highest value found. For love, even with a median value of 0, we found the second highest value for engagement variables using Facebook reactions (288).
For pumas, the variables of engagement like sharing, comments, and love also showed the most expressive values. For likes, the median found was 22, with 5,700 being the highest value found. For sharing, the median found was 4, with 1,195 being the highest value found. For comments, we found a median of 2, with 259 being the highest value found, and for love, even with a median value of 0, we found the third-highest engagement value using Facebook reactions (308). For pumas, an increase in the surprise variable is seen in comparison to the jaguar (Figure 5).
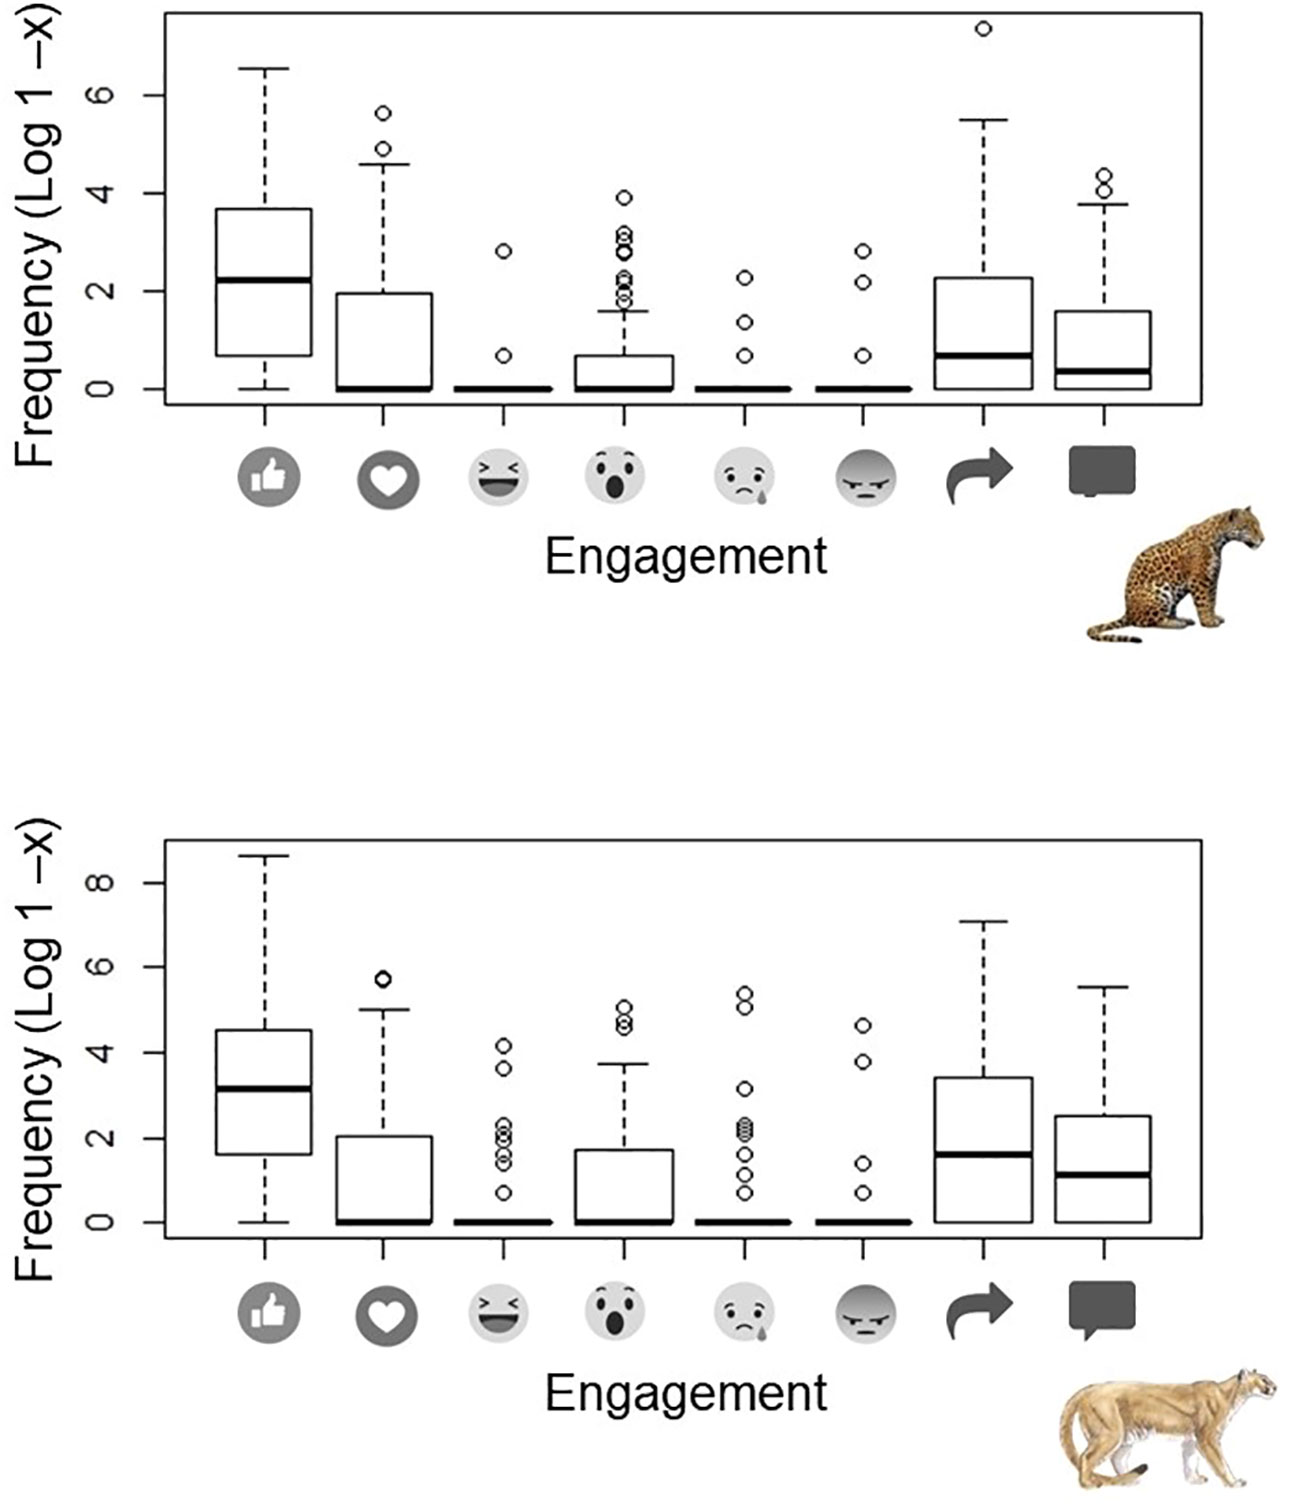
Figure 5 Complete set of engagement variables for Facebook, from left to right: like, love, fun, surprise (wow), cry, angry, share, and comments.
3.2 Social media overview metrics: Twitter
From two samples (1,000 posts each) corresponding to Twitter, analyzed per species, the two main categories found for jaguars were “Wildlife rescue, treatment, or release” (16.6%) and “Wildlife sightings or property trespassing outside protected areas” (16.9%) (Figures 6, 7). For pumas, the two main categories were “Wildlife rescue, treatment, or release” (22.9%) and “Wildlife depredation by direct or indirect means” (24.7%). Word rankings found in the Twitter database highlighted words in common for both species such as “offspring”, “park”, and “home”. We found words like “extinction” and “shot” for jaguars, and “highway”, “captured”, and “dies” for pumas. Moreover, the names of cities and also biomes appeared as important for both species. “Pantanal” was an important word for jaguars.
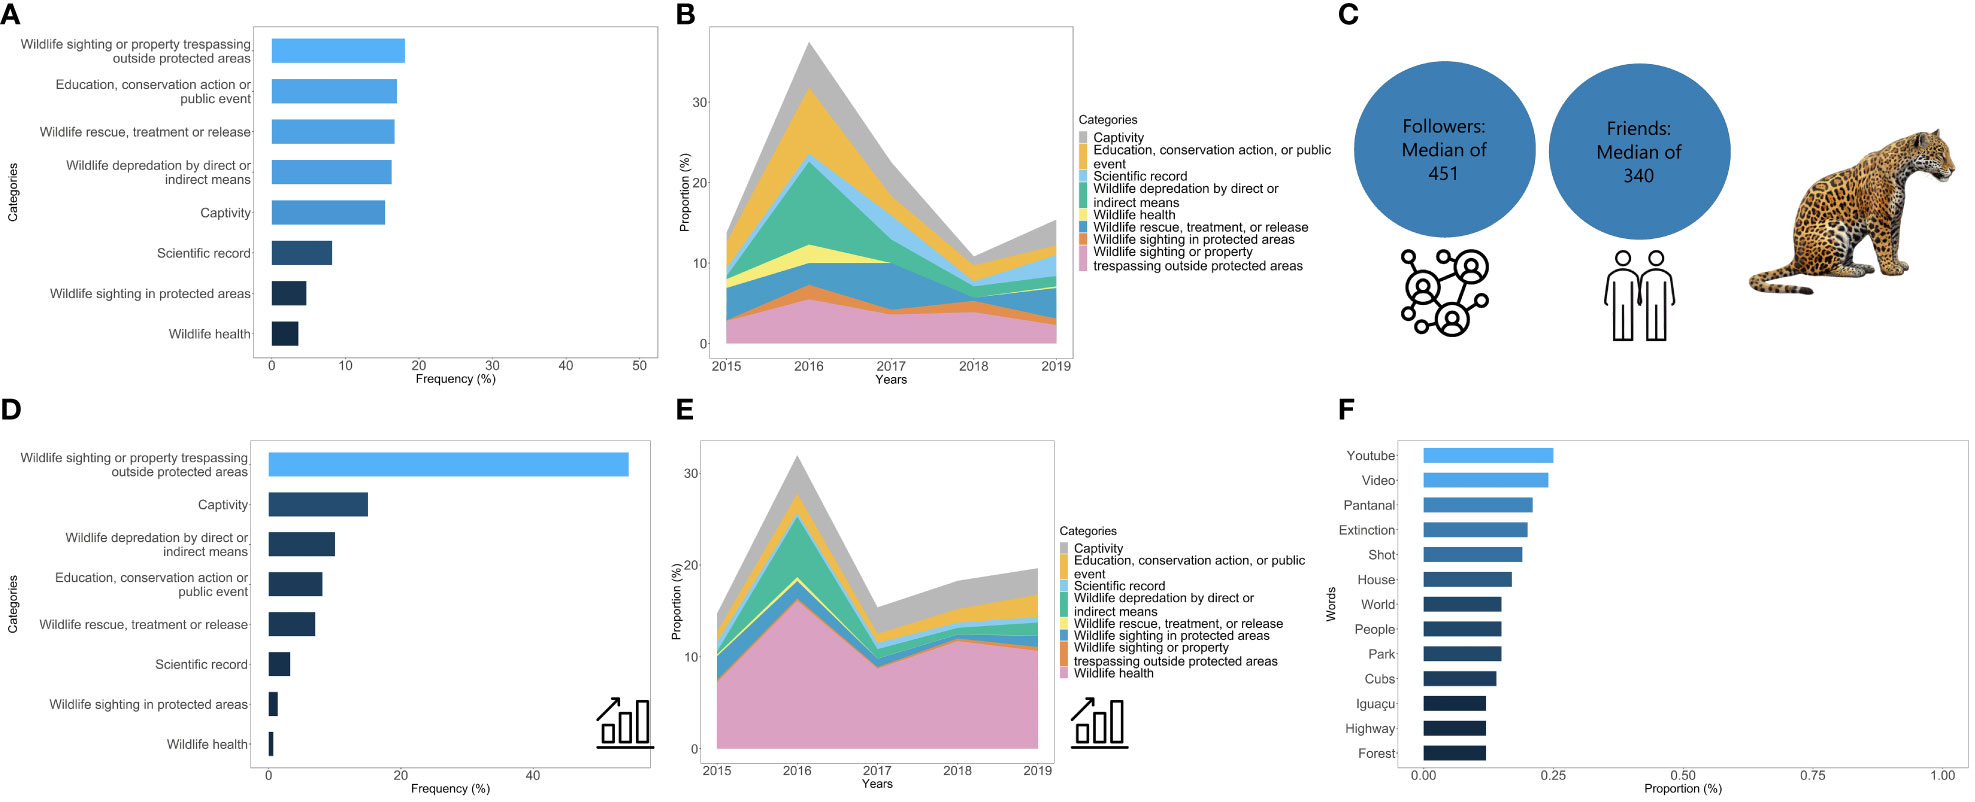
Figure 6 Twitter dashboard representing data synthesis for jaguars. The dashboard includes the proportion of posts by categories for each species in the sample (A) and predicted categories (B); proportion of prevalent words (C); timeline of categories in the sample (D) and the predicted categories for the entire database (E); types of users sharing the species content (F).
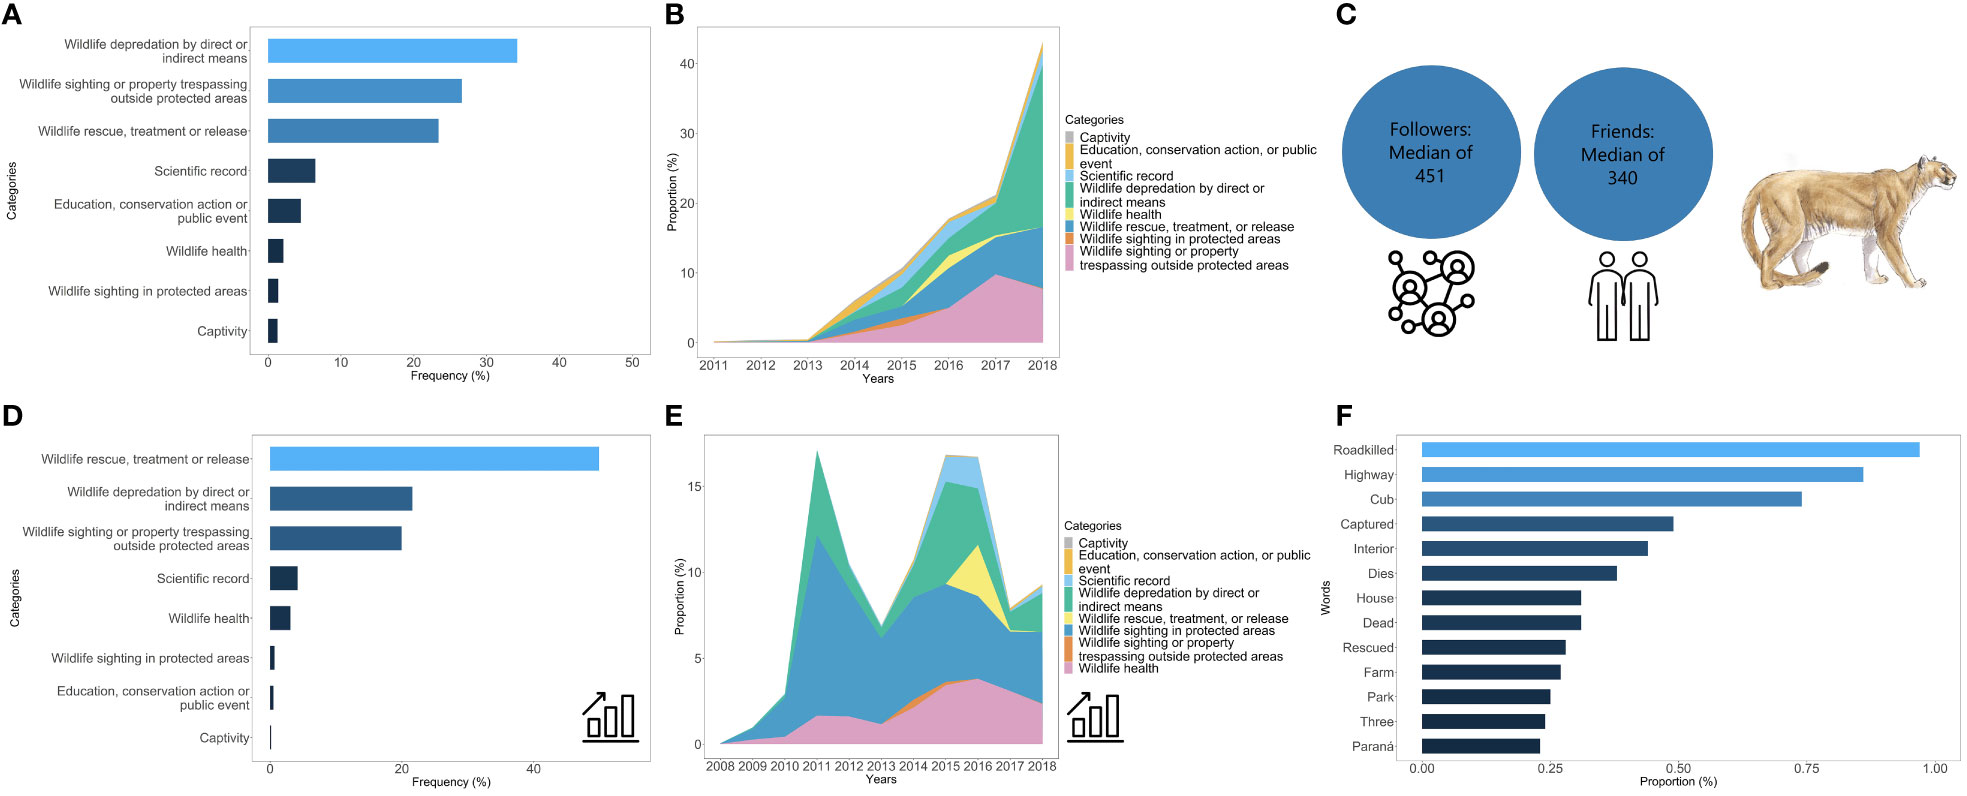
Figure 7 Twitter dashboard representing data synthesis for pumas. The dashboard includes the proportion of posts by categories for each species in the sample (A) and predicted categories (B); proportion of prevalent words (C); timeline of categories in the sample (D) and the predicted categories for the entire database (E); types of users sharing the species content (F).
In the case of the Twitter database, results included the predicted set of categories obtained from the most accurate algorithm results. For the jaguar database, the best accuracy in classification with validation from random sampling occurred with the SVM embedding LSA Topic algorithm (0.71). For the puma database, the best accuracy in classification with validation from random sampling occurred with the Naive Bayes embedding LSA algorithm (0.64). From predicted categories tested, we found that the two prominent categories for jaguars were “Captivity” (15.03%) and “Wildlife sightings or properties trespassing outside protected areas” (54.46%). For pumas, the two prominent categories were “Wildlife depredation by direct or indirect means” (21.58%) and “Wildlife rescue, treatment, or release” (49.89%).
In the timeline obtained for Twitter, we found a peak in posts starting at the end of May 2016, with a peak between June and July of the same year. The term “Juma,” referring to a jaguar shot dead during the Olympic Games, appears in the word database of Twitter posts, although it did not appear in the ranking with the most cited words. Nevertheless, several posts related to the species show little variation between October 2016 and June 2019. For pumas, the timeline had data from the last 10 years with three prominent peaks in posts between September and December 2011, August and September 2015, and July and August 2016. The absence of categorization in the database only allows for inferring the reasons for peaks due to the presence of words such as “city” and “roadkill”, which could be indicative of posts related to the sighting of pumas close to cities. Also, the 2016 peaks occurred a month after the case of the jaguar Juma.
Data distribution obtained for the variables that describe the profile of users for Twitter significant variation. For jaguars, the median value found for followers was 451 (with a maximum value of 1,044,712) and for friends a median of 340 (maximum value of 999,676). For pumas, we found a median value for followers of 627 (maximum value of 10,447,139), and for friends, a value of 329 (maximum value of 999,934).
Engagement variables for Twitter presented all medians with a value of 0, with significant variation in the data (Figure 8). For jaguars, the maximum values for shares was 3,359 and favorites/likes was 8,097, for pumas, the maximum value for shares was 500, and for favorites/likes was 2,865.
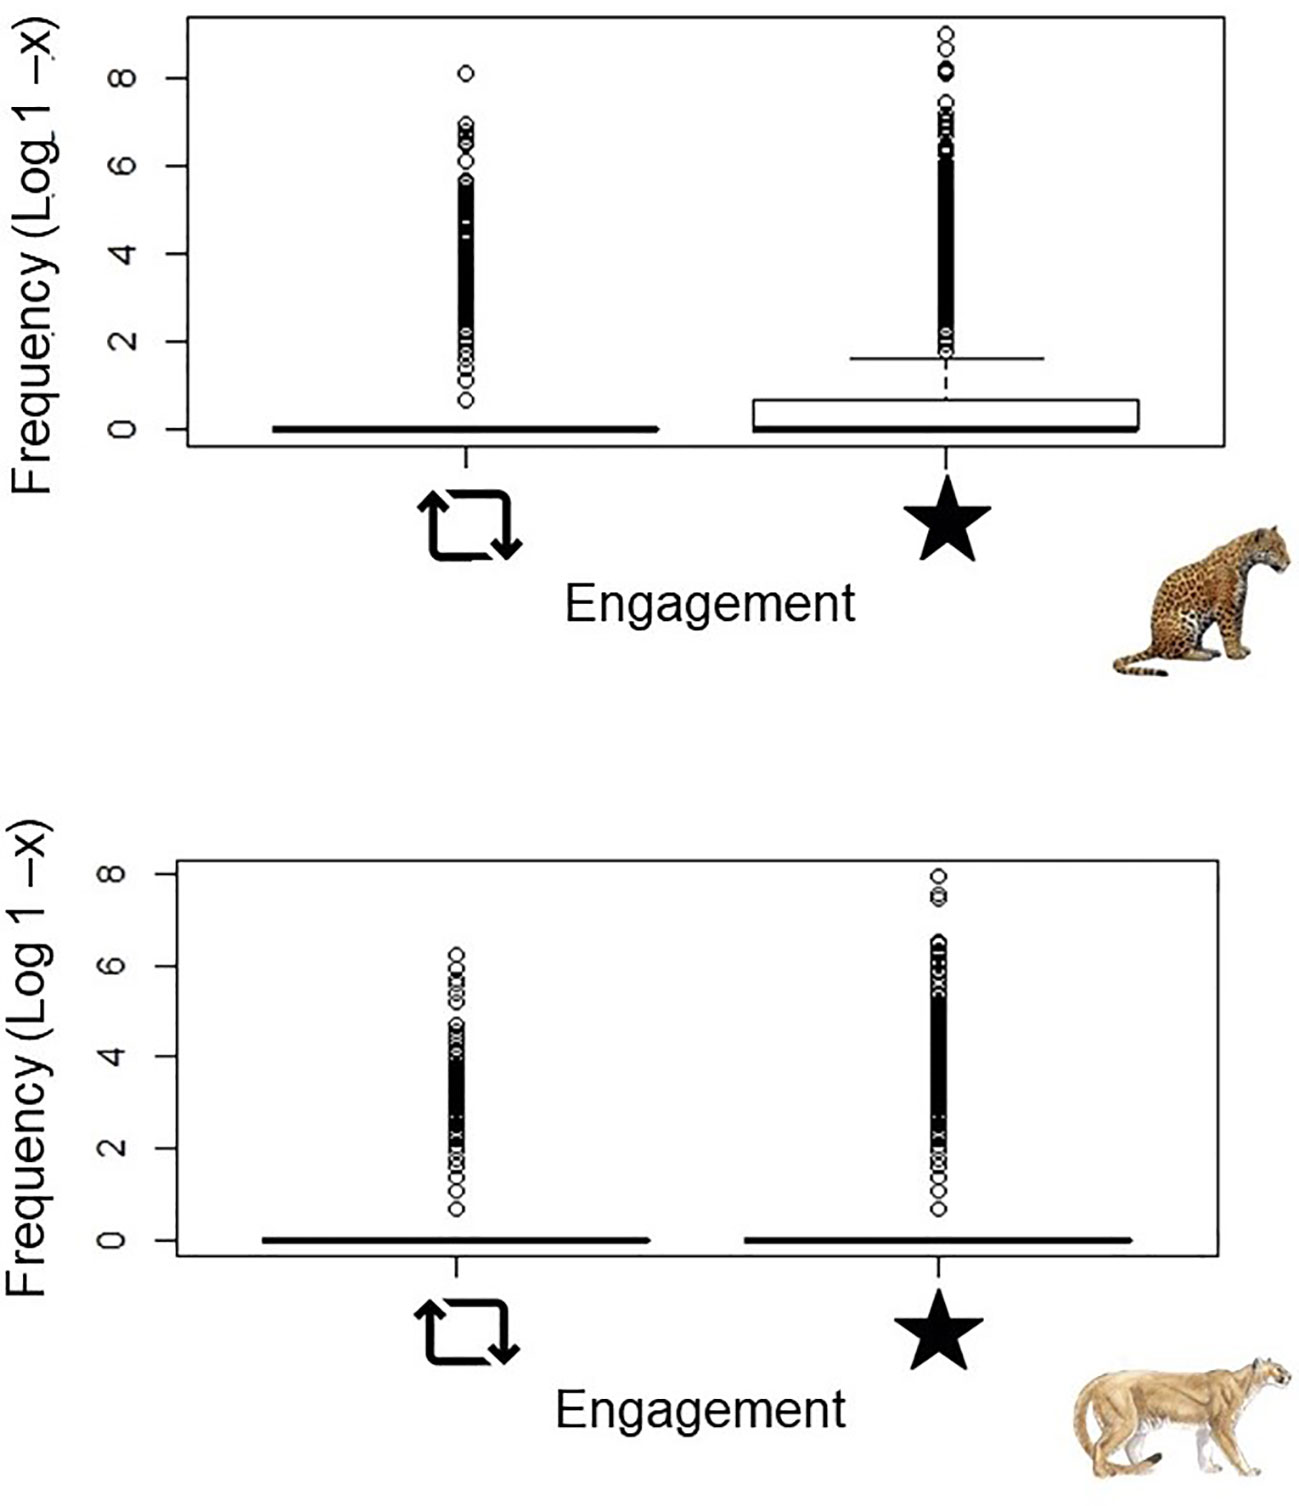
Figure 8 Complete set of engagement variables for Twitter, from left to right: share and friends/like.
3.3 Assessment of national plan for species
From our framework application, our most remarkable findings are related to the practical application of data to BNAP actions. We were able to identify 10 (Supplementary Material 1; 24.39%) actions established in the BNAP that would directly or indirectly benefit from our database. There were four defined actions corresponding to communication that could benefit directly from our data, those were (1) performing regional campaigns to promote poaching reports; (2) promoting the topic of conflicts with big felids in national and regional media; (3) developing and applying social marketing tools and valorization (intrinsic value) of big felids; (4) elaborating and implementing an education and communication program focused on improving population attitudes toward big felids, including strategies of conflict prevention. We found two direct applications related to distribution mapping and threat mapping: (5) updating the species occurrence database based on different sources of information; (6) mapping and publishing key areas of wildlife–vehicle collisions for big felids. Finally, we found four actions that could benefit indirectly from social media data: (7) investigating factors that determine the persecution of BNAP species; (8) consolidating information on poaching in places with projects linked to BNAP species; (9) developing a manifesto to increase law enforcement punishment for poaching big cats; (10) gathering and sharing experiences involving economic incentives, public and private, to reduce conflicts with big cats.
The analysis of the BNAP actions matrix (Table 3) revealed that most of the actions would benefit from at least one of our data dimensions: “what,” “when,” “who,” and “engagement”. Also, looking closely at each of the actions, it was possible to observe that social media content is important in the case of clear threats, such as poaching or wildlife–vehicle collisions. Despite a clear use in actions related to communication and education, results would give valuable information from occurrences to public manifestos. Results revealed implications for decision-making and human behavior initiatives for all actions selected.
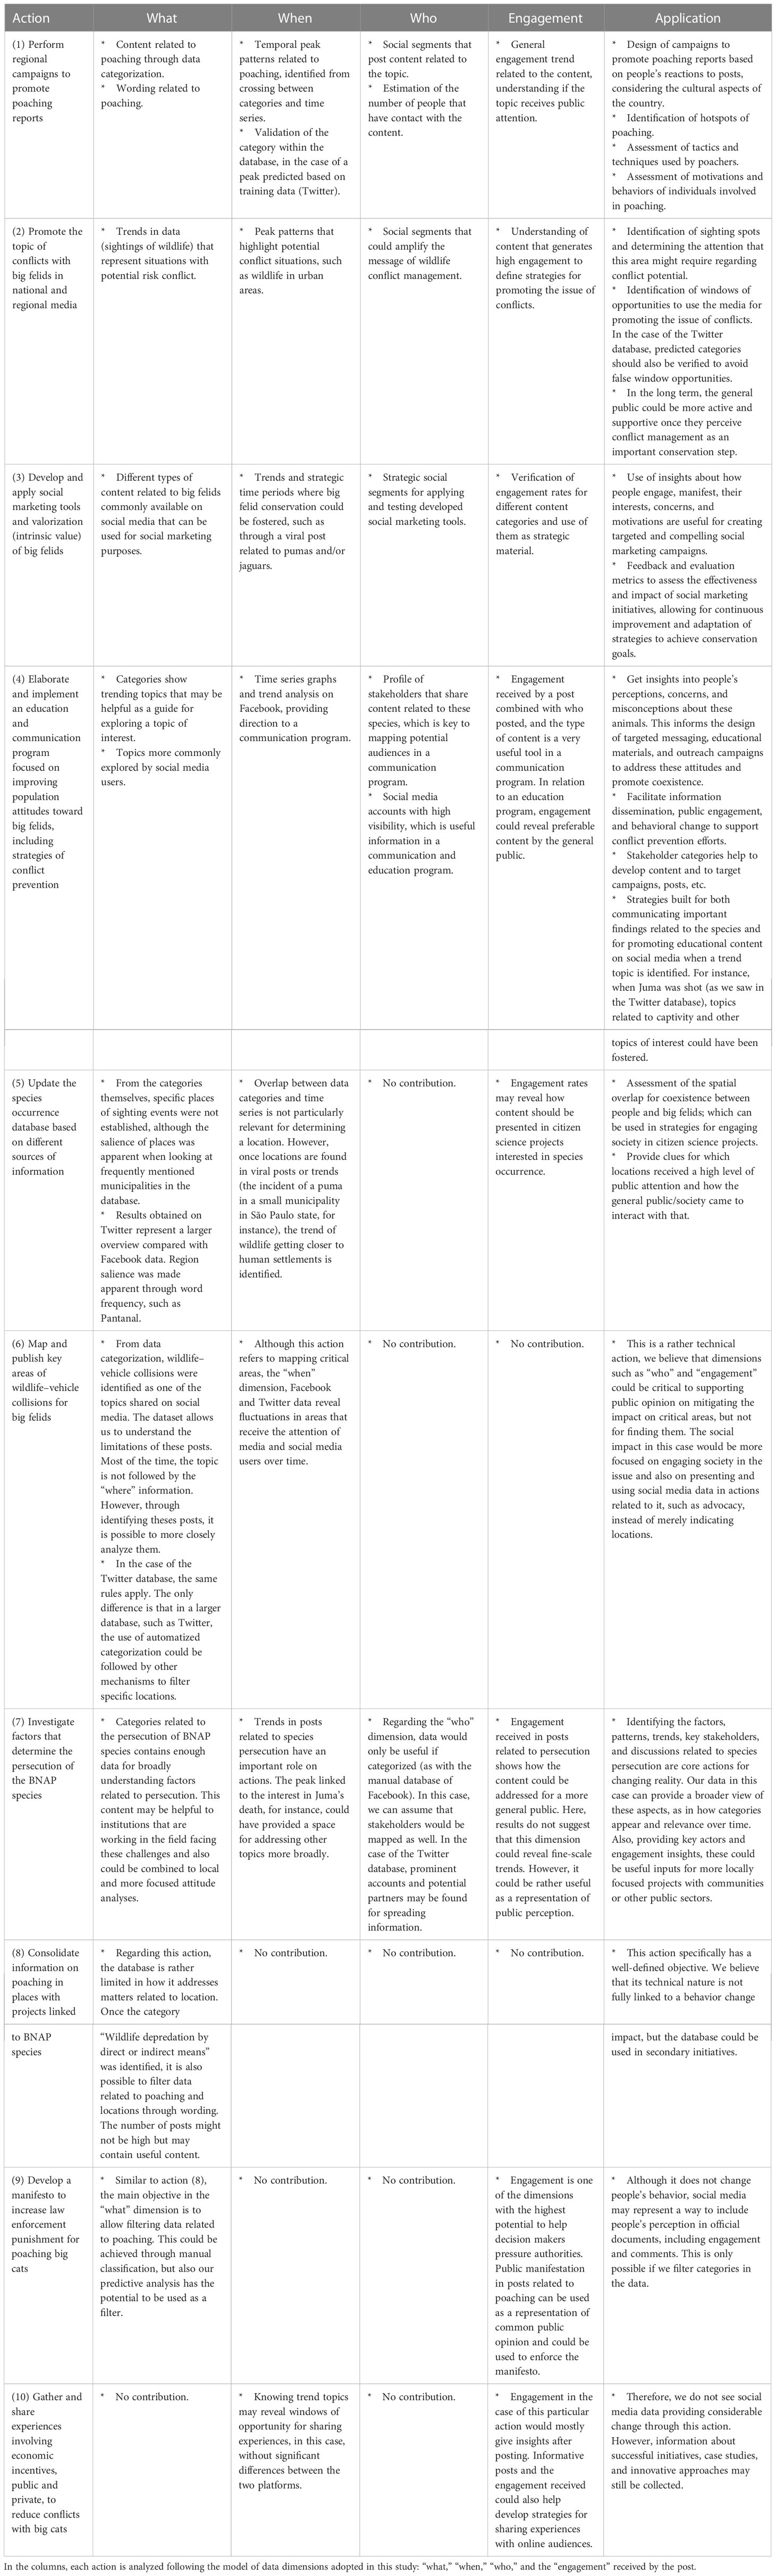
Table 3 Matrix including selected actions from the BNAP that could benefit from social media data.
4 Discussion
Examining social media through a framework may aid in decision-making. Species present particularities when represented in social media or within digital dimensions. However, the results overall demonstrated patterns that strategic planning should consider. Established goals for species conservation can be enhanced with the use of dashboards and social media data analysis. Our results also indicate that specialized technicians are needed for structuring and the data mining of small and large datasets. We were also able to identify the potential for automatic classification for faster analyses (Di Minin et al., 2015). Our results showed the need to identify patterns in small samples of data and then expand to larger ones.
When reviewing the data obtained, it is also important to consider how the species is represented in the digital dimension, as this may constitute an extension of the public perception of the same species (Ladle et al., 2016; Correia et al., 2021). Data in both social media platforms for the two species differ in the impact they have on people. While photos of jaguars in captivity may lead to a positive representation of the species, news of pumas in urban areas may increase fear and the mistrust people have of them. It is important to emphasize that, in this case, this information is relevant for most of the actions filtered in the BNAP.
Categorizing the data based on the “what” dimension revealed general trends that facilitated the understanding of other dimensions of the data, such as “when”. Furthermore, we found a trend when we considered the defined categories: the representation of real encounters with these species, for instance, wildlife sightings in protected areas and urban areas, and the online representation of these species, for instance, education initiatives and conservation actions. We trust that our findings confirm the potential use of social media to track trends of important conservation topics, as seen with established tools like Google Trends (Proulx et al., 2014). According to the BNAP matrix, most of the actions set out in the plan reiterate the need for strategies related to human–wildlife encounters and how to promote the image of the species in a more positive manner.
The dominant presence of the captivity category of jaguars, for instance, can be an indicator of the distance between people and an understanding of what big cats are. Most of the searches returned data related to Zoos, which highlights the importance of these institutions to people, creating a concept of iconic species even far from their habitat (Rose et al., 2018; Consorte-McCrea et al., 2019). We must, undoubtedly, consider the effect of the Facebook algorithm when showing a large number of posts related to the São Paulo Zoo. It is interesting that the category of wildlife sighting outside protected areas also appeared as a relevant category for the jaguar on Facebook and Twitter. We can attribute this to viral videos of the species near rural areas. The presence of the word Apiaí (rural municipality in southeastern São Paulo state) corroborates this finding. Another important point is the highlighting of words such as “cub,” which indicates the potential strategic use of charismatic aspects of the species during posting.
Regarding the puma, there is clear importance for the sighting of individuals outside protected areas or property trespassing and, on a smaller scale, wildlife rescue, treatment, or release. This trend corresponds strongly to what ecological studies have observed for the species, increasing proximity to human groups (Murphy and Macdonald, 2010; Miotto et al., 2014). In any case, the growth of related content to pumas in urban areas can generate fear and distrust, thus impeding coexistence, when this content is not linked to communication actions as presented in the BNAP, including fostering regional campaigns or education actions, can generate fear and distrust not contributing to coexistence.
Another point is that the overlapping of categories and temporal patterns has helped to clarify why certain events have a greater significance for a certain species over time. For instance, the two peaks found for the jaguar and the puma on both social media platforms were related to specific events where individuals were sighted in external areas, and these categories presented high relevance for both species. This is also confirmed by the word frequency result. In the case of the puma, in 2019, publications referred to a viral video that gained significant repercussions in a municipality in the state of Sao Paulo. Various actions in the BNAP matrix are linked to human–wildlife conflicts and reinforce the need to find better ways for communicating with a broader audience. Our findings show that social media platforms are key to the success of actions.
With respect to Twitter data in particular, where we have done an automated classification for categories, we obtained some interesting information even though the algorithms are not very accurate in their predictions. When we look at the jaguar data, for example, we see the considerable effect of the death of a local jaguar named Juma, just before the beginning of the 2016 Olympics. This same peak does not appear in results from Google Trends. Moreover, we can compare the effect to a similar one observed in the repercussions of the death of the lion Cecil (Macdonald et al., 2016), although on a national scale. The time peaks for pumas are less pronounced and more consistent once again, mainly related to the proximities of the species with human settlements. Here, we have highlighted what we have outlined in the action matrix. In most cases, social media trends reveal windows of opportunity for optimizing actions.
Considering the “who” dimension of data, we can draw a pattern that divides this group into personal pages and segment pages. In the first case, it is interesting to observe the weight that personal pages presented in sharing species-related content. Social media have changed the manner society is shaped and how we communicate with each other. Thus, when we observe that people are largely responsible for posts related to wildlife, we can determine its potential as we draw a parallel to people sharing content from their personal accounts in social movements (Kidd and McIntosh, 2016). Moreover, the manifestation of society through comments also provides important evidence to prosecute authorities and stakeholders responsible for threatening biodiversity. In this case, a considerable number of actions benefit from knowing a target audience.
The presence of pages from government institutions and agencies in the data is also a relevant outcome. In many cases, public contact with wildlife is only through social and online media. We see this in examples, such as trafficked wildlife species (Di Minin et al., 2018), species exploited as pets, and the viral videos related to them (Nekaris et al., 2013), where warnings are created by conservation institutions and, ultimately, by users who demonstrate empathic behavior toward the species. These data help identify potential stakeholders in the conservation of these species (Knight et al., 2006; Di Minin et al., 2015). This analysis could help us determine user motivations and better classify user segments.
Unexpected stakeholders, such as entertainment and business pages, may play an important role in engagement. Often, these pages are responsible for sharing videos with compelling wildlife content, which also distributes information, reaching an audience that is not always interested in conservation. Finally, news pages were important for many species and are one of the main vehicles to communicate wildlife-related events. News can influence public perception of species over time (Killion et al., 2019), or at the announcement of a scientific discovery, as in the category of scientific records for the puma. In this specific case, the identification of stakeholders that reach different segments was also an important finding that would contribute to the BNAP’s actions.
The learning process between Facebook and Twitter databases was a novelty and also proved to be a promising possibility for applied conservation. Moreover, as social media develops, an increasing number of studies reveal that data processing technology is the future for mining information and consequently for contributing to species conservation (Ladle et al., 2017; Ghermandi et al., 2022). In our results, it is relevant to consider that the accuracy of predicting categories in data is still an analysis that needs improvement. However, in the future, automated analysis combined with small-scale detailed analysis could make the importance of categories in social media a way of monitoring public opinion about species. This could be really useful in the case of actions that need supporting data related to direct threats to BNAP species, such as poaching, species persecution, and wildlife–vehicle collisions. Automated mechanisms for data visualization can be a powerful tool for identifying content of interest.
Even in a simpler analysis, we can benefit from looking at word frequency classifications. Words related to roadkill and wildlife sightings outside protected areas or near human settlements show that these categories possibly have high relevance in the database. We also noticed that the same words are relevant on both a state (São Paulo state; Facebook database) and national level (Brazil; Twitter database). Furthermore, in the Twitter database, the word “Pantanal” is signficant for jaguars, revealing how a biome can be intrinsically linked to a species, possibly due to species distribution and contact with human populations (Cavalcanti et al., 2012; Marchini and Macdonald, 2012). The absence of mention or location of events in remote areas reported in posts limited the use of the database. The words related to road mortality and wildlife sightings outside protected areas or near human settlements show that these categories are very relevant to the database.
Given the Twitter database, the influence of users on the dissemination of information is a key factor. Moreover, in the Twitter database, we obtained the number of friends and the number of followers of users. In a social media platform with a smaller reach in Brazil, the power that user profiles possess in disseminating important data for wildlife conservation is extremely relevant (Anger and Kittl, 2011). The variation in data shows that there is no pattern in user profiles’ friends or followers, but being able to identify the outliers as conservation targets might be beneficial to for communication strategies, especially in the case of BNAP.
With respect to the findings related to public engagement in content, we had a broad characterization of how people react to wildlife-related content. Additionally, engagement has proven to be an important variable that can provide insight into human behavior and the human dimensions of wildlife in a digital context. The results of the overall engagement indicate the iconic presence of these species in the culture (Wang and Liu, 2019). Furthermore, online engagement reveals which categories of information have a greater impact on the population, considering the representation of different audiences on social media platforms. For example, for jaguars, we observed a pattern of positive engagement (positive reactions on Facebook), and even with low medians on Twitter, we found outliers with high values of positive engagement and sharing. The values indicate that people are positively engaged concerning jaguar-related topics. The same pattern is observed for the puma, where surprise responses (wow) are also shown. In addition, the puma generated the highest number of reactions on Facebook. However, on Twitter, the puma and the jaguar received very similar engagement values. Although there is no specific literature related to engagement and wildlife in social media, we can rely on marketing concepts and on how information is related to public engagement (Stephen et al., 2015). These results are also powerful indicators for analysis application. Engagement can serve to improve communication with the target audience of conservation projects and amplify positive outcomes.
This study gives us fundamental results on how social media can present insights into applied conservation. However, disadvantages related to Brazil and other South American countries must be taken into account, such as limited access to the Internet in biodiversity-rich areas. Moreover, it is still not possible to compare Brazil’s data coverage with high-income countries. We are often incapable of obtaining data on social media from people coexisting with endangered species. These people, in many cases, are the target groups of plans like the BNAP. However, technology development is gradually allowing access to an expanded set of data, which could include these stakeholders in the future. In addition, the use of social media data to infer public interest calls for particular attention when discussing and generating generalizations (Correia et al., 2019). There are still limitations to the method. Access to information is not always available, and companies that authorize the use of data by science, like Twitter, do not always have the same strength and public reach. Furthermore, the fact that we are still moving toward a comprehensive methodology, despite considerable progress (Correia et al., 2021; Wartmann et al., 2021), makes comparison of results challenging.
Regarding the application of our findings to the BNAP, the impact of this study lies in the use of digital data in the conservation planning process. For example, the measures reviewed in this study do not directly mention social media, although we found that their use has great potential. Many of the actions would benefit from clear applications of data categorization, filtering of time-related opportunity windows, and the identification of target stakeholder groups and content based on engagement. This general pattern of use is replicated across most actions. We should highlight that, based on the BNAP, actions related to the extent of conflicts and coexistence with big felids are particularly important.
Our studies, combined with other findings, show a pressing need to start using social media data in decision-making. Furthermore, the communication of results and sharing of experiences can improve usage and reveal other potential applications. Communication strategies for advanced social media analytics should also be considered. Analyzing business gaps in social media is a very practical example, which involves in-depth research of a target (e.g., a species) to determine audience preferences for the target. Exploring trends may permit defining adequate audiences and lead to engaging people. Likewise, if we want action results to be amplified, we can represent species with significant local importance based on characteristics related to the success of iconic species posts. In addition, the development of systems for real-time monitoring of public opinion may also collaborate with the effectiveness of actions. The organized use of these tools is already a reality for several sectors and can benefit wildlife conservation.
Data availability statement
The raw data supporting the conclusions of this article will be made available by the authors, without undue reservation.
Author contributions
YGGR conceived and designed the experiments, performed the experiments, analyzed the data, prepared figures and/or tables, authored or reviewed drafts of the paper, and approved the final draft. RMB, BOS, SM, RBM, and KMPMBF performed the experiments, authored or reviewed drafts of the paper, and approved the final draft. PLPC, RLAdR, and AMdS authored or reviewed drafts of the paper and approved the final draft. MLC contributed to the methodology, formal analysis, validation, and writing—review and editing. All authors contributed to the article and approved the submitted version.
Funding
YGGR was funded by the Coordenação de Aperfeiçoamento de Pessoal de Nível Superior (CAPES). KMPMBF was funded by research grant (303940/2021-2) from the Conselho Nacional de Pesquisa e Desenvolvimento Científico e Tecnológico (CNPq). SM was funded by Chester Zoo. The publication was financially supported by the Electrical Engineering Graduate Program (PPGE) and the Forest Resources Graduate Program, both from the University of São Paulo.
Acknowledgments
We would like to thank all the researchers that collaborated through discussions and ideas for this paper, especially Alex Bovo, Audrey Brisseau and many others. We would like to thank Henrique Monteiro for his professional advising on making the figures.
Conflict of interest
The authors declare that the research was conducted in the absence of any commercial or financial relationships that could be construed as a potential conflict of interest.
Publisher’s note
All claims expressed in this article are solely those of the authors and do not necessarily represent those of their affiliated organizations, or those of the publisher, the editors and the reviewers. Any product that may be evaluated in this article, or claim that may be made by its manufacturer, is not guaranteed or endorsed by the publisher.
Supplementary material
The Supplementary Material for this article can be found online at: https://www.frontiersin.org/articles/10.3389/fcosc.2023.1101531/full#supplementary-material
References
Anger I., Kittl C. (2011). “Measuring influence on Twitter,” in Presented at the Proceedings of the 11th International Conference on Knowledge Management and Knowledge Technologies. 1–4. doi: 10.1145/2024288.2024326
Byers O., Copsey J., Lees C., Miller P., Traylor-Holzer K. (2022). Reversing the decline in threatened species through effective conservation planning. Diversity 14, 754. doi: 10.3390/d14090754
Campbell H., Engelbrecht I. (2018). The Baboon Spider Atlas—using citizen science and the “fear factor” to map baboon spider (Araneae: Theraphosidae) diversity and distributions in Southern Africa. Insect Conserv. Diversity 11, 143–151. doi: 10.1111/icad.12278
Cavalcanti S. M., Azevedo F., Tomás W. M., Boulhosa R. L., Crawshaw P. G. Jr. (2012). The status of the jaguar in the Pantanal. Cat News 7, 29–34.
Consorte-McCrea A., Fernandez A., Bainbridge A., Moss A., Prévot A.-C., Clayton S., et al. (2019). Large carnivores and zoos as catalysts for engaging the public in the protection of biodiversity. Nature Conservation. doi: 10.3897/natureconservation.37.39501
Correia R. A., Di Minin E., Jarić I., Jepson P., Ladle R., Mittermeier J., et al. (2019). Inferring public interest from search engine data requires caution. Front. Ecol. Environ. 17. doi: 10.1002/fee.2048
Correia R. A., Ladle R., Jarić I., Malhado A. C., Mittermeier J. C., Roll U., et al. (2021). Digital data sources and methods for conservation culturomics. Conserv. Biol. 35, 398–411. doi: 10.1111/cobi.13706
Di Minin E., Fink C., Tenkanen H., Hiippala T. (2018). Machine learning for tracking illegal wildlife trade on social media. Nat. Ecol. Evol. 2, 406–407. doi: 10.1038/s41559-018-0466-x
Di Minin E., Tenkanen H., Toivonen T. (2015). Prospects and challenges for social media data in conservation science. Front. Environ. Sci. 3, 63doi: 10.3389/fenvs.2015.00063
ElQadi M. M., Dorin A., Dyer A., Burd M., Bukovac Z., Shrestha M. (2017). Mapping species distributions with social media geo-tagged images: Case studies of bees and flowering plants in Australia. Ecol. Inf. 39, 23–31. doi: 10.1016/j.ecoinf.2017.02.006
Ghermandi A., Depietri Y., Sinclair M. (2022). In the AI of the beholder: A comparative analysis of computer vision-assisted characterizations of human–nature interactions in urban green spaces. Landscape Urban Plann. 217, 104261. doi: 10.1016/j.landurbplan.2021.104261
IBGE (2022). Access to the internet and ownership of mobile phones for personal use (Rio de Janeiro: IBGE: Pesquisa Nacional por Amostra de Domicílios).
Jussila J. J., Kärkkäinen H., Aramo-Immonen H. (2014). Social media utilization in business-to-business relationships of technology industry firms. Comput. Hum. Behav. 30, 606–613. doi: 10.1016/j.chb.2013.07.047
Kidd D., McIntosh K. (2016). Social media and social movements. Sociology Compass 10, 785–794. doi: 10.1111/soc4.12399
Killion A. K., Melvin T., Lindquist E., Carter N. H. (2019). Tracking a half century of media reporting on gray wolves. Conserv. Biol. 33, 645–654. doi: 10.1111/cobi.13225
Knight A. T., Cowling R. M., Campbell B. M. (2006). An operational model for implementing conservation action. Conserv. Biol. 20, 408–419. doi: 10.1111/j.1523-1739.2006.00305.x
Ladle R. J., Correia R. A., Do Y., Joo G., Malhado A. C., Proulx R., et al. (2016). Conservation culturomics. Front. Ecol. Environ. 14, 269–275. doi: 10.1002/fee.1260
Ladle R. J., Jepson P., Correia R. A., Malhado A. C. (2017). The power and the promise of culturomics. Front. Ecol. Environ. 15, 290–291. doi: 10.1002/fee.1506
Lenzi C., SpeIran S., Grasso C. (2020). “Let me take a selfie”: implications of social media for public perceptions of wild animals. Soc Anim. 31, 64–83. doi: 10.1163/15685306-BJA10023
Macdonald D. W., Jacobsen K. S., Burnham D., Johnson P. J., Loveridge A. J. (2016). Cecil: A moment or a movement? Analysis of media coverage of the death of a lion, Panthera leo. Animals 6, 26. doi: 10.3390/ani6050026
Marchini S., Macdonald D. W. (2012). Predicting ranchers’ intention to kill jaguars: case studies in Amazonia and Pantanal. Biol. Conserv. 147, 213–221. doi: 10.1016/j.biocon.2012.01.002
Maxwell J. A. (2012). Qualitative research design: An interactive approach (Thousand Oaks, CA: Sage).
Miotto R. A., Cervini M., Kajin M., Begotti R. A., Galetti P. M. (2014). Estimating puma Puma concolor population size in a human-disturbed landscape in Brazil, using DNA mark–recapture data. Oryx 48, 250–257. doi: 10.1017/S0030605312000841
Murphy T., Macdonald D. W. (2010). Pumas and people: lessons in the landscape of tolerance from a widely distributed felid. Macdonald DW, 431–451.
Nekaris B.K.A.-I., Campbell N., Coggins T. G., Rode E. J., Nijman V. (2013). Tickled to death: Analysing public perceptions of “cute” videos of threatened species (slow lorises—Nycticebus spp.) on Web 2.0 sites. PloS One 8, e69215. doi: 10.1371/journal.pone.0069215
Nghiem L. T., Papworth S. K., Lim F. K., Carrasco L. R. (2016). Analysis of the capacity of Google Trends to measure interest in conservation topics and the role of online news. PloS One 11, e0152802. doi: 10.1371/journal.pone.0152802
Ogura A. P., da Silva A. C., Castro G. B., Espíndola E. L. G., Da Silva A. L. (2022). An overview of the sugarcane expansion in the state of São Paulo (Brazil) over the last two decades and its environmental impacts. Sustain. Production Consumption. 32, 66–75. doi: 10.1016/j.spc.2022.04.010
Papworth S. K., Nghiem T. P. L., Chimalakonda D., Posa M. R. C., Wijedasa L. S., Bickford D., et al. (2015). Quantifying the role of online news in linking conservation research to Facebook and Twitter. Conserv. Biol. 29, 825–833. doi: 10.1111/cobi.12455
Pereira K. F., Young R. J., Boere V., Silva I. D. O. E. (2018). Urban sloths: Public knowledge, opinions, and interactions. Animals 8, 90. doi: 10.3390/ani8060090
Proulx R., Massicotte P., Pepino M. (2014). Googling trends in conservation biology. Conserv. Biol. 28, 44–51. doi: 10.1111/cobi.12131
R Core Team (2017). R: A language and environment for statistical computing (Vienna: R Foundation for Statistical Computing).
Richards D. R., Friess D. A. (2015). A rapid indicator of cultural ecosystem service usage at a fine spatial scale: Content analysis of social media photographs. Ecol. Indic. 53, 187–195. doi: 10.1016/j.ecolind.2015.01.034
Rose P. E., Hunt K. A., Riley L. M. (2018). Animals in an online world; an evaluation of how zoological collections use social media: Social media in zoos. J. Zoo Aquarium Res. 6, 57–62.
Ruas P. H. B., MaChado A. D., Silva M. C., Meireles M. R., Cardoso A. M. P., Zárate L. E., et al. (2019). Identification and characterization of Facebook user profiles considering interaction aspects. Behav. Inf. Technol. 38, 858–872. doi: 10.1080/0144929X.2019.1566498
Sajid S. (2016). Social media and its role in marketing. Business and Economics Journal. 7 (1), 1–5. doi: 10.4172/2151-6219.100020
Schäfer S. (2020). The illusion of knowledge through Facebook news? Effects of snack news in a news feed on perceived knowledge, attitude strength, and willingness for discussions. Comput. Hum. Behav. 103, 1–12. doi: 10.1016/j.chb.2019.08.031
Spalding M., Burke L., Wood S. A., Ashpole J., Hutchison J., Zu Ermgassen P. (2017). Mapping the global value and distribution of coral reef tourism. Mar. Policy 82, 104–113. doi: 10.1016/j.marpol.2017.05.014
Sparovek G., Berndes G., Klug I. L. F., Barretto A. G. O. P. (2010). Brazilian agriculture and environmental legislation: Status and future challenges. Environ. Sci. Technol. 44, 6046–6053. doi: 10.1021/es1007824
Stephen A. T., Sciandra M., Inman J. (2015). “Is it what you say or how you say it?” in How content characteristics affect consumer engagement with brands on Facebook. Saïd Business School WP 19.
Toivonen T., Heikinheimo V., Fink C., Hausmann A., Hiippala T., Järv O., et al. (2019). Social media data for conservation science: A methodological overview. Biol. Conserv. 233, 298–315. doi: 10.1016/j.biocon.2019.01.023
Väisänen T., Heikinheimo V., Hiippala T., Toivonen T. (2021). Exploring human–nature interactions in national parks with social media photographs and computer vision. Conserv. Biol. 35, 424–436. doi: 10.1111/cobi.13704
Wang X., Liu Z. (2019). Online engagement in social media: A cross-cultural comparison. Comput. Hum. Behav. 97, 137–150. doi: 10.1016/j.chb.2019.03.014
Wartmann F. M., Baer M. F., Hegetschweiler K., Fischer C., Hunziker M., Purves R. S. (2021). Assessing the potential of social media for estimating recreational use of urban and peri-urban forests. Urban Forestry Urban Greening 64, 127261. doi: 10.1016/j.ufug.2021.127261
Keywords: species action plans, social media, Facebook, Twitter, wildlife conservation, jaguar, puma
Citation: Ribeiro YGG, Bastos RM, Silva BO, Marchini S, Morais RB, Catapani ML, Corrêa PLP, da Rocha RLA, da Silva AM and Ferraz KMPMB (2023) Social media data from two iconic Neotropical big cats: can this translate to action? Front. Conserv. Sci. 4:1101531. doi: 10.3389/fcosc.2023.1101531
Received: 17 November 2022; Accepted: 27 July 2023;
Published: 13 November 2023.
Edited by:
Ewan Macdonald, University of Oxford, United KingdomReviewed by:
Laura Perry, Indianapolis Zoo, United StatesFikirte Gebresenbet, University of New Hampshire, United States
Copyright © 2023 Ribeiro, Bastos, Silva, Marchini, Morais, Catapani, Corrêa, da Rocha, da Silva and Ferraz. This is an open-access article distributed under the terms of the Creative Commons Attribution License (CC BY). The use, distribution or reproduction in other forums is permitted, provided the original author(s) and the copyright owner(s) are credited and that the original publication in this journal is cited, in accordance with accepted academic practice. No use, distribution or reproduction is permitted which does not comply with these terms.
*Correspondence: Yuri Geraldo Gomes Ribeiro, eXVyaS5nZ3JpYmVpcm9AZ21haWwuY29t