 Wonga Masiza
 Hamisai Hamandawana2
 Johannes George Chirima
- 1Geoinformation Science Division, Natural Resources and Engineering, Agricultural Research Council, Pretoria, South Africa
- 2Afromontane Research Unit & Risk Vulnerability Centre, University of Free State, Phuthaditjhaba, South Africa
- 3Centre for Geoinformation Science, Department of Geography, Geoinformatics and Meteorology, University of Pretoria, Pretoria, South Africa
There is limited knowledge on how people living in communal areas perceive land use and land cover (LULC) change and the impacts it has on sustainable access to essential ecosystem goods and services. This study used seven wet season Landsat images covering 1989 to 2019 and the Extreme Gradient Boosting algorithm to map LULC in Tyhume Valley, South Africa. Analyses of trends in LULC and long-term changes in rainfall over the same period were based on the Mann Kendall (MK) statistical technique. Perceptions on the causes and impacts of the observed trends were solicited from 102 respondents and summarized through frequency analysis. Major trends that emerged from image-based analysis include the expansion of Vachellia karroo by 25% (τ = 0.98; p = 0.004), decrease in pastureland by 18% (τ = –0.90, p = 0.007), decrease in cropland by 9.6% (τ = –0.90, p = 0.007), decrease in surface water by 1.1% (-0.90, p = 0.007), and increase in built-up area by 2.5% (τ = 1.00, p = 0.003). Perceived causes of these trends include the eradication of land access control systems, poor management of surface water, lack of farmer support programs, and 14 years of negative rainfall anomalies. The impacts of these changes include long-distance trekking of animals to pastures and watering points, increased livestock malnutrition and mortality, decline of medicinal and culturally significant trees, increased purchasing of stock feed, increased unemployment, and consumption of unhealthy food. The study concludes by highlighting the need to accommodate local perceptions in the formulation of policies and practices for sustainable use of ecosystem services.
1 Introduction
Communal lands provide several ecosystem goods and services to rural communities. These goods and services include water, fuelwood, timber for construction purposes, shelter, land for agriculture, and cultural amenities (Brevik, 2019; Mowat and Rhodes, 2020; Abd Elbasit et al., 2021). They also support outdoor recreation, sustenance of biodiversity and vital services such as carbon sequestration that are valuable for the proper functioning of society’s life-supporting systems (Lund, 2007). In sub-Saharan Africa, communal lands occur in savanna rangelands that are punctuated by open grasslands and sparsely distributed trees and shrubs, with mixed farming being the primary land use (Kiage, 2013). Despite the ecosystem goods and services that these communal lands provide, they are vulnerable to land degradation (Hoffman and Todd, 2000; Kotzé et al., 2013; Sandhage-Hofmann et al., 2015). Although the causes and impacts of their vulnerability and degradation are not entirely understood, key amongst hypothetical drivers are (1) poor soils (Mokgakane et al., 2021), (2) unsustainable land use practices (Mbow, 2020), (3) inappropriate conservation strategies which disregard local perceptions when designing remedial programs, (3) inadequate land tenure arrangements (Meadows and Hoffman, 2002), (5) exploitive demands of increasing human populations (Scogings et al., 1999), and (6) extreme weather events that include persistent occurrence of prolonged droughts (Gautier et al., 2016; Gebremeskel et al., 2019).
Land use and land cover (LULC) change in combination with climate change compromise the ability of these ecosystems to sustainably support resource-poor communities, particularly in the Global South. In this study, we define land use change as a process in which human activities transform the natural landscape into alternative states (Paul and Rashid, 2017) and land cover change as the spatial and temporal variations in the distributions of different land cover types (Briassoulis, 2019). LULC changes are often accentuated by rapid population growth and increased population pressure (Giannecchini et al., 2007; Herrmann et al., 2020; Bufebo and Elias, 2021). They are also accompanied by persistent degradation of the environment through soil erosion (Ighodaro et al., 2013; Wolka et al., 2018), bush encroachment (Manjoro et al., 2012; Wonga et al., 2021; Munyati et al., 2011), expansion of alien plants and loss of biodiversity (Jewitt et al., 2015; O’Connor and van Wilgen, 2020) and overgrazing (Mani et al., 2021). It is, however, unclear whether some of these factors, for example bush encroachment and abandonment of arable land, are really indicators of land degradation (Eldridge et al., 2011; Hering et al., 2019).
Although this lack of clarity is being highlighted and researched, there is still limited knowledge and acknowledgement of how the inhabitants of communal areas perceive LULC change and the impact it has on sustainable access to essential ecosystem goods and services. Consequently, it remains unclear of what constitutes land degradation (von Maltitz et al., 2019), which explains why there is conspicuous absence of sound frameworks to guide policy formulation and the implementation of actionable adaptation strategies. In attempting to bridge this gap, recent studies suggest that LULC change be viewed from the perspective of the ecosystem goods and services that communities accrue from communal lands (Palmer and Bennett, 2013; Willemen et al., 2018; Sharafatmandrad and Mashizi, 2021; Kuule et al., 2022). This reasoning is informed by a scientifically premised realization of the fact that spatial and temporal variations in the distributions of the critical LULC types have far-reaching adverse impacts on sustainable access to ecosystem services and livelihoods of local communities.
This is supported by a recent global review study by Hasan et al. (2020), which reports negative impacts of LULC change on ecosystem services. Examples of these come from China where provisioning ecosystem services like agriculture and water supply are impaired by urban development, afforestation and temperature changes (Song and Deng, 2017; Hasan et al., 2020; Wang et al., 2020). In Ethiopia, ecosystem service values provided by grassland, forest, and shrubland, declined due to the expansion of cropland, which was associated with human population growth and increasing demands for food (Belay et al., 2022). In Iran, change in plant compositions resulted in the decline of forage and medicinal plants (Sharafatmandrad and Mashizi, 2021). In Uganda, grasslands were overtaken by cropland and built-up area, while tree loss was reportedly associated with land privatization, land clearing, and fuelwood extraction (Kuule et al., 2022). Causes and impacts of LULC change and availability of ecosystem services are spatially variable. To our knowledge, this study is one of the first in South Africa that combines remote sensing and local perceptions to holistically investigate the extent and causes of LULC change and the impact this change has on ecosystem services derived from communally-owned lands.
Previous studies in South Africa mapped LULC change and investigated drivers of land degradation by combining remote sensing with the perceptions of traditional leaders, environmental experts, and agricultural officials (Kgaphola et al., 2023; Musetsho et al., 2021; Chalmers and Fabricius, 2007). Other studies combined remote sensing and local perceptions to investigate specific or isolated LULC change phenomena such as bush encroachment and abandonment of cropland (Wigley et al., 2009; Blair et al., 2018). In this study, we focused on the LULC types that are associated with the essential ecosystem goods and services that the community derives from the study area. In addition, instead of relying on experts, leaders, and group perceptions, we used frequency analysis as a descriptive statistic to highlight the most common perceptions among the community members.
To understand how communal LULC change is perceived, this study (1) assessed whether remotely sensed LULC trends corresponded with those perceived by the local community, (2) interrogated the causes of the observed changes and (3) ascertained the rate at which the changes occurred and how they impacted the environment, access to ecosystem services, and livelihoods of the local community. The strength of this approach is that the mapped LULC classes were consultatively identified with the beneficiaries of the land’s ecosystem services. This approach creates space for the local level to inform the regional level in a manner that enables effective implementation of informed management interventions at multiple spatial scales. The paper concludes by providing recommendations on what needs to be done to enhance sustainable utilisation of the natural resources in this area and elsewhere, and identifies gaps that need to be filled in future research initiatives.
2 Materials and methods
2.1 Study area
Tyhume Valley is situated between Alice and Hogsback in Raymond Mhlaba Local Municipality (RMLM), Eastern Cape Province, South Africa (Figure 1). It is named after the Tyhume River, which runs down from the forested mountains of Hogsback to the southeast of Alice. It is home to a rural population residing in 20 villages, which form part of the former Ciskei Homeland of the apartheid government. RMLM has a population of ~159516 and an unemployment rate of 39.93%. Most of its people are largely dependent on government welfare grants and subsistence crop and livestock production (ECSECC, 2017).
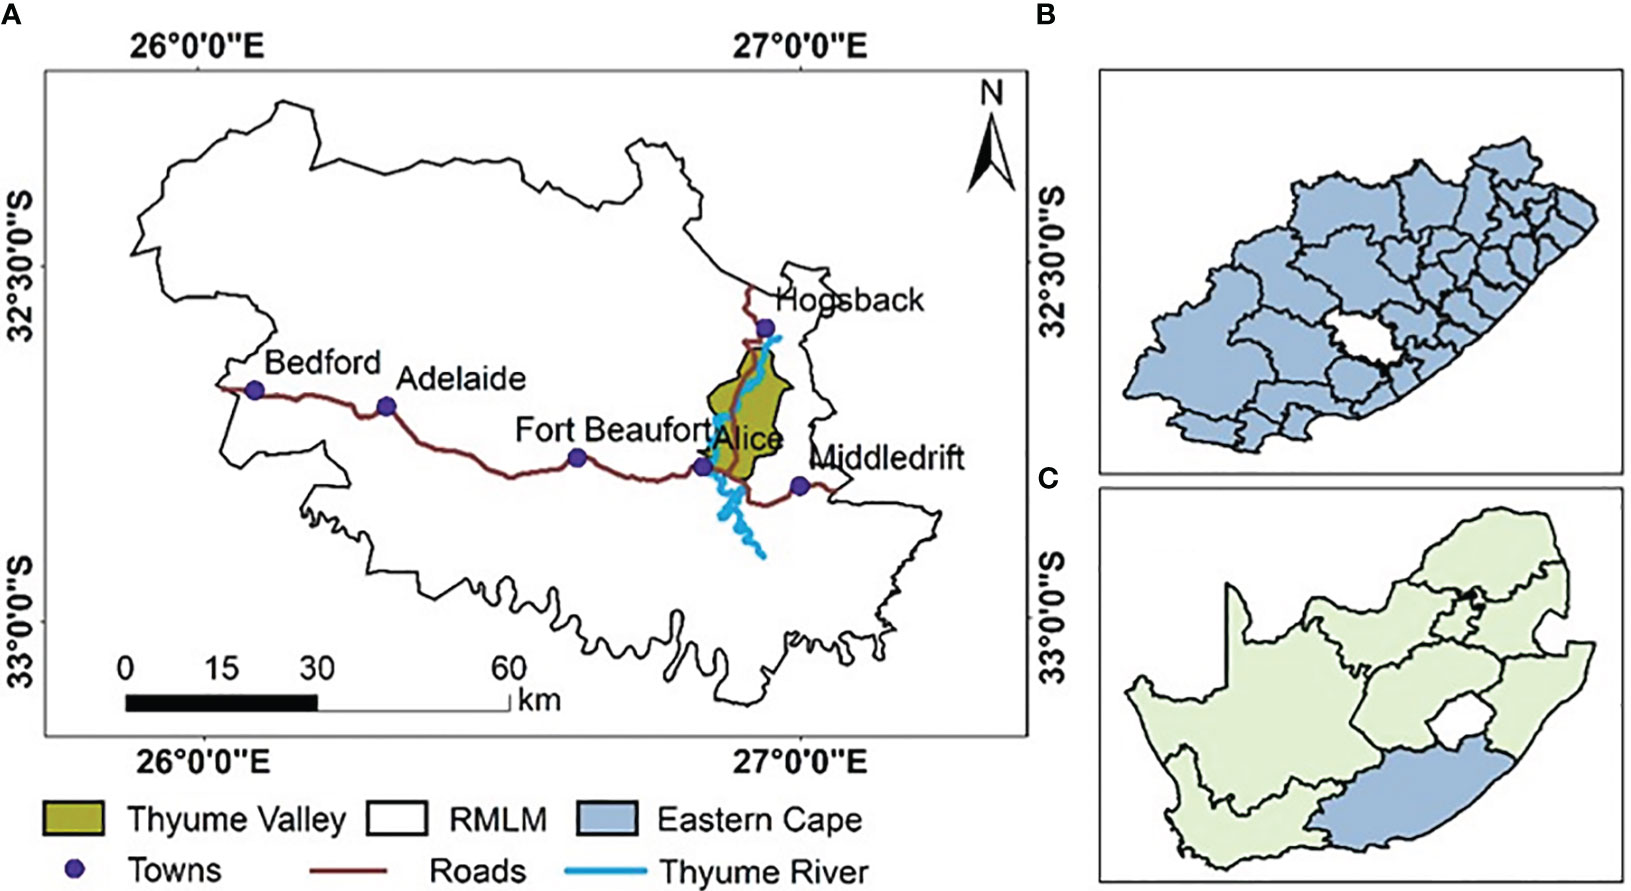
Figure 1 Location of Tyhume valley in (A) RMLM, (B) Eastern Cape, (C) South Africa.
The area has a semi-arid climate that is characterized by high potential evapotranspiration (PET) in January and severe midsummer drought (Verdoodt et al., 2003) with rainfall averaging 579.88 mm/annum. This average was calculated from long term annual records of one of Agricultural Research Council’s (ARC) weather stations in Tyhume Valley (Figure 2). Although this climate implies perennial water shortages, the area is actually one of the country’s 21 major sources of water (Colvin et al., 2013). Figure 2 shows annual rainfall distribution and standardized anomalies.
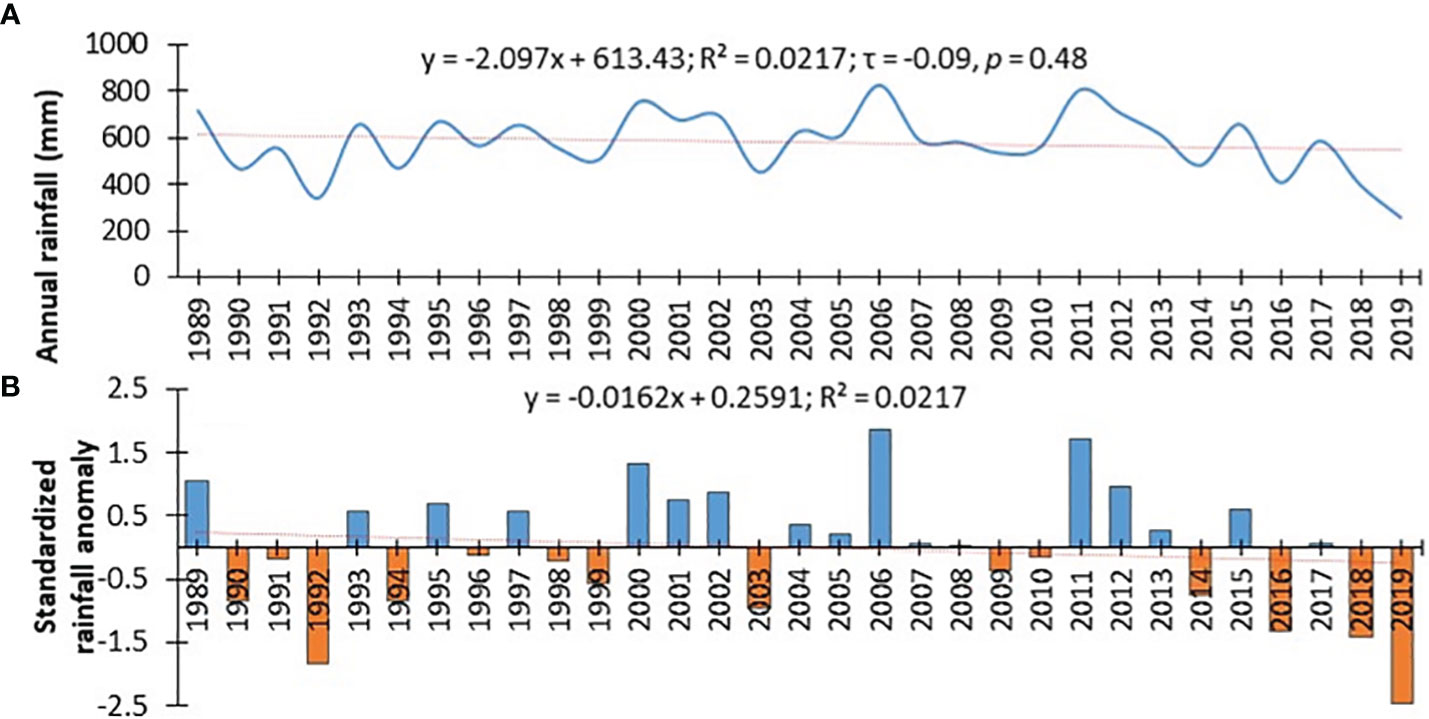
Figure 2 Annual rainfall distribution and standardized anomalies.
The topography is characterized by gentle-to-moderate sloping savanna rangelands with elevations ranging between 500m in the southern parts near Alice, and 800m along the northern and eastern parts near the foothills of the Amathole Mountain Range. The soils are alluviums which originated from a variety of sedimentary rocks including shales, sandstone, and mudstones (Verdoodt et al., 2003). The vegetation is classified as False Thornveld of the Bhisho Thornveld, with grasses mainly consisting of Digitaria Eriantha, Cymbopogon Plurinodis, and Sporobolus and thornveld woody plants that are dominated by Vachellia karroo (V. karroo), Scutia Myrtina and Polyacantha species (Mucina and Rutherford, 2006). The dominant agricultural activities are livestock, poultry, and vegetable production.
2.2 Data
2.2.1 Imagery
Seven wet season (March-April) satellite images were used for LULC mapping (Table 1). These included Landsat 5 Thematic Mapper (L5TM), Landsat 7 Enhanced Thematic Mapper (L7ETM) and Landsat 8 Operational Land Imager and Thermal Infrared Sensor (L8OLI/TIRS) foot-print coverages of the study area. Wet season images were selected partly because they allowed reliable mapping of cropland, vegetation, and surface water. The images also had minimal cloud cover and optimum spatial and spectral resolutions and temporal coverage for long-term LULC characetrisation.
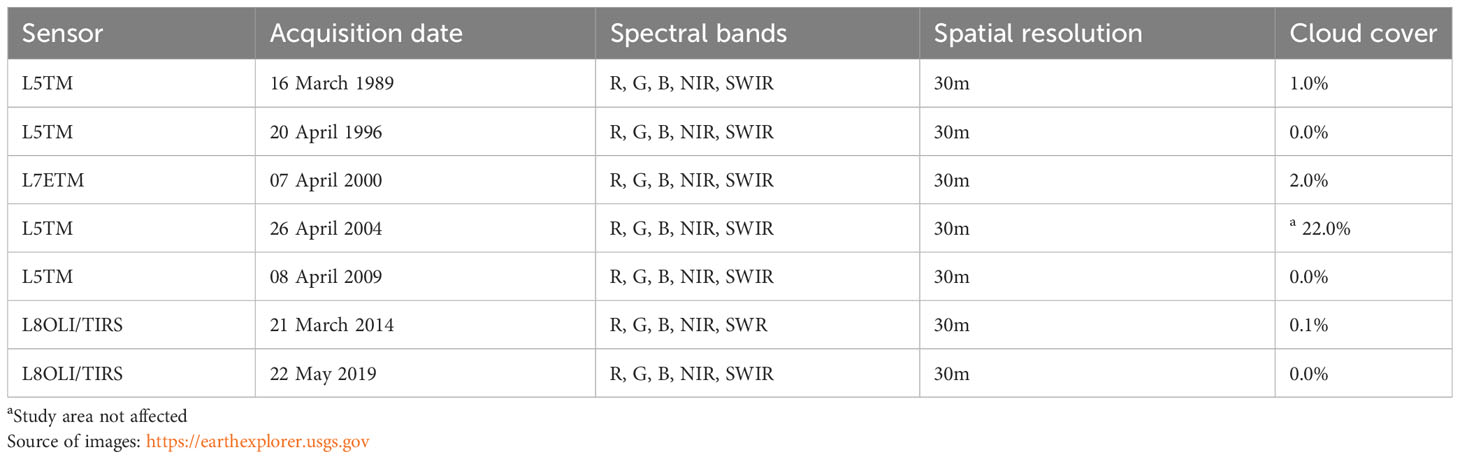
Table 1 Temporal sequencing and characteristics of the Landsat images that were used.
Additional images included high-resolution aerial photographs of 1985, 1988, 1995, and 2004 that were provided free of charge by South Africa’s National Geospatial Information center of the Department of Agriculture, Land Reform and Rural Development. These aerial photographs were used in conjunction with Google Earth images as ancillary sources of ground truth for image classification.
2.2.2 Local people’s’ perceptions of LULC change
Structured interviews were conducted to solicit perceptions of the local people. The interviews were conducted with 102 long-standing residents most of whom were above 50 years of age with reliable memories of changes in LULC. Overall, three to six respondents were identified in each village depending on the availability of respondents and village size. The sampling was also designed to enhance representative inclusion of different stakeholders that include agricultural extension officers and non-agriculturalists who viewed themselves as beneficiaries of Tyhume Valley’s ecosystem goods and services. Table 2 summarizes the questions that were asked during the interviews.
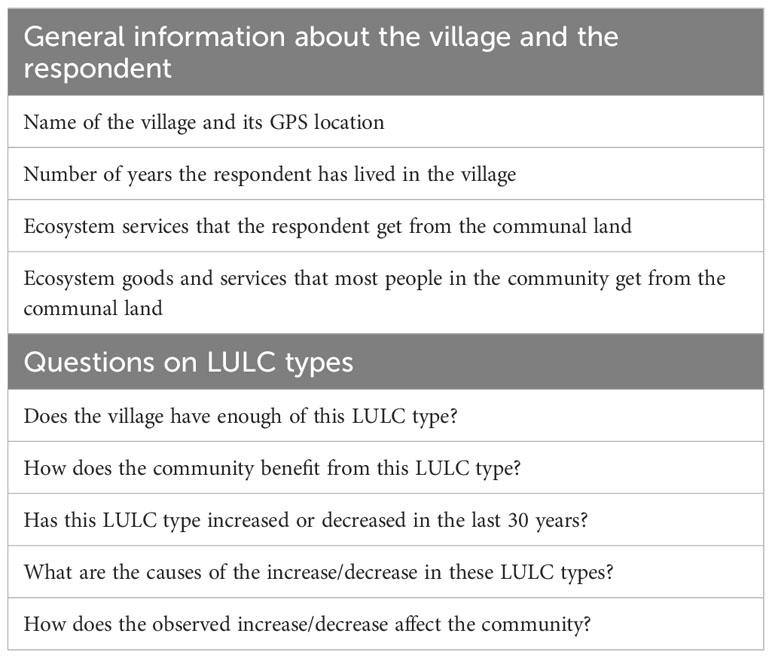
Table 2 Summary of the questions that were asked during interviews.
2.3 Data analysis
2.3.1 Image pre-processing and classification
The satellite images were first atmospherically corrected from top of atmosphere (TOA) reflectance to bottom of atmosphere reflectance (BOA) using the semi-automatic plugin in QGIS. This correction calculates BOA reflectance values from the TOA reflectance values by using the dark object subtraction (DOS) technique (Paolini et al., 2006; Prieto-Amparan et al., 2018). Thereafter, the images were classified in Posit (RStudio) using the Extreme Gradient Boosting (Xgboost) algorithm. Xgboost was purposefully selected because it has a history of outperforming other traditional machine learning algorithms (Nielsen, 2016; Georganos et al., 2018; Masiza et al., 2020). Classification training was based on a 70%/30% split of the ground truth data, which were collected in 2015 and 2019, and with the aid of collateral data from historical aerial photographs. Collection of training data was based on judgmental sampling with training points being distributed across the study area to provide representative coverage of the LULC classes of interest.
The LULC classes were V. karroo, mixed bush, pastureland, cropland, bare land, built-up area, and surface water. The Landsat images of 2000 to 2019 were classified into six LULC classes excluding cropland which was mapped by digitizing crop fields from aerial photographs and RGB satellite image composites. Cropland masks were later combined with the six-class thematic maps using thematic overlay. For this reason, validation points did not coincide with the cropland pixels. The 1989 and 1996 images were each classified into five LULC types excluding cropland and V. karroo. Cropland masks were later combined with the five-class thematic maps using thematic overlay. was also excluded because it was scattered in its early phases of expansion and, therefore, difficult to discriminate from other woody species. This exclusion was accommodated by subsuming V. karroo under mixed bush. Classification accuracies ranged between 93.88% and 98.35% (Table 3).
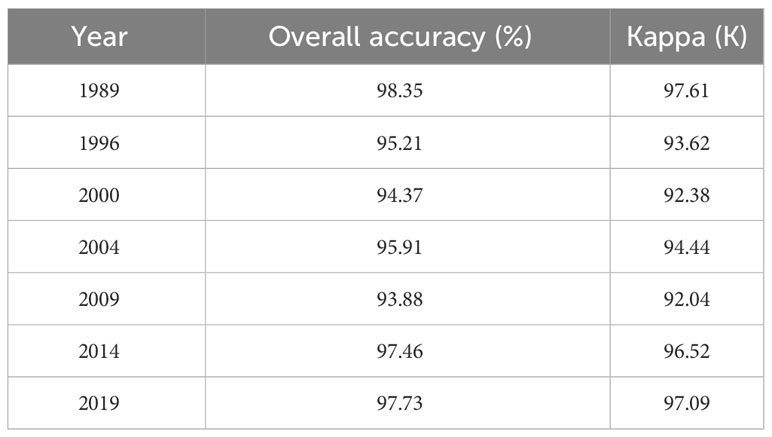
Table 3 Classification accuracies of the map outputs that were produced.
2.3.2 Trend analysis
Trends in LULC and rainfall were statistically determined through the Mann Kendall (MK) trend analysis method using Posit (RStudio). The MK test is a widely applied method in environmental time series analyses (Nikhil Raj and Azeez, 2012; Asfaw et al., 2018; Mahlalela et al., 2020; Aragaw et al., 2021). It is a non-parametric technique that was developed to detect trends in univariate time series datasets (Sen, 1968; Guo et al., 2018). The null hypothesis of this test is that the series has no trend. The alternative hypothesis is that the data follows a monotonic trend. Since MK is a non-parametric test, the analyzed data do not have to be homoscedastic or conform to any particular distribution (Wang et al., 2020). MK is also not affected by the length of the time series, missing data, and irregular distribution of the time points of measurements. However, it is required that the data be free of seasonal variations and all seasonal effects be removed (Goswami, 2017). The data used in this study were judged to be suitable for MK analysis as each time slice coincided with the same period of the year.
2.3.3 Analysis of the respondents’ perceptions of LULC change
The analysis and summarization of respondents’ perceptions were based on frequency analysis. Bernstein and Bernstein’s (1999) define frequency as the number of times an observation occurs as denotated by formula 1 below:
where fi is a percentage expressing the number of times (n) response i occurs in population N.
3 Results
The results are presented in Tables 4, 5. Table 4 summarizes (a) the percentage compositions of the LULC types that were mapped, (b) trends in these LULC types and (c) rainfall between 1989 and 2019. Table 5 summarizes respondents’ perceptions of LULC changes, causes, and impacts of these changes.
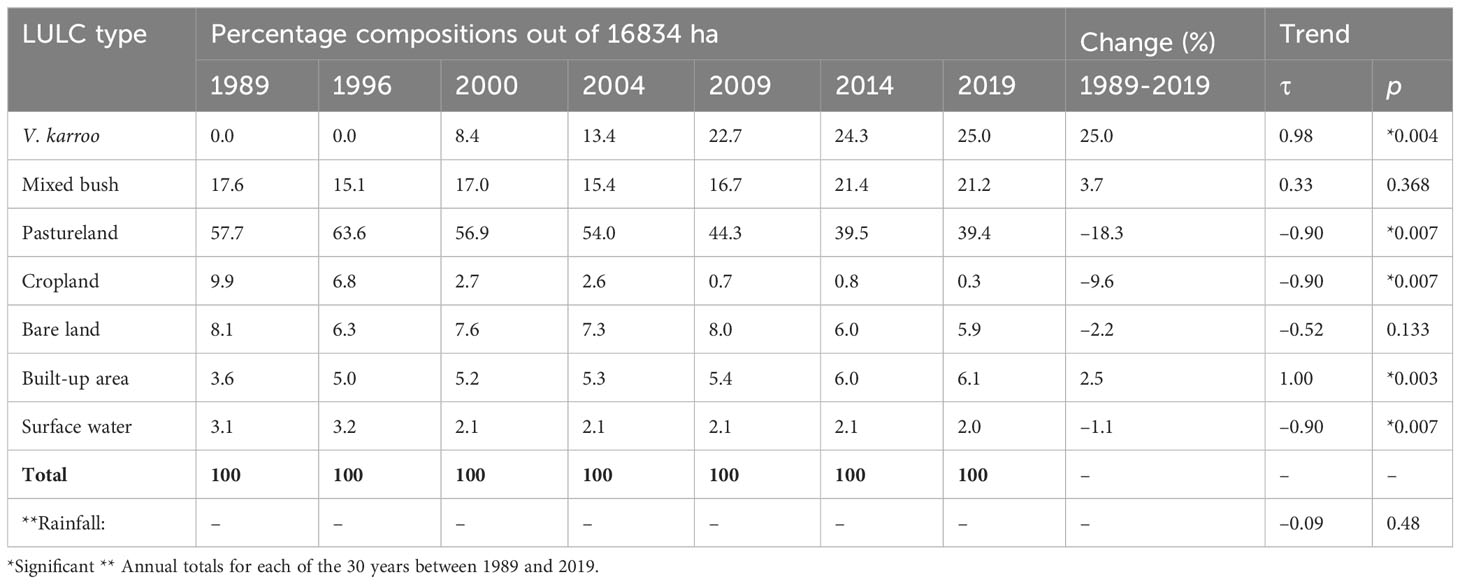
Table 4 Percentage compositions and LULC types that were mapped and their trends together with rainfall: 1989 – 2019.
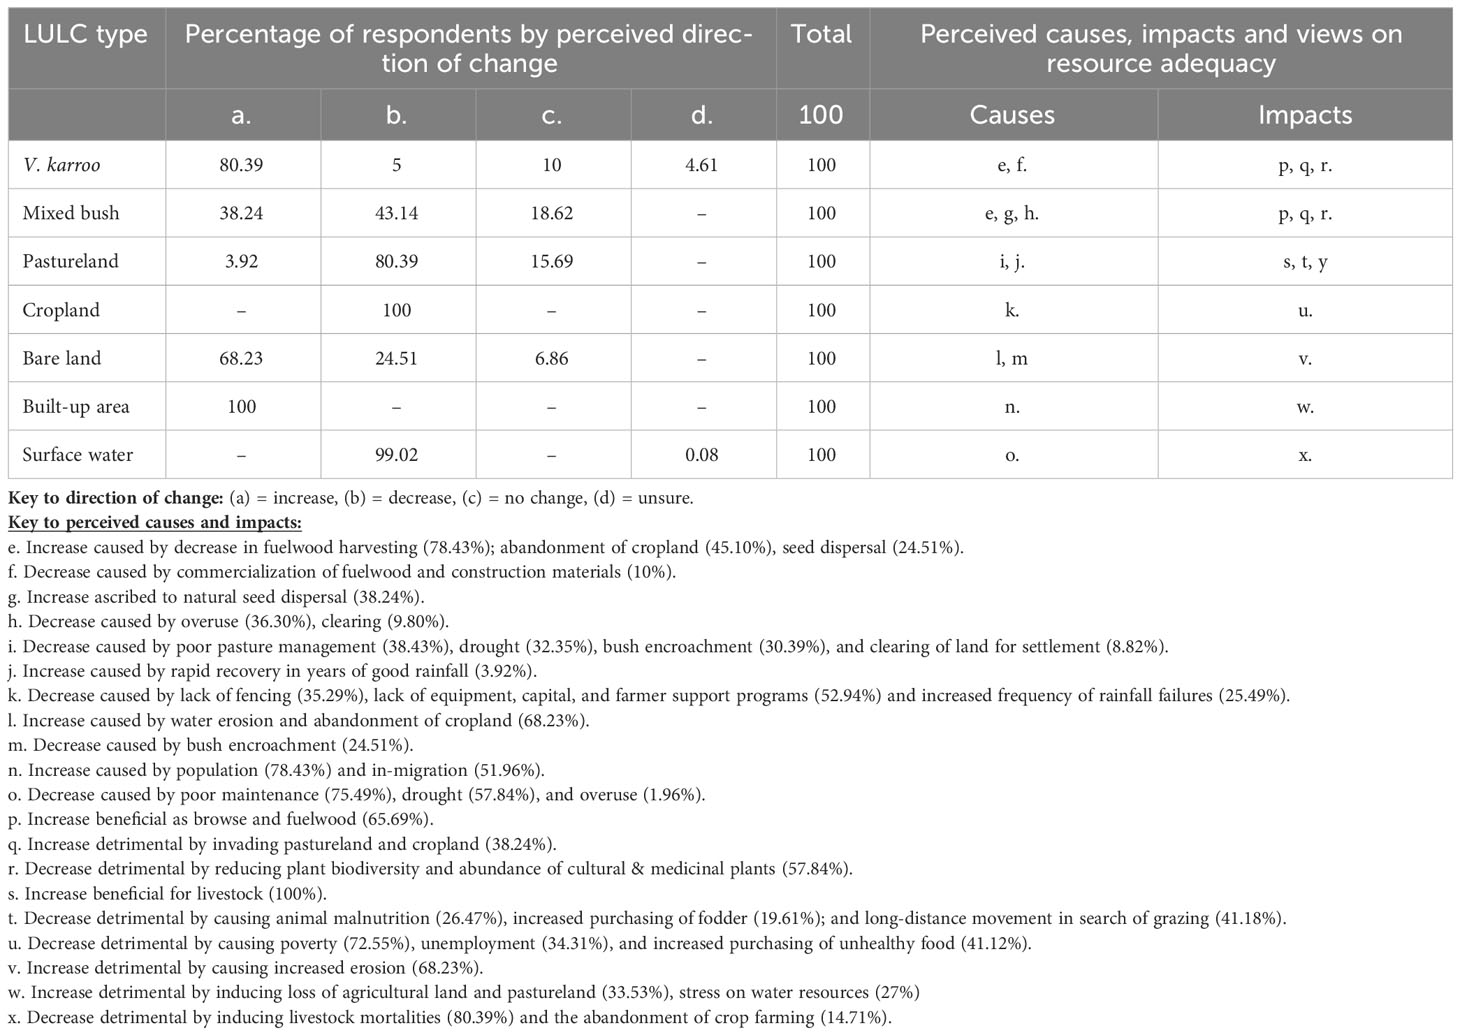
Table 5 Perceived trends, causes, and impacts of the LULC changes.
3.1 Trends in LULC and rainfall
Table 4 shows that the greatest long-term changes (1989-2019) were for V. karroo and pastureland, which increased and declined by 24.97% and 18.29%, respectively (p< 0.01). Cropland persistently declined by 9.56% (p< 0.01). Built-up area increased slightly by 2.51% (p< 0.01), while changes in bare land (-2.2%) and mixed bush (3.7%) were marginal. Changes in surface water were negative (-1.2%) and persistent (p< 0.01). Overall, trends in all LULC types were statistically significant except for bare land and mixed bush. Rainfall exhibited a marginal and statistically insignificant decrease (τ = -0.09, p = 0.48). Figure 3 shows the multitemporal LULC maps of Tyhume Valley.
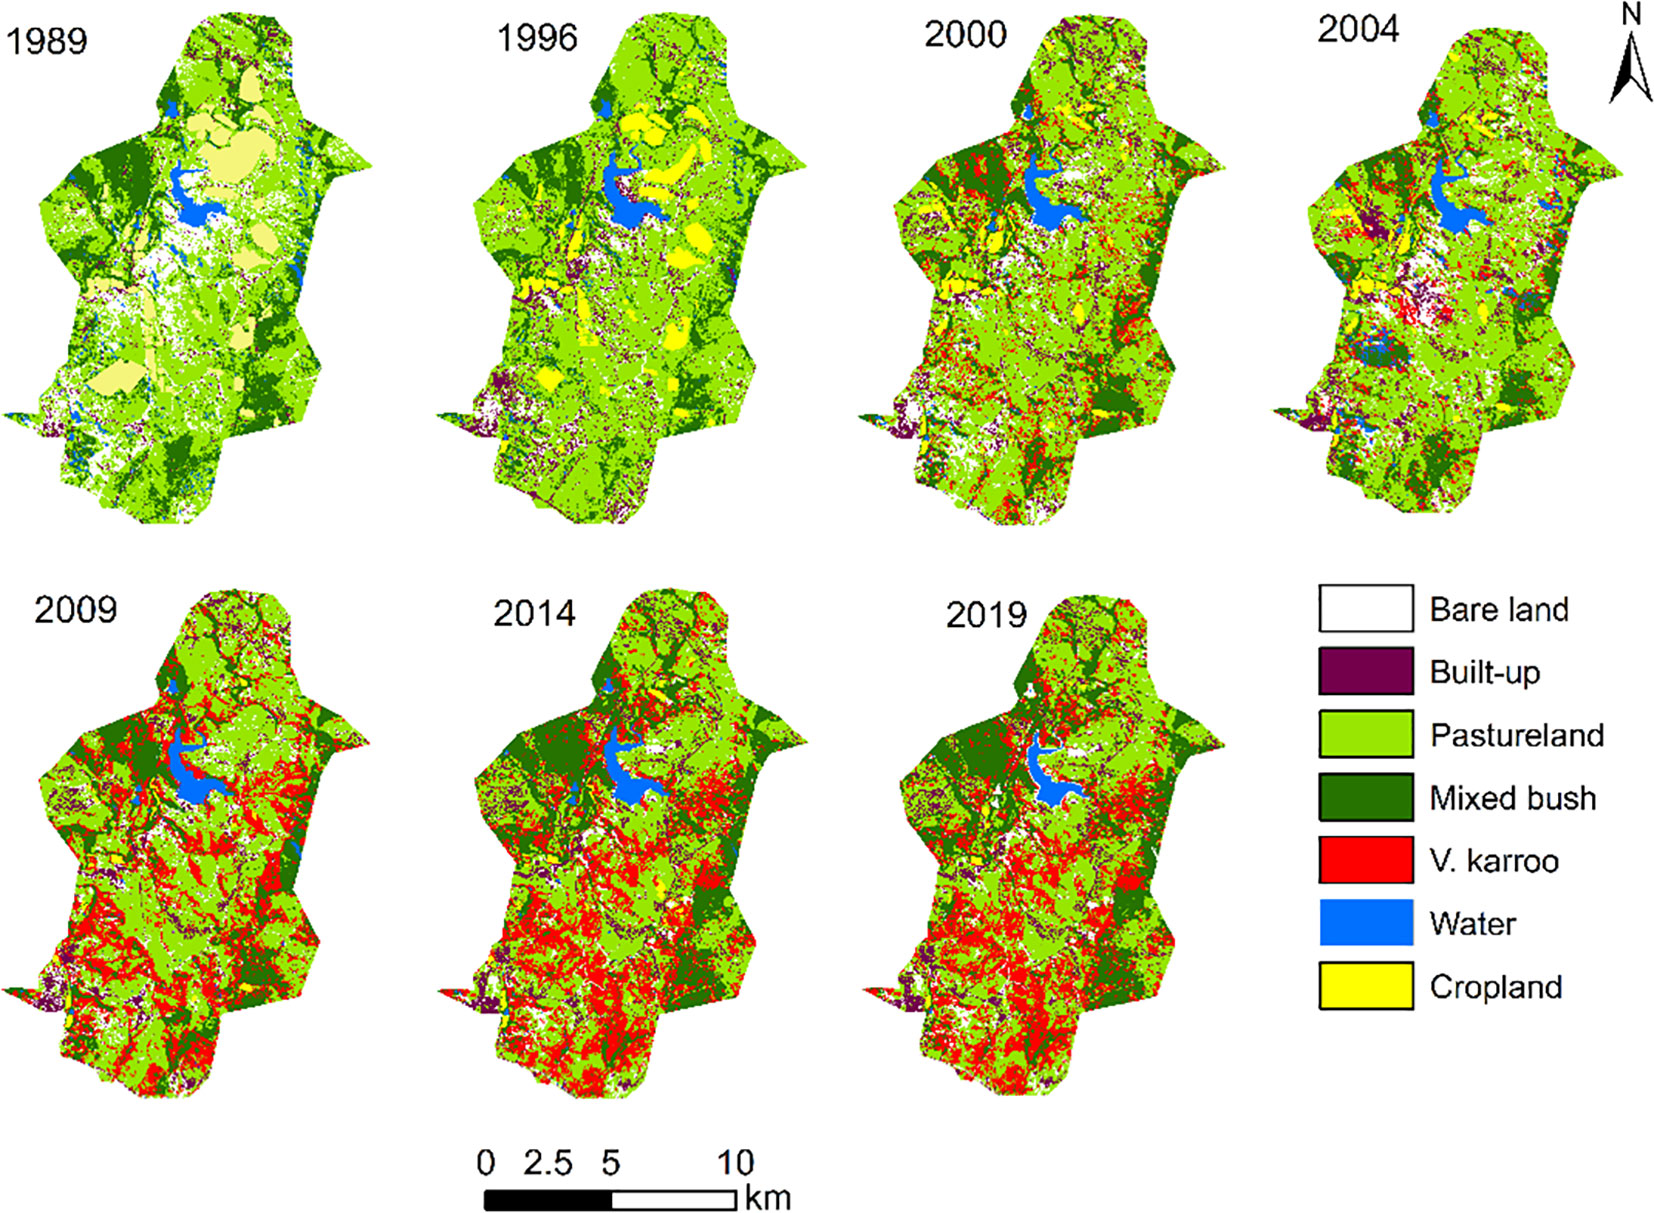
Figure 3 LULC maps of Tyhume valley (1989-2019).
Table 5 presents frequency statistics on the perceived trends, causes, and impacts of the LULC changes. Note that the responses about causes and impacts do not add up to 100% because each respondent was allowed to state more than one cause and impact. The number of interviewed females and males were 37 (36.30%) and 65 (63.70%), respectively. All the respondents had lived in their respective villages for more than 20 years. Of these respondents, 66.67% were exclusively engaged in livestock farming, 18.63% engage in both livestock and crop production, 7.84% engaged in exclusively crop production, 5.88% engaged in fuelwood collection, and 0.98% in nursey. All the respondents indicated that the most practiced agricultural activity in their respective villages was livestock production. Most of the respondents (80.39%) reported that V. karroo hand increased, with 65.69% stating that this increase was beneficial for goat farmers and fuelwood users. However, 34.31% of the respondents perceived this increase to be a challenge because V. karroo had encroached on pastureland and fallow cropland. A little less than half of the respondents (43.14%) perceived mixed bush to have declined, with 34.31% concerned that they had to travel to neighboring villages to get some of the bush trees. Most of the respondents (80.39%) indicated that pastureland had decreased, with 41% stating that sheep and cattle had to trek long distances for healthy pastures. All the respondents reported a decrease in cropland, which resulted in increased poverty, unemployment, and consumption of unhealthy foods. More than half of the respondents (68.23%) perceived bareness to have increased, with some concerned that it was causing rill and gully erosion, especially in abandoned croplands. Most of the respondents (96.10%) perceived surface water to have declined, with 80.39% indicating that the drying up of water bodies had increased livestock mortality. Some of the respondents (14.71%) attributed the abandonment of crop farming to the decrease in surface water. All the respondents reported that built-up area had increased, with 33.53% noting that new building structures had taken up agricultural land.
4 Discussions
The objective of this study was to investigate the extent, perceived causes and impacts of LULC change in the communal lands of Tyhume Valley. For vegetation, the changes that emerged include a significant expansion of V. karroo (τ = 0.98; p = 0.004) by 25%, a marginal increase in mixed bush by 3.7% and a significant decrease in pastureland (τ = –0.90, p = 0.007) by 18.3% (Table 4). The expansion of V. karroo in South Africa was first noticed in Eastern Cape’s Keiskammahoek area in the 1890s (Story, 1952) and the Bloemfontein and Brandfort areas in the 1950s (Louw, 1951; Mostert, 1958; Trollope, 1983). Since then, V. karroo’s invasion of pastureland has become one of the major problems confronting sheep and cattle farmers in South Africa’s communal areas (Du Toit, 1967; Beyene et al., 2014; Tokozwayo et al., 2018). This has prompted environmentalists to declare V. karroo a noxious weed (Barnes et al., 1996) that reduces plant biodiversity (Bond and Midgley, 2012). Its expansion in Tyhume valley is consistent with recent trends in private farms, communal areas, game reserves, national parks, and grassland biomes in different areas of South Africa (Munyati et al., 2011; O’Connor et al., 2014; Skowno et al., 2017). This non-selective increase suggests that, in addition to land-use, there are other factors driving its encroachment.
One of the enablers and drivers of V. karroo encroachment that was pointed out by the respondents is the abandonment of cropland and the eradication of fenced grazing camps. This observation is supported by Wonga et al. (2021) who observed an increase in V. karroo by 14.18% and 22.85% in the abandoned croplands and grazing lands of Tyhume Valley and Sheshegu (35 km southwest of Tyhume Valley) between 1984 and 2014. Abandonment of cropland provides hospitable habitats for this encroacher. Since many communal grazing areas and abandoned croplands in the Eastern Cape are not fenced and properly demarcated (Bennett et al., 2010; Palmer and Bennett, 2013), it is reasonable to suggest that the free movement of animals allows V. karroo seeds to be easily dispersed to open areas. For this reason, O’Connor et al. (2010) recommended restricted movements of livestock to contain the spread of this specie in communal areas. Respondents who lamented the eradication of fenced camps supported this recommendation.
The respondents perceived that fenced camps are beneficial because they allow rotational grazing and thus resting of some of the land for grass to regrow. This inhibits overgrazing and the displacement of grasses by woody plant species, and aids in controlling the dispersal of woody plant seeds by animals. Similar sentiments were expressed by the residents of Roxeni village, ~25km southwest of Tyhume Valley, who regretted the loss of fenced camps (Bennett et al., 2010). Another perceived enabler of V. karroo encroachment was the decline in fuelwood harvesting due to the advent of electricity. The respondents stated that, although V. karroo is the most preferred fuelwood, its household use has declined in the 21st century. It is now used for fuel when there are community events such as cultural, religious, and burial ceremonies, which require large quantities of energy for cooking. A similar case was reported in KwaZulu-Natal where bush encroachment was associated with a decline in fuelwood harvesting (Luvuno et al., 2022).
Although factors such as CO2 fertilization and V. karroo’s drought tolerance are also known to contribute to the expansion of V. karroo and bush encroachment in general, the responses provided by the Tyhume locals in this study indicate that land management is the major enabling factor. Previous studies conducted in Tyhume and other parts of the Eastern Cape province report that communal lands do not have proper management measures in place to limit the spread and expansion of woody encroachers like V. karroo (Bennett et al., 2010; Puttick et al., 2014; Tokozwayo et al., 2018). Elevated atmospheric CO2 concentration drives V. karroo’s expansion when there are no bush encroachment limiting factors (Nackley et al., 2018; Raubenheimer and Ripley, 2022). Local factors may have more influence on V. karroo encroachment than global drivers do (Collins et al., 2018; Venter et al., 2018; Raubenheimer and Ripley, 2022). The major insight from this is that bush encroachment is a spatially variable phenomenon that requires management initiatives that acknowledge unique environmental and socioeconomic conditions of different areas. In Tyhume Valley, evidence points to accelerating bush encroachment at rates that require immediate implementation of locally relevant interventions to control it even though scientifically inspired reasonings argue that it delivers long-term benefits by enhancing the sequestration of atmospheric CO2.
Respondents who viewed V. karroo’s encroachment as problematic stated that it leads to the loss of productive cropland, pastureland, biodiversity, and increased scarcity and disappearance of plants that are used for medicinal and cultural purposes. Those who viewed it as beneficial cited its excellent fuel properties and its palatability to browsers. These conflicting perceptions need to be reconciled by adopting management strategies that strike a balance between the adverse and beneficial outcomes of V. karroo’s aggressive expansion. For example, restoration of fenced camps and herding could limit its expansion via animal agency and improve land management. In addition, increasing the stocking rates of browsers could also contain V. karroo encroachment. This recommendation is supported by a study conducted in the Eastern Cape, which reports that continuous browsing by goats induced higher tree mortalities compared to rotational browsing, and this inhibited the expansion of V. karroo (Du Toit, 1972). Increasing stocking rates of goats in V. karroo encroached areas in tandem with the land’s carrying capacity could benefit farmers by (1) allowing them to spread risks by reducing reliance on grazers that are vulnerable to drought-driven forage shortages (2), enhancing food security through self-production of nutritional food, and (3) providing sustainable sources of income. For example, the Department of Agriculture, Land Reform and Rural Development (DALRRD, 2020) reports that, between 2010 and 2019, the demand for chevon in South Africa increased by 10% while goat prices increased by 193%. Controlling V. karroo’s encroachment by increasing goat populations could boost goat farming because of V. karroo’s established nutritional value (Ngambu et al., 2013; Idamokoro et al., 2016).
Although the increase in mixed bush was marginal, the respondents were concerned that this increase was characterized by the expansion of a few competitive species at the expense of their less competitive counterparts. This concern was expressed by 43.14% of the respondents whose perception was that certain species have declined, leading to loss of biodiversity and decrease in the abundance of medicinal and culturally significant plants (Table 5). This perceived decrease of certain species was not detected through image classification because mixed bush could not be mapped at the individual specie level. Mixed bush was a mixture of different coexisting plants that include Scutia myrtina, Buddleja saligna, Olea capensis, Maytenus capitata, Aloe, Afrocarpus falcatus, Podocarpus latifolius, Diospyros lycioides, Ziziphus mucronata, Rhamnus prinoides, Ptaeroxylon obliquum, and Combretum species.
Some of these plants are browsed by goats and used for medicinal purposes and cultural rituals. They are also used as grave markers, fencing poles, and kraal construction material. However, due to their decline and displacement by V. karroo, some of them are on the verge of extinction in most parts of Tyhume Valley. Interestingly however, we observed that, unlike in the areas dominated by V. karroo, mixed bush habitats were still fenced or partially fenced even though most of the respondents reported that fencing had been abandoned. They explained that the fenced mixed bush habitats were former private farms and lands that were fenced by the government. In the past, unauthorized access to these areas was prohibited, and community members needed permission from authorities to cut down trees. However, these areas are now openly accessible and trees are cut without restrictions. This explains why some community members were concerned about the eradication of land access permits and the removal of fences.
The expansion of mixed bush and V. karroo coincided with a long-term decrease in pastureland. Perceived causes of this decrease were (1) bush encroachment, (2) poor pasture management (overgrazing, the abandonment of rotational grazing, and the eradication of grazing camps), (3) reoccurring droughts, and (4) the increase in built-up area and in-migration. Poor management of communal pastureland in Tyhume Valley is consistent with findings from other parts of the Eastern Cape province (Bennett and Barrett, 2007; Moyo et al., 2008; Bennett et al., 2010; Tokozwayo et al., 2018; Kakembo and Ndou, 2019; Tokozwayo et al., 2021). Most of the respondents indicated that, in addition to bush encroachment, built-up area has taken up substantial proportions of pastureland. The perceived causes of built-up area’s expansion were birth rate-driven population growth and in-migration. The latter is supported by observations in Buffalo City Metro Municipality (~60km south of Tyhume Valley), where residents have been constantly battling invasions of their pasturelands by migrants from surrounding areas (Fuzile, 2016; Maliti, 2019; Jacob, 2021). In many parts of South Africa’s former homelands, land is allocated by traditional leaders who do not follow planning and land use management guidelines (Bennett et al., 2013). As a result, communal pastures end up being used and hijacked for purposes that do not accommodate the interests of local communities (Fuzile, 2015). The situation is slightly different in East Africa, where grasslands are overtaken by cropland due to increasing food demand and population increase (Belay et al., 2022; Kuule et al., 2022). In South Africa, the decline in communal grazing land in areas like Tyhume Valley can also be explained by the forced displacements of the majority populations by colonialism and apartheid (Cochet, 2020). These displacements resulted in the creation of the pseudo-homelands (or former homelands), which amounted to only 13% of South Africa’s total land area and were allocated to the black majority populations (Watson, 2001; Von Fintel and Pienaar, 2016).
The decrease in pastureland is perceived to be detrimental because it contributes to animal malnutrition, increased purchasing of fodder by those who can afford, and forced long-distance movement of livestock to greener pastures. Most of the farmers reported that livestock mortalities increased in years of drought, due to reduced forage availability and the farmers’ limited capacities to purchase supplementary stock feeds. Although historical and current official livestock statistics were not available, the respondents reported that the stocking rates of sheep and cattle have been declining. This could be turned into an opportunity by encouraging farmers to adopt a mixed livestock production strategy by shifting emphasis from sheep and cattle to goats. To achieve the sustainable production of more goats, the DALRRD could collect and keep records of livestock numbers so that stocking rates can be regularly adjusted in tandem with changes in climatic conditions and the environment’s carrying capacity. Information about livestock numbers is crucial in guiding the formulation of informed management strategies. This strategy could be conjunctively used with the restoration of fenced camps and planned implementation of land allocations to enhance the sustainable utilization of pasturelands.
The long-term decrease in surface water was in the same direction with the long-term changes in rainfall. Although the decrease in rainfall was not statistically significant, it was punctuated by a series of years with below average rainfall (Figure 2). This suggests that climate change-driven decrease in rainfall may have contributed to the decrease in surface water distribution. However, the relationship between the long-term rainfall trends and surface water distribution requires further investigation. Perceived causes of the decrease in surface water included poor maintenance, drought, and overuse. Almost every village had a communal dam that had dried-up completely. The communities, with the help of government, used to desilt communal dams on a regular basis until around the year 2000. In addition, the communities abandoned traditional water harvesting practices, which included the maintenance of surface water channels and homestead ponds (Denison and Wotshela, 2009; Monde et al., 2012).
The abandonment of water harvesting practices in Tyhume Valley and other parts of South Africa has been previously reported (Denison and Wotshela, 2009; Monde et al., 2012; Mtyelwa et al., 2022). This shift has been attributed to the provisioning of piped water supplies by the government (Denison and Wotshela, 2009). Although this supportive intervention has been helpful, its effectiveness continues to be undermined by persistent cuts of piped water supply (Macupe, 2019; Phaliso, 2021; Velaphi, 2022). The drying up of small dams is one of the factors that was raised as being one of the causes of cropland abandonment and increased mortalities and long-distance trekking of livestock to watering points (Table 5). Tyhume Valley and other areas under similar circumstances can learn from the O.R Tambo District Municipality of the Eastern Cape, where dredging and augmentation of community dams by the Department of Rural Development and Agrarian Reform resulted in reduced livestock mortality (DRDAR, 2021; Masiwa, 2021).
Although the decrease in surface water was perceived to have also contributed to the decline in crop farming, other factors contributing to the drastic decline in cropland included the lack of fencing, equipment, capital, and farmer support programs. In other parts of the world, for example in China, cultivated land has decreased due to urban area expansion (Hasan et al., 2020), while in East Africa, cropland has increased with increasing food demand at the expense of grassland, shrubland and forest (Belay et al., 2022; Kuule et al., 2022). The abandonment of crop farming in Tyhume Valley was widely perceived to be one of the major causes of poverty by 72.55% of the respondents and cited by 34.31% and 41.12% of the respondents as one of the major causes of high unemployment and increased purchasing and consumption of unhealthy food, respectively. Tyhume Valley and other areas under similar circumstances can learn from neighbouring areas such as the O.R Tambo District Municipality, where communal farmers enjoy government support in the form of inputs and advisory services (Iortyom et al., 2018; Mahlombe, 2018; Masiza et al., 2021; Wonga et al., 2021). The observed trends, perceived causes and impacts of LULC change, paint a grim picture of the environmental situation in Tyhume Valley. The environmental shift in the form of loss of plant biodiversity, bush encroachment by V. karroo, decline in surface water, and the abandonment of crop farming, all exacerbated by the frequent occurrences of droughts, calls for the scientific community and policy formulators to provide innovative and actionable interventions that can enhance the sustainable use of this environment and others under similar circumstances for the benefit of present and future generations.
5 Conclusions
Overall, the observed LULC changes had adverse impacts on access to ecosystem goods and services and the livelihoods of Tyhume Valley’s communities. The findings of this study point to persistent expansion of V. karroo at the expense of pastures, cropland, and other woody species. The main enablers of this phenomenon are perceived to be V. karroo’s competitive advantages over other woody species, abandonment of arable land and the lack of consensus on whether the expansion of V. karroo is beneficial or detrimental. The historical background of Tyhume Valley, as narrated by the respondents, suggests that the communal lands were healthier and more resourceful when management regulations in the form of fenced camps and land access permits were enforced and observed.
V. karroo can be contained through the restoration of the above listed management measures, with emphasis being placed on (1) continuous browsing of V. karroo and (2) increased stocking rates of goats without exceeding the environment’s carrying capacity. Livestock farmers stand to benefit from the recommended use of continuous browsing and increased stocking rates of goats because of the recent increased demand for goat products. This study recommends continuous recording and record-keeping of livestock numbers at the village level. The office of extension services under the DALRRD is in regular engagements with pastoralists, in which extension officers pay farmers periodical visits to monitor the well-being of livestock. These engagements can be used as opportunities to collect, record, and monitor village-level livestock statistics, which are very useful in research, monitoring and evaluation, and land management. Although fencing and land access permits are unpopular, management interventions of this nature can be receptively implemented through village committees, tribal authorities, extension officers and abidance with formal spatial planning and land use management guidelines.
Restoration of surface water, which is essential for livestock and crop production, will necessitate the reinstatement of old and new water harvesting practices, coupled with regular desilting and maintenance of surface water bodies. An example of a successful dam restoration scenario was provided in the discussions section of this paper. Regarding crop production, Tyhume Valley and other areas under similar circumstances can learn from neighboring districts such as the O.R Tambo District Municipality, where crop producers enjoy government support in the form of inputs and advisory service. This study shows that, in addition to LULC mapping, local perceptions also provide valuable insights about the extent, causes, and impacts of LULC change. The influence on LULC change of the observed rainfall anomalies and other climatic parameters requires further investigation. The recommendations provided in this study should be implemented with care so that management interventions that are premised on short-term benefits while entailing long-term adverse effects are avoided.
6 Limitations of the study
Although the respondents pointed out that many of the tree species found in the area were ecologically and culturally significant, it was not possible to map vegetation by species type due to the coarse resolution of the Landsat images we used. For the same reason, we could not map rills and gullies although they were reported to have expanded. Future studies can address this shortcoming by adopting more robust methods for tree species differentiation and soil erosion mapping. The other limitation is that the respondents were selected based on availability and land-use practices and were not comprehensively informed of the different types of ecosystem services that are essential for life on earth. Where possible, future research studies could consider increasing the ecological awareness of the informants to enhance complementarity between indigenous knowledge and science. The last limitation is that we were unable to get information on livestock numbers which could have improved our analysis of the changes in pastureland and bush encroachment.
Data availability statement
The original contributions presented in the study are included in the article/supplementary materials, further inquiries can be directed to the corresponding author.
Author contributions
All authors contributed to the study conception and design. Material preparation, data collection and analysis were performed by WM, PK, and NP. The first draft of the manuscript was written by WM, HH, and JC and all authors commented on previous versions of the manuscript. All authors read and approved the final manuscript.
Funding
The authors would like to thank South Africa’s Agricultural Research Council, Natural Resources and Engineering Institute for funding this research’s data collection campaigns and the University of the Free State for co-funding its publication.
Acknowledgments
We also thank the respondents from the respective villages of Tyhume Valley who provided valuable information which helped us to write this paper.
Conflict of interest
The authors declare that the research was conducted in the absence of any commercial or financial relationships that could be construed as a potential conflict of interest.
Publisher’s note
All claims expressed in this article are solely those of the authors and do not necessarily represent those of their affiliated organizations, or those of the publisher, the editors and the reviewers. Any product that may be evaluated in this article, or claim that may be made by its manufacturer, is not guaranteed or endorsed by the publisher.
References
Abd Elbasit M. A. M., Knight J., Liu G., Abu-Zreig M. M., Hasaan R. (2021). Valuation of ecosystem services in South Africa 2001–2019. Sustainability (Switzerland) 13 (20), 1–18. doi: 10.3390/su132011262
Aragaw H. M., Goel M. K., Mishra S. K. (2021). Hydrological responses to human-induced land use/land cover changes in the Gidabo River basin, Ethiopia. Hydrol Sci. J. Taylor Francis 66 (4), 640–655. doi: 10.1080/02626667.2021.1890328
Asfaw A., Simane B., Hassen A., Bantider A. (2018). Variability and time series trend analysis of rainfall and temperature in northcentral Ethiopia: A case study in Woleka sub-basin. Weather and Climate Extremes 19, 29–41. doi: 10.1016/j.wace.2017.12.002
Barnes R., Filer D., Milton S. (1996). Acacia karroo: monograph and annotated bibliography, Tropical Forestry Papers. 32 (United Kingdom: Oxford). Available at: https://ora.ox.ac.uk/objects/uuid:f3be34c6-f23c-421e-9a2f-8688b2a6f46c/download_file?file_format=application%2Fpdf&safe_filename=TFP32.pdf&type_of_work=Working+paper.
Belay T., Melese T., Senamaw A. (2022). Impacts of land use and land cover change on ecosystem service values in the Afroalpine area of Guna Mountain, Northwest Ethiopia. Heliyon 8 (12), e12246. doi: 10.1016/j.heliyon.2022.e12246
Bennett J., Ainslie A., Davis J. (2010). Fenced in: Common property struggles in the management of communal rangelands in central Eastern Cape Province, South Africa. Land Use Policy 27 (2), 340–350. doi: 10.1016/j.landusepol.2009.04.006
Bennett J., Ainslie A., Davis J. (2013). Contested institutions? Traditional leaders and land access and control in communal areas of Eastern Cape Province, South Africa. Land Use Policy 32, 27–38. doi: 10.1016/j.landusepol.2012.10.011
Bennett J., Barrett H. (2007). Rangeland as a common property resource: Contrasting insights from communal areas of central Eastern Cape Province, South Africa. Hum. Ecol. 35 (1), 97–112. doi: 10.1007/s10745-006-9062-9
Bernstein S., Bernstein R. (1999). Schaum’s outline of elements of statistics II: Inferential statistics. 1st edn. Eds. Bernstein S., Bernstein. R. (Toronto, Canada: McGraw-Hill).
Beyene S. T., Mlisa L., Gxasheka M. (2014). Local perceptions of livestock husbandry and rangeland degradation in the highlands of South Africa: implication for development interventions. J. Hum. Ecol. 47 (3), 257–268. doi: 10.1080/09709274.2014.11906760
Blair D., Shackleton C. M., Mograbi P. J. (2018). Cropland abandonment in South African smallholder communal lands: Land cover change, (1950-2010) and farmer perceptions of contributing factors. Land 7 (4). doi: 10.3390/land7040121
Bond W. J., Midgley G. F. (2012). Carbon dioxide and the uneasy interactions of trees and savannah grasses. Philos. Trans. R. Soc. B.: Biol. Sci. 367 (1588), 601–612. doi: 10.1098/rstb.2011.0182
Brevik E. C. (2019). Shelter, clothing, and fuel: Often overlooked links between soils, ecosystem services, and human health. Sci. Total Environ. 651, 134–142. doi: 10.1016/j.scitotenv.2018.09.158
Briassoulis H. (2019). Analysis of land use change theoretical and modeling approaches. 2nd edn. Eds. Loveridge S., Jackson R. (Morgantown: West Virginia University). Available at: https://researchrepository.wvu.edu/cgi/viewcontent.cgi?article=1000&context=rri-web-book.
Bufebo B., Elias E. (2021). Land use/land cover change and its driving forces in shenkolla watershed, South Central Ethiopia. Sci. World J. 2021. doi: 10.1155/2021/9470918
Chalmers N., Fabricius C. (2007). Expert and generalist local knowledge about land-cover change on South Africa’s Wild Coast: Can local ecological knowledge add value to science? Ecol. Soc. 12 (1). doi: 10.5751/es-01977-120110
Cochet H. (2020). The planned destruction of “black” agriculture (Cape Town, South Africa: HSRC Press), 12–27. Available at: https://hal.science/hal-01375797/document.
Collins L., Boer M. M., de Dios V. R., Power S. A., Bendall E. R., Hasegawa S., et al. (2018). Effects of competition and herbivory over woody seedling growth in a temperate woodland trump the effects of elevated CO2. Oecologia 187 (3), 811–823. doi: 10.1007/s00442-018-4143-1
Colvin C., Nobula S., Haines I. (2013). An introduction to South Africa ‘ s water source Aareas. (Pretoria, South Africa: WWF). Available at: https://wwfafrica.awsassets.panda.org/downloads/wwf_sa_watersource_area10_lo.pdf?9322/An-Introduction-to-South-Africas-Water-Source-Areas.
DALRRD (2020). A profile of the South African goat market value chain (Pretoria, South Africa: DALRRD). Available at: https://www.dalrrd.gov.za/doaDev/sideMenu/Marketing/Annual%20Publications/Goat%20Market%20Value%20Chain%20Profile%202020.pdf.
Denison J., Wotshela L. (2009). Indigenous water harvesting and conservation practices historical context, cases and implications: report to the Water Research Commission (Pretoria, South Africa). Available at: https://www.wrc.org.za/wp-content/uploads/mdocs/TT%20392%20web%20new.pdf.
DRDAR (2021). Restored dams reduce livestock mortality (Bisho, South Africa: DRDAR). Available at: http://www.drdar.gov.za/restoreddamsreducelivestockmortality/.
Du Toit P. (1967). Bush encroachment with specific reference to Acacia karroo encroachment. Proc. Grassland Soc. South. Afr. 2 (1), 199–126. Available at: https://www.ajol.info/index.php/ajrfs/article/view/1297.
Du Toit P. F. (1972). The goat in a bush-grass community. Proc. Annu. Congresses Grassland Soc. South. Afr. 7 (1), 44–50. doi: 10.1080/00725560.1972.9648666
ECSECC (2017). Raymond Mhlaba Local Municipality socioeconomic review and outloo (East London, South Africa: ECSECC). Available at: https://www.ecsecc.org/documentrepository/informationcentre/raymond-local-municipality_12336.pdf.
Eldridge D. J., Bowker M. A., Maestre F. T., Roger E., Reynolds J. F., Whitford W. G. (2011). Impacts of shrub encroachment on ecosystem structure and functioning: Towards a global synthesis. Ecol. Lett. 14 (7), 709–722. doi: 10.1111/j.1461-0248.2011.01630.x
Fuzile B. (2015). Homes built on village land to be demolished (East London, South Africa: Dailty Dispatch), 31. Available at: https://www.dispatchlive.co.za/news/2015-01-31-homes-built-on-village-land-to-be-demolished/.
Fuzile B. (2016). Mystery land grabs near King anger villagers (East London, South Africa: Daily Dispatch), 26. Available at: https://www.dispatchlive.co.za/news/2016-04-29-mystery-land-grabs-near-king-anger-villagers/.
Gautier D., Denis D., Locatelli B. (2016). Impacts of drought and responses of rural populations in West Africa: a systematic review. Wiley Interdiscip. Rev.: Climate Change 7 (5), 666–681. doi: 10.1002/wcc.411
Gebremeskel G., Tang Q., Sun S., Huang Z., Zhang X., Liu X. (2019). Droughts in East Africa: Causes, impacts and resilience. Earth-Sci. Rev. 193, 146–161. doi: 10.1016/j.earscirev.2019.04.015
Georganos S., Grippa T., Vanhuysse S., Lennert M., Shimoni M., Wolff E. (2018). Very high resolution object-based land use-land cover urban classification using extreme gradient boosting. IEEE Geosci. Remote Sens. Lett. 15 (4), 607–611. doi: 10.1109/LGRS.2018.2803259
Giannecchini M., Twine W., Vogel C. (2007). Land-cover change and human-environment interactions in a rural cultural landscape in South Africa. Geographical Journaleographic J. 173 (1), 26–42. doi: 10.1111/j.1475-4959.2007.00227.x
Goswami B. (2017). Mann-Kendall Test (mkt) (Github). Available at: https://up-rs-esp.github.io/mkt/.
Guo M., Li J., He H., Xu J., Jin Y. (2018). Detecting global vegetation changes using Mann-Kendal (MK) trend test for 1982–2015 time period. Chin. Geogr. Sci. 28 (6), 907–919. doi: 10.1007/s11769-018-1002-2
Hasan S. S., Zhen L., Miah M. G., Ahamed T., Samie A. (2020). Impact of land use change on ecosystem services: A review. Environ. Dev. 34, 100527. doi: 10.1016/j.envdev.2020.100527
Hering R., Hauptfleisch M., Geißler K., Marquart A., Schoenen M., Blaum N. (2019). Shrub encroachment is not always land degradation: Insights from ground-dwelling beetle species niches along a shrub cover gradient in a semi-arid Namibian savanna. Land Degrad. Dev. 30 (1), 14–24. doi: 10.1002/ldr.3197
Herrmann S. M., Brandt M., Rasmussen K., Fensholt R. (2020). Accelerating land cover change in West Africa over four decades as population pressure increased. Commun Earth Environ. 1 (1), 1–10. doi: 10.1038/s43247-020-00053-y
Hoffman T. M., Todd S. (2000). A national review of land degradation in South Africa: the influence of biophysical and socio-economic factors. J. South. Afr. Stud. 26 (4), 743–758. doi: 10.1080/713683611
Idamokoro E. M., Masika P. J., Muchenje V. (2016). Vachellia karroo leaf meal: a promising non-conventional feed resource for improving goat production in low-input farming systems of Southern Africa. Afr. J. Range Forage Sci. 33 (3), 141–153. doi: 10.2989/10220119.2016.1178172
Ighodaro I. D., Lategan F. S., Yusuf S. F. G. (2013). The impact of soil erosion on agricultural potential and performance of Sheshegu community farmers in the Eastern Cape of South Africa. J. Agric. Sci. 5 (5), 140–147. doi: 10.5539/jas.v5n5p140
Iortyom E. T., Mazinyo S. P., Nel W. (2018). Analysis of the economic impact of Rural Enterprise Development Hub Project on maize farmers in Mqanduli, South Africa. Indian J. Agric. Res. 52 (3), 243–249. doi: 10.18805/IJARe.A-319
Jacob B. (2021). BCM residents abandon its suburbs, flock to new areas on the outskirts (East London, South Africa: Daily Dispatch), 29. Available at: https://www.dispatchlive.co.za/news/2021-03-29-bcm-residents-abandon-its-suburbs-flock-to-new-areas-on-the-outskirts/.
Jewitt D., Goodman P. S., Jewitt D., Erasmus B. F. N., O’Connor T. G., Witkowski E. T. F. (2015). Systematic land cover change in KwaZulu-Natal, South Africa: implications for biodiversity. South Afr. J. Sci. 111 (9), 1–9. doi: 10.17159/SAJS.2015/20150019
Kakembo V., Ndou N. (2019). Relating vegetation condition to grazing management systems in the central Keiskamma Catchment, Eastern Cape Province, South Africa. Land Degrad. Dev. 30 (9), 1052–1060. doi: 10.1002/ldr.3292
Kgaphola M. J., Ramoelo A., Odindi J., Mwenge Kahinda J. M., Seetal A. R., Musvoto C. (2023). Impact of land use and land cover change on land degradation in rural semi-arid South Africa: case of the Greater Sekhukhune District Municipality. Environ. Monit. Assess. 195(6). doi: 10.1007/s10661-023-11104-0
Kiage L. (2013). Perspectives on the assumed causes of land degradation in the rangelands of Sub-Saharan Africa. Prog. Phys. Geography: Earth Environ. 37 (5), 664–684. doi: 10.1177/03091333134925
Kotzé E., Sandhage-Hofmann A., Meinel J. A., du Preez C. C., Amelung W. (2013). Rangeland management impacts on the properties of clayey soils along grazing gradients in the semi-arid grassland biome of South Africa. J. Arid Environ. 97, 220–229. doi: 10.1016/j.jaridenv.2013.07.004
Kuule D. A., Ssentongo B., Magaya P. J., Mwesigwa G. Y., Okurut I. T., Nyombi K., et al. (2022). Land use and land cover change dynamics and perceived drivers in rangeland areas in central Uganda. Land 11 (9), 1402. doi: 10.3390/land11091402
Louw W. (1951). An ecological account of the vegetation of the Potchefstroom area. 1st edn. Ed. Louw W. (Pretoria, South Africa: Government Printer, Pretoria).
Lund H. (2007). Accounting for the world’s rangelands. Rangelands 29 (1), 3–10. doi: 10.2111/1551-501X(2007)29[3:AFTWR]2.0.CO;2
Luvuno L., et al. (2022). Perceived impacts of woody encroachment on ecosystem services in Hluhluwe, South Africa. Ecol. Soc 27 (1), 4. doi: 10.5751/es-12767-270104
Macupe B. (2019). Students at two Eastern Cape universities back on campus after water cuts. Mail Guardian, 19. Available at: https://mg.co.za/article/2019-08-19-students-at-two-eastern-cape-universities-back-on-campus-after-water-cuts/#:~:text=Students%20at%20two%20Eastern%20Cape%20universities%20back%20on%20campus%20after%20water%20cuts,-By%20Bongekile%20Macupe&text=The%20universities%20of%20Walter%20Sisulu,of%20a%20lack%20of%20water.
Mahlalela P. T., Blamey R. C., Hart N. C. G., Reason C. J. C. (2020). Drought in the Eastern Cape region of South Africa and trends in rainfall characteristics. Climate Dynamics 55 (9–10), 2743–2759. doi: 10.1007/s00382-020-05413-0
Mahlombe C. (2018). The role of agricultural development projects in poverty reduction in the OR Tambo District Municipality of the Eastern Cape Province South Africa, University of Pretoria (Pretoria, South Africa: University of Pretoria).
Maliti S. (2019). Mabuyane defends government employees building mansions in Dimbaza. Daily Dispatch, 15. Available at: https://www.dispatchlive.co.za/news/2019-11-15-mabuyane-defends-government-employees-building-mansions-in-dimbaza/.
Mani S., Osborne C. P., Cleaver F. (2021). Land degradation in South Africa: Justice and climate change in tension. People Nat. 3 (5), 978–989. doi: 10.1002/pan3.10260
Manjoro M., Kakembo V., Rowntree K. M. (2012). Trends in soil erosion and woody shrub encroachment in ngqushwa district, eastern cape province, South Africa. Environ. Manage. 49 (3), 570–579. doi: 10.1007/s00267-012-9810-0
Masiwa D. (2021). EC farmers fear for livestock as dam levels remain low. Food Mzansi. Available at: https://www.foodformzansi.co.za/ec-farmers-fear-for-livestock-as-dam-levels-remain-low/#:~:text=Livestock%20farmers%20in%20the%20Eastern,in%20many%20parts%20of%20province.
Masiza W., Chirima J., Hamandawana H., Pillay R. (2020). Enhanced mapping of a smallholder crop farming landscape through image fusion and model stacking. Int. J. Remote Sens. 41 (22), 8739–8756. doi: 10.1080/01431161.2020.1783017
Masiza W., Chirima J. ., Hamandawana H., Kalumba A. M., Magagula H. B. (2021). Linking agricultural index insurance with factors that influence maize yield in rain-fed smallholder farming systems. Sustainability 13 (9), 5176. doi: 10.3390/su13095176
Mbow C. (2020). Use it sustainably or lose it! The land stakes in SDGs for sub-Saharan Africa. Land 9 (3), 1–19. doi: 10.3390/land9030063
Meadows M. E., Hoffman M. T. (2002). The nature , extent and causes of land degradation in South Africa legacy of the past , lessons for the future? Area 34 (4), 428–437. doi: 10.1111/1475-4762.00100
Mokgakane T. J., Mlambo V., Ravhuhali K. E., Magoro N. (2021). Contribution of soil type to quantity and nutritional value of grass species on the South African Highveld. Resources 10 (10), 106. doi: 10.3390/resources10100106
Monde N., Joseph L., Anderson J., Dube S., Lesoli M. (2012). Sustainable techniques and practices for water harvesting and conservation and their effective application in resource-poor agricultural production report to the Water Research Commission. (Pretoria, South Africa). Available at: https://www.wrc.org.za/wp-content/uploads/mdocs/1478-1-121.pdf.
Mostert J. W. (1958). Studies of the Vegetation of Parts of the Bloemfontein and Brandfort Districts. 1st edn. Ed. Moster. J. W. C. (Pretoria, South Africa: Government Printer).
Mowat S., Rhodes B. (2020). Identifying and assigning values to the intangible cultural benefits of ecosystem services to traditional communities in South Africa. South Afr. J. Sci. 116 (8), 1–6. doi: 10.17159/sajs.2020/6970
Moyo B., Dube S., Lesoli M., Masika P. J. (2008). Communal area grazing strategies: Institutions and traditional practices. Afr. J. Range Forage Sci. 25 (2), 47–54. doi: 10.2989/AJRFS.2008.25.2.2.481
Mtyelwa C., Yusuf S., Popoola O. (2022). Adoption of in-field rainwater harvesting: Insights from smallholder farmers in Raymond Mhlaba Local Municipality, Eastern Cape Province, South Africa. South Afr. J. Agric. Extension 10 (1), 1–52. doi: 10.17159/2413-3221/2022/v50n2a11294
Mucina L., Rutherford M. C. (2006). “Memoirs of the Botanical Survey of South Africa,” in The vegetation of South Africa, Lesotho and Swaziland. Strelitzia 19 (South African National Biodiversity Institute: Pretoria, South Africa).
Munyati C., Shaker P., Phasha M. G. (2011). Using remotely sensed imagery to monitor savanna rangeland deterioration through woody plant proliferation: A case study from communal and biodiversity conservation rangeland sites in Mokopane, South Africa. Environ. Monit. Assess. 176 (1–4), 293–311. doi: 10.1007/s10661-010-1583-4
Musetsho K. D., Chitakira M., Nel W. (2021). Mapping land-use/land-cover change in a critical biodiversity area of South Africa. Int. J. Environ. Res. Public Health 18 (19), 10164. doi: 10.3390/ijerph181910164
Nackley L. L., Betzelberger A., Skowno A., West A. G., Ripley B. S., Bond W. J., et al. (2018). CO2 enrichment does not entirely ameliorate Vachellia karroo drought inhibition: A missing mechanism explaining savanna bush encroachment. Environ. Exp. Bot. 155, 98–106. doi: 10.1016/j.envexpbot.2018.06.018
Ngambu S., Muchenje V., Marume U. (2013). Effect of Acacia karroo supplementation on growth, ultimate pH, colour and cooking losses of meat from indigenous Xhosa lop-eared goats. Asian-Australasian J. Anim. Sci. 26 (1), 128–133. doi: 10.5713/ajas.2012.12046
Nielsen D. (2016). Tree boosting with XGBoost, Master’s Thesis (Norway: Norwegian University of Science and Technology). doi: 10.1111/j.1758-5899.2011.00096.x
Nikhil Raj P. P., Azeez P. A. (2012). Trend analysis of rainfall in Bharathapuzha River basin, Kerala, India. Int. J. Climatol. 32 (4), 533–539. doi: 10.1002/joc.2283
O’Connor T. G., de Ridder C. H., Hobson F. O. (2010). Aspects of the seed ecology of Acacia karroo in the Eastern Cape, South Africa. Afr. J. Range Forage Sci. 27 (2), 77–87. doi: 10.2989/10220119.2010.502647
O’Connor T. G., Puttick J. R., Hoffman M. T. (2014). Bush encroachment in southern Africa: Changes and causes. Afr. J. Range Forage Sci. 31 (2), 67–88. doi: 10.2989/10220119.2014.939996
O’Connor T. G., van Wilgen B. W. (2020). “The impact of invasive alien plants on rangelands in South Africa,” in Biological Invasions in South Africa, 1st edn. Eds. van Wilgen B., Measey J., Richardson D., Wilson J., Zengeya T. (Cham, Switzerland: Springer), 459–487. doi: 10.1007/978-3-030-32394-3_16
Palmer A. R., Bennett J. E. (2013). Degradation of communal rangelands in South Africa towards an improved understanding to inform policy. Afr. J. Range Forage Sci. 30 (1&2), 37–41. doi: 10.2989/10220119.2013.779596
Paolini L., Grings F., Sobrino J., Jiménez Muñoz J. C., Karszenbaum H. (2006). Radiometric correction effects in Landsat multi-date/multi-sensor change detection studies. Int. J. Remote Sens. 27 (4), 685–704. doi: 10.1080/01431160500183057
Paul B. K., Rashid H. (2017). “Land use change and coastal management,” in Climatic Hazards in Coastal Bangladesh., 1st edn. Eds. Paul B.K., Rashid H. (Amsterdam, Netherlands: Elsiever), 183–207. doi: 10.1016/b978-0-12-805276-1.00006-5
Phaliso S. (2021) Over 100 villages in Raymond Mhlaba without water. Available at: https://elitshanews.org.za/2021/08/17/over-100-villages-in-raymond-mhlaba-without-water/.
Prieto-Amparan J. A., Villarreal-Guerrero F., Martinez-Salvador M., Manjarrez-Domínguez C., Santellano-Estrada E., Pinedo-Alvarez A. (2018). Atmospheric and radiometric correction algorithms for the multitemporal assessment of grasslands productivity. Remote Sens. 10 (2), 219. doi: 10.3390/rs10020219
Puttick J. R., Hoffman M. T., Gambiza J. (2014). The influence of South Africa’s post-apartheid land reform policies on bush encroachment and range condition: A case study of Fort Beaufort’s municipal commonage. Afr. J. Range Forage Sci. 31 (2), 135–145. doi: 10.2989/10220119.2014.880943
Raubenheimer S. L., Ripley B. S. (2022). CO2-stimulation of savanna tree seedling growth depends on interactions with local drivers. J. Ecol. 110 (5), 1090–1101. doi: 10.1111/1365-2745.13863
Sandhage-Hofmann A., Kotzé E., van Delden L., Dominiak M., Fouché H. J., van der Westhuizen H. C., et al. (2015). Rangeland management effects on soil properties in the savanna biome, South Africa: A case study along grazing gradients in communal and commercial farms. J. Arid Environ. 120, 14–25. doi: 10.1016/j.jaridenv.2015.04.004
Scogings P., de Bruyn T., Vetter S. (1999). Grazing into the future: Policy making for South African communal rangelands. Dev. South. Afr. 16 (3), 403–414. doi: 10.1080/03768359908440088
Sen P. K. (1968). Estimates of the regression coefficient based on Kendall’s Tau. J. Am. Stat. Assoc. 63 (324), 1379–1389. doi: 10.1080/01621459.1968.10480934
Sharafatmandrad M., Mashizi A. K. (2021). Linking ecosystem services to social well-being: an approach to assess land degradation. Front. Ecol. Evol. 9 (May). doi: 10.3389/fevo.2021.654560
Skowno A. L., Thompson M. W., Hiestermann J., Ripley B., West A. G., Bond W. J. (2017). Woodland expansion in South African grassy biomes based on satellite observations, (1990–2013): general patterns and potential drivers. Global Change Biol. 23 (6), 2358–2369. doi: 10.1111/gcb.13529
Song W., Deng X. (2017). Land-use/land-cover change and ecosystem service provision in China. Sci. Total Environ. 576, 705–719. doi: 10.1016/j.scitotenv.2016.07.078
Story R. (1952). “A botanical survey of the Keiskammahoek district,” in Department of Agriculture., 1st edn. Ed. Story R. (Grahamstown, South Africa: Department of Agriculture).
Tokozwayo S., Gulwa U., Thubela T., Nyangiwe N., Mopipi K. (2018). Pastoralists perceptions on the impact of Vachellia karrooencroachment in communal rangelands of the Eastern Cape, South Africa. J. Agric. Ext. Rural Dev. 10 (11), 222–233. doi: 10.5897/jaerd2018.1001
Tokozwayo S., Thubela T., Mthi S., Nyangiwe N., Khetani T. L., Gulwa U., et al (2021). Evaluation of communal rangeland condition under the East Griqualand veld type of Eastern Cape Province, South Africa. Appl. Anim. Husb. Rural Dev. 14, 1–8. Available at: https://www.sasas.co.za/wp-content/uploads/2021/02/Tokozwayo-S_2021-Vol-14-1.pdf.
Trollope W. S. W. (1983). Control of bush encroachment with fire in the arid savannas of southeastern Africa (Pietermaritzburg, South Africa: University of KwaZulu Natal).
Venter Z. S., Cramer M. D., Hawkins H. J. (2018). Drivers of woody plant encroachment over Africa. Nat. Commun. 9 (1), 1–7. doi: 10.1038/s41467-018-04616-8
Verdoodt A., Ranst E.V., Averbeke W.V. (2003). Modelling crop production for yield gap analysis under semiarid conditions in Guquka, South Africa. Soil Use Manage. 19, 372–380. doi: 10.1079/SUM2003216
Von Fintel D., Pienaar L. (2016). Small-scale farming and food security: The enabling role of cash transfers in South Africa’s former homelands Vol. 10377 (Bonn, Germany: IZA Discussion Paper). doi: 10.22004/ag.econ.211916
von Maltitz G. P., Gambizo J., Kellner K., Rambau T., Lindeque L., Kgope B. (2019). Experiences from the South African land degradation neutrality target setting process. Environ. Sci. Policy 101, 54–62. doi: 10.1016/j.envsci.2019.07.003
Wang F., Shao W., Yu H., Kan G., He X., Zhang D., et al. (2020). Re-evaluation of the power of the Mann-Kendall test for detecting monotonic trends in hydrometeorological time series. Front. Earth Sci. 8, 1–12. doi: 10.3389/feart.2020.00014
Wang S., Zhang L., Zhang H., Han X., Zhang L. (2020). Spatial-temporal wetland landcover changes of Poyang Lake derived from landsat and HJ-1A/B data in the dry season from 1973-2019. Remote Sens. 12 (10), 1595. doi: 10.3390/rs12101595
Watson H. K. (2001). “Soil sustainability and land reform in South Africa,” in Conacher A. ed. Land degradation (Dordrecht, Netherlands: Springer), pp. 153–166. doi: 10.1093/acprof:oso/9780199689248.003.0050
Wigley B., Bond W., Hoffman M. (2009). Bush encroachment under three contrasting land-use practices in a mesic South African Savanna. Afr. J. Ecol. 47 (s1), 62–70. doi: 10.1111/j.1365-2028.2008.01051.x
Willemen L., Crossman N. D., Quatrini S., Egoh B., Kalaba F. K., Mbilinyi B., et al. (2018). Identifying ecosystem service hotspots for targeting land degradation neutrality investments in south-eastern Africa. J. Arid Environ. 159, 75–86. doi: 10.1016/j.jaridenv.2017.05.009
Wolka K., Mulder J., Biazin B. (2018). Effects of soil and water conservation techniques on crop yield, runoff and soil loss in sub-Saharan Africa: A review. Agric. Water Manage. 207 (May), 67–79. doi: 10.1016/j.agwat.2018.05.016
Wonga M., Hamisai H., Wisemen C. (2021). Monitoring changes in land-use and land-cover to ascertain the nature, causes and extent of degradation in the savannahs of Raymond Mhlaba Local Municipality, Eastern Cape, South Africa. Int. J. Environ. Stud. (Routledge), 79 (1), 19–36. doi: 10.1080/00207233.2021.1886557
Keywords: land cover change, ecosystem services, communal land, rangeland, Vachellia karroo
Citation: Masiza W, Hamandawana H, Chirima JG, Khoboko P and Parkies N (2023) The extent, perceived causes and impacts of land use and land cover change in Tyhume Valley, South Africa. Front. Conserv. Sci. 4:1205750. doi: 10.3389/fcosc.2023.1205750
Received: 14 April 2023; Accepted: 10 August 2023;
Published: 25 August 2023.
Edited by:
Zahn Munch, Stellenbosch University, South AfricaReviewed by:
Dessalegn Obsi Gemeda, Jimma University, EthiopiaMichael Nones, Polish Academy of Sciences, Poland
Copyright © 2023 Masiza, Hamandawana, Chirima, Khoboko and Parkies. This is an open-access article distributed under the terms of the Creative Commons Attribution License (CC BY). The use, distribution or reproduction in other forums is permitted, provided the original author(s) and the copyright owner(s) are credited and that the original publication in this journal is cited, in accordance with accepted academic practice. No use, distribution or reproduction is permitted which does not comply with these terms.
*Correspondence: Wonga Masiza, bWFzaXphd0BhcmMuYWdyaWMuemE=