 Marjorie C. Lyssikatos*
 Frederick W. Wenzel†
- Protected Species Division, Northeast Fisheries Science Center, NOAA Fisheries, Woods Hole, MA, United States
Northwest Atlantic harbor (Phoca vitulina vitulina) and gray (Halichoerus grypus atlantica) seal populations are recovering from early to mid-20th century exploitation, increasing their biological interactions and bycatch in Northeastern US commercial fisheries. We evaluated the seals’ diet composition and compared their prey to commercial catches to assess trophic overlap and potential competition with commercial fisherman target catches. We obtained 148 harbor and 178 gray seal stomach samples from bycatch events that occurred between 2004 and 2018. We learned from the hard part remains that the majority of seals bycaught are young-of-the-year (≤12 months old) that consume a wide breadth of prey across three trophic groups. There was a general dichotomy in extrinsic factors associated with seal diet in which 45% trophic niche separation was explained by non-overlapping harbor and gray seal phenology and pup haul-out locations that are adjacent to active fishing areas. Prey size estimated from fish otoliths and squid beaks recovered from stomach contents showed that gray seals consumed larger prey than harbor seals and prey sizes from both seals showed limited overlap with prey sizes caught by commercial gillnet fishermen. The most important prey to both seals included large (>20 cm) and small (≤20 cm) silver hake (Merluccius bilinearis), (≤40 cm) red hake (Urophycis chuss), gulf stream flounder (Citharichthys arctifrons), medium (21–40 cm) white hake (Urophycis tenuis), and (<50 cm) Atlantic cod (Gadus morhua). Important prey to harbor seals that did not overlap with gray seals were Acadian redfish (Sebastes fasciatus), Atlantic herring (Clupea harengus), longfin (Doryteuthis pealeii), and shortfin squid (Illex illecebrosus). They contrasted with prey important to gray seals that did not overlap with harbor seals: yellowtail flounder (Limanda ferruginea), sand lance (Ammodytes spp.), Urophycis spp., and fourspot flounder (Hippoglossina oblonga). Despite the potential bias associated with opportunistic bycatch sampling, this study demonstrates the importance and value of utilizing carcasses retained from bycatch events, is complimentary to newer methodologies (i.e., DNA meta-barcoding), and fills data gaps in our understanding of the role recovering harbor and gray seal populations have on Northeastern US regional food webs.
Introduction
Fishery bycatch is broadly defined as the incidental capture or discard of any living marine organism, including unobserved mortality, due to direct encounters with fishing vessels and gear (NMFS, 2016a). Bycatch of seals has been documented in several Northeastern US commercial fisheries where bycatch events can provide temporal and spatial context for analysis of seal distribution (Chavez-Rosales et al., 2018; Hayes et al., 2021; Precoda and Orphanides, 2022). Time and space are important factors in evaluating the diet of seals because of their life history where foraging patterns are largely dictated by the timing and location of reproduction and movements of their prey (Beck et al., 2007; Russell et al., 2015; Scharff-Olsen et al., 2018).
The western North Atlantic gray and harbor seal populations extend from eastern Canada to the mid-Atlantic US. Due to the semi-aquatic and wide-ranging movements of harbor (Phoca vitulina vitulina) and gray seals (Halichoerus grypus atlantica), utilizing dead specimens retained opportunistically from fishery bycatch events is a valuable resource because they provide rare insight to marine mammal trophic ecology that is otherwise difficult to obtain (Craddock et al., 2009; Wenzel et al., 2013; Orphanides et al., 2020). Williams (1999) and Ampela (2009) presented the first accounts of Northwest Atlantic harbor and gray seal diet utilizing stomach sample hard part remains obtained from Northeastern US incidental bycatch events (1991–2008). Our research will expand the time series by building off later research completed by Wenzel et al. (2015, 2017) including additional sampling from bycatch collected through 2018.
Cape Cod, coastal Maine, and nearby islands are home to several harbor and gray seal breeding colonies. These regions are adjacent to some of the most productive fishing grounds in the Northeastern US (NEFSC, 2023). Consequently, the resurgence of these transboundary seal populations has led to perceived competition for economically valuable prey between commercial fishermen and seals (Guerra, 2019; Behnke, 2021). While gray seals are exhibiting exponential rates of growth, there is increasing evidence of interspecific competition with gray seals outcompeting harbor seals for mutually desirable habitat and prey resources (Pace et al., 2019; Hayes et al., 2021; Wood et al., 2022). This could be contributing to an apparent decline or slowed growth of the Northwest Atlantic harbor seal population (Bowen et al., 2003; Johnston et al., 2015; Russell et al., 2015; Ampela et al., 2018; Jones et al., 2018; Pace et al., 2019; Wilson and Hammond, 2019; Hayes et al., 2021; Sigourney et al., 2022). Improving our understanding of forage diversity and consumption supporting the population growth of Northwest Atlantic harbor and gray seals is necessary to evaluate the magnitude of competition for both managed and protected resources in the Northeastern US region (Kusnierz et al., 2014; Hui et al., 2015; Swain and Benoît, 2015; Chasco et al., 2017). It is also necessary to improve our knowledge on key predator–prey linkages fundamental to the development of ecosystem-based fisheries management plans (Yodzis, 2001; Plaganyi and Butterworth, 2009; Fogarty, 2013; Free et al., 2021).
The success of the US Marine Mammal Protection Act of 1972 as amended (MMPA) has created a new set of challenges for natural resource managers (Gazit et al., 2013; Roman et al., 2013; Ferretti et al., 2015; Marshall et al., 2015; Jackman et al., 2018; Cammen et al., 2019; Guerra, 2019). Since the implementation of the MMPA, the US Northwest Atlantic harbor and gray seal populations have been recovering from near extirpation status. These species were considered extirpated from New England waters in the 1960s due to bounty hunting and overharvesting from legal hunting practices in coastal New England and Canadian provinces (Lelli et al., 2009). With the moratorium on the hunting of seals implemented under the MMPA, the recolonization of harbor and gray seals has been documented on several coastal beaches and islands throughout the Northeastern US and Canadian maritime region (Gilbert et al., 2005; Pace et al., 2019; den Heyer et al., 2020; Wood et al., 2020; Hayes et al., 2021; Sigourney et al., 2022).
The recovery of seals in Northeastern US waters has led to unintended negative interactions with stakeholder groups that range from landowners concerned about perceived impact on water quality around seal haul-out/pupping sites and beachgoers heightened awareness of sharks foraging in waters in search of seal prey adjacent to popular tourist beaches (Skomal et al., 2012; Bass et al., 2016; Jackman et al., 2018). Northwest Atlantic gray seal bycatch was over 2,000 individuals in 2019, the highest recent marine mammal bycatch in the US (Martins et al., 2019; Hayes et al., 2021). Increasing bycatch has also contributed to evidence of depredation due to apparent competition for resources that fishermen target for commercial and personal consumption and seals target to support their growth (Kaschner and Pauly, 2005; Konigson et al., 2009; Plaganyi and Butterworth, 2009; Rafferty et al., 2012; Gruber, 2014; Cosgrove et al., 2015; Sirak, 2015; Trull, 2015; Byron and Morgan, 2016).
The increasing interactions between recovering seal populations and fishermen are not unique to the Northeastern US. On the West Coast of the US, recovering seal populations have been blamed for impeding the recovery of protected salmon species (Chasco et al., 2017; Nelson et al., 2019). In Atlantic Canada, the Atlantic cod (Gadus morhua) has not recovered after two decades of moratorium on commercial harvest, and some of this decline has been attributed to predation by seals (Trzcinski et al., 2006; O’Boyle and Sinclair, 2012; Hammill et al., 2014; Neuenhoff et al., 2019; Rossi et al., 2021). In the Northeast Atlantic, Cook et al. (2015) stated that gray seal predation on Atlantic cod could impede recovery from overharvest by commercial fishing practices. In the Baltic Sea, researchers have documented economic losses to fishermen due to depredation and whole consumption of cod and salmon catches (Konigson et al., 2009, 2013).
The perceived increase in competition between marine mammal populations and fisheries has spurred new debate to legalize culling of seals in Northeastern US waters (Butterworth et al., 1988; Yodzis, 2001; Bowen and Lidgard, 2011; Schakner et al., 2016). However, contrasting studies suggest that changing environmental conditions and high fishing mortality outweigh the impact of natural mortality by predation from increasing higher trophic level predator populations (Kaschner and Pauly, 2005; Nye et al., 2013; Costalago et al., 2019). Furthermore, there is also evidence that marine mammal recovery has a positive impact on ecosystem health and trophic interactions potentially benefiting commercial fisheries (Trites et al., 1997; Morissette et al., 2012; Roman et al., 2013; Bass et al., 2016; Byron and Morgan, 2016). Thus, improving our understanding of the diversity and magnitude of seal prey consumption will move society further down the roadmap of an ecosystem-based approach to fisheries management (NMFS, 2016b; Gaichas et al., 2018).
Direct measurement of feeding by marine mammals in the wild is limited due to the nature of their habitat and how they interact with their environment (Boyle, 1997; Heithaus and Dill, 2009). Although pinnipeds spend a portion of their lives hauled out on land, they generally spend that time resting, mating, giving birth, and providing natal care. Consequently, scientists are mostly limited to indirect sampling approaches (e.g., hard part remains, stable isotopes, DNA, and fatty acids) to estimate the diet of marine mammals (Bowen and Iverson, 2013). There has been a growing body of literature from the Northeastern US region utilizing stable isotope and DNA techniques to infer the diet of US Northwest Atlantic gray seals. Hernandez et al. (2019a, 2019b) and Lerner et al. (2018) report the difficulty in obtaining taxonomic prey resolution using stable isotopes for a generalist predator. Ono et al. (2019) and McCosker et al. (2020) found several prey items present in Northwest Atlantic gray seal diet utilizing DNA techniques. However, obtaining estimates of prey abundance and biomass from DNA is still in the developmental stages (Deagle et al., 2018; Shelton et al., 2023). Consequently, there is uncertainty in 1) the relative magnitude of consumption and changes over time among prey types by Northwest Atlantic harbor and gray seals, 2) their interspecies prey foraging patterns, and 3) their competition with commercial fishermen for similar prey. In comparison to stable isotopes and DNA techniques, utilizing hard part remains obtained from seal scat and gastrointestinal samples provides an indirect and relatively inexpensive approach to investigate marine mammal diets. However, they are also not immune to sources of bias (e.g., digestive erosion of hard parts, poor evidence of depredation and scavenging, differential retention rates). Nonetheless, the use of hard part remains to infer the diet of marine mammals is extensively documented in the literature as providing high taxonomic resolution in conjunction with estimates of relative abundance and biomass of prey consumed. Pierce and Boyle (1991) and Bowen and Iverson (2013) provide comprehensive summaries with the pros and cons of indirect methods applied to the study of marine mammal diets.
Our primary aim with this research is to utilize stomach samples obtained opportunistically from harbor and gray seal commercial fishery bycatch events to improve our understanding of the foraging habits of Northwest Atlantic harbor and gray seals and their dietary role in the Northeastern US region ecosystems. The objectives of this study are to 1) quantify the mean length and weight, relative abundance, and biomass of prey consumed by harbor and gray seals using hard parts extracted from the stomachs of bycaught seals; 2) evaluate temporal, spatial, and seal demographic characteristics that may affect diet composition; 3) identify important prey and the magnitude of trophic niche overlap between the two seal species; and 4) compare the size distribution of prey consumed by these seals to the size of prey in commercial catches. Results from this study are expected to improve our scientific understanding of the extent of foraging and harvest competition for commercially important prey resources among these three predators: harbor seals, gray seals, and commercial fishermen.
Materials and methods
Bycatch
The NOAA’s Northeast Fisheries Observer Program provides one of the most comprehensive interdisciplinary science at-sea fishery-dependent data collection programs in the Nation (NMFS, 2011; Benaka, 2021). We used contracted fisheries observers to support the opportunistic collection of incidentally captured harbor and gray seal carcasses for subsequent necropsy. Necropsies provide rare and valuable insight into the health and demography of these semi-aquatic animals (Pugliares et al., 2007). All specimens obtained from bycatch events were collected and sampled in accordance with regulations pursuant to the Marine Mammal Protection Act.
Stomach sample collection and processing
From 2004 to 2018, 326 seals were retained from observed bycatch events by the observers (94%) and incidental to cooperative industry-government research studies or agreements (6%). Whole fresh dead seals returned to shore were either put in a chiller and subsequently necropsied within 24–72 h or put in a freezer for necropsy at a later date.
Necropsies were primarily conducted at the Woods Hole Oceanographic Institute Marine Research Facility. During necropsy sessions, whole stomachs were extracted from the seal carcasses, and animal sex, weight, length, and overall body condition (e.g., robust, thin, and emaciated) were recorded. Stomachs were initially tied off at both ends of the stomach; the esophagus, the (top) entrance to the stomach, and the pyloric region near the bottom of the stomach and at the intersection of the large intestine were subsequently frozen at −10°C for future analysis. Intestinal and colonic contents were not examined. Stomachs were thawed and cut open over a large container to prevent loss of content, the stomach lining was rinsed, and all contents were emptied into a small plastic tub and eluted with hot water for analysis. Prior to eluting stomach contents, any evidence of non-trace (whole or semi-intact prey with skulls) prey items was removed, separated, identified, and measured (standard length for fishes). Otoliths were removed from the skull of non-trace and trace (free floating otoliths and cephalopod beaks) fishes, cleaned, and dried. The eluted stomach content samples were continually rinsed separating soft tissue from hard part remains (Craddock et al., 2009). All otoliths and cephalopod beaks found were separated and dried for identification using Campana (2004); McBride et al. (2010), and in-house reference guides. All non-trace and trace prey remains were identified to the lowest taxonomic group possible. Evidence of elasmobranch species (i.e., sharks, skates, and rays) was noted as either present or absent. Cephalopod beaks were not stored in an air-tight or oil-based solution and, consequently, were subject to shrinkage due to dry storage conditions. As a result, cephalopod beaks were not measured, and they were counted (uppers versus lowers) with the higher number of the two as the minimum number of cephalopods consumed (see steps 1–4 of Supplementary Figure S1).
Otolith sorting, subsampling, measurements, and other hard part remains
Fish otoliths (by species, family, or genus) were sorted into four condition categories: 1) pristine or near pristine otoliths [pristine otoliths come from non-trace prey items (whole fish or intact skulls)]; 2) trace otoliths with only mild/moderate degradation margin erosion; 3) trace otoliths with advanced erosion, with tips or margins worn down; and 4) broken trace otoliths. Within-sample (i.e., stomach) otoliths with minor erosion (within prey species) were subsampled if there were >30 but fewer than 120 structures. If there were ≥120 otoliths with minor erosion, 25% of those structures were randomly selected for measurement. Pristine otoliths and those with minor erosion were measured with digital calipers to the nearest 0.01 mm. Broken otoliths and those with major erosion were not measured. Broken otoliths were counted only if uniquely identified as belonging to one structure. Multiple broken pieces that could not be pieced together were not counted (Bowen and Harrison, 1994, 1996; Hammill et al., 2007; Wilson and Hammond, 2019); see steps 5–9 of Supplementary Figure S1). A total of 5,499 otoliths were processed. Fewer than 10% of otoliths were unmeasurable (Supplementary Table S1).
Estimating the minimum number of individual prey consumed
The count of individual prey consumed by individual seals in this study is treated as a minimum number of individuals because it does not 1) include the number of elasmobranch species consumed when found present, 2) account for possible loss due to digestion (e.g., fragile and highly digestible Clupeid spp.) or otoliths not located due to stomach processing procedures (e.g., digestive tracts were not processed) or missing small otoliths (e.g., sand lance), 3) account for depredation where heads of prey are not consumed, and 4) account for evidence of prey based on fish bones and soft tissue that were not enumerated for this study (Pierce and Boyle, 1991; Bowen and Harrison, 1994; Orr et al., 2004; Hammill et al., 2007; Bowen and Iverson, 2013).
For each seal stomach (sampling unit), pristine otoliths and those with minor erosion were paired (left and right) to the extent possible. The minimum number of individual (minimum number) prey present was determined by counting the number of pairs and single (left or right) otoliths (assumed to be unique individuals; Bowen and Harrison, 1996; Hammill et al., 2007; Wenzel et al., 2013). For unpaired subsampled otoliths with minor erosion, the Microsoft Corporation (2016) Excel Data Analysis ToolPak (sample function) was used to reconstruct a full sample of otolith lengths from the subsampled data (10% of stomach samples included subsampled otoliths). Reconstructed otolith lengths were randomly reduced by 50%, and those individual (not paired) otolith lengths were used to infer the minimum number of otoliths with minor erosion and prey sizes from the subsampled data. This step was necessary because, unlike the non-subsampled data, the subsampled otoliths with minor erosion were not paired so an estimate of the minimum number of prey could not be determined and subsequently not available to estimate prey length for this group of otoliths. For broken otoliths and those with major erosion, the aggregate counts of otoliths within sampling units and prey species were divided in half to estimate the minimum number. The minimum number of prey species consumed by each seal is the sum of the minimum number across all four otolith condition categories and cephalopods. See Supplementary Figure S1 for a detailed flowchart of the methodology estimating the minimum number consumed by harbor and gray seals.
Estimating seal prey size and weight
Prey sizes are an important consideration given the size of prey that harbor and gray seals are able to consume and for comparison to mean prey size from commercial catches (Sirak, 2015; Ono et al., 2019). The mean otolith length (from pairs) or individual lengths from pristine otoliths or those with minor erosion were used to estimate individual prey length (cm) and weight (kg) using equations compiled from the literature and other data sources (Supplementary Appendices 1–2). Pristine otoliths or those with minor erosion recovered from stomach samples spend less time subject to erosive factors compared with otoliths with major erosion or fully passed through the digestive tract (e.g., recovered from scats), and thus, no otolith size correction factors were applied to the measured otolith lengths (Olesiuk et al., 1990; Bowen and Harrison, 1994, 1996; Hammill et al., 2007).
Reconstructing harbor and gray seal diets
Prey weight for the minimum number from all four otolith categories and cephalopod minimum number was required to estimate prey biomass consumed by harbor and gray seals (heretofore “seals”). Prey weight for the minimum number of pristine otoliths or those with minor erosion was directly estimated (see section above). However, the minimum number counted from broken otoliths or those with major erosion was aggregated by seal and prey species. Consequently, to estimate biomass consumed by each seal, a three-tiered matching system was used to multiply mean prey weight from pristine otoliths or those with minor erosion by the minimum number from broken otoliths or those with major erosion. Tier 1 match multiplied mean prey weight by the minimum number of broken otoliths or those with major erosion where sampling unit (seal stomach sample) and prey species match; tier II match multiplied mean prey weight from the same prey species over all sampling units within the same seal species and season by the minimum number of broken otoliths or those with major erosion from the same seal species and season; and tier III match multiplied prey weight from the same prey species over all sampling units within the same seal (ignoring season) by the minimum number of broken otoliths or those with major erosion from the same seal and prey species. The prey weight of squids was estimated by multiplying the mean prey weight (within species) derived from Ampela (2009) and Williams (1999) by its minimum number. For unidentifiable flatfish, hakes, and gadids, the mean prey weight from the same taxonomic family found within the same sampling unit (stomach sample) was applied to the unidentified flatfish, hakes, and gadid minimum number. If no match was found within the same stomach, the mean prey weight from the same taxonomic family with the same seal species, sex, age, and season was used where applicable. For unidentified species, the mean prey weight from all identified prey within the same stomach sample was applied to the unidentified minimum number. Total biomass consumed for each predator is the sum of prey weight estimated from pristine otoliths or those with minor erosion plus the sum of prey weight estimated from all three tiers of broken otoliths or those with major erosion plus prey weight from all unidentified prey categories (<1% of all identified prey items).
The reconstructed seal diet data were categorized by season (spring = March–May, summer = June–August, fall = September–November, winter = December–February), geographic region (Gulf of Maine, Georges Bank, Southern New England/Northern Mid-Atlantic), sex, and age class (pup, young-of-the-year, juvenile and adult: Table 1). Geographic regions were defined from ecological production units, which are defined areas within the Northeastern US continental shelf containing all or the majority of an ecosystem with unique biological, chemical, and physical characteristics supporting various assemblages of marine life (Gamble et al., 2016; NEFSC, 2023). The frequency of occurrence (the number of times a prey item was found in a stomach sample), abundance, and biomass consumed, as well as mean prey size (cm) and weight (kg), were summarized by the trophic guild for both harbor and gray seals. Trophic guild refers to a group of prey species that feed on similar items or have similar dietary requirements and, therefore, have a similar ecological function within the structure of an ecosystem (Adams, 1985). Organizing seal diet data by trophic guild is important to support the development of predator–prey linkages, a critical need in furthering the application of ecosystem-based fishery management in Northeastern US (Fogarty, 2013).
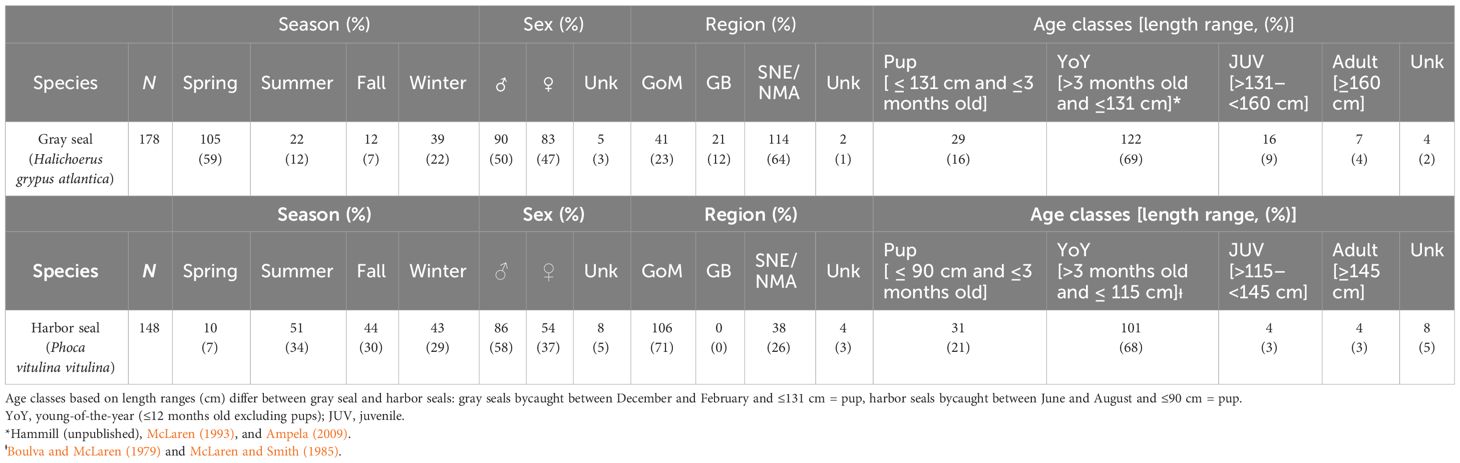
Table 1 Demographic, spatial, and temporal characteristics associated with gray (top panel) and harbor (bottom panel) seals bycaught in commercial gillnet and bottom trawl gear, years 2004–2018: GoM, Gulf of Maine; GB, Georges Bank; SNE/NMA, Southern New England/Northern Mid-Atlantic; Spring, March–May; Summer, June–August; Fall, September–November; Winter, December–February; Unk, Unknown.
Commercial catch length data
Fish length data from commercial gillnet catches (both kept and discards) obtained from NOAA’s observer program were compared to the length distribution for some of the most important prey consumed by harbor and gray seals. We used catch length data from 2004 to 2018 to match the time period of stomach samples collected. The observer program manuals detail fish biological sampling procedures on board observed commercial fishing trips (https://www.fisheries.noaa.gov/resource/document/fishery-monitoring-and-research-supplemental-documents). The reconstructed diet and commercial catch length data were prepared for subsequent statistical analyses using SAS (2016).
Statistical methods
We used the BiodiversityR (ver. 2.15-1; Kindt and Coe, 2005) and vegan (ver. 2.6-4; Oksanen et al., 2022) packages in R (ver. 4.2.2; R Core Team, 2022) to generate stomach prey community data sets and prey species accumulation curves as a function of stomach sample size, respectively. This was done to determine if we had sufficient sample sizes to evaluate diet composition (Gosch et al., 2014; Matić-Skoko et al., 2014). The relative importance of prey resources consumed was determined by the index of importance (iIMP) defined by Garcia-Rodriguez and Aurioles-Gamboa (2004) as:
where i = taxon or species, j = stomach sample, U = total number of stomach samples with prey (harbor seal U = 144; gray seal U = 143), xij = number of prey i in stomach j, and Xj = total number of prey in stomach j. The iIMP was chosen over prey occurrence: * 100, where O is the presence/absence of preyi, and prey abundance: to identify important prey in the diet. The iIMP takes both prey occurrence and abundance into account and is thereby less sensitive to large numbers of an individual taxon or species found in only a few stomachs and vice versa (Garcia-Rodriguez and de la Cruz-Aguero, 2011). Values of iIMP that were greater than 1/S (S = species richness; total number of taxa or species identified) were considered important prey (Krebs, 1999). The proportion of diet overlap and diversity were evaluated using Morisita’s (C) and Shannon–Wiener (H′) measures, respectively (Krebs, 1999).
Generalized additive models (GAMs) were used to explore temporal, spatial, seal species, sex, age, and diet diversity effects on seal consumption. The minimum number of prey items consumed is inherently variable (Supplementary Figures S2–S2A). Rather than transforming and eliminating real data outliers, a GAM with the quasi-Poisson log-link family allowed for the estimation of a dispersion parameter and non-linear effects (mgcv package; Wood, 2017).
Finally, to evaluate evidence of biological interactions for the same resources targeted by commercial fishermen, the length frequency distribution sampled from observed commercial gillnet catch composition data was compared to prey length frequency distribution estimated from the stomach contents of bycaught harbor and gray seals. Chi-square and permutation hypothesis tests were used to test differences in diet composition, meal size, and size of prey consumed by the seals and caught by commercial gillnets. All statistical analyses were performed in R-Studio (Posit Team, 2022).
Results
Seal sample characteristics
Of the 326 processed stomach samples, 148 were from harbor seals, and 178 were from gray seals (Supplementary Table S2). For both seals, sex ratios were equal (50% male harbor seal, 58% male gray seal, Table 1). Nearly 70% of stomach samples came from young-of-the-year seals followed by pups (16%–21%). Juvenile and adult sample sizes were small (<10%). The majority of gray seal samples were obtained during the spring (59%) followed by the winter, summer, and fall seasons, whereas harbor seal samples were more evenly distributed among summer, fall, and winter seasons. The majority of gray seal samples (64%) were obtained from the southern region, whereas the majority of harbor seal samples (71%) came from the Gulf of Maine region (Table 1 and Figure 1).
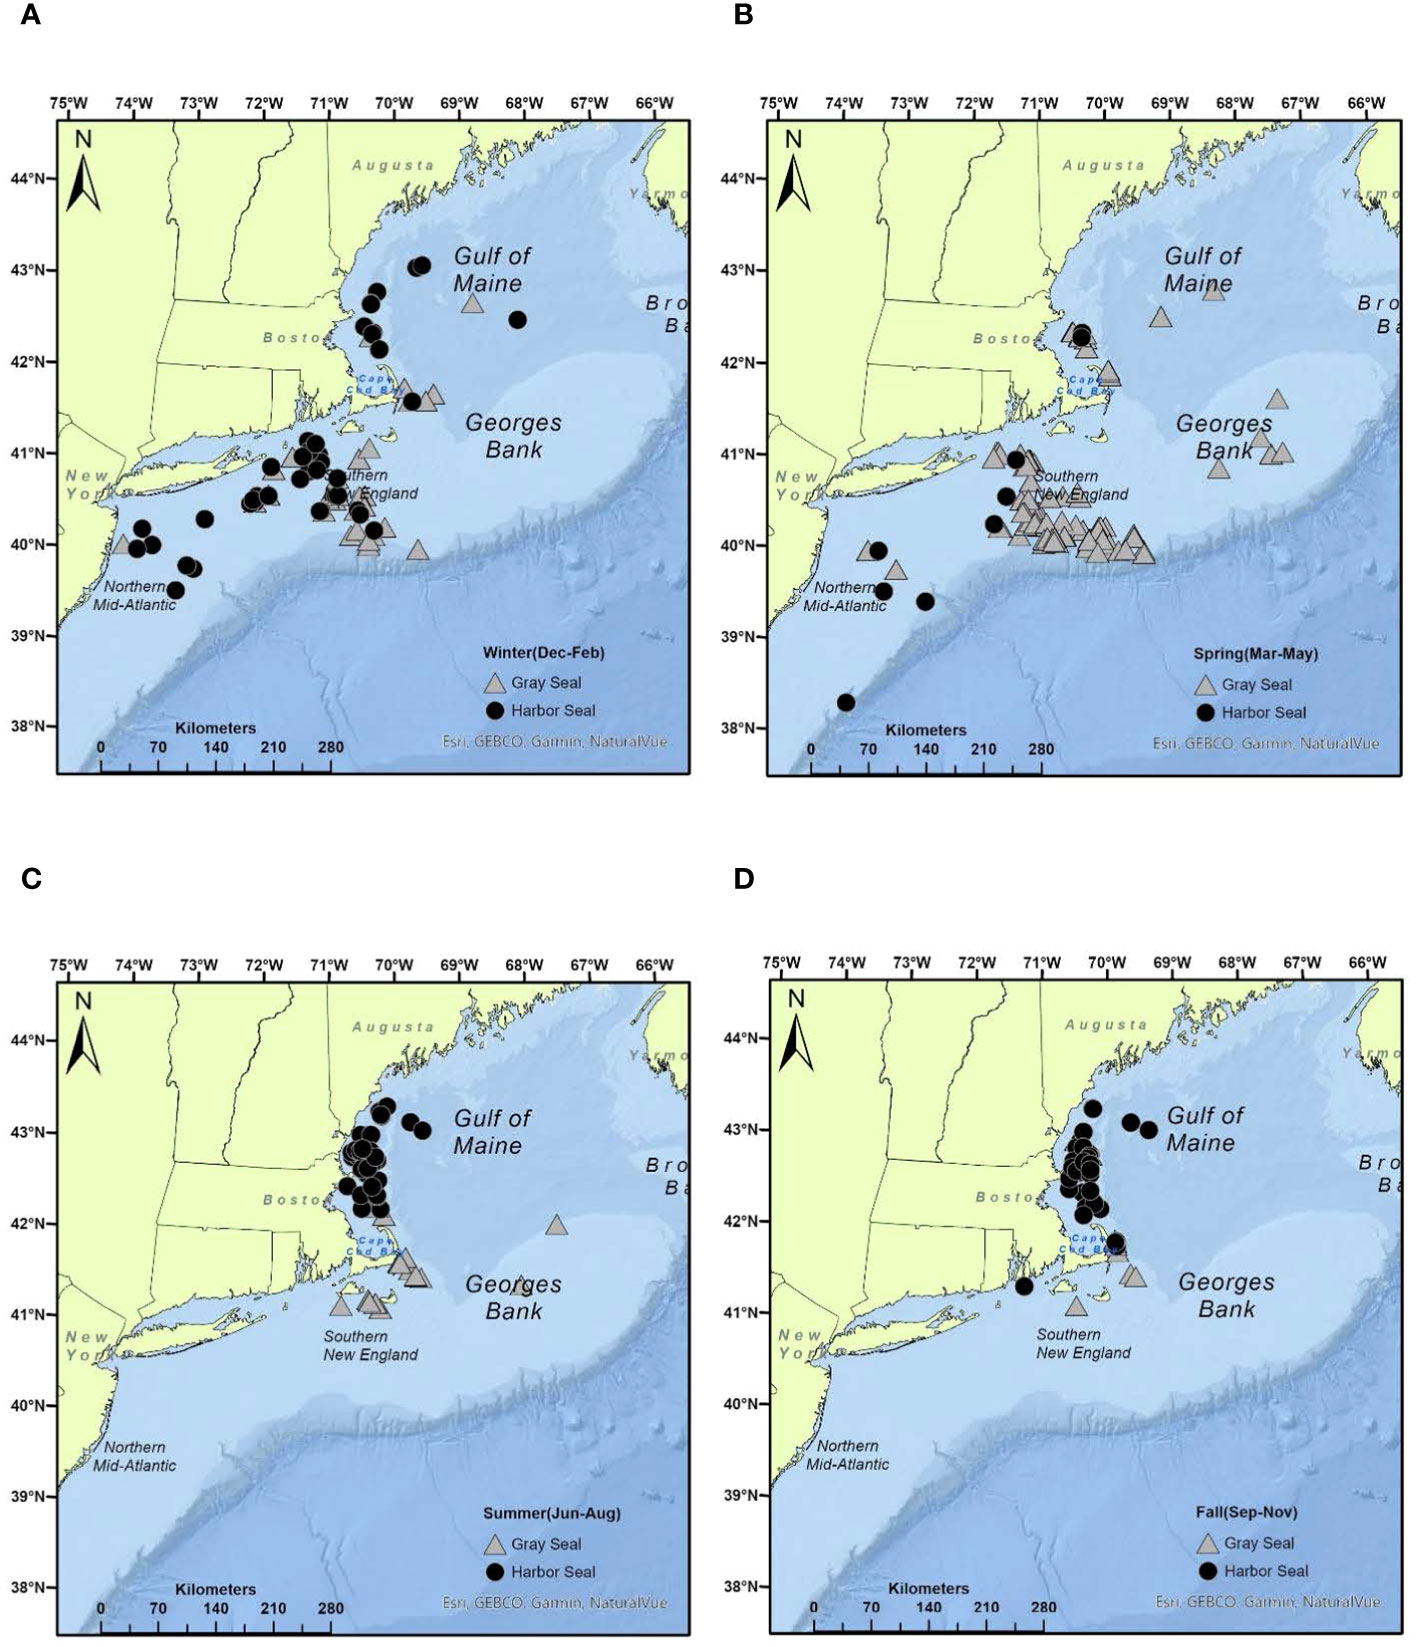
Figure 1 Seasonal distribution of harbor and gray seal stomach samples obtained from bycatch events in NEUS commercial fisheries, 2004–2018: (A) winter, (B) spring, (C) summer, (D) fall (see Supplementary Table S3 for additional details).
Diet composition, diversity, important prey, and trophic overlap
From 2004 to 2018, 31 prey species plus another 9 unidentified taxonomic groups were identified from otoliths and squid beaks, representing at least three prey trophic groups (benthivores, planktivores, and piscivores) in the diet of Northwest Atlantic harbor and gray seals (Table 2). Species accumulation curves showed diet richness leveling off for both harbor and gray seals at ~90 stomach samples (Supplementary Figure S3). Benthivorous prey occurred more frequently in gray seal stomachs, and the only planktivorous/piscivorous prey (Acadian redfish; Sebastes fasciatus) was rarely found in gray seal stomachs (χ2 = 88.71; P = 0.000; Figure 2). However, the number of prey species and trophic groups present in individual stomach samples was not affected by seal species (prey: χ2 = 10.29; P = 0.24, trophic groups: χ2 = 9.32; P = 0.05).
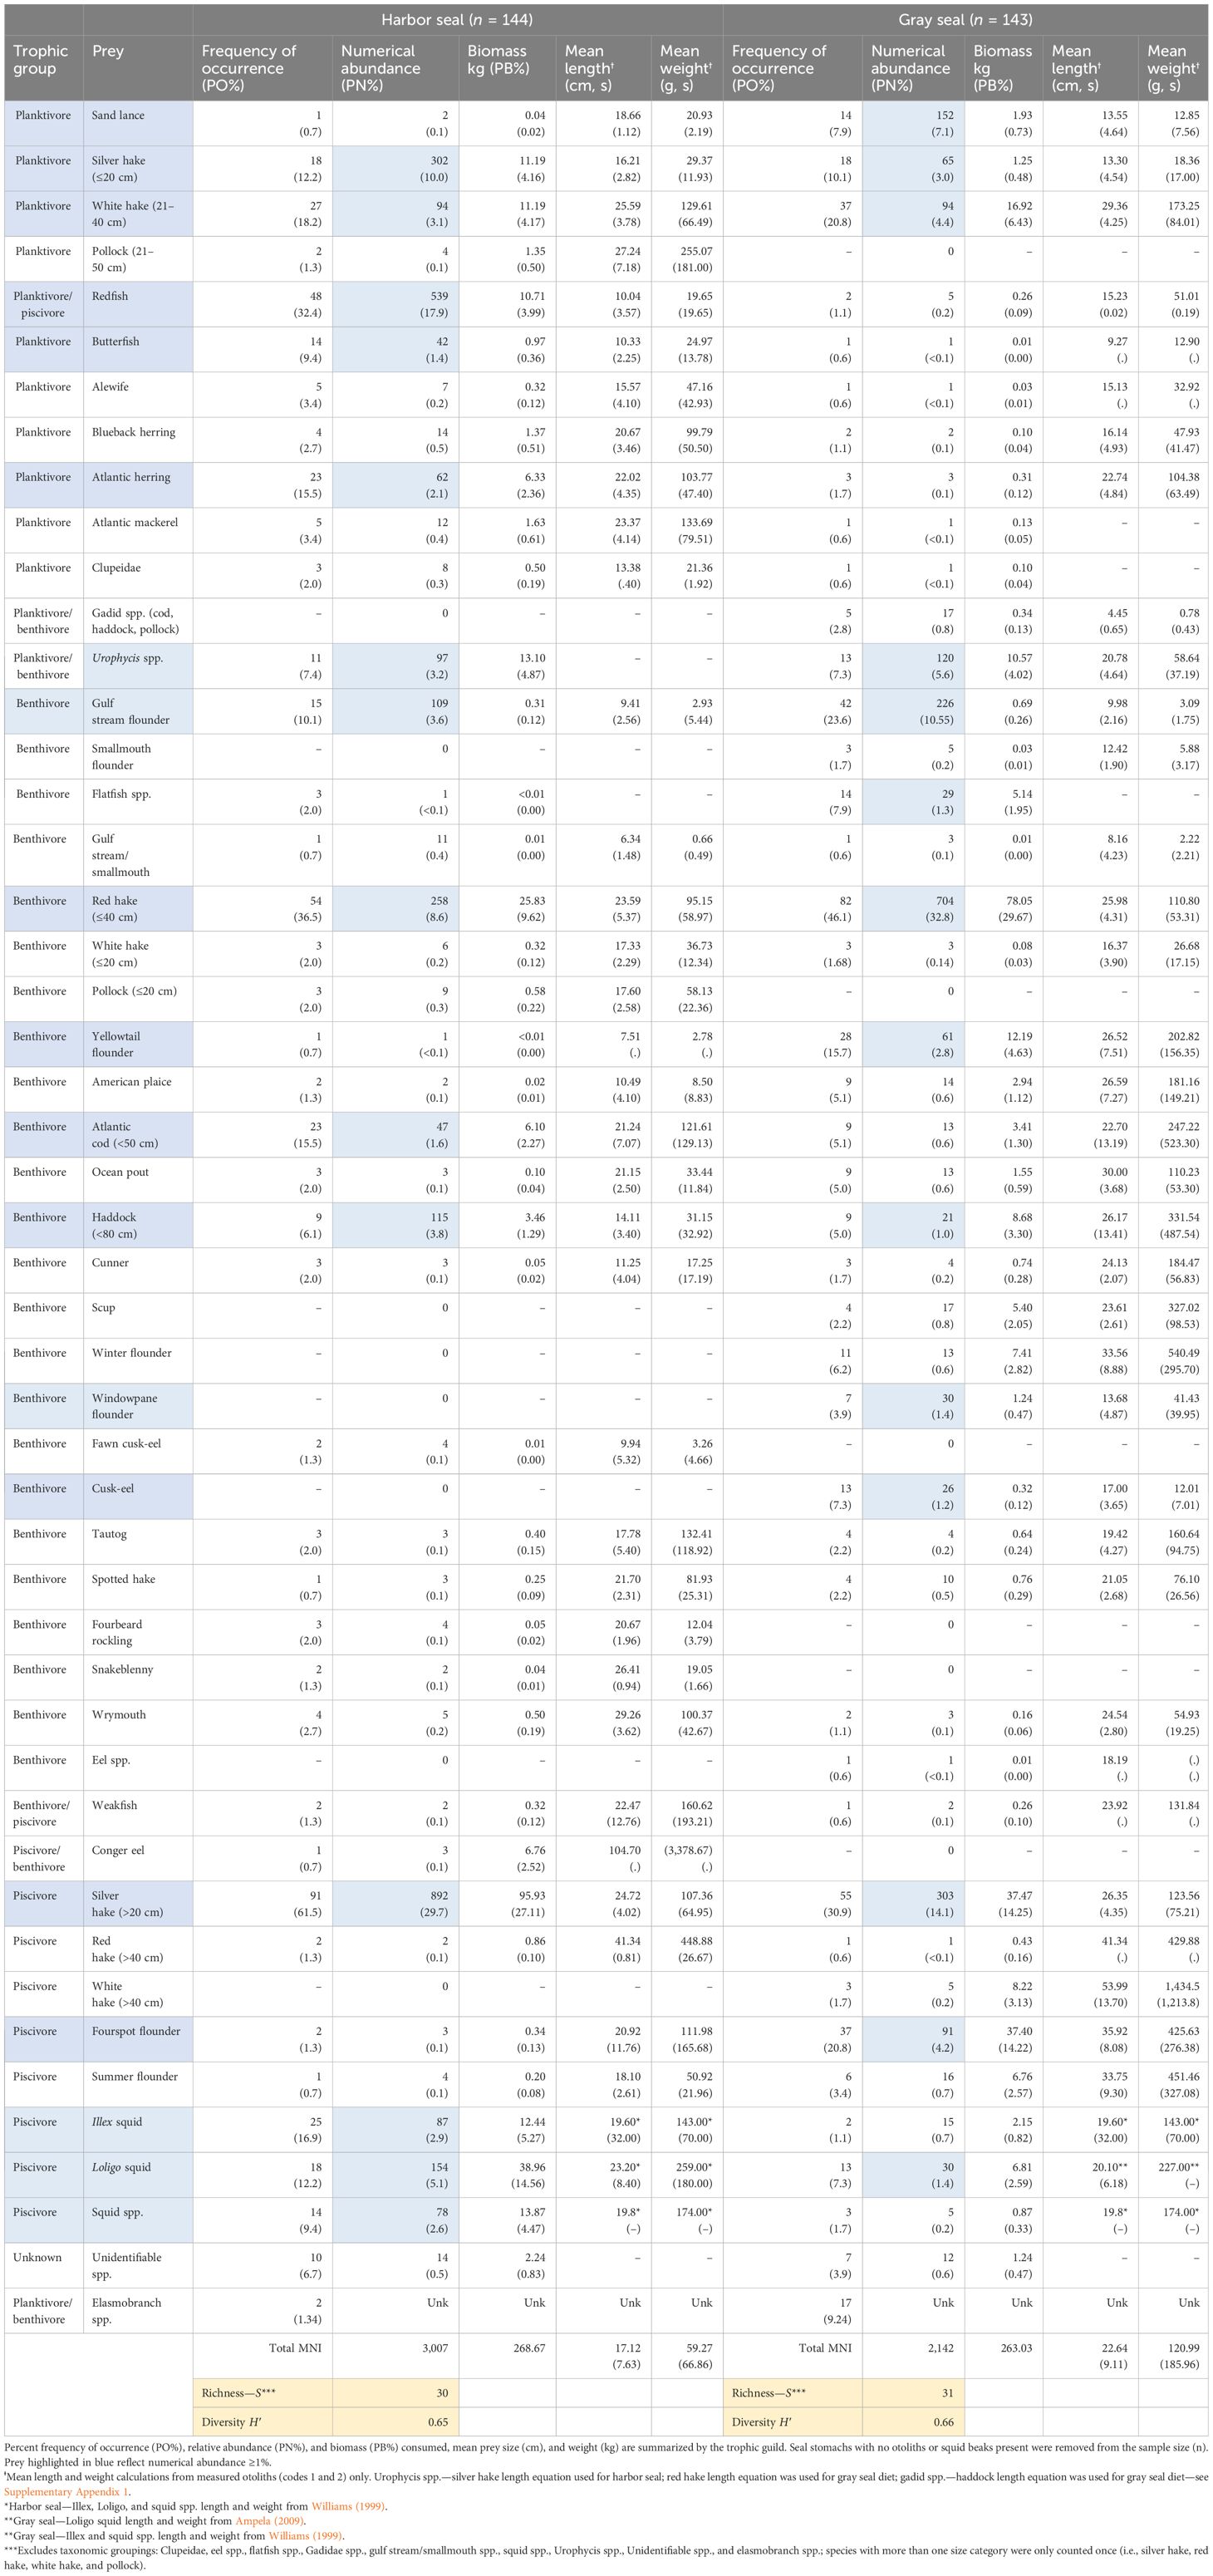
Table 2 Diet composition of harbor (Phoca vitulina) and gray (Haliochoerus grypus) seals collected from observed incidental bycatch events in NEUS Gulf of Maine, Georges Bank, and Southern New England gillnet and bottom trawl fisheries (Figure 1) between 2004 and 2018 (n, number of stomach samples; kg, kilograms; g, grams; cm, centimeters; s, standard deviation; mni, minimum number of individuals; unk, unknown).
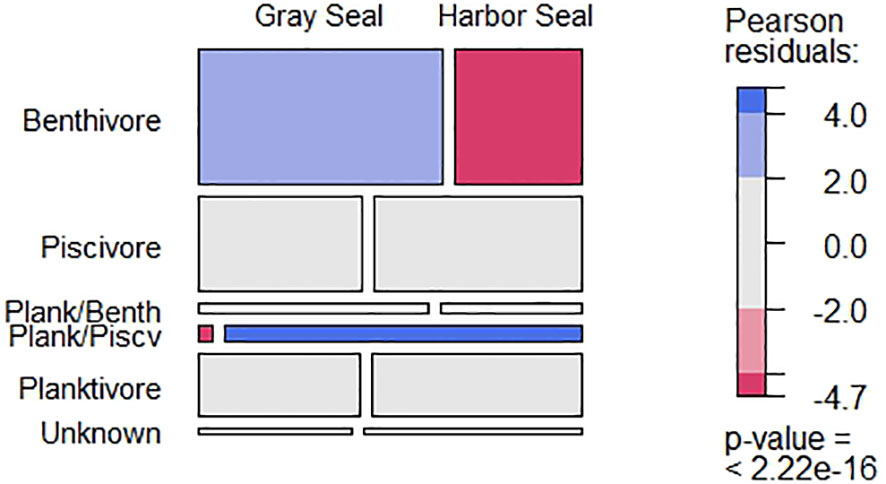
Figure 2 The frequency of occurrence among trophic groups present in harbor and gray seal stomach samples between 2004 and 2018. Block width (columns) reflects the frequency of occurrence by the seals and block height (rows) reflects the frequency of occurrence by guild. Pearson residual scale based on the chi-square test. Elasmobranch spp. and empty stomachs (i.e., stomachs with no otolith or squid beak remains) were removed.
The breadth of both seal diets was similar between harbor (H′ = 0.65) and gray seals (H′ = 0.66). Fourteen prey contributed to >1% of prey abundance consumed by harbor seals. Two size categories of silver hake (Merluccius bilinearis; ≤20 cm + >20 cm; 40% of prey abundance), redfish (18% of abundance), and ≤40 cm red hake (Urophycis chuss; 9% of abundance) were the most abundant, frequently present, and collectively contributed to 45% of the biomass consumed by harbor seals. Fourteen prey also contributed to >1% of prey abundance consumed by gray seals. Red hake (≤40 cm; 30% of prey abundance), two size categories of silver hake (≤20 cm + >20 cm; 17% of abundance), and gulf stream flounder (Citharichthys arctifrons: 11% of abundance) were the most abundant, frequently present, and collectively contributed to 45% of the biomass consumed by gray seals (Table 2).
Over the study period, the mean reconstructed harbor seal meal size (minimum number of individuals = 21) was significantly more than the reconstructed gray seal meal size (14; Tobs = 7, P = 0.003; Figure 3). However, among all the prey and their respective trophic groups consumed by both seal species, the mean prey size consumed by harbor seals was significantly smaller (18 cm) than the prey consumed by gray seals (26 cm; Tobs = −8 cm; P = 0.000; Supplementary Figures S4, S8A). This was also true for individual prey biomass where mean harbor seal prey biomass (0.06 kg) was significantly less than the mean individual prey biomass consumed by gray seals (0.15 kg; Tobs = −0.09 kg; P = 0.000; Supplementary Figure S5). Consequently, even though harbor seals consumed more individual prey, their mean meal size measured in mass (1.82 kg) was similar to gray seals (1.84 kg; Tobs = 0.02kg; P = 0.525; Figure 3 and Supplementary Figure S6). Although consumed elasmobranch species abundance and biomass could not be determined in this study, they occurred more frequently in gray seal diets compared with harbor seals (z-score = −3.06; P = 0.001; Table 2).
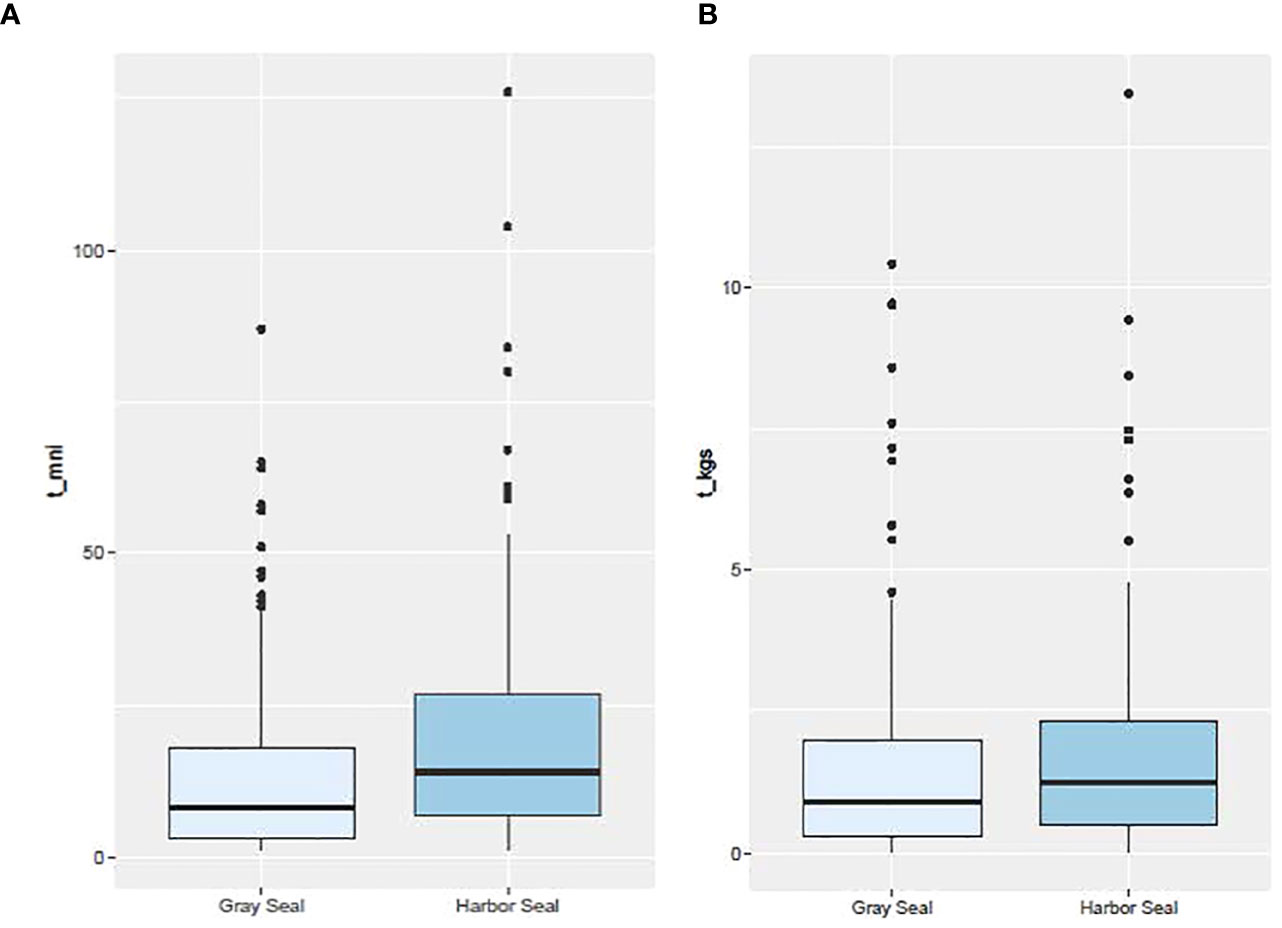
Figure 3 Box plot distribution of meal size based on (A) the minimum number of individual prey (t_mni) and (B) the biomass of those individual prey (t_kgs) by seal species. Number of stomach samples = 138 and 121 for harbor and gray seals, respectively.
When sorted by importance, the most important prey consumed by harbor and gray seals were species that had iIMP ≥2.6% (11 species) and 2.4% (10 species), respectively (Figure 4). Among these most important prey, approximately half of them overlapped between the two seals (C = 0.55). They included large (>20 cm) and small (≤20 cm) silver hake, (≤ 40cm) red hake, gulf stream flounder, medium (21–40 cm) white hake (Urophycis tenuis), and (<50 cm) Atlantic cod (Figure 4). The other half of prey with high iIMP for harbor seals that did not overlap with high iIMP to gray seals were redfish (15.4%), Atlantic herring (Clupea harengus; 4.8%), longfin squid (Doryteuthis pealeii; 4.4%), and shortfin squid (Illex illecebrosus; 4.3%). These contrasted with yellowtail flounder (Limanda ferruginea; 5.4%), sand lance (Ammodytes spp.; 5.0%), Urophycis spp. (4.4%), and fourspot flounder (Hippoglossina oblonga; 3.9%) prey with high iIMP to gray seals that did not overlap with high iIMP prey to harbor seals (Figure 4).
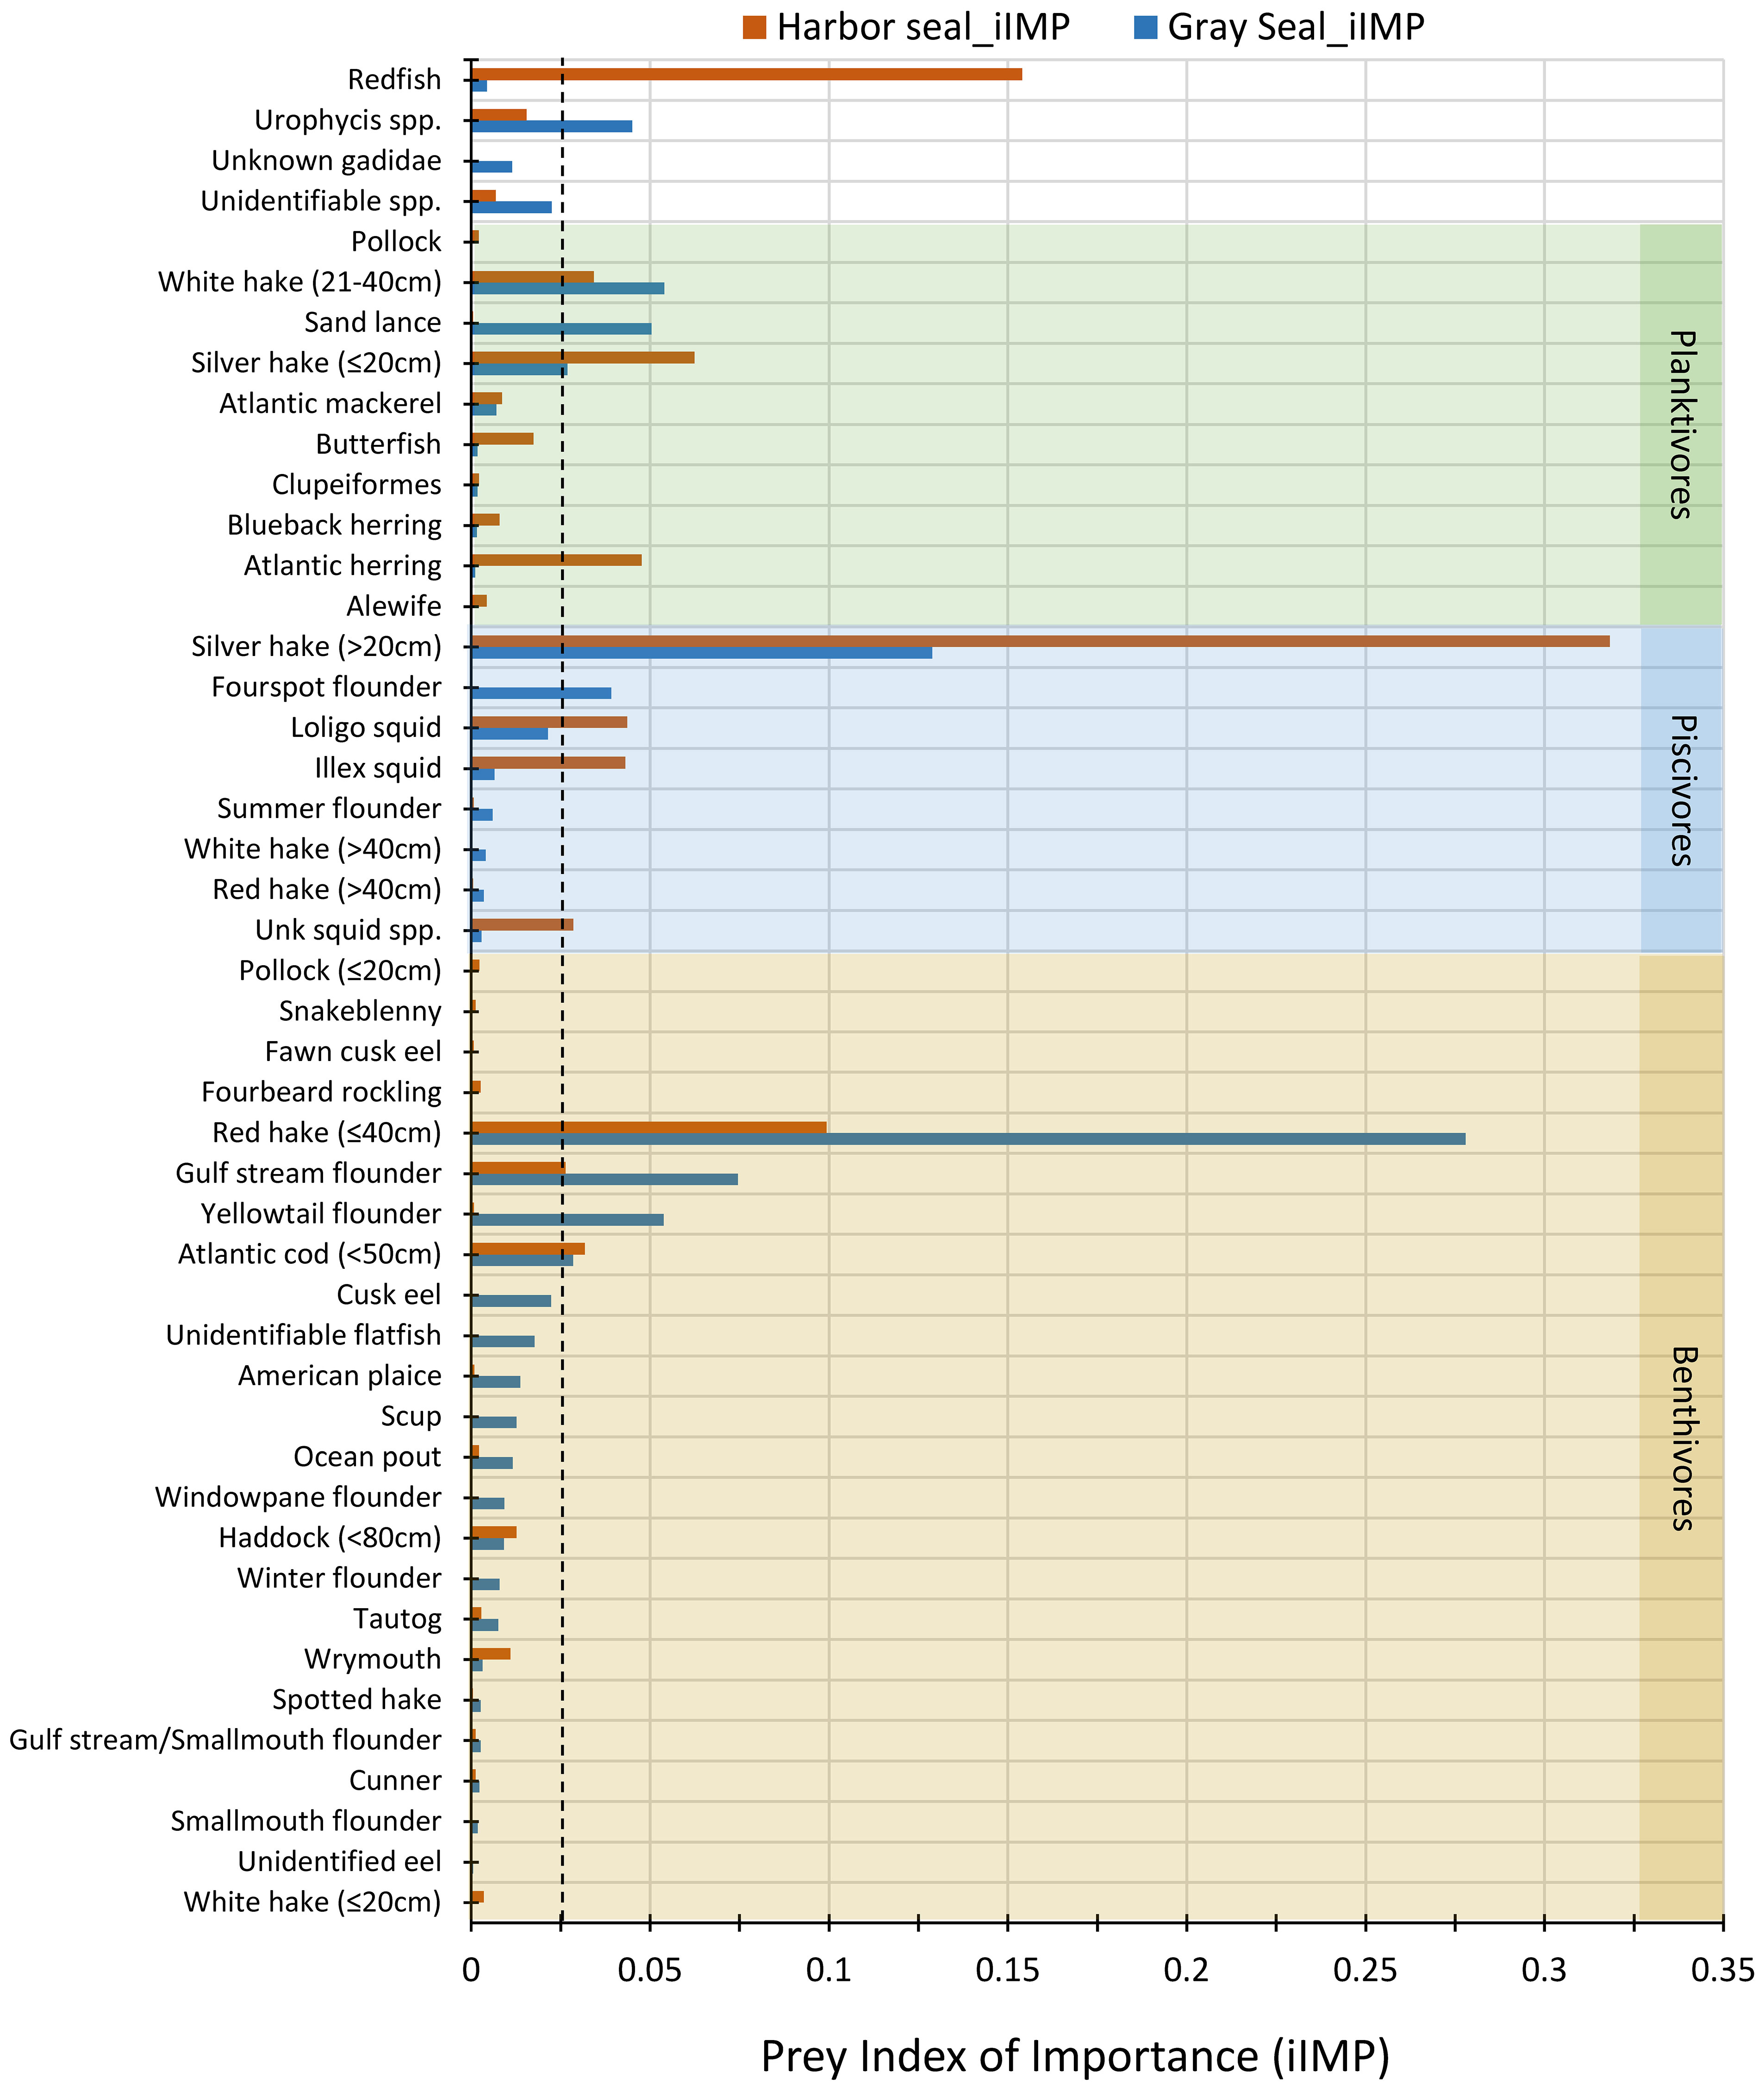
Figure 4 Prey index of importance (iIMP) consumed by harbor (brown bars) and gray (blue bars) seals. Prey species are organized and shaded by trophic groups: benthivores (tan), piscivores (blue), and planktivores (green). Unshaded prey species or groups belong to more than one trophic group: redfish = planktivore/piscivore, Urophycis spp. and Unknown Gadidae = planktivore/benthivore, and unidentifiable spp. the trophic group is unknown. Prey species with no length category shown belong to only one trophic group regardless of their size, whereas prey species with a length category belong to more than one trophic group. The vertical dashed line marks the minimum iIMP that identifies important prey to the seals. Morisita index of diet overlap (C) between harbor and gray seals = 0.55.
Diet patterns by age, sex, time, and area
Diet overlap was highest in the southern region (C = 0.71) and in the winter season (C = 0.68) when young-of-the-year harbor and gray seals co-occur. Diet overlap was also high in the spring (C = 0.93), but the harbor seal sample size was limited. Diet overlap was lowest in the Gulf of Maine (C = 0.34) and in the summer season (C = 0.32) when young-of-the-year harbor and gray seals are the most segregated (Table 3 and Figures 1, 5). Approximately half of the diet overlapped for young-of-the-year and both sexes. Weaned pups do not overlap in space and time, so their dietary overlap is low (C = 0.27; Table 4 and Figure 5). Harbor seal adult and juvenile sample sizes were too small to make reliable comparisons to adult and juvenile gray seals. Several prey species were important to both seal species in the southern region. This contrasts with the Gulf of Maine where redfish and large silver hake were important prey to harbor seals in comparison to the importance of yellowtail flounder and sand lance to gray seals (Supplementary Figure S7A). Silver and red hakes were important to both seals across all seasons. Gulf stream flounder was important to both seal species during the winter and spring. Sand lance was important to gray seals, whereas redfish was most important to harbor seals during the summer and fall. Atlantic cod was important to both seals but mostly to harbor seals during the spring and both seal species during the summer. Yellowtail flounder was important only to gray seals mostly during the fall, and herring was important only to harbor seals year-round except for the summer season (Supplementary Figure S7B). The regional and seasonal patterns of important prey to harbor and gray seals applied to both sexes, pup, and young-of-the-year age classes. Sample sizes were too small to make meaningful comparisons for the adult and juvenile age classes (Supplementary Figures S7C, D).
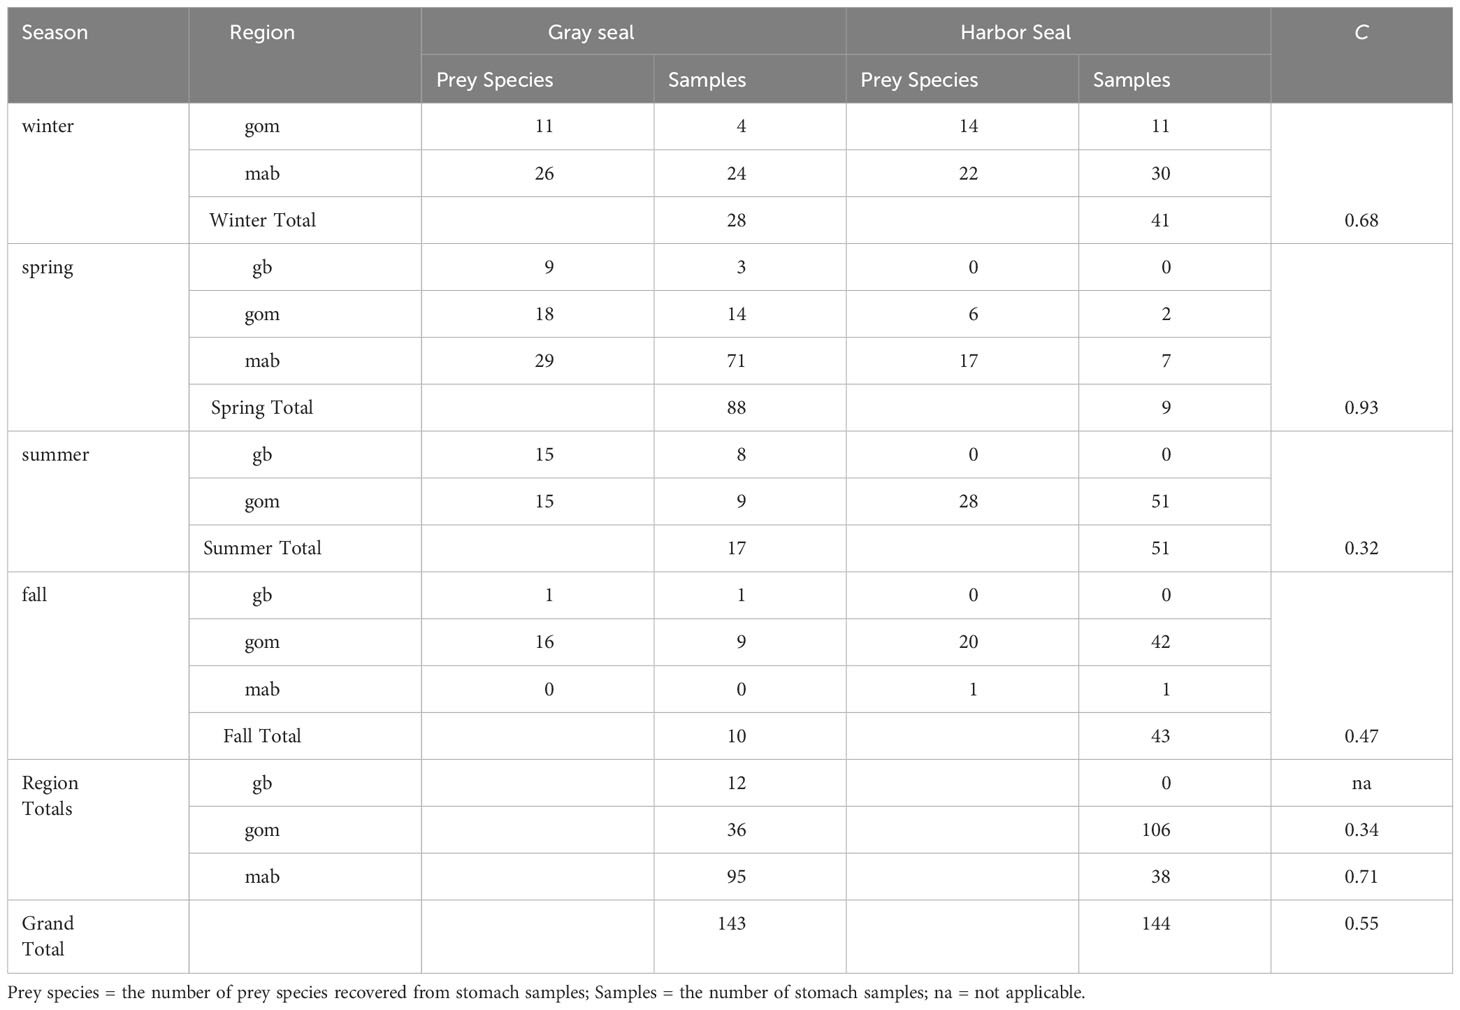
Table 3 Morisita index (C) of trophic niche overlap between gray and harbor seals by season (winter=december-february, spring=march-may, summer=june-august, fall=september-november) and region (georges bank=gb, gulf of maine=gom, southern new england/mid-Atlantic=mab).
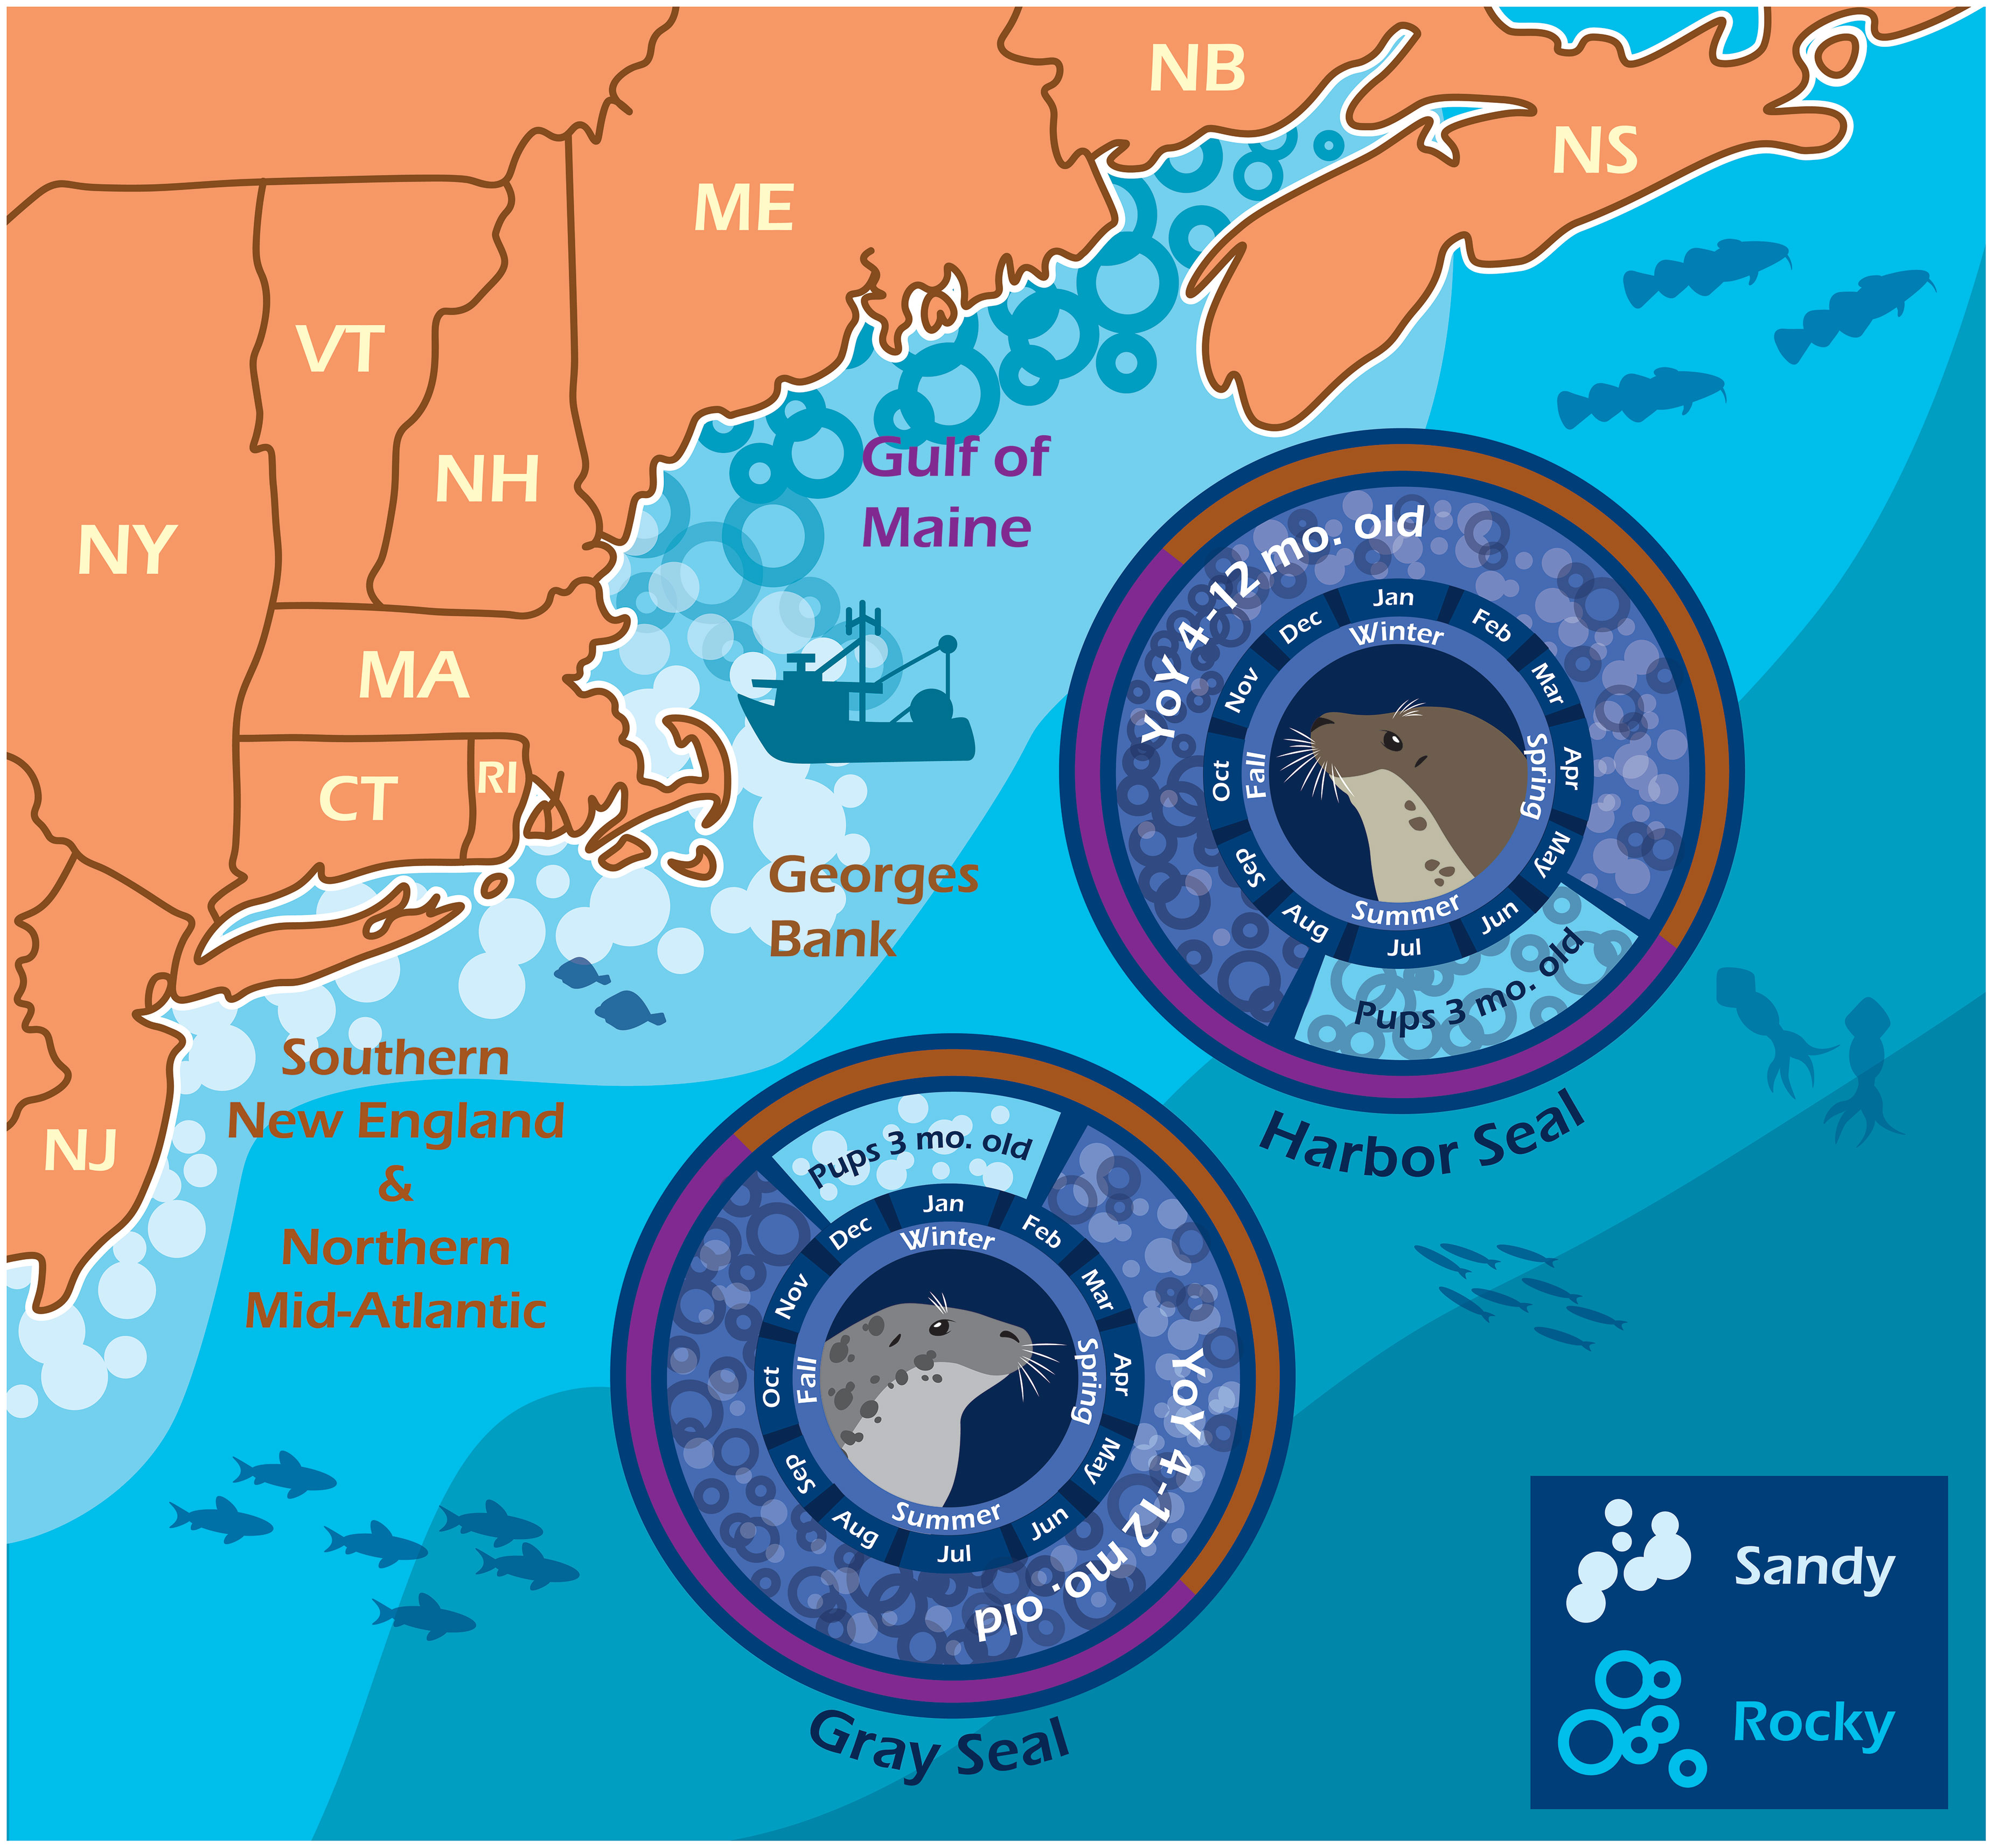
Figure 5 Harbor and gray seal bycatch phenology. The infographic depicts when and where pup and young-of-the-year seals generally appear in bycatch given the opposite timing and location of their reproduction cycles and proximity to commercial fishing grounds. Harbor seals are born and weaned along the rocky coastline, ledges, and islands in the Gulf of Maine (purple) during the summer. Gray seals are born and weaned among the sandy islands and beaches of western Georges Bank and into Southern New England (brown) during the winter. Image credit: Ari Morese, https://ariannamorese.wixsite.com/arimorese.
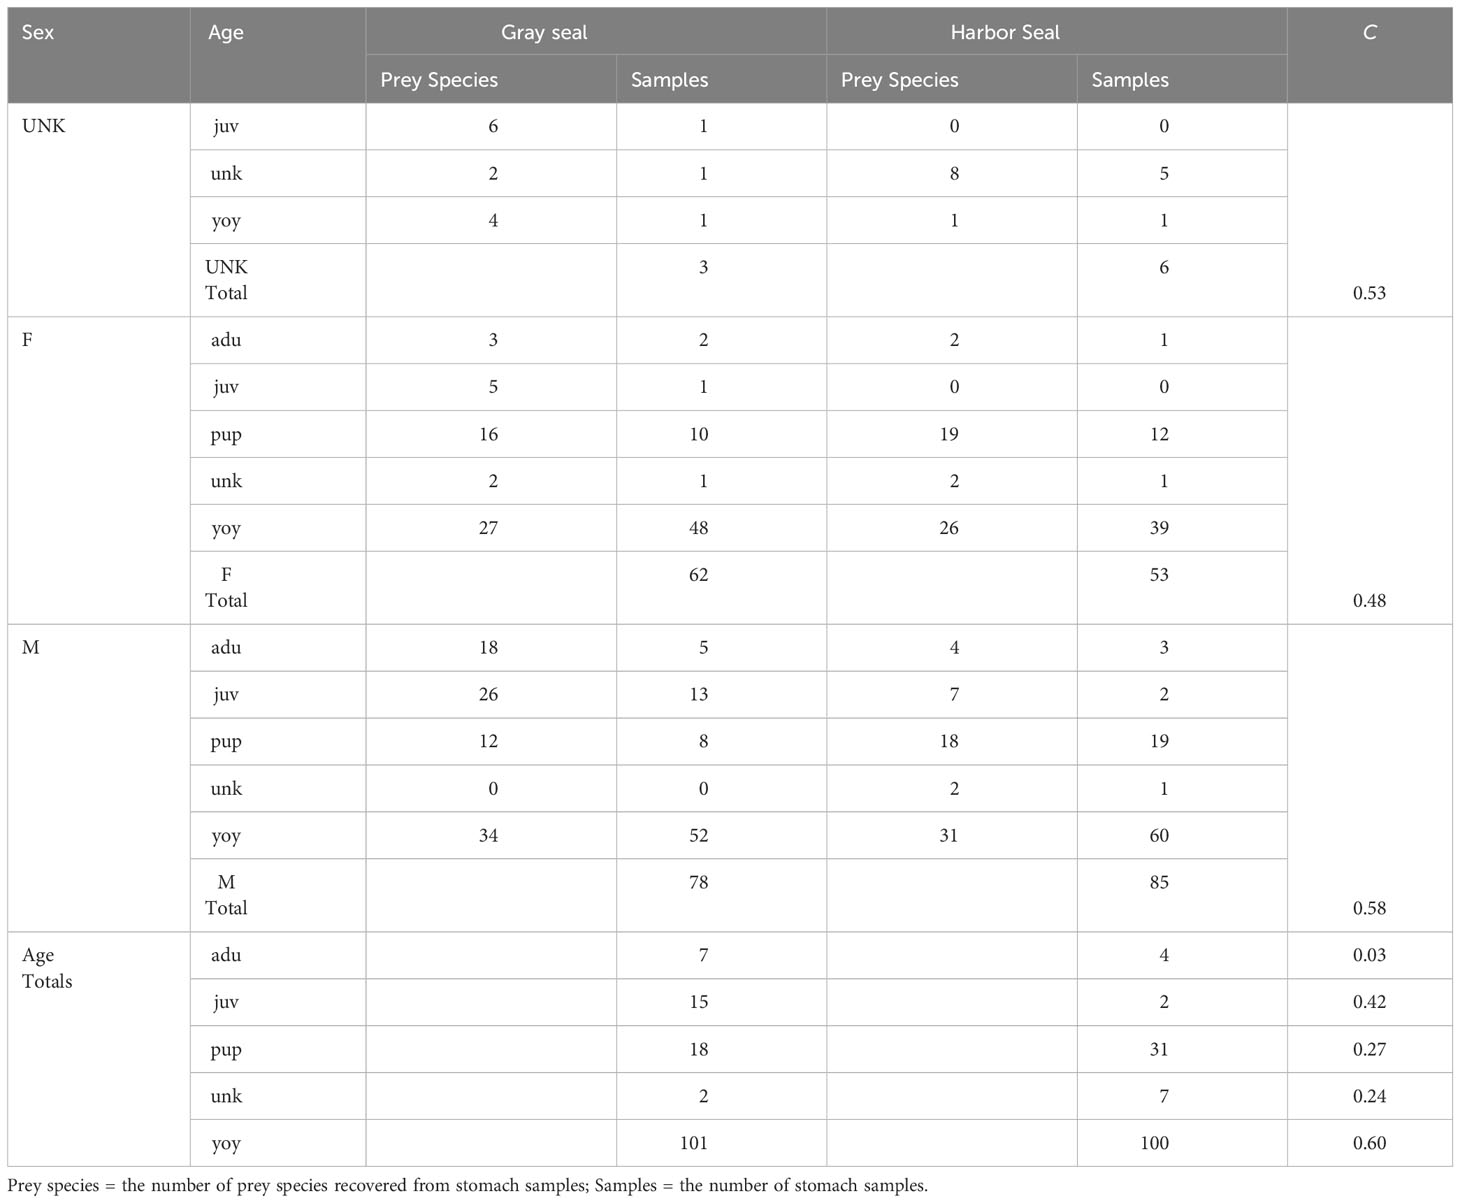
Table 4 Morisita index (C) of trophic niche overlap between gray and harbor seals by sex (UNK=unkown, F=female, M=male) and age (juv=juvenile, unk=unknown, yoy=young of year, adu=adult, pup ≤ 3 months old).
Modeling effects on prey consumption
Sample sizes were too limited to simultaneously evaluate the effect of seal, region, season, sex, and age on consumption (Supplementary Table S3). However, univariate models showed that 1) the variety of prey in seal diets and 2) the location of bycatch samples explained a significant portion of variability in the minimum number of prey consumed. The minimum number consumed increased when prey species richness (S) and the number of trophic guilds increased. Geographic region was not as important, but there was a significant longitude effect on seal consumption with less consumption observed east of 70.5° (Supplementary Table S4 and Supplementary Figure S2). The effect of seal age, sex, season, region, and trophic group on the mean prey size consumed by each seal was not tested. Patterns in prey sizes consumed by these factors are available in Supplementary Figures S8A–F.
Length frequencies of seal prey versus commercial catches
Mean prey size (cm) was compared among some of the most important prey to both harbor and gray seals and Northeastern US commercial gillnet trips. They included silver hake, red hake, and Atlantic cod. Both harbor and gray seals (combined) consumed smaller prey compared with sampled commercial gillnet catches for all three species. The mean length of cod consumed by harbor and gray seals (20 cm) was smaller than the mean cod length caught and sampled on commercial gillnet trips (73 cm; Tobs = −53 cm; P = 0.00; Figure 6). The mean length of red hake consumed by the seals (25 cm) was smaller than the mean red hake length caught and sampled on commercial gillnet trips (43 cm; Tobs = −17 cm; P = 0.00; Figure 7). The mean length of silver hake consumed by the seals (22 cm) was smaller than the mean silver hake length caught and sampled on commercial gillnet trips (36 cm; Tobs = −14 cm; P = 0.00; Figure 8). There were not enough samples to compare the mean sizes of yellowtail flounder.
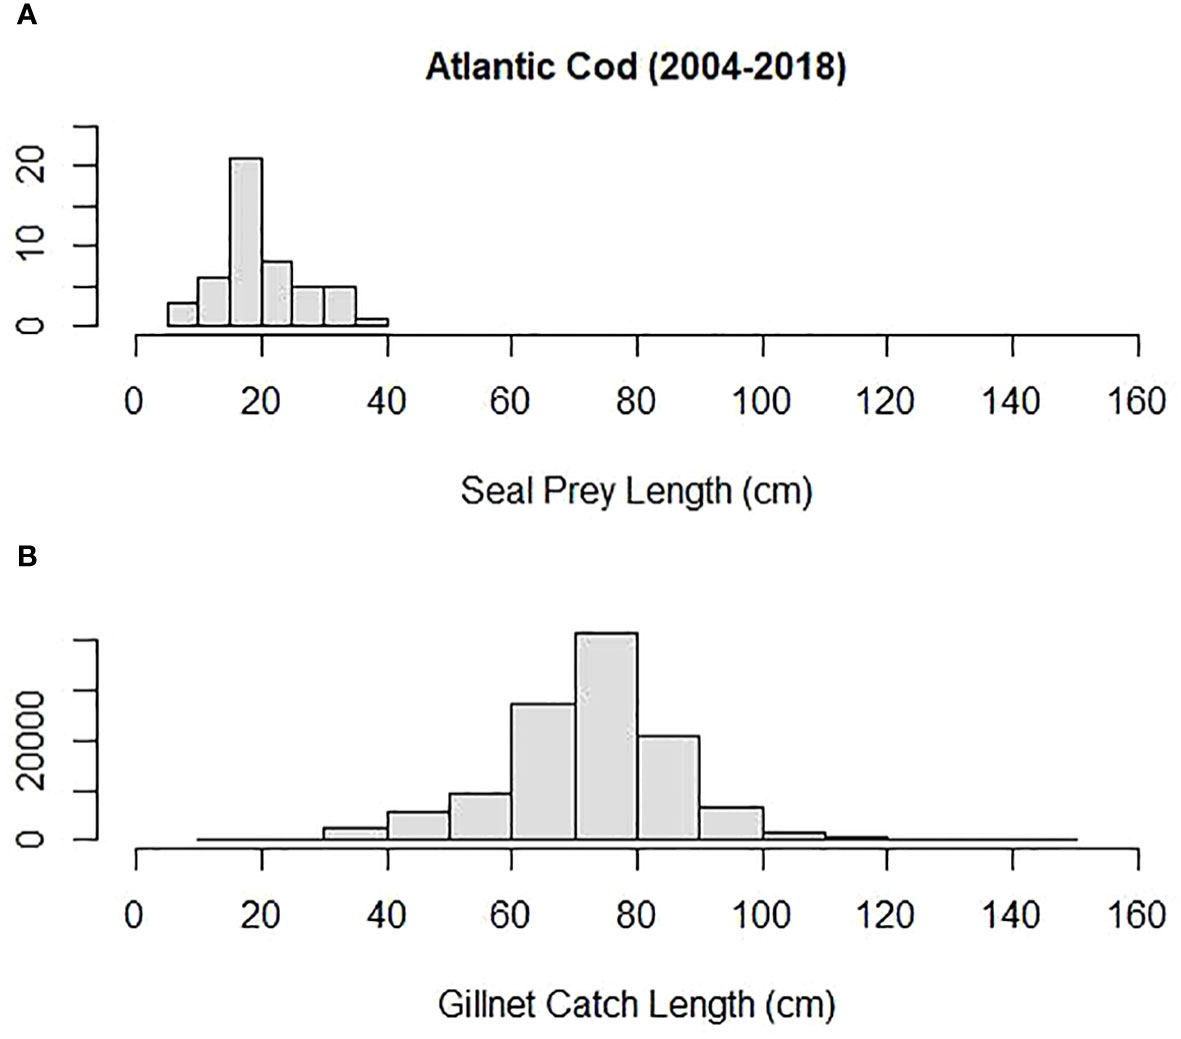
Figure 6 Length distribution (cm) of Atlantic cod (A) consumed by harbor and gray seals and (B) caught by commercial gillnet fishermen.
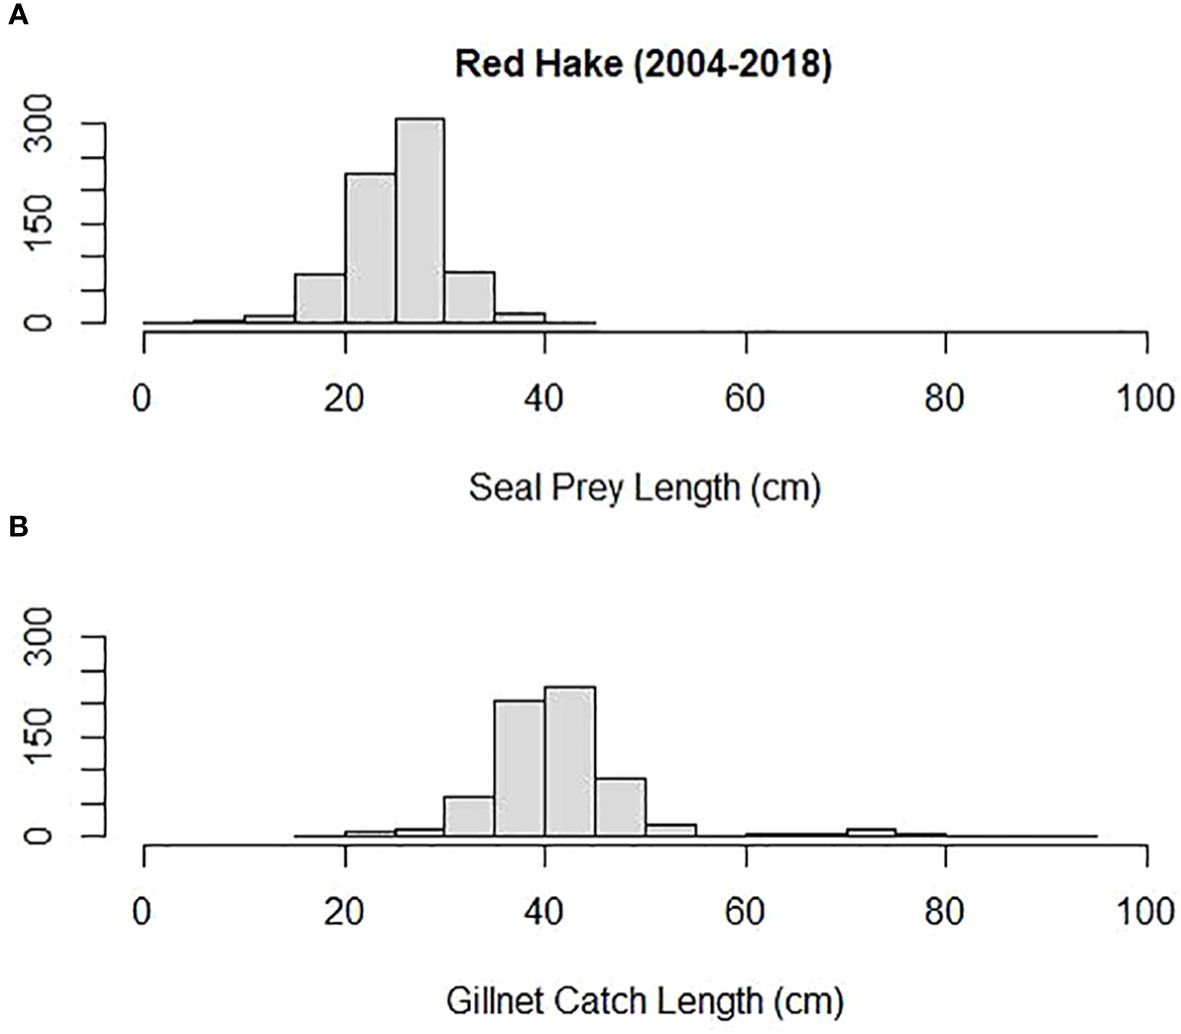
Figure 7 Length distribution (cm) of red hake (A) consumed by harbor and gray seals and (B) caught by commercial gillnet fishermen.
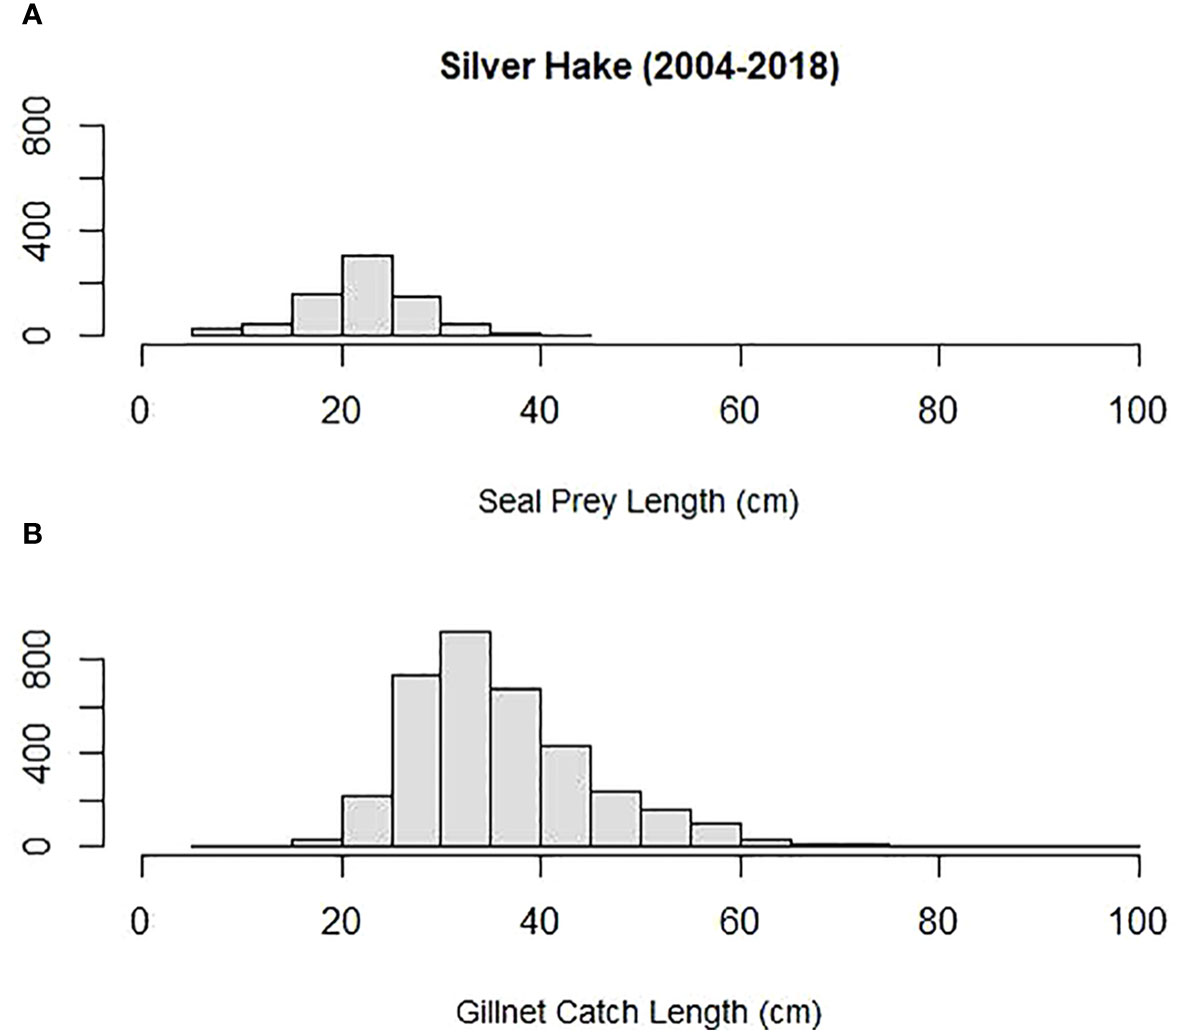
Figure 8 Length distribution (cm) of silver hake (A) consumed by harbor and gray seals and (B) caught by commercial gillnet fishermen.
Discussion
Data available to infer marine mammal diet composition or consumption are often sparse and reflect varying degrees of temporal, spatial, and demographic resolution (Smith et al., 2015). This is true of the opportunistic samples obtained from bycatch events for this study (Table 1). In most cases, there were no samples available to make 1:1 comparisons between harbor and gray seal diet that account for both intrinsic (age and sex) and extrinsic (season and region) factors (Supplementary Table S3). However, these samples provide temporal and spatial contexts for analysis of the seals’ diet. The imbalance in the temporal and spatial distribution of stomach samples used in this study is explained by non-overlapping harbor and gray seal phenology and pup haul-out locations that are adjacent to high-density large mesh (>20 cm) gillnet fishing regions (Murray et al., 2021; Figure 1). This also explains why the majority of samples are from the pup and young-of-the-year age classes (Table 1). In other words, these age classes appear in bycatch in opposite times and areas given the timing and location of their reproduction cycles. Evidence from tagged animals suggests that most weaned pups and young-of-the-year gray seals forage in Southern New England adjacent to Muskeget Island and Monomoy pupping habitats during late winter into spring and summer (Murray et al., 2021; Wood et al., 2022). On the other hand, most weaned pups and young-of-the-year harbor seals forage in the Gulf of Maine adjacent to coastal bays, ledges, and island pupping habitats in summer into fall seasons (Williams, 1999; Gilbert et al., 2005; Waring et al., 2006; Sigourney et al., 2022). Pup and young-of-the-year age classes from both seals generally overlap in the Gulf of Maine during summer and fall and less so in the southern region in winter and spring (Figure 5). Given this bias toward pup and young-of-the-year age classes, it is not surprising that sex was not an important factor when contrasting patterns in diet between the two seal species (Beck et al., 2007). Both sexes are expected to have limited dive capacity and be equally naive in foraging and consequently subject to higher bycatch rates relative to older more experienced age classes (Frost et al., 2006; Murray et al., 2021).
The differences in important prey, also reflected in 55% overlap in diet, are also a function of when and where the seals show up in bycatch and mostly driven by samples from the pup and young-of-the-year age classes. This trophic niche separation is exhibited by gray seal consumption of more benthivorous prey species compared with harbor seals. The least dietary overlap in the Gulf of Maine during the summer and fall (C = 0.34) appears to be explained by harbor seals’ preference for redfish and small silver hake over sand lance, yellowtail flounder, and red hake consumed by gray seals. The most dietary overlap occurs in the southern region (C = 0.71) during winter and spring where both seals consume silver and red hake and gulf stream flounder. This is also when most of the squids are present in the harbor seal diet (Table 3 and Figure 9). Pups rarely co-occur which explains low overlap in their diets (C = 0.27; Table 4 and Figure 5).
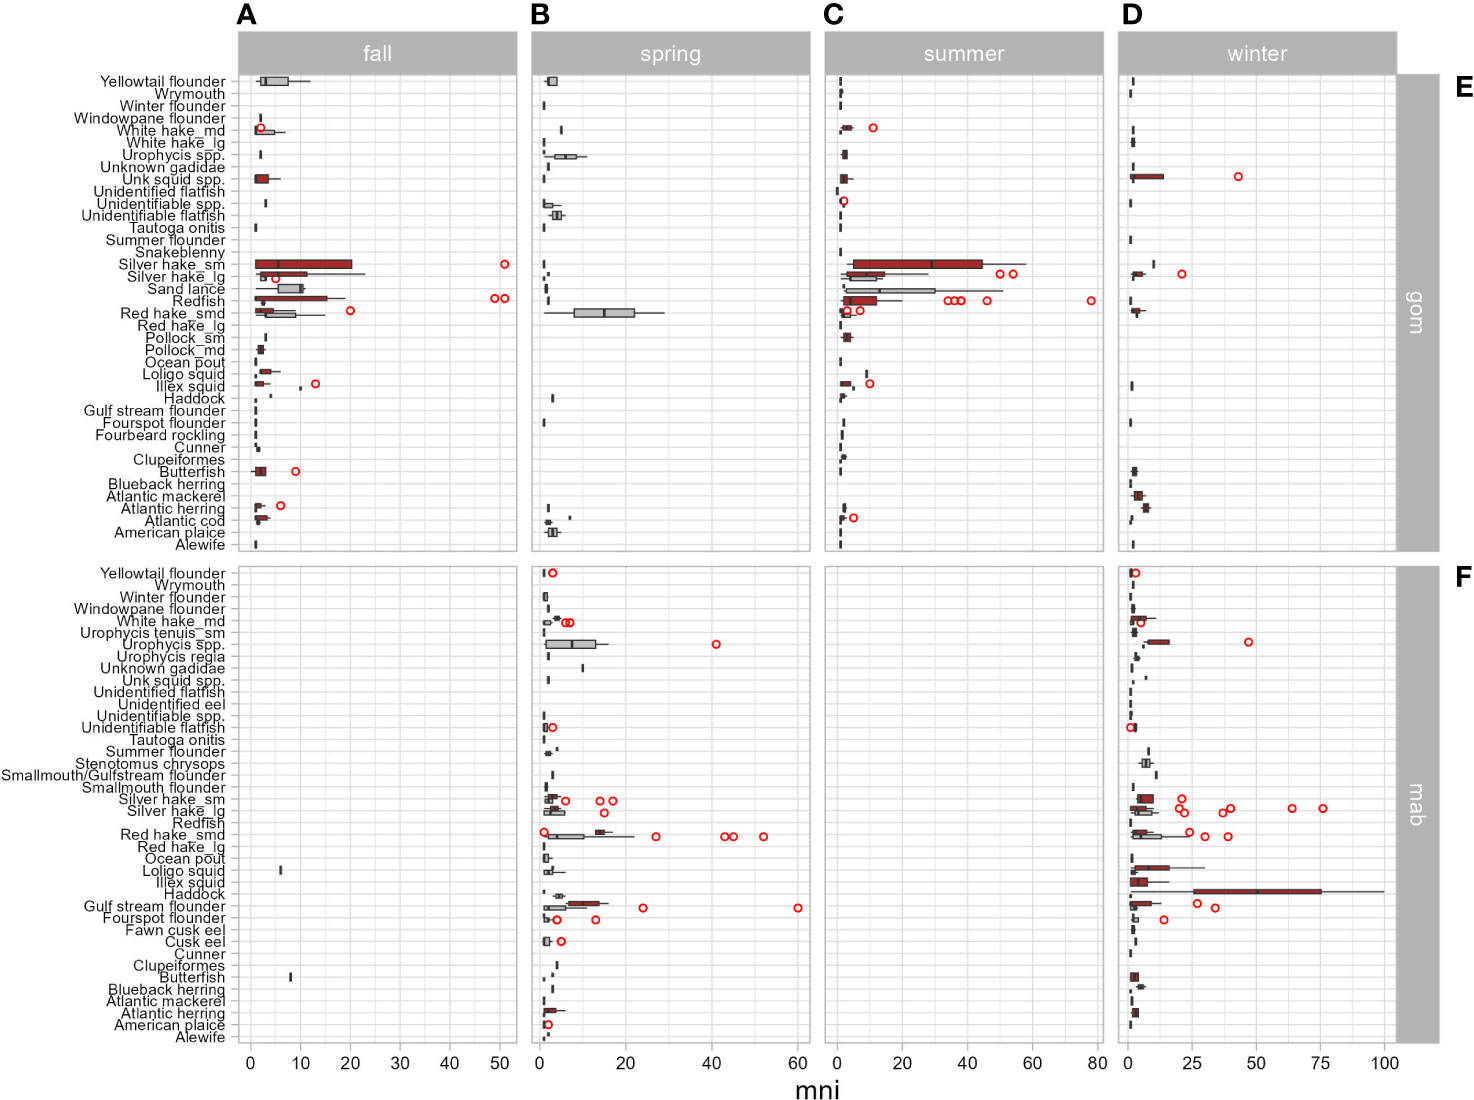
Figure 9 Box plots of the number of individual prey (mni) consumed by harbor (red bars) and gray (gray bars) seals by season (A: fall = Sep–Nov, B: spring = Mar–May, C: summer = Jun–Aug, D: winter = Dec–Feb) and geographic region (E: gom = Gulf of Maine, F: mab = mid-Atlantic Bight, including Southern New England). Red circles identify extreme values.
Consistent with Ampela (2009), diet data obtained from the stomachs of bycaught gray seals in our study paint a different picture of the relative abundance of prey in the diet when compared with data obtained from scat samples. Examples of this are shown by Ampela (2009) and Lerner et al. (2018) where a relatively high abundance of sand lance was found in gray seal scat samples obtained from sandbars off the coast of Chatham, Massachusetts. Bowen and Harrison (1994) show a similar pattern with a high proportion of sand lance found in scats collected on Sable Island, a sandy island habitat on the Scotian shelf. In contrast, sand lance relative abundance was low (<10%) in gray seal stomachs examined by Ampela (2009) and this study. We postulate that diet data obtained from Northeastern US bycatch events are more representative of offshore foraging on the continental shelf and banks away from haul-out sites, whereas diet from scats represents more nearshore foraging closer to haul-out sites (Pierce and Boyle, 1991; Ampela, 2009; Hammill et al., 2014; Johnston et al., 2015; Lerner et al., 2018; Hernandez et al., 2019a). These differences may also be confounded by the seal’s age and foraging experience (Beck et al., 2007). The majority of data in this study were obtained from young-of-the-year gray seals with limited foraging experience. Scat samples obtained off Chatham sandbars are generally obtained from mixed age groups with a likely bias toward the more numerous older gray seals. Older seals have more foraging experience and are likely more successful in capturing pelagic, fast swimming, or schooling prey. Sand lance are given their name because they burrow in the sand in shallow near-shore habitats (Robards et al., 1999; Staudinger et al., 2020). However, Bowen et al. (2002) documented mature harbor seals’ capture of sand lance both burrowed in the sand and as schooling prey in the water column. Although the sample sizes from the adult age class from our study are small, sand lance had the highest importance (iIMP) in the diet of adult gray seals (n = 7; Supplementary Table S3 and Supplementary Figure S7C). Hammill et al. (2014) showed that sand lance also rank high in importance and mass consumed by older gray seals collected from digestive tracts obtained from the Cabot Strait and Cape Breton Island off of Canada (mean age ranged 7–12 years old). By comparison, sand lance were rarely found in the stomachs of bycaught harbor seals but historically were found in high abundance when recovered from their scats (Payne and Selzer, 1989). Ignoring all extrinsic and intrinsic factors, the occurrence of cod in gray seal diet (5.1%) is consistent with the findings in Flanders et al. (2020) where the relative contribution of cod (6.7%; resolved to the genus Gadidae spp.) to the diet of gray seals was inferred by DNA meta-barcoding techniques. This is also consistent with the findings in Canadian waters where cod was found to be important in adult gray seal diet (Bowen and Harrison, 1994; Hammill et al., 2014).
Consistent with Williams (1999) and Ampela (2009), prey sizes consumed by both seals in our study showed limited overlap with prey sizes caught by commercial gillnet fishermen. Sørlie et al. (2020) also reported evidence of harbor seal preference for smaller prey compared with the size of some species exploited by commercial fisheries off the coast of Norway and low levels of direct competition between harbor and gray seals and commercial fisheries. However, it is important to note that the majority of seals in our study were young-of-the-year animals, the age class most frequently caught as bycatch in NEUS commercial gillnet fisheries (Murray et al., 2021). It is generally understood that larger seals from the older age classes can consume larger prey. Hammill et al. (2014) showed that adult gray seals in the Cabot Straight and Cape Breton Island off of Canada on average consumed large white hake (29–35 cm) and Atlantic cod (28–39 cm). By comparison, adult gray seals in our study (albeit a small sample size, n = 7) indicate consumption of larger fish (Supplementary Figure S8C). Thus, it is important to consider the age distribution of the seals when utilizing results from seal diet studies to inform fish population and ecosystem dynamic models (Benoît et al., 2011).
If the dietary pattern of harbor seals is correlated to the relative abundance of prey in the ecosystems but also sensitive to gray seal population growth, this can provide insight into the resilience of US Northwest Atlantic harbor seals to gray seal recolonization in New England waters (Smout et al., 2014; Johnston et al., 2015; Russell et al., 2015; Ouellet et al., 2016; Pace et al., 2019; Murray et al., 2021). Consistent with other studies, our research shows that hake species rank at the top of the most important prey to harbor seals, similar to gray seals, regardless of sex and age class (Ampela, 2009; Hammill et al., 2014). Our study also shows that cod occurrence (16%) and abundance (2%) are three times greater in harbor seal diet compared with gray seals (Table 2). The finding of the importance of cod in the diet of harbor seals is consistent with that reported by Williams (1999). The remaining most important prey unique to harbor seals—silver hake, redfish, red hake, herring, and squids—were also identified as the most important prey over 20 years ago by Williams (1999). Bowen and Harrison (1996) also identified cod, herring, and Illex squid among the most abundant prey in the diet of harbor seals in the Canadian maritime region. The persistence of important prey to the diet of harbor seals over recent decades provides evidence that they are resilient to the concurrent resurgence of the gray seal population in Northeastern US waters. Finally, mean harbor seal prey size and biomass were 8 cm and 0.09 kg smaller than gray seals, respectively. The significant difference in mean prey size and biomass between the two seal species was expected given the overall difference in body size and mass between the two seals, even at the younger age classes (Encyclopedia of Marine Mammals, 2nd ed.; Perrin et al., 2009).
Williams (1999) and Ampela (2009) offer the only empirically based Northeastern US estimates of Northwest Atlantic harbor and gray seal diet composition based on biomass, respectively. In comparison to their research results, our more recent study found similar seal diet compositions, specifically for samples originating from bycatch. In contrast, seal diet composition from our study generally does not align with seal proportional prey composition for the Northeastern US estimated in Smith et al. (2015). There are likely several reasons for the differences. The most notable is that harbor and gray seal mean diet composition among prey groups in Smith et al. (2015) varies widely due to a large number of literature sources used to estimate diet composition. Most of those studies originated from regions outside of the Northeastern US, and several of the sources utilized scats to reconstruct the seal diets.
Using hard parts to evaluate marine mammal diet allows for the estimation of prey biomass consumed at a high taxonomic resolution (Table 2). However, there are three primary shortcomings of using hard parts to estimate diet: 1) a bias toward cephalopod beaks and fish otoliths that have higher retention in the stomach lining and are more resistant to degradation, respectively; 2) underdetection of prey which have no hard part remains (e.g., elasmobranchs, crustaceans, and depredation); and 3) difficulty investigating for evidence of scavenging. Squid beaks have been reported to become lodged in the stomach lining and thereby can be overrepresented in diets inferred from stomach contents (Olesiuk et al., 1990; Bowen and Iverson, 2013). Pristine and otoliths with minor erosion likely reflect prey with more robust otolith size (e.g., gadoid species), but fragile otoliths are more likely to be underrepresented due to breakage, degradation, or fully digested in the stomach before passing through the intestines (e.g., clupeids; Murie and Lavigne, 1986; Pierce and Boyle, 1991; Hammill et al., 2007; Tollit et al., 2007). However, stomach content data are less biased than scats with respect to quantifying the minimum number and size of prey consumed simply because stomach content remains have not cycled through the entire digestive process (Jobling and Breiby, 1986; Olesiuk et al., 1990; Ampela, 2009).
Similar to the findings in Byron and Morgan (2016) and Pitchford et al. (2020), our study found evidence of elasmobranch prey present in gray seal stomach samples but very few in harbor seals. This is likely due to the high incidence of gray seal bycatch events in the southern region that co-occurred with large mesh skate and dogfish gillnet fisheries (Murray et al., 2021). With respect to depredation, only the lower portion or belly region of fish is consumed by predators. Consequently, there generally is no evidence of depredation (i.e., no otoliths consumed or located) in the stomach of the predator unless headless fish remains are found intact within the stomach. In contrast, consumption by scavenging may be detected when only heads of fish are recovered with no further co-occurring evidence of bony or flesh remains. Consumption by scavenging can occur when fishermen dress their fish catch for the market while at sea. The application of fatty acids as trophic markers provides both longer temporal insight into marine mammal foraging patterns and theoretically can limit the depredation source of bias when compared with techniques that involve analysis of hard parts (Kirsch et al., 2000; Dalsgaard et al., 2003; Thiemann and Iverson, 2008; Iverson, 2009; Thiemann et al., 2009; Bowen and Iverson, 2013). The DNA meta-barcoding of prey may also get at this source of bias; however, analytical techniques using DNA to quantify the abundance of prey in the diet are still under development (Jeanniard-du-Dot et al., 2017; Shelton et al., 2023).
In conclusion, this study demonstrates the importance and value of utilizing carcasses retained from bycatch events to fill data gaps in our understanding of the ecological role of recovering harbor and gray seal populations. This includes their impact on the natural mortality of prey important to commercial fisheries providing further insight into the connections between fisheries and protected species management potentially regulating food web dynamics in the Northeastern US region (Kulatska et al., 2021). Given the richness of their diets, these seals may be capable of shifting their diet to species that are predicted to be more abundant in the future as a result of changing environmental or habitat conditions (Nye et al., 2009; Zeppelin and Orr, 2010; Pinsky et al., 2013; Hare et al., 2016; Kleisner et al., 2017; Friedland et al., 2019; Lettrich et al., 2023). Finally, we recommend cross-validation studies comparing results from different diet sample types, locations, and methodologies to minimize bias and provide more robust evidence of the magnitude of natural mortality on commercially important species induced by top-level predators.
Data availability statement
The datasets presented in this study can be found in online repositories. The names of the repository/repositories and accession number(s) can be found below: FigShare, https://figshare.com/articles/dataset/Lyssikatos_and_Wenzel_2024/25097213.
Ethics statement
The manuscript presents research on animal diet. No live animals were used or handled during the course of this study. Ethical approval was not required for the study.
Author contributions
ML: Conceptualization, Formal analysis, Investigation, Methodology, Writing – original draft, Writing – review & editing, Data curation. FW: Data curation, Investigation, Writing – review & editing.
Funding
The author(s) declare that no financial support was received for the research, authorship, and/or publication of this article.
Acknowledgments
ML gives a very special thanks to NOAA’s Advanced Studies Program, The School of Marine Science and Technology at the University of Massachusetts Dartmouth, and her Dissertation Committee for accepting and guiding her through her PhD journey. Both authors are grateful to the Northeast Fisheries Observer Program, Northeast Fisheries Science Center (NEFSC) Seal Team, and The Provincetown Center for Coastal Studies for their support in the field. Lisa Sette is also thanked for her friendship and collaborative spirit and all the following individuals for their unwavering support and patience over the past several years: Sean Hayes, Henry Milliken, Chris Orphanides, Kimberly Murray, Debra Palka, John Galbraith, Brian Smith, Mark Wuenschel, Greg Early, and Kristin Precoda. ML and FW are grateful to David McElroy and the interns for sharing original otolith measurement data from samples collected from NEFSC bottom long-line and bottom trawl surveys. We also thank all the reviewers for their thoughtful critical feedback. Lastly, a shout out to Toni Chute for inspiring the title of this paper.
Conflict of interest
The authors declare that the research was conducted in the absence of any commercial or financial relationships that could be construed as a potential conflict of interest.
Publisher’s note
All claims expressed in this article are solely those of the authors and do not necessarily represent those of their affiliated organizations, or those of the publisher, the editors and the reviewers. Any product that may be evaluated in this article, or claim that may be made by its manufacturer, is not guaranteed or endorsed by the publisher.
Supplementary material
The Supplementary Material for this article can be found online at: https://www.frontiersin.org/articles/10.3389/fcosc.2024.1377673/full#supplementary-material
References
Adams J. (1985). The definition and interpretation of guild structure in ecological communities. J. Anim. Ecol. 54, 43–59. doi: 10.2307/4619
Ampela K. (2009). The diet and foraging ecology of gray seals (Halichoerus grypus) in United States waters. Biology Department, The City University of New York, Staten Island. doi: 10.13140/RG.2.2.17950.46400
Ampela K., DeAngelis M., DiGiovanni R. Jr., Lockhart G. (2018). Seal Tagging and Tracking in Virginia 2017-2018. Prepared for U.S. Fleet Forces Command. Submitted to Naval Facilities Engineering Command Atlantic, Norfolk, Virginia, under Contract No. N62470-15-8006, Task Order 17F4058, issued to HDR, Inc., Virginia Beach, Virginia. March 2019. NAVFAC Atlantic. Norfolk, Virginia. https://www.navymarinespeciesmonitoring.us/index.php/download_file/view/1953/
Bass A. L., Bogomolni A., Early G., Nichols O. C., Patchett K. (2016). Seals and Ecosystem Health: Meeting Report of the North Atlantic Seal Research Consortium [NASRC] (Woods Hole Oceanographic Institution Technical Report, WHOI-2016-01).
Beck C. A., Iverson S. J., Bowen W. D., Blanchard W. (2007). Sex differences in grey seal diet reflect seasonal variation n foraging behavior and reproductive expenditure: evidence from quantitative fatty acid signature analysis. J. Anim. Ecol. 76, 490–502. doi: 10.1111/j.1365-2656.2007.01215.x
Behnke J. (2021) “Cape Cod’s Seal Problem”. On The Water. Available online at: https://www.onthewater.com/cape-cods-seal-problem.
Benaka L. (2021) National Observer Program FY 2019 Annual Report. NOAA Tech. Memo. NMFS-F/SPO-215. Available online at: https://spo.nmfs.noaa.gov/sites/default/files/TM215_0.pdf.
Benoît H. P., Swain D. P., Bowen W. D., Breed G. A., Hammill M. O., Harvey V. (2011). Evaluating the potential for grey seal predation to explain elevated natural mortality in three fish species in the southern Gulf of St. Lawrence. Mar. Ecol. Prog. Ser. 442, 149–167. doi: 10.3354/meps09454
Boulva J., McLaren I. A. (1979). Biology of the Harbor seal, Phoca vitulina, in Eastern Canada. Bull. Fish. Res. Board Can. 200, 24. Available at: https://www.semanticscholar.org/paper/c702fa94025baad75125865c0cf5f033647897d8.
Bowen W. D., Harrison G. D. (1994). Offshore diet of grey seals (Halichoerus grypus) near Sable Island, Canada. Mar. Ecol. Prog. Ser. 112, 1–11. doi: 10.3354/meps112001
Bowen W. D., Harrison G. D. (1996). Comparison of harbor seal diets in two inshore habitats of Atlantic Canada. Can. J. Zool 74, 125–135. doi: 10.1139/z96-017
Bowen W., Iverson S. (2013). Methods of estimating marine mammal diets: A review of the validation experiments and sources of bias and uncertainty. Mar. Mammal Sci. 29, 719–754. doi: 10.1111/j.1748-7692.2012.00604.x
Bowen W. D., Lidgard D. (2011). Vertebrate predator control: effects on prey populations in terrestrial and aquatic ecosystems. DFO Can. Sci. Advis. Sec. Res. Doc. 2011/028: vi, 33p. Available at: https://publications.gc.ca/site/fra/9.577755/publication.html.
Bowen W. D., McMillan J., Mohn R. (2003). Sustained exponential population growth of grey seals at Sable Island, Nova Scotia. ICES J. Mar. Sci: J. du Conseil 60, 1265–1274. doi: 10.1016/S1054-3139(03)00147-4
Bowen W. D., Tully D., Boness D. J., Bulheier B. M., Marshall G. J. (2002). Prey-dependent foraging tactics and prey profitability in a marine mammal. Mar. Ecol. Prog. Ser. 244, 235–245. doi: 10.3354/meps244235
Boyle G. J. (1997). Studying prey selection by seals: the utility of prey preference experiments. J. Northwest Atlantic Fisheries Sci. 22, 115–117. Available at: https://journal.nafo.int/Volumes/Articles/ID/254/Studying-Prey-Selection-by-Seals-The-Utility-of-Prey-Preference-Experiments.
Butterworth D. S., Duffy D. C., Best P. B., Bergh M. O. (1988). On the scientific basis for reducing the South African seal population. S. Afr. J. Sci. 84, 179–188.
Byron C., Morgan A. (2016). Potential role of spiny dogfish in gray and harbor seal diets in the Gulf of Maine. Mar. Ecol. Prog. Ser. 550, 249–270. doi: 10.3354/meps11718
Cammen K. M., Rasher D. B., Steneck R. S. (2019). Predator recovery, shifting baselines, and the adaptive management challenges they create. Ecosphere 10, e02579. doi: 10.1002/ecs2.2579
Campana S. E. (2004). Photographic atlas of fish otoliths of the Northwest Atlantic Ocean (Ottawa: NRC Research Press), 284. doi: 10.1139/9780660191089
Chasco B., Kaplan I. C., Thomas A., Acevedo-Gutierrez A., Noren D., Ford M. J., et al. (2017). Estimates of Chinook salmon consumption in Washington State inland waters by four marine mammal predators from 1970 to 2015. Can. J. Fisheries Aquat. Science. 74, 1173–1194. doi: 10.1139/cjfas-2016-0203
Chavez-Rosales S., Lyssikatos M. C., Hatch J. (2018). Estimates of Cetacean and Pinniped Bycatch in Northeast and Mid-Atlantic Bottom Trawl Fisheries 2012-2016 (US Dept of Commer, NOAA Tech Memo NMFS-NE-250). Woods Hole, Massachusetts. 22p. doi: 10.25923/p7a1-c785
Cook R. M., Holmes S. J., Fryer R. J. (2015). Grey seal predation impairs recovery of an over-exploited fish stock. J. Appl. Ecol. 52, 969–979. doi: 10.1111/1365-2664.12439
Cosgrove R., Gosch M., Reid D., Sheridan M., Chopin N., Jessopp M., et al. (2015). Seal depredation in bottom-set gillnet and entangling net fisheries in Irish waters. Fish. Res. 172, 335–344. doi: 10.1016/j.fishres.2015.08.002
Costalago D., Bauer B., Tomczak M. T., Lundstrom K., Winder M. (2019). The necessity of a holistic approach when managing marine mammal-fisheries interactions: Environment and fisheries impact are stronger than seal predation. Ambio 48, 552–564. doi: 10.1007/s13280-018-1131-y
Craddock J. E., Polloni P. T., Hayward B., Wenzel F. (2009). Food habits of Atlantic White-sided dolphins (Lagenorhynchus acutus) off the coast of New England. Fish. Bull. 107 (3), 384–394. Available at: https://aquadocs.org/handle/1834/25443.
Dalsgaard J., Michael S. J., Kattner G., Muller-Navarra D., Hagen W. (2003). Fatty acid trophic markers in the pelagic marine environment. Adv. Mar. Biol. 46, 225–340. doi: 10.1016/S0065-2881(03)46005-7
Deagle B. E., Thomas A. C., McInnes J. C., Clarke L. J., Vesterinen E. J., Clare E. L., et al. (2018). Counting with DNA in metabarCoding studies: How should we convert sequence reads to dietary data? Mol. Ecol. 28, 391–406. doi: 10.1101/303461
den Heyer C. E., Bowen W. D., Dale J., Gosselin J.-F., Hammill M. O., Johnston D. W., et al. (2020). Contrasting trends in gray seal (Halichoerus grypus) pup production throughout the increasing northwest Atlantic metapopulation. Mar. Mammal Sci. 37, 611–630. doi: 10.1111/mms.12773
Ferretti F., Jorgensen S., Chapple T. K., De Leo G., Micheli F. (2015). Reconciling predator conservation with public safety. Front. Ecol. Environ. 13, 412–417. doi: 10.1890/150109
Flanders K. R., Olson Z. H., Ono K. A. (2020). Utilizing next-generation sequencing to identify prey DNA in western North Atlantic gray seal Halichoerus grypus diet. Mar. Ecol. Prog. Ser. 655, 227–240. doi: 10.3354/meps13520
Fogarty M. (2013). The art of ecosystem-based fishery management. Can. J. Fish. Aquat. Sci. 71, 479–490. doi: 10.1139/cjfas-2013-0203
Free C. M., Jensen O. P., Hilborn. R. (2021). Evaluating impacts of forage fish abundance on marine predators. Conserv. Biol. 35, 1540–1551. doi: 10.1111/cobi.13709
Friedland K. D., McManus M. C., Morse R. E., Link J. S. (2019). Event scale and persistent drivers of fish and macroinvertebrate distributions on the Northeast US Shelf. ICES J. Mar. Sci. 76 (5), 1316–1334. doi: 10.1093/icesjms/fsy167
Frost K. J., Simpkins M. A., Small R. J., Lowry L. F. (2006). Development of diving by harbor seal pups in two regions of Alaska: Use of the water column. Mar. Mammal Sci. 22. 22 (3), 617–643. doi: 10.1111/j.1748-7692.2006.00056.x
Gaichas S. K., DePiper G. S., Seagraves R. J., Muffley B. W., Sabo M. G., Colburn L. L., et al. (2018). Implementing ecosystem approaches to fishery management: risk assessment in the US mid-atlantic. Front. Mar. Sci. 5. doi: 10.3389/fmars.2018.00442
Gamble R., Fogarty M., Lucey S., Keith C. (2016). Ecological Production Units for the Northeast U.S. Continental Shelf Vol. 2016 (Woods Hole, MA: NEFSC Ecosystem and Climate Review). Available at: https://www.integratedecosystemassessment.noaa.gov/sites/default/files/2022-05/ne-ecological-production-units-paper.pdf. 3p.
Garcia-Rodriguez J., Aurioles-Gamboa D. (2004). Spatial and temporal variation in the diet of the California sea lion (Zalophus californianus) in the Gulf of California, Mexico. Fishery Bull. 101 (1), 47–62. Available at: https://fisherybulletin.nmfs.noaa.gov/content/spatial-and-temporal-variation-diet-california-sea-lion-zalophus-californianus-gulf.
Garcia-Rodriguez F. J., de la Cruz-Aguero J. (2011). A comparison of indexes for prey importance inferred from otoliths and cephalopod beaks recovered from pinniped scats. J. Fisheries Aquat. Sci. 6, 186–193. doi: 10.3923/jfas.2011.186.193
Gazit T., Lidgard D., Sykes K. (2013). Changing environments: tracking the scientific, socio-political, legal, and ethical currents of the grey seal-cod debate in Atlantic Canada. J. Int. Wildlife Law Policy 16, 266–299. doi: 10.1080/13880292.2013.805070
Gilbert J. R., Waring G. T., Wynne K. M., Guldager N. (2005). Changes in abundance of Harbor seals in Maine 1978-2001. Mar. Mammal Sci. 21, 519–535. doi: 10.1111/j.1748-7692.2005.tb01246.x
Gosch M., Hernandez-Milian G., Rogan E., Jessopp M., Cronin M. (2014). Grey seal diet analysis in Ireland highlights the importance of using multiple diagnostic features. Aquat Biol. 20, 155–167. doi: 10.3354/ab00553
Gruber C. (2014). Social. Economic, and Spatial Perceptions of Gray Seal (Halichoerus grypus) Interactions with Commercial Fisheries in Cape Cod, MA. Nicholas School of the Environment of Duke University. Master’s project, Duke University, Durham, NC. 68p. Retrieved from https://hdl.handle.net/10161/8473.
Guerra A. S. (2019). Wolves of the Sea: Managing human-wildlife conflict in an increasingly tense ocean. Mar. Policy 99, 369–373. doi: 10.1016/j.marpol.2018.11.002
Hammill M., Stensen G., Swain D., Benoit H. (2014). Feeding by Gray Seals on Endangered Stocks of Atlantic cod and white hake. ICES J. Mar. Sci. doi: 10.1093/icesjms/fsu123
Hammill M. O., Stenson G. B., Proust F., Carter P., McKinnon D. (2007). Feeding by grey seals in the Gulf of St. Lawrence and around Newfoundland Vol. 6 (Tromso, Norway: NAMMCO Sci. Publ), 135–152. doi: 10.7557/3.2729
Hare J. A., Morrison W. E., Nelson M. W., Stachura M. M., Teeters E. J., Griffis R. B. (2016). A vulnerability assessment of fish and invertebrates to climate change on the Northeast U.S. Continental shelf. PLoSONE 11, e0146756. doi: 10.1371/journal.pone.0146756
Hayes S. A., Josephson E., Maze-Foley K., Rosel P. E., Turek. J. (2021). US Atlantic and Gulf of Mexico Marine Mammal Stock Assessments 2020 National Marine Fisheries Service NOAA Technical Memorandum NMFS-NE-271. (Silver Spring, MD: National Oceanic and Atmospheric Administration). Available at: https://www.fisheries.noaa.gov/national/marine-mammal-protection/marine-mammal-stock-assessment-reports-region#2020-reports.
Heithaus M. R., Dill L. M. (2009). “Feeding Strategies and Tactics,” in Encyclopedia of Marine Mammals, 2nd ed. Eds. Perrin W. F., Wursig B., Thewissen &J. (Cambridge, Massachusetts: Academic Press). doi: 10.1016/B978-0-12-373553-9.00099-7
Hernandez K. M., Bogomolni A. L., Moxley J. H., Waring G. T., DiGiovanni R. A. Jr., Hammill M. O., et al. (2019a). Seasonal variability and individual consistency in gray seal (Halichoerus grypus) isotopic niche. Can. J. Zool 97, 1071–1077. doi: 10.1139/cjz-2019-0032
Hernandez K., Sette L., Gast R. J., Bogomolni A. L., Murray K., Polito M. (2019b). “Multiple dietary techniques indicate little use of commercial fisheries by gray seals (Halichoerus grypus atlantica) in US waters,” in Poster session presented at: 2nd World Marine Mammal Conference. WMMC'19 World Marine Mammal Conference, Together for Science and Conservation, Barcelona , Catalonia Spain. © 2019 World Marine Mammal Science Conference.
Hui T. C. Y., Gryba R., Gregr E. J., Trites A. W. (2015). Assessment of competition between fisheries and steller sea lions in Alaska based on estimated prey biomass, fisheries removals and predator foraging behaviour. PLoSONE 10, e0123786. doi: 10.1371/journal.pone.0123786
Iverson S. J. (2009). “Tracing aquatic food webs using fatty acids: from qualitative indicators to quantitative determination,” in Lipids in Aquatic Ecosystems. Eds. Kainz M., Brett M., Arts M. (Springer, New York, NY).
Jackman J., Bettnecourt L., Vaske J., Sweeney M., Katharine B., Rutberg A., et al. (2018). Conflict and consensus in stakeholder views of seal management on Nantucket Island, MA, USA. Mar. Policy. 95, 166–173. doi: 10.1016/j.marpol.2018.03.006
Jeanniard-du-Dot T., Thomas A. C., Cherel Y., Trites A. W., Guinet. C. (2017). Combining hard-part and DNA analyses of scats with biologging and stable isotopes can reveal different diet compositions and feeding strategies within a fur seal population. Mar. Ecol. Prog. Ser. 584, 1–16. doi: 10.3354/meps12381
Jobling M., Breiby A. (1986). The use and abuse of fish otoliths in studies of feeding habits of marine piscivores. Sarsia 71, 265–274. doi: 10.1080/00364827.1986.10419696
Johnston D. W., Frungillo J., Smith A., Moore K., Sharp B., Schuh J., et al. (2015). Trends in stranding and by-catch rates of gray and harbor seals along the northeastern coast of the United States: Evidence of divergence in the abundance of two sympatric phocid species? PloS One 10, e0131660. doi: 10.1371/journal.pone.0131660
Jones D. V., Rees D. R., Bartlett B. A. (2018). Haul-out Counts and Photo-Identification of Pinnipeds in Chesapeake Bay and Eastern Shore, Virginia: 2017/2018 Annual Progress Report. Final Report. Prepared for U.S. Fleet Forces Command, Norfolk, Virginia. 21 December 2018. (Norfolk, Virginia: NAVFAC Atlantic). Available at: https://www.navymarinespeciesmonitoring.us/files/2715/4706/9482/Jones_et_al._2018_-_Seal_Surveys_2017-2018.pdf.
Kaschner K., Pauly D. (2005). “Competition between marine mammals and fisheries: Food for thought,” in The state of animals III: 2005. Eds. Salem D. J., Rowan A. N. (Humane Society of the United States Press, Washington, DC), 95–117.
Kindt R., Coe R. (2005). Tree diversity analysis: A manual and software for common statistical methods for ecological and biodiversity studies. World Agroforestry Centre, Nairobi Kenya. Available at: http://www.worldagroforestry.org/output/tree-diversity-analysis.
Kirsch P. E., Iverson S. J., Bowen W. D. (2000). Effect of a low-fat diet on body composition and blubber fatty acids of captive juvenile harp seals (Phoca groenlandica). Physiol. Biochem. Zool. 73, 45–59. doi: 10.1086/316723
Kleisner K. M., Fogarty M. J., McGee S., Hare J. A., Moret S., Perretti C. T., et al. (2017). Marine species distribution shifts on the US Northeast Continental Shelf under continued ocean warming. Prog. Oceanogr. 153, 24. doi: 10.1016/j.pocean.2017.04.001
Konigson S., Fjallin A., Berglind M., Lunneryd S. G. (2013). Male gray seals specialize in raiding salmon traps. Fisheries Res. 148, 117–123. doi: 10.1016/j.fishres.2013.07.014
Konigson S., Lunneryd S. G., Sundqvist F. (2009). Grey seal predation in cod gillnet fisheries in the central Baltic sea. J. Northwest Atlantic Fisheries Science. 42, 41–47. doi: 10.2960/J.v42.m654
Kulatska N., Woods P. J., Þór Elvarsson B., Bartolino V. (2021). Size-selective competition between cod and pelagic fisheries for prey. ICES J. Mar. Science Volume 78, 1872–1886. doi: 10.1093/icesjms/fsab094
Kusnierz P. C., Trial J. G., Cox O. N., Saunders R. (2014). Seal induced injuries on adult Atlantic salmon returning to Maine. Mar. Coast. Fisheries 6, 119–126. doi: 10.1080/19425120.2014.893466
Lelli B., Harris D. E., Aboueissa A. E.-M. (2009). Seal bounties in Maine and Massachusetts 1888 to 1962. Northeastern Nat. 16, 239–254. doi: 10.1656/045.016.0206
Lerner J. E., Ono K., Hernandez K. M., Runstadler J. A., Puryear W. B., Polito M. J. (2018). Evaluating the use of stable isotope analysis to infer the feeding ecology of a growing US gray seal (Halichoerus grypus) population. PLOSone 13, e0192241. doi: 10.1371/journal.pone.0192241
Lettrich M. D., Asaro M. J., Borggaard D. L., Dick D. M., Griffis R. B., Litz J. A., et al. (2023). Vulnerability to climate change of United States marine mammal stocks in the western North Atlantic, Gulf of Mexico, and Caribbean. PloS One 18, e0290643. doi: 10.1371/journal.pone.0290643
Marshall K. N., Stier A. C., Samhouri J. F., Kelly R. P., Ward E. J. (2015). Conservation challenges of predator recovery. Conserv. Lett. 9, 70–78. doi: 10.1111/conl.12186
Martins M. C., Sette L., Josephson E., Bogomolni A., Rose K., Sharp S. M., et al. (2019). Unoccupied aerial system assessment of entanglement in Northwest Atlantic gray seals (Halichoerus grypus). Mar. Mammal Sci. 35 (4), 1613–1624. doi: 10.1111/mms.12590
Matić-Skoko S., Tutman P., Varezić D. B., Skaramuca D., Đikić D., Lisičić D., et al. (2014). Food preferences of the Mediterranean moray eel, Muraena helena (Pisces: Muraenidae), in the southern Adriatic Sea. Mar. Biol. Res. 10, 807–815. doi: 10.1080/17451000.2013.863351
McBride R. S., Hauser J. W., Sutherland S. J. (2010) Brodeur’s guide to otoliths of some northwest Atlantic fishes. Northeast Fish Sci Cent Ref Doc. 10-04; 35 p. Available from: National Marine Fisheries Service, 166 Water Street, Woods Hole, MA 02543-1026. Available online at: https://repository.library.noaa.gov/view/noaa/3889.
McCosker M., Flanders K., Ono K., Dufault M., Mellone D., Olson Z. (2020). Meta-barcoding fecal DNA reveals extent of halichoerus grypus (Gray seal) foraging on invertebrates and incidence of parasite exposure. Northeastern Nat. 27, 681–700. doi: 10.1656/045.027.0409
McLaren I. A. (1993). Growth in pinnipeds. Biol. Rev. 68, 1–79. doi: 10.1111/j.1469-185X.1993.tb00731.x
McLaren I. A., Smith T. G. (1985). Population ecology of seal: retrospective and prospective views. Mar. Mam. Sci. 1, 54–83. doi: 10.1111/j.1748-7692.1985.tb00531.x
Microsoft Corporation (2016) Microsoft Excel. Available online at: https://office.microsoft.com/excel.
Morissette L., Christensen V., Pauly. D. (2012). Marine mammal impacts in exploited ecosystems: would large scale culling benefit fisheries? PloS One 7, e43966. doi: 10.1371/journal.pone.0043966
Murie D. J., Lavigne D. M. (1986). Interpretation of otoliths in stomach content analyzes of phocid seals: quantifying fish consumption. Can. J. Zool. 64, 1152–1157. doi: 10.1139/z86-174
Murray K. M., Hatch J. M., DiGiovanni R. A. Jr., Josephson E. (2021). Tracking young-of-the-year gray seals Halichoerus grypus to estimate fishery encounter risk. Mar. Ecol. Prog. Series 671, 235–245. doi: 10.3354/meps13765
National Marine Fisheries Service [NMFS] (2011). U.S. National Bycatch Report. Eds. Karp W. A., Desfosse L. L., Brooke S. G. (Silver Spring, Maryland: U.S. Dep. Commer., NOAA Tech. Memo. NMFS-F/SPO-117E), 508. Available at: https://spo.nmfs.noaa.gov/sites/default/files/tm117E.pdf
National Marine Fisheries Service [NMFS] (2016a) National Bycatch Reduction Strategy. US Dept of Commerce, NOAA, NMFS 1315 East-West Highway, SSMC 3, F/SF, Room 13362, Silver Spring, MD 20910. Available online at: https://repository.library.noaa.gov/view/noaa/17062.
National Marine Fisheries Service [NMFS] (2016b) NOAA Fisheries Ecosystem-Based Fisheries Management Road Map. NMFS Procedure 01-120-01. Effective on: November 17, 2016. Available online at: https://www.fisheries.noaa.gov/resource/document/ecosystem-based-fisheries-management-road-map.
Nelson B. W., Walters C. J., Trites A. W., McAllister. M. K. (2019). Wild Chinook salmon productivity is negatively related to seal density and not related to hatchery releases in the Pacific Northwest. Can. J. Fisheries Aquat. Sci. 76, 447–462. doi: 10.1139/cjfas-2017-0481
Neuenhoff R. D., Swain D. P., Cox S. P., McAllister M. K., Trites A. W., Walters C. J., et al. (2019). Continued decline of a collapsed population of Atlantic cod (Gadus morhua) due to predation-driven Allee effects. Can. J. Fish Aq Sci. 76, 168–184. doi: 10.1139/cjfas-2017-0190
Northeast Fisheries Science Center [NEFSC] (2023) State of the Ecosystem 2023: New England. Available online at: https://www.fisheries.noaa.gov/new-england-mid-atlantic/ecosystems/state-ecosystem-reports-northeast-us-shelf.
Nye J. A., Gamble R. J., Link J. S. (2013). The relative impact of warming and removing top predators on the Northeast US large marine biotic community. Ecol. Modelling 264, 157–168. doi: 10.1016/j.ecolmodel.2012.08.019
Nye J. A., Link J. S., Hare J. A., Overholtz W. J. (2009). Changing spatial distribution of fish stocks in relation to climate and population size on the Northeast United States continental shelf. Mar. Ecol. Prog. Ser. 393, 111–129. doi: 10.3354/meps08220
O’Boyle R., Sinclair M. (2012). Seal-cod interactions on the Eastern Scotian Shelf: Reconsideration of modeling assumptions. Fish. Res. 115-116, 1–13. doi: 10.1016/j.fishres.2011.10.006
Oksanen J., Simpson G., Blanchet F., Kindt R., Legendre P., Minchin P., et al. (2022). Vegan Community Ecology Package (R package version. 2.6-4). R Foundation, Vienna, Austria. Available at: https://CRAN.R-project.org/package=vegan.
Olesiuk P. F., Bigg M. A., Ellis G. M., Crockford S. J., Wigen. R. J. (1990). An assessment of the feeding habits of harbour seals (Phoca vitulina) in the Strait of Georgia, British Columbia, based on scat analysis. Can. Tech. Rep. Fish. Aquat. Sci. 1730, 135. Available at: https://publications.gc.ca/site/eng/459829/publication.html.
Ono K. A., Steinbeiser C. M., Coco A. B., Sheehan M. J., Beck A. J., Dufault M. N., et al. (2019). Detecting spiny dogfish in gray seal diets. Conserv. Genet. Resour 11, 481–485. doi: 10.1007/s12686-018-1044-x
Orphanides C., Wenzel F. W., Collie J. (2020). Diet of harbor porpoises (Phocoena phocoena) on the continental shelf off southern New England. Fishery Bulletin 118, 184–197. doi: 10.7755/FB.118.2.7
Orr A. J., Banks A. S., Mellman S., Huber H. R., DeLong R. L., Brown R. F. (2004). Examination of the foraging habits of Pacific harbor seal (Phoca vitulina richardsi) to describe their use of the Umpqua River, Oregon and their predation on salmonids. Fishery Bull. 102 (1), 108–117. Available at: https://spo.nmfs.noaa.gov/content/examination-foraging-habits-pacific-harbor-seal-phoca-vitulina-richardsi-describe-their-use.
Ouellet P., Savenkoff C., Benoıˆt H. P., Galbraith P. S. (2016). A comparison of recent trends in demersal fish biomass and their potential drivers for three ecoregions of the Gulf of St Lawrence, Canada. ICES J. Mar. Sci. 73, 329–344. doi: 10.1093/icesjms/fsv133
Pace M. P., Josephson E., Wood S. A., Murray K., Waring G. (2019). Trends and Patterns of Seal Abundance at Haul-out Sites in a Gray Seal Recolonization Zone (Woods Hole, Massachusetts: NOAA Technical Memorandum NMFS-NE-251). doi: 10.25923/qd3s-we77
Payne P. M., Selzer L. A. (1989). The distribution, abundance and selected prey of the harbor seal, Phoca vitulina concolor, in southern New England. Mar. Mammal Sci. 5, 173–192. doi: 10.1111/j.1748-7692.1989.tb00331.x
Perrin W. F., Wursig B., Thewissen J. (2009). Encyclopedia of Marine Mammals. 2nd ed. (Cambridge Massachusetts: Academic Press). doi: 10.1016/B978-0-12-373553-9.X0001-6
Pierce G. J., Boyle P. R. (1991). A review of methods for diet analysis in piscivorous marine mammals. Oceanogr. Mar. Biol. Annu. Rev. 29, 409–486. Available at: https://abdn.elsevierpure.com/en/publications/a-review-of-methods-for-diet-analysis-in-piscivorous-marine-mamma.
Pinsky M. L., Worm B., Fogarty M. J., Sarmiento J. L., Levin S. A. (2013). Marine taxa track local climate velocities. Science 341, 1239–1242. doi: 10.1126/science.1239352
Pitchford S. C., Smith B. E., McBride R. S. (2020). A real-time PCR assay to detect predation by spiny dogfish on Atlantic cod in the western North Atlantic Ocean. Ecol. Evol. 00:1–9. doi: 10.1002/ece3.6694
Plaganyi E. E., Butterworth D. S. (2009). “Competition with Fisheries,” in Encyclopedia of Marine Mammals. Eds. Perrin W. F., Wursig B., Thewissen J. (Cambridge Massachusetts: Academic Press). doi: 10.1016/B978-0-12-373553-9.00065-1
Posit Team (2022). RStudio: Integrated Development Environment for R (Boston, MA: Posit Software, PBC). Available at: http://www.posit.co/.
Precoda K., Orphanides C. D. (2022). Estimates of cetacean and pinniped bycatch in the 2019 New England sink and Mid-Atlantic gillnet fisheries (Woods Hole, Massachusetts: US Dept Commer, Northeast Fish Sci Cent Ref Doc. 22-05), 21. doi: 10.25923/vv44-jc03
Pugliares K. R., Bogomolni A., Touhey K. M., Herzig S. M., Harry C. T., Moore M. J. (2007). Marine Mammal Necropsy: An introductory guide for stranding responders and field biologists. Woods Hole Oceanog. Inst. Tech. Rept. (Woods Hole, MA 02543: WHOI-2007-06. MBLWHOI Library). doi: 10.1575/1912/1823
Rafferty A. R., Brazer E. O. Jr., Reina R. D. (2012). Depredation by harbor seal and spiny dogfish in a Georges Bank gillnet fishery. Fisheries Manage. Ecol. 19, 264–272. doi: 10.1111/j.1365-2400.2011.00837.x
R Core Team (2022). R: A language and environment for statistical computing (Vienna, Austria: R Foundation for Statistical Computing). Available at: https://www.R-project.org/.
Robards M. D., Willson M. F., Armstrong R. H., Piatt J. F. (Eds.) (1999). Sand lance: a review of biology and predator relations and annotated bibliography. Res. Pap. PNW-RP-521 (Portland, OR: U.S. Department of Agriculture, Forest Service, Pacific Northwest Research Station), 327.
Roman J., Altman I., Dunphy-Daly M. M., Campbell C., Jasny M., Read. A. J. (2013). The Marine Mammal Protection Act at 40: status, recovery, and future of US marine mammals. Ann. New Y. Acad. Sci. 1286, 29–49. doi: 10.1111/nyas.12040
Rossi S. P., Cox S. P., Hammill M. O., den Heyer C. E., Swain D. P., Mosnier A., et al. (2021). Forecasting the response of a recovered pinniped population to sustainable harvest strategies that reduce their impact as predators. ICES J. Mar. Sci. 78, 1804–1814. doi: 10.1093/icesjms/fsab088
Russell D. J. F., McClintock B. T., Matthiopoulos J., Thompson P. M., Thompson D., Hammond P. S., et al. (2015). Intrinsic and extrinsic drivers of activity budgets in sympatric gray and harbor seals. Oikos 124, 1462–1472. doi: 10.1111/oik.01810
SAS Institute Inc. (2020). SAS/STAT® 15.2 User’s Guide. Cary, NC: SAS Institute Inc. Available at: https://documentation.sas.com/doc/en/statug/15.2/titlepage.htm
Schakner Z. A., Buhnerkempe M. G., Tennis M. J., Stansell R. J., van der Leeuw B. K., Lloyd-Smith J. O., et al. (2016). Epidemiological models to control the spread of information in marine mammals. Proc. R. Soc B 283, 20162037. doi: 10.1098/rspb.2016.2037
Scharff-Olsen C. H., Galatius A., Tielmann J., Dietz R., Andersen S. M., Jarnit S., et al. (2018). Diet of Seals in the Baltic Sea Region: a synthesis of published and new data from 1968 to 2013. ICES J. Mar. Sci. 76 (1), 284–297. doi: 10.1093/icesjms/fsy159
Shelton A. O., Gold Z. J., Jensen A. J., D Agnese E., Andruszkiewicz Allan E., van Cise A., et al. (2023). Toward quantitative metabarcoding. Ecology 104, e3906. doi: 10.1002/ecy.3906
Sigourney D. B., Murray K. T., Gilbert J. R., Ver Hoef J. M., Josephson E., DiGiovanni R. (2022). Application of a Bayesian hierarchical model to estimate trends in Atlantic harbor seal (Phoca vitulina vitulina) abundance in Maine, U.S.A. 1993–2018. Mar. Mammal Sci. 38 (2), 500–516. doi: 10.1111/mms.12873
Sirak L. N. (2015). Gray (Halichoerus grypus) And Harbor Seal (Phoca vitulina) Bycatch And Depredation In New England Sink- Gillnet Fisheries, All Theses and Dissertations. 120. University of New England, Biddeford, Maine. Available at: http://dune.une.edu/theses/120.
Skomal G. B., Chisholm J., Correia S. J. (2012). “Implications of increasing pinniped populations on the diet and abundance of white sharks off the coast of Massachusetts,” in Global perspectives on the biology and life history of the white shark. Ed. Domeier M. (CRC Press, Boca Raton. FL).
Smith L. A., Link J. S., Cadrin S. X., Palka D. L. (2015). Consumption by marine mammals on the Northeast U.S. Continental shelf. Ecol. Appl. 25, 373–389. doi: 10.1890/13-1656.1
Smout S., Rindorf A., Hammond P. S., Harwood J., Matthiopoulos J. (2014). Modelling prey consumption and switching by UK grey seals. ICES J. Mar. Sci. 71, 81–89. doi: 10.1093/icesjms/fst109
Sørlie M., Nilssen K. T., Bjørge A., Freitas C. (2020). Diet composition and biomass consumption of harbour seals in Telemark and Aust-Agder, Norwegian Skagerrak. Mar. Biol. Res. 16, 299–310. doi: 10.1080/17451000.2020.1751205
Staudinger M. D., Goyert H., Suca J. J., Coleman K., Welch L., Llopiz J. K., et al. (2020). The role of sand lances (Ammodytes sp.) in the Northwest Atlantic Ecosystem: A synthesis of current knowledge with implications for conservation and management. Fish Fisheries 21, 522–556. doi: 10.1111/faf.12445
Swain D. P., Benoît H. P. (2015). Extreme increases in natural mortality prevent recovery of collapsed fish populations in a Northwest Atlantic ecosystem. Mar. Ecol. Prog. Ser. 519, 165–182. doi: 10.3354/meps11012
Thiemann G. W., Iverson S. J. (2008). Variation in blubber fatty acid composition among marine mammals in the Canadian arctic. Mar. Mammal Sci. 24, 91–111. doi: 10.1111/j.1748-7692.2007.00165.x
Thiemann G. W., Iverson S. J., Stirling I. (2009). Using fatty acids to study marine mammal foraging: the evidence from an extensive and growng literature. Mar. Mammal Sci. 25, 243–249. doi: 10.1111/j.1748-7692.2008.00258.x
Tollit D. J., Heaslip S. G., Barrick R. L., Trites A. W. (2007). Impact of diet-index selection and the digestion of prey hard remains on determining the diet of the Steller sea lion (Eumetopias jubatus). Can. J. Zool. 85, 1–15. doi: 10.1139/z06-174
Trites A. W., Christensen V., Pauly D. (1997). Competition between fisheries and marine mammals for prey and primary production in the Pacific ocean. J. Northwest Atlantic Fisheries Sci. 22, 173–187. doi: 10.2960/J.v22.a14
Trull P. (2015). The gray curtain: the impact of seals, sharks and commercial fishing on the Northeast coast (Atglen, PA: Schiffer Publishing).
Trzcinski M. K., Mohn R., Bowen W. D. (2006). Continued decline of an atlantic cod population: how important is gray seal predation. Ecol. Appl. 16, 2276–2292. doi: 10.1890/1051-0761(2006)016[2276:CDOAAC]2.0.CO;2
Waring G. T., Gilbert J. R., Loftin J., Cabana N. (2006). Short-term movements of radio-tagged Harbor seals in New England. Northeastern Naturalist 13, 1–14. doi: 10.1656/1092-6194(2006)13[1:SMORHS]2.0.CO;2
Wenzel F. W., Early G., Josephson E., Greer B., Lentell B., Polloni P., et al. (2017). “What does stomach content analysis tell us about the diet of gray seals (Halichoerus grypus atlantica) incidentally caught in fisheries off the northeast United States?,” in A Marine Mammal Odyssey, Eh!, The Society for Marine Mammalogy's 22nd Biennial Conference on the Biology of Marine Mammals. October 22-27, 2017. World Trade and Convention Centre, Halifax, Nova Scotia, Canada. The Society of Marine Mammalogy.
Wenzel F. W., Martins A., Craddock J. E., Early G., Josephson E., Lentell B., et al. (2015). “Long term study on the feeding ecology of U.S. northwest Atlantic harbor seals (Phoca vitulina concolor),” in Bridging the Past Towards the Future. 21st Biennial Society for Marine Mammalogy Conference on the Biology of Marine Mammals, 13-18 December 2015, Hilton San Francisco Union Square, San Francisco, California USA. The Society of Marine Mammalogy
Wenzel F. W., Polloni P. T., Craddock J. E., Gannon D. P., Nicolas J. R., Read A. J., et al. (2013). Food habits of Sowerby’s beaked whales (Mesoplodon bidens) taken in the pelagic drift gillnet fishery of the western North Atlantic. Fish. Bull. 111, 381–389. doi: 10.7755/FB.111.4.7
Williams A. (1999). Prey selection by harbor seals in relation to fish taken by the Gulf of Maine sink gillnet fishery. Master of Science Thesis. University of Maine, Orono, Maine, 74p.
Wilson L. J., Hammond P. S. (2019). The diet of harbor and grey seals around Britain: Examining the role of prey as a potential cause of harbour seal declines. Aquat. Conserv: Mar. Freshw. Ecosyst. 29, 71–85. doi: 10.1002/aqc.3131
Wood S. N. (2017). Generalize Additive Models: An Introduction with R. 2nd edition (New York: Chapman and Hall/CRC). doi: 10.1201/9781315370279
Wood S. A., Josephson E., Precoda K., Murray K. T. (2022). Gray seal (Halichoerus grypus) pupping trends and 2021 population estimates in U.S. waters (Woods Hole, Massachusetts: US Dept Commer Northeast Fish Sci Cent Ref Doc. 22-14), 16. doi: 10.25923/9hjq-gb82
Wood S. A., Murray K. M., Josephson E., Gilbert J. (2020). Rates of increase in gray seal (Halichoerus grypus atlantica) pupping at recolonized sites in the United States 1988-2019. J. Mammology 101, 121–128. doi: 10.1093/jmammal/gyz184
Yodzis P. (2001). Must top predators be culled for the sake of fisheries? Trends Ecol. Evol. 16, 78–84. doi: 10.1016/s0169-5347(00)02062-0
Keywords: harbor seal, gray seal, bycatch, diet, prey, commercial fishermen
Citation: Lyssikatos MC and Wenzel FW (2024) What bycatch tells us about the diet of harbor and gray seals and overlap with commercial fishermen. Front. Conserv. Sci. 5:1377673. doi: 10.3389/fcosc.2024.1377673
Received: 28 January 2024; Accepted: 11 March 2024;
Published: 10 April 2024.
Edited by:
Jennifer Jackman, Salem State University, United StatesReviewed by:
Alex M. Costidis, Self-employed, Norfolk, VA, United StatesTimothy C. Haas, University of Wisconsin–Milwaukee, United States
Copyright © 2024 Lyssikatos and Wenzel. This is an open-access article distributed under the terms of the Creative Commons Attribution License (CC BY). The use, distribution or reproduction in other forums is permitted, provided the original author(s) and the copyright owner(s) are credited and that the original publication in this journal is cited, in accordance with accepted academic practice. No use, distribution or reproduction is permitted which does not comply with these terms.
*Correspondence: Marjorie C. Lyssikatos, TWFyam9yaWUubHlzc2lrYXRvc0Bub2FhLmdvdg==
†Retired