 Grace Danon1
 Cody E. Dunn1
 Michael Robins1
 Arundati Nagendra2,†Chuck Strand3,†
 Lisa Palko4,†Adam Colborn5,†Jackie Menjivar6,†
 Junko Saber1*
- 1Innopiphany LLC., Irvine, CA, United States
- 2Schizophrenia and Psychosis Action Alliance, Alexandria, VA, United States
- 3Rural Minds, Mayville, NY, United States
- 4Society for Digital Mental Health, Irvine, CA, United States
- 5Academy of Managed Care Pharmacy, Alexandria, VA, United States
- 6Mental Health America, Alexandria, VA, United States
Introduction: Prescription Digital Therapeutics (PDTs) hold unique potential to improve mental health in underserved rural areas. However, potential users' perceptions towards PDTs and community-specific differences in barriers to care are not well-understood.
Methods: We conducted an online survey of 351 U.S. adults with ≥1 mental health condition and care-seeking behaviors. Descriptive statistics and non-parametric tests were used to evaluate rural and non-rural differences in demographics, social determinants of health, current barriers to mental health treatment, and the perceived value of PDTs. Key limitations of this approach include self-reported rurality and digital access bias associated with online survey distribution.
Results: Barriers to mental healthcare impacted 60% of all rural respondents, and rurality was associated with unique challenges like lower incomes, lower education levels, substantial Medicaid enrollment, and further distances from care. Rural respondents were also more likely to be completely unfamiliar with digital apps for mental health treatment. 89% of all respondents thought PDTs could address at least one barrier to care and about 97% of respondents were likely to use a PDT recommended by their provider.
Discussion: Existing gaps in care and positive perceptions towards PDTs demonstrate unique promise for these modalities to address unmet mental health needs. However, lower PDT familiarity among rural respondents suggests a need for provider intervention and policy reforms.
1 Introduction
In the U.S., 23% of adults—nearly 60 million Americans—reported experiencing a mental illness in the past year, yet over half (54.7%) did not receive treatment (1, 2). Complex environmental and social factors contribute to this shortfall, and certain communities experience inequitable impacts (3). This includes the 20% of Americans living in rural areas, who often face gaping disparities in mental healthcare access stemming from a milieu of infrastructural and sociocultural factors (4–6). Sixty-five percent and 47% of rural counties lack a resident psychiatrist and psychologist, respectively, compared to 27% and 19% of metropolitan counties (7). Securing transportation to this physically distant care may be especially burdensome for those who lack public transit or depend on others for their transportation (8). Even telemedicine remains unfeasible for some rural areas, where broadband may be limited or entirely unavailable (9–12).
Financial factors like lower socioeconomic status, higher unemployment, higher utilization of public health insurance, or lack of insurance altogether further impede rural mental healthcare access (10, 13, 14). These elements translate to reduced access to health information which deters appropriate and effective mental healthcare (15). In parallel, rural sociocultural influences—such as expectations of self-reliance, stigma associated with mental health, and less privacy in smaller communities—function as individual-level deterrents to seeking care (6, 16–18). Low treatment rates and poor care management as a result of these cultural influences and resource constraints point to the inadequacy of current modalities and a need for innovative alternatives that diversify care for rural communities (6, 19).
One proposed solution is Prescription Digital Therapeutics (PDTs): remote, software-based treatments that deliver clinically validated therapies on devices like smartphones or tablets (20). Unlike direct-to-consumer digital health apps, PDTs must be 1. tested in clinical trials, 2. reviewed by a regulatory body [e.g., the United States Food and Drug Administration (FDA)] for efficacy and safety, and 3. prescribed by a healthcare provider (21). Currently, the FDA has cleared over 20 PDTs targeting a variety of conditions like irritable bowel syndrome, chronic lower back pain, and diabetes (22, 23).
Mental health is an especially promising application for PDTs given the demonstrated efficacy in this area, clear regulatory pathways, and opportunity to alleviate provider-patient imbalances (21, 24). Used independently or in combination with pharmacotherapy or cognitive-behavioral therapy, mental health PDTs are designed to provide evidence-based treatment in a convenient, user-friendly, and personalized format. Their scalability and ability to reduce in-person provider visits could offset treatment costs, while continuous monitoring and outcomes tracking may streamline care (22, 25). In this way, PDTs could be especially useful for rural populations who might benefit from fewer in-person interactions and additional support between appointments (3, 26, 27). With rigorous data and privacy standards in place, the option to be treated anonymously in one's own home may mitigate rural undertreatment stemming from mental health stigma (26).
However, similar to telemedicine, PDTs that depend on smartphone use or internet connectivity may be less feasible for users in “digital deserts,” where broadband is limited or unavailable (28–30). In conjunction, lower digital literacy might hamper interest among historically disadvantaged groups or compromise effective engagement once prescribed (28). Privacy and data security concerns also hinder willingness to use PDTs, particularly among populations with intergenerational distrust of the medical system (29). Ensuring that digitization mitigates, rather than exacerbates, health disparities requires thorough consideration of the factors shaping access to care. Quantitative and qualitative studies have evaluated such barriers and facilitators to digital mental health use; however, these generally probed on a wide scope of interventions (e.g., general “health apps” or telemedicine) rather than FDA-cleared and physician-prescribed therapeutics (31, 32). Both features could serve as impactful drivers of value, necessitating evaluation both separately and within the context of broader digital health benefits (33, 34).
In addition, few studies have considered the impact of rurality on the perceived utility of PDTs, despite its clear ties to both mental health treatment and digital access (35). One exception is a study by Jongebloed et al., which identified strong rural engagement with digital health products in Australia, however, findings were limited by the sample's high baseline digital literacy (36). A second, more applicable example involved a small qualitative survey of U.S. veterans (n = 66), which observed an overall lack of awareness about “mental health smartphone apps” and lower receptivity among rural veterans (37).
In developing a quantitative approach, ex-U.S. studies comprised the most informative research for this purpose, likely owing to the enhanced integration of PDTs into mainstream care via centralized market access and reimbursement frameworks (38). A study in two German academic centers surveyed urology patients to assess age-based differences in the use of digital therapeutics and valued product qualities (39). Another German study evaluated use, adherence, acceptance, and perceived PDT efficacy among a small sample of rheumatology patients (40). While these were not specific to mental health or rurality, the statistical analyses performed in these studies serves as an illustrative precedent.
To optimize capture of the lived experience and prioritize the interests of those directly impacted by this research, a diverse group of mental health advocates and digital health experts provided input on the study's design and interpretation. Drawing from these advising co-authors' recommendations and the existing literature, we developed the first quantitative, U.S.-based study that 1. focused on mental health and existing barriers to care, 2. probed perceptions of PDTs specifically, rather than digital health more broadly, and 3. meaningfully explored the impact of community setting on PDT receptivity (31, 32). The objective of this research was to apply an advocacy-led, people-centered approach (i.e., focused on the priorities and needs of those affected by the research) to evaluate differences in the treatment experiences of rural and non-rural (i.e., urban and suburban) people living with a mental health condition and the perceived utility of PDTs across settings (41). Understanding these community-level differences will likely be critical for integrating PDTs into treatment decision-making.
2 Materials and methods
2.1 Sample and study design
An online survey was administered to a sample of 351 rural (n = 145) and non-rural (n = 206) U.S. adults residing in any state/region in December 2024. Inclusion criteria and survey questions were developed based on a targeted literature review and input from the advising co-authors.
Due to the dearth of relevant existing literature, the survey was powered a priori to compare rural and non-rural perceptions of PDTs using rural vs. urban perceptions of neurology telehealth visits as a proxy (α = 0.05, β = 0.2, Mann–Whitney U test) (42–44). Due to de-identification concerns associated with using zip codes, participants were asked to self-report their community type as rural, suburban, or urban based on simple definitions: “a small town or the countryside,” “a residential area near a city,” or “a medium or large city,” respectively. Per the recommendation of a rural mental health advocacy group, participants identifying as urban or suburban were combined into a single “non-rural” category based on the binary precedent of defining rural as “non-metro” i.e., not urban or suburban (45–47). The survey assessed rural and non-rural differences for the following: social determinants of health (defined as nonmedical factors that shape health outcomes) (48); familiarity with digital health technologies; current methods of receiving mental healthcare; challenges to receiving care; and interest in and perceived value of PDTs, including their potential to address barriers to care.
2.2 Data collection
We aimed to recruit a diverse sample of care-seeking individuals living with at least one mental health condition, while still including those who had fallen out of care. A 10-question, self-reported eligibility questionnaire (approximately 4 min) required participants to meet the following inclusion criteria: 1. 18 years of age or older, 2. living with at least one, but no more than three, of the following mental health conditions: depression; anxiety; attention deficit disorder (ADHD); bipolar disorder; schizophrenia, schizoaffective, or another primary psychosis disorder (first episode psychosis); post-traumatic stress disorder (PTSD); or substance use disorder, and 3. demonstrating care-seeking behaviors to ensure a baseline interest in treatment. People living with only conduct disorder (which occurs predominately in children and adolescents), eating disorder (more prevalent among adolescents), or “other” were not eligible for the survey, but could be included if 1–2 of the eligible conditions were reported (49, 50).
Recruitment minimums and maximums were also set to ensure diversity within the sample and alignment with the target population. The minimum number of rural participants (n = 135) was based on a power analysis, as previously mentioned. Other minimums were informed by a targeted literature search and anticipated patient availability. These included: ≥35 patients with schizophrenia, schizoaffective, or another primary psychosis disorder (first episode psychosis), ≤50 patients with only ADHD, ≤225 White-Only patients, ≥50 patients that are 20–30 min from the closest in-person medical care, ≥50 patients that are more than 30 min from the closest in-person medical care (51–53). ADHD onset, diagnosis, and treatment typically occur in childhood. However, a portion of ADHD diagnoses persist into adulthood, and ADHD is an especially viable therapeutic area for PDTs (20, 54–56). As a result, a maximum was imposed for individuals living only with ADHD rather than excluding this group altogether. Additionally, given the pervasive undertreatment of schizophrenia, schizoaffective, and other primary psychosis disorders, a minimum was set for these conditions to ensure adequate representation despite a relatively low prevalence and known recruitment difficulties (57). Finally, the criterion for participants living more than 30 min from their closest in-person medical care was loosened to ≥50 patients living at least 20 min from their closest in-person medical care due to challenges recruiting sufficient respondents (final count: n = 36 living 20–30 min from care; n = 14 living >30 min from care).
Eligible participants completed a 16-question survey (approximately 6–8 min) including multiple choice, forced ranking, and rating scales based on a modified Likert scale, binary selection, and optional free response. All eligibility and survey questions are provided in the Supplementary Materials.
A third-party vendor programmed and hosted the survey. Two patient networks were used to secure sufficient sample sizes in a timely manner. The survey vendor managed responses and ensured there was no overlap between the networks. The usability and technical functionality of the survey were tested prior to fielding. The survey was voluntary and available for one-time completion through an online platform among registered individuals within the networks, which prevented duplicate entries. Participants were provided with the survey's length and description; the investigator name; the purpose, risks, and benefits of the study; and data security measures. Participants who agreed to the Statement of Consent moved on to the eligibility questionnaire. Questions were not randomized, but the order of responses was randomized for select multiple choice and forced ranking questions. Participants had the option to change responses to previous questions at any point prior to survey submission. Upon survey completion, participants either received $10 or were compensated with rewards network incentives.
This survey was determined exempt by the WCG Institutional Review Board, and all third parties were ISO 27001 certified. No personally identifiable information was collected other than basic demographic descriptors, and all information, including IP addresses, was de-identified by the survey vendor prior to receipt of the responses by the authors. All data was password protected and stored on the survey vendor's database.
2.3 Statistical analysis
The survey vendor first analyzed data completeness and quality. All participants that started the survey completed the survey, and no participants were removed from the sample due to the survey vendor's data quality checks (e.g., poor open-ends, length of survey time less than 30% of median, and straight lining across multiple questions). 2,686 respondents entered the survey portal, but 103 did not or were unwilling to sign the research consent form. 2,232 respondents were removed, due to not meeting the inclusion criteria required to proceed with the survey.
Basic descriptive statistics were computed such as mean, median, and standard deviation for the response distributions. Furthermore, the frequency distributions were plotted as histograms to ensure the descriptive statistics served as appropriate representations of the data. Several statistical tests were applied to the data to determine statistical significance at α = 0.05 depending on the type of question (58). The Fischer Exact test was applied to contingency tables, especially when analyzing yes/no questions. The Mann–Whitney U test was applied to independent observations with ordinal, non-parametric data. Lastly, the chi-square test was used to analyze contingency tables resulting from select all that apply questions. Python version 3.12.7 (Python Software Foundation, Wilmington, Delaware, 2024) was used for statistical analysis.
3 Results
3.1 Description of the sample
The survey captured results from a diverse sample of respondents (Table 1), including 41% rural (n = 145) and 59% non-rural (n = 206) survey participants. Respondents could select multiple racial/ethnic categories. Sixty-five percent identified as white (not Hispanic/Latino), 14% Hispanic/Latino, 26% Black or African American, 2% Asian, and 3% American Indian/Alaska Native. The rural population was predominately white (80%). Age groups and gender were well represented, with no single age group (18–29 years, 30–39 years, 40–49 years, 50–59 years, 60 years or older) comprising more than 32% of the sample. Sixty percent of survey respondents identified as women, 40% identified as men, and 1% identified as transgender or non-binary. Sixty-nine percent were living with anxiety, 56% depression, 16% post-traumatic stress disorder, 13% bipolar disorder, 10% schizophrenia, 10% substance use disorder, 7% attention deficit disorder, 2% “Other,” 1% eating disorder, and 1% conduct disorder (respondents could select up to three options). Note that individuals with schizophrenia were oversampled to ensure adequate representation of serious mental illness.
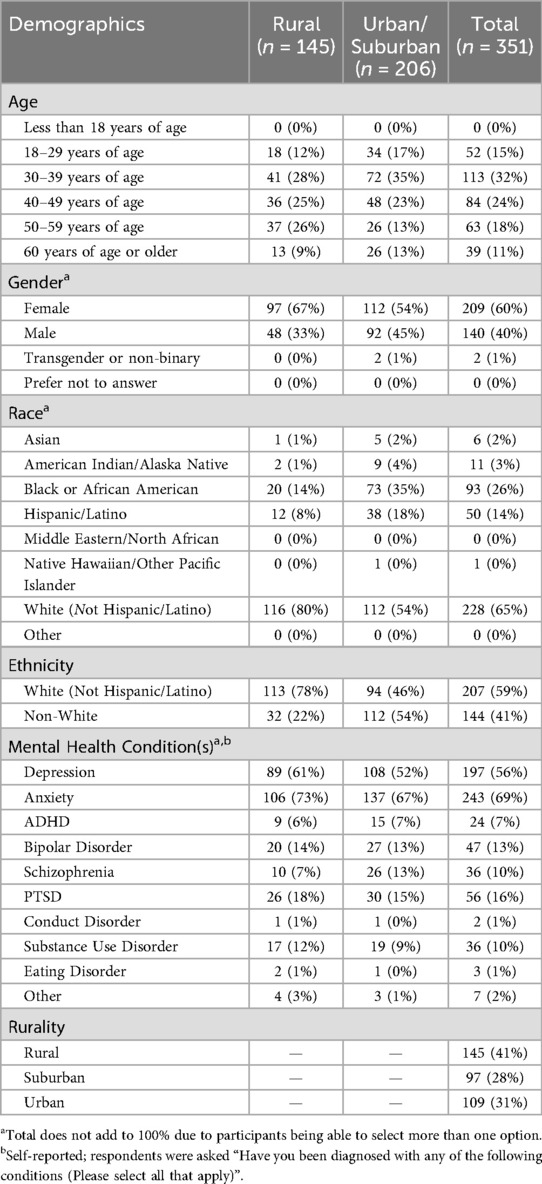
Table 1. Demographic characteristics of survey participants (n = 351); n (%).
3.2 Social determinants of health
In alignment with prior literature, rural respondents had lower incomes, lower education levels, and substantial Medicaid enrollment (Table 2) (13, 59–61). Rural respondents were significantly more likely to have lower household incomes than non-rural respondents (p = 0.004, Mann–Whitney U test). Specifically, the proportion of all respondents reporting an annual household income of <$35,000 (42%) was considerably higher than that reported nationally (21%), and more rural respondents fell in this income range (48% vs. 37% non-rural) (62). This difference may partly explain the higher proportion of rural respondents (60% vs. 46% non-rural) covered by Medicaid. Rural respondents also had lower levels of formal education compared to their non-rural counterparts (p = 0.042, Mann–Whitney U test), with 12% vs. 28% having a bachelor's degree or higher. A subset of the 144 participants who completed an optional free response question cited similar social determinants of health as contributors to limited care access.
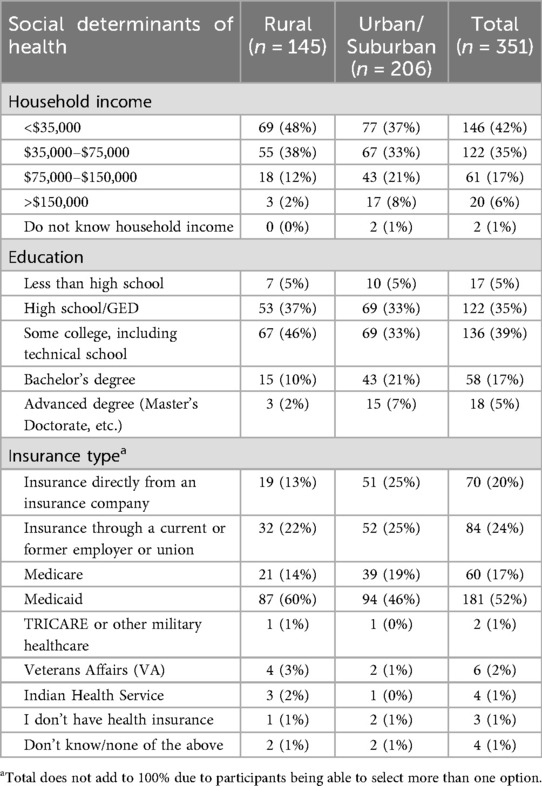
Table 2. Social determinants of health characteristics of survey participants (n = 351); n (%).
“I’m unable to seek care because I’m on disability and have limited disposable income to pay for mental health care”—Respondent A
“I have 4 kids and I lost our home, it just makes it difficult to live and manage everything, then managing my mental health on top of that makes it harder”—Respondent B.
3.3 Barriers to care
To confirm whether distance to care was a unique challenge for rural communities, respondents were asked, “How long is it by car to your closest in-person medical care?” Rural respondents reported living significantly further from their nearest in-person medical care than non-rural respondents (p = 0.003, Mann–Whitney U test; Table 3). Ten percent of rural respondents vs. 0% of non-rural respondents lived more than 30 min from care, while more non-rural respondents lived only 5–10 min from care (40% vs. 28% rural).
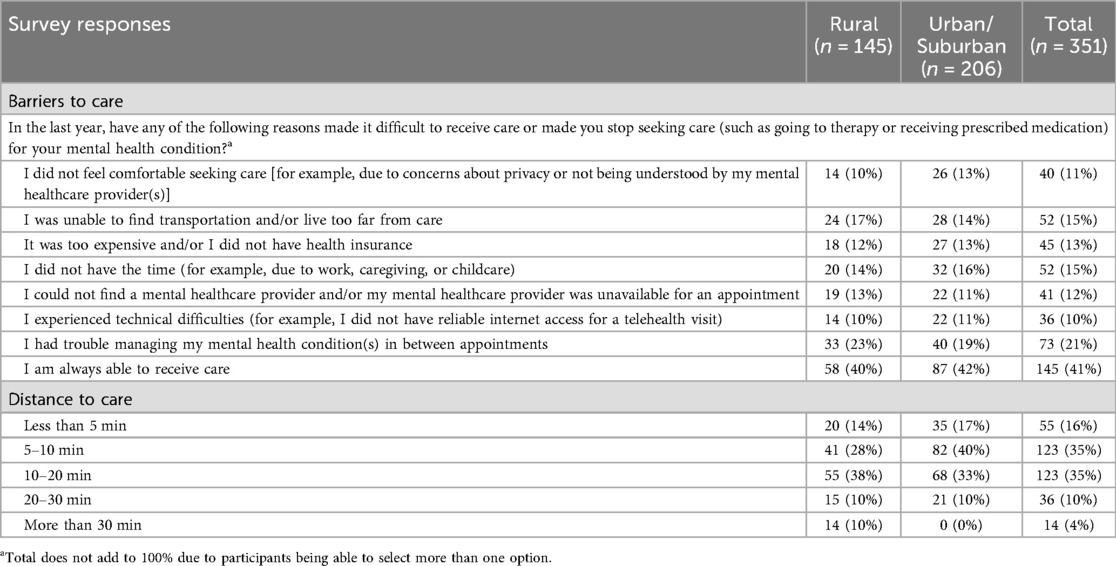
Table 3. Survey participants’ responses to barriers to care (n = 351); n (%).
In addition, a list of distinct mental healthcare access challenges was identified through a targeted literature review and consultation with the advising co-authors (Table 3). When asked, “In the last year, have any of the following reasons made it difficult to receive care or made you stop seeking care (such as going to therapy or receiving prescribed medication) for your mental health condition?” rural and non-rural participants reported individual barriers at a similar frequency (p = 0.754, Chi-square test). Notably, about 60% of all respondents faced at least one barrier to mental healthcare. The most common challenge across community types (21% of all respondents) was “I had trouble managing my mental health condition(s) in between appointments.” The least common (10% of all respondents) was, “I experienced technical difficulties.” However, this may have been due to selection bias since the survey was hosted online, and therefore required a baseline level of broadband access, technological capability, etc.
Respondents also reported challenges with distance to care/transportation (15%), time (15%), cost (13%), provider availability (12%), and comfort seeking care (11%). Participant free responses provided additional context about the cause and impact of such barriers, including missing appointments due to child-caring responsibilities or dependence on others for transportation, as well as feelings of isolation and a lack of support between appointments.
“Usually I have to depend on a friend to get to my appointments and sometimes they have work or important plans. I try to schedule for days when they are free, but another concern is having a doctor close to home who takes my insurance”—Respondent C.
“I’ve had to cancel previous appointments due to my child being sick and unable to find someone to watch her”—Respondent D.
3.4 Use of digital health
When asked, “Do you use digital applications (also called ‘apps’ or software) or digital devices (like computers, smartphones, tablets, or smartwatches) to track or promote your physical or mental health?” rural respondents were significantly less likely to have used any digital app or device for their physical or mental health (55% vs. 73%; p = 0.001, Fisher's exact test; Table 4). Because user engagement with digital therapies has been raised as a possible limitation, the survey also assessed the frequency of use (35). Twenty-eight percent of rural and 41% of non-rural respondents reported using the app/device at least once a day, while 21% of rural respondents and 29% of urban respondents reported using it at least once a week but less than once a day.
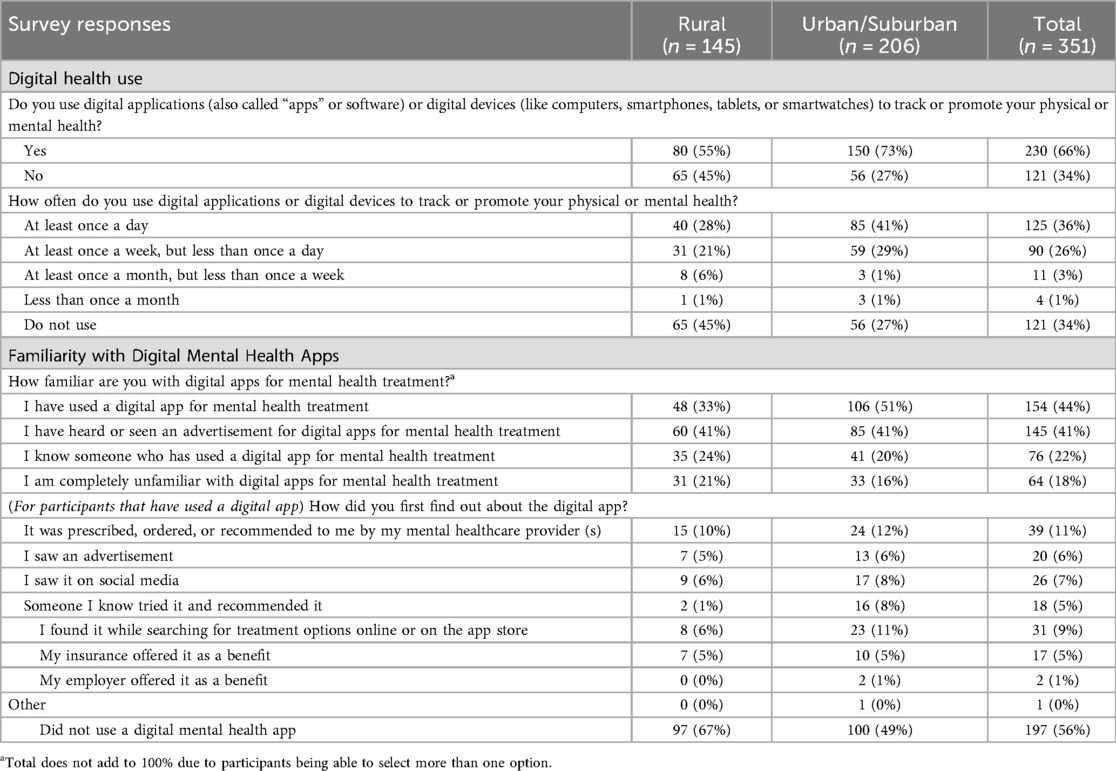
Table 4. Survey participants’ responses on digital health familiarity (n = 351); n (%).
In addition to establishing baseline familiarity with digital health more broadly, this research sought to assess familiarity with applications used to treat mental health conditions. Rural respondents were more likely to be completely unfamiliar with digital apps for mental health treatment (21% vs. 16% non-rural) and were significantly less likely to already be using one (33% vs. 51%; p = 0.001, Fisher's exact test).
3.5 Respondent perceptions of PDTs
This study aimed to assess potential users' perspectives on the features of PDTs. When provided with a detailed description of PDTs and illustrative examples, respondents were asked to rate features about the app that would be important to know prior to use. There were minimal differences in how rural and non-rural respondents ranked each variable, and most variables ranked similarly in importance. Convenience, safety and efficacy, insurance coverage, user data collection/protection, FDA clearance, and prescription by a provider were all considered “Important” (Figure 1). Notably, one factor ranked as less important was whether a friend or family member recommended the app.

Figure 1. Responses to the question what would be important to know about the app wore using it? (1 = very unimportant, 2 = unimportant, 3 = neutral, 4 = important, 5 = very important). (A) Stacked bar chart of all responses separated by rural (n = 145) and non-rural (n = 206) survey participants. (B) The average response for rural and non-rural survey participants. Notably, “if a friend or family member recommends the app” was the least important feature. General trends were similar for the two groups across features.
This research also sought to gain an in-depth understanding of respondents' perceptions towards two defining PDT characteristics: FDA clearance and prescription by a mental healthcare provider. Both rural and urban/suburban respondents valued FDA clearance, with 68% of all respondents being more likely to trust the safety and efficacy of an FDA cleared app (Table 5). Provider endorsement was also highly valued, with 59% of respondents being very likely and 38% of respondents being somewhat likely to use a digital app that was recommended by their mental healthcare provider and available by prescription only. Rural and non-rural participants did not differ significantly in their responses (p = 0.480, Mann–Whitney U Test). Overall, about 97% of respondents were likely to use a PDT recommended by their provider.
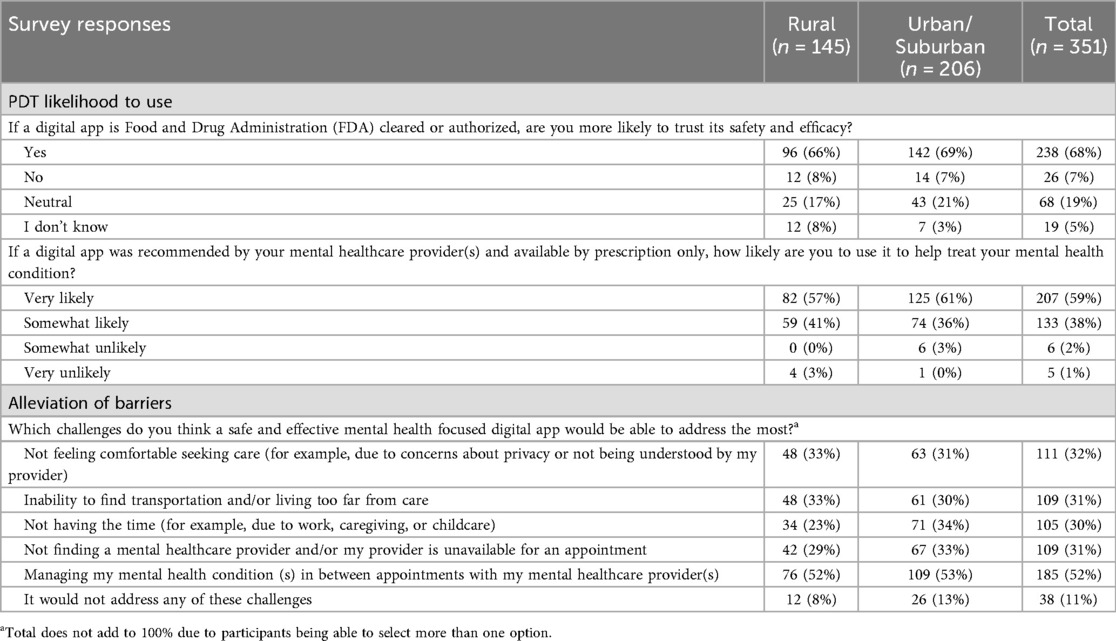
Table 5. Survey participants’ perceptions of PDTs (n = 351); n (%).
Finally, the survey assessed whether PDTs can help alleviate unmet needs. When asked what challenges a safe and effective mental health app could address, 89% of all respondents thought it could address at least one challenge from a list of five barriers probed earlier in the survey. The majority of respondents (52%) thought that the app could help manage their mental health condition between appointments, which was also the most reported barrier. About one third of respondents also thought PDTs could potentially address challenges related to comfort seeking care (32% of participants), transportation/distance from care (31%), provider availability (31%), and time (30%).
“I am doing a lot better now, but managing my mental health condition in between appointments was very challenging previously. Being at home alone was almost more than I could handle. I would have welcomed the app at that time. I think it is a great idea.”—Respondent E.
4 Discussion
In this study of 351 U.S. adults living with a mental health condition, clear barriers to adequate mental healthcare and high interest in PDTs were observed across community types. The results of this advocacy-led, person-centered survey demonstrate that PDTs are a promising new therapeutic option with the potential to overcome the diverse factors impeding treatment access, particularly those impacting rural communities. Though elements of this study's sample and methods—namely, digital access bias and rurality self-reporting—may limit generalizability to broader real-world contexts, the findings offer important insights with implications for future research and clinical practice.
While community-agnostic barriers like finding transportation, lacking time, and trouble affording care were widely experienced, rural respondents faced the added challenges of longer distances to care, lower incomes, less formal education, and high reliance on Medicaid in alignment with prior literature (13, 59–61). These widely recognized social determinants of mental healthcare access and quality represent a collective and intersectional burden for rural communities who might uniquely benefit from the time and resources saved with remote treatment options (6, 63).
Despite the need for remote therapies, rural respondents were significantly less likely to have used any digital app or device for their physical or mental health and were less likely to be familiar with digital apps for mental health treatment, echoing prior findings of lower mental health app utilization in rural vs. urban populations (35, 37). This divide in awareness and adoption may reflect limited access to traditional mental healthcare, since most respondents who used digital health apps were introduced to them by their providers (6). Consequently, facilitating access to prescribing physicians will be critical for rural people with mental health conditions to benefit as much as their non-rural counterparts, especially for prescription-only PDTs. Facilitation could entail efforts to scale up telehealth and other digital care interfaces alongside culturally relevant PDT awareness campaigns for providers and people living with a mental health condition (64, 65). Though broadband access and adoption in rural communities is still below that of non-rural communities, recent 5-year data indicates that broadband use has been increasing among rural people of all ages, presenting a critical opportunity for digital physician interactions and PDT use to grow in parallel (10).
This study was unique in that it specifically probed on potential users' perceptions of the differentiating features of PDTs: FDA clearance and prescription by a physician. Respondents had higher trust in an app with FDA clearance, viewing this as an indicator of safety and efficacy. “Trust” has been shown to be a key facilitator of digital app use, contextualizing the importance of this finding (36). FDA clearance was also considered “Important” alongside being recommended, prescribed, or ordered by a mental health provider, reinforcing the physician's role as a key intermediary, as detailed elsewhere (64, 65). Though clinician sentiment was not within the scope of this study, additional research should assess whether rural mental health providers' awareness, reservations, or levels of interest surrounding PDTs are aligned with those of rural people living with mental health conditions. Survey respondents also highly valued safety and efficacy, signaling the need for providers to communicate the robust clinical standards that distinguish PDTs from other digital health tools (25).
In contrast to prior research identifying negative sentiment towards mental health apps among rural communities (37), rural and non-rural respondents in our survey were equally excited about the prospect of PDTs. Frequent engagement among the 55% of respondents already using apps suggests they are well-received and helpful to those who have access. Further, rural and non-rural respondents' acknowledgement of PDTs' ability to overcome a variety of existing barriers implies that PDTs could address unmet needs in ways that are meaningful to users. Longitudinal and behavioral data are needed to confirm these interpretations, and future research might consider exploring whether interest in PDTs correlates with actual adoption, as well as whether PDT use improves long-term access to care, treatment satisfaction, and mental health outcomes.
This study has several limitations, primarily the online nature of the survey and the use of an elective surveying service, which potentially skewed recruitment towards individuals with at least some level of internet access, greater digital literacy, and a higher likelihood of using PDTs. This may also explain why technical difficulties were the least frequently reported barrier. Future research should leverage traditional surveying methods and a sample with low digital literacy to deeply explore whether factors like smartphone ownership, perceived ease of use, and broadband access alters receptivity among the rural population. Preference for a care-seeking population also likely skewed the sample towards those generally being more open to treatment whether through traditional or non-traditional means.
Although community type was defined with recognizable, plain-language definitions, self-reported rurality is another inherent limitation due to potential social desirability bias or misinterpretation by the respondent. This may have impacted the representativeness of the rural and non-rural groups, and future research could use alternative metrics for rurality or link individual survey data with zip codes to verify rurality. The connection between rurality and other social determinants of health may have also been a confounding factor for the observed rural/non-rural differences. Future studies and analyses could further explore the interplay between rurality and specific social determinants of health (e.g., income and education) on access barriers and perspectives towards PDTs (13, 59–61).
The predominately white rural sample was not adequately representative of all races and ethnicities, which may limit generalizability and restrict capture of the intersectional challenges experienced by disparate groups within the rural community. The representativeness of the broader sample relative to the United States as a whole is another limitation, given potential geographic differences in payer coverage of mental healthcare, quality of care, and access to care.
To minimize respondent burden, the facilitators and barriers explored were by no means exhaustive, and additional value drivers not included in this study have been evaluated elsewhere (31, 35). Note, the study was not designed for preference testing of the most important PDT features, which will be an important area for future research. Specifically, due to the complexity of coverage and pricing, particularly with different insurance types, this research did not focus on out-of-pocket costs, which could be a key driver of real-world use (31). Additionally, this person-centered approach captured potential end-users' perspectives in isolation from the abundant policy and reimbursement hurdles that currently complicate PDT uptake (21). As such, high interest in PDTs among our sample does not guarantee real-world adoption, but it does support deeper consideration of the contextual factors shaping PDT uptake. These include coverage across various insurance types; education, treatment planning, and workflow management among providers; as well as the availability of culturally sensitive resources that enhance awareness of PDTs, particularly in rural areas (26, 31, 66, 67). More broadly, campaigns to expand the availability and affordability of internet access alongside digital literacy will be critical to facilitating equitable PDT uptake, particularly in rural areas (26, 31). In light of these variables, important complements to this and future research are published implementation science studies and related frameworks for integrating digital therapies into routine care (15, 68–74). Rural-specific applications of such approaches should be explored in detail for PDTs.
In conclusion, this first-of-its-kind study identified persistent gaps in mental healthcare and gauged interest in PDTs among potential users. Rural respondents faced worse social determinants of health and the added barrier of greater distances to care. Although familiarity with digital health was low, particularly among rural individuals, high interest in FDA-cleared, physician prescribed mental health apps across community types indicates strong receptivity to mental health PDTs. Explicit recognition of this new modality's capacity to overcome treatment barriers underscores the potential for PDTs to democratize care and transcend the infrastructural, environmental, and sociocultural challenges facing underserved rural communities.
Data availability statement
The datasets presented in this article are not readily available because of ethical and privacy concerns related to publicly sharing the full data. The authors will make deidentified data available upon reasonable request. Requests to access the datasets should be directed to Junko Saber,anVua28uc2FiZXJAaW5ub3BpcGhhbnkuY29t.
Ethics statement
This study involving humans was approved by WCG Institutional Review Board. The study was conducted in accordance with the local legislation and institutional requirements. The participants provided their written informed consent to participate in this study.
Author contributions
GD: Writing – review & editing, Writing – original draft, Investigation, Conceptualization, Funding acquisition, Project administration. CD: Writing – original draft, Data curation, Investigation, Methodology, Conceptualization, Formal analysis. MR: Data curation, Formal analysis, Methodology, Investigation, Writing – original draft. AN: Writing – review & editing, Conceptualization. CS: Writing – review & editing, Conceptualization. LP: Conceptualization, Writing – review & editing. AC: Conceptualization, Writing – review & editing. JM: Writing – review & editing, Conceptualization. JS: Writing – review & editing, Funding acquisition, Supervision, Methodology, Investigation, Conceptualization.
Funding
The author(s) declare that financial support was received for the research and/or publication of this article. The authors declare that this study received funding from Boehringer Ingelheim Pharmaceuticals, Inc. The funder was not directly involved in the study design, collection, analysis, interpretation of data, the writing of this article or the decision to submit it for publication.
Acknowledgments
We would like to thank all study participants who shared their time and perspectives to make this research possible.
Conflict of interest
GD, CD, MR, JS were employed by Innopiphany LLC.
The remaining authors declare that the research was conducted in the absence of any commercial or financial relationships that could be construed as a potential conflict of interest.
Generative AI statement
The author(s) declare that no Generative AI was used in the creation of this manuscript.
Any alternative text (alt text) provided alongside figures in this article has been generated by Frontiers with the support of artificial intelligence and reasonable efforts have been made to ensure accuracy, including review by the authors wherever possible. If you identify any issues, please contact us.
Publisher's note
All claims expressed in this article are solely those of the authors and do not necessarily represent those of their affiliated organizations, or those of the publisher, the editors and the reviewers. Any product that may be evaluated in this article, or claim that may be made by its manufacturer, is not guaranteed or endorsed by the publisher.
Supplementary material
The Supplementary Material for this article can be found online at: https://www.frontiersin.org/articles/10.3389/fdgth.2025.1655446/full#supplementary-material
References
1. Reinert M, Fritze D, Nguyen T. The State of Mental Health in America. Alexandria, VA: Mental Health America (2024). Available online at: https://mhanational.org/wp-content/uploads/2024/12/2024-State-of-Mental-Health-in-America-Report.pdf (Accessed June 24, 2025).
2. Reinert M, Fritze D, Nguyen T. The State of Mental Health in America. Alexandria, VA: Mental Health America (2024). Available online at: https://mhanational.org/issues/state-mental-health-america (Accessed June 24, 2025).
3. Jacobson NC, Quist RE, Lee CM, Marsch LA. Chapter 2—Using digital therapeutics to target gaps and failures in traditional mental health and addiction treatments. In: Jacobson N, Kowatsch T, Marsch L, editors. Digital Therapeutics for Mental Health and Addiction: The State of the Science and Vision for the Future. Cambridge, MA: Academic Press (2023). p. 5–18.
4. United States Census Bureau. Nation’s urban and rural populations shift following 2020 census (2022). Available online at: Available online at: https://www.census.gov/newsroom/press-releases/2022/urban-rural-populations.html (Accessed June 24, 2025).
5. Eberhardt MS, Pamuk ER. The importance of place of residence: examining health in rural and nonrural areas. Am J Public Health. (2004) 94(10):1682–6. doi: 10.2105/ajph.94.10.1682
6. Morales DA, Barksdale CL, Beckel-Mitchener AC. A call to action to address rural mental health disparities. J Clin Transl Sci. (2020) 4(5):463–7. doi: 10.1017/cts.2020.42
7. Andrilla CHA, Patterson DG, Garberson LA, Coulthard C, Larson EH. Geographic variation in the supply of selected behavioral health providers. Am J Prev Med. (2018) 54(6 Suppl 3):S199–207. doi: 10.1016/j.amepre.2018.01.004
8. Syed ST, Gerber BS, Sharp LK. Traveling towards disease: transportation barriers to health care access. J Community Health. (2013) 38(5):976–93. doi: 10.1007/s10900-013-9681-1
9. Lucas JW, Wang X. Declines in Telemedicine use Among Adults: United States, 2021 and 2022. Hyattsville, MD: National Center for Health Statistics (US) (2024). Available online at: https://www.cdc.gov/nchs/data/nhsr/nhsr205.pdf (Accessed June 24, 2025).
10. Farrigan T, Genetin B, Sanders A, Pender J, Thomas KL, Winkler R, Cromartie J. Rural America at a glance: 2024 edition. U.S. Department of Agriculture, Economic Research Service (2024). doi: 10.32747/2024.8722498.ers (Accessed June 24, 2025).
11. Greenberg AJ, Haney D, Blake KD, Moser RP, Hesse BW. Differences in access to and use of electronic personal health information between rural and urban residents in the United States. J Rural Health. (2018) 34(Suppl 1):s30–8. doi: 10.1111/jrh.12228
12. Mack EA, Loveridge S, Keene T, Mann J. A review of the literature about broadband internet connections and rural development (1995−2022). Int Regional Sci Rev. (2023) 47(3):231–92. doi: 10.1177/01600176231202457
13. Foutz J, Artiga S, Garfield R. The Role of Medicaid in Rural America. Menlo Park, CA: Kaiser Family Foundation (2017). Available online at: https://www.kff.org/medicaid/issue-brief/the-role-of-medicaid-in-rural-america/ (Accessed June 24, 2025).
14. Hoadley J, Alker J, Holmes M. Health Insurance Coverage in Small Towns and Rural America: The Role of Medicaid Expansion. Washington, DC: Georgetown University Center for Children and Families and the University of North Carolina NC Rural Health Research Program (2018). Available online at: https://ccf.georgetown.edu/wp-content/uploads/2018/09/FINALHealthInsuranceCoverage_Rural_2018.pdf (Accessed June 24, 2025).
15. Chen X, Orom H, Hay JL, Waters EA, Schofield E, Li Y, et al. Differences in rural and urban health information access and use. J Rural Health. (2019) 35(3):405–17. doi: 10.1111/jrh.12335
16. Santore L, Ipsen C, Gimm G. Rural disability, self-reliance, and the utilization of mental health services. Disabil Health J. (2024) 18(2):101761. doi: 10.1016/j.dhjo.2024.101761
17. Schroeder S, Tan CM, Urlacher B, Heitkamp T. The role of rural and urban geography and gender in community stigma around mental illness. Health Educ Behav. (2021) 48(1):63–73. doi: 10.1177/1090198120974963
18. Leung J, Smith A, Atherton I, McLaughlin D. “Everybody knows everybody else’s business”-privacy in rural communities. J Cancer Educ. (2016) 31(4):811–2. doi: 10.1007/s13187-015-0862-8
19. Badger L, Robinson H, Farley T. Management of mental disorders in rural primary care: a proposal for integrated psychosocial services. J Fam Pract. (1999) 48(10):813–8. https://pubmed.ncbi.nlm.nih.gov/12224680/12224680
20. Brezing CA, Brixner DI. The rise of prescription digital therapeutics in behavioral health. Adv Ther. (2022) 39(12):5301–6. doi: 10.1007/s12325-022-02320-0
21. Xia SH, Narayanan MM, Swamy V, Franson K. Therapeutic evaluation and utilization analysis of mental health prescription digital therapeutics within the current regulatory landscape. Pharmacy (Basel). (2025) 13(1):19. doi: 10.3390/pharmacy13010019
22. Phan P, Mitragotri S, Zhao Z. Digital therapeutics in the clinic. Bioeng Transl Med. (2023) 8(4):e10536. doi: 10.1002/btm2.10536
23. Academy of Managed Care Pharmacy (AMCP). List of existing PDTs (Q1 2024) (2024). Available online at: https://www.amcp.org/sites/default/files/2024-02/PDT_list_q1_2024.pdf (Accessed June 24, 2025).
24. Yao H, Liao Z, Zhang X, Zhang X, Li M, You L, et al. A comprehensive survey of the clinical trial landscape on digital therapeutics. Heliyon. (2024) 10(16):e36115. doi: 10.1016/j.heliyon.2024.e36115
25. Dang A, Arora D, Rane P. Role of digital therapeutics and the changing future of healthcare. J Family Med Prim Care. (2020) 9(5):2207–13. doi: 10.4103/jfmpc.jfmpc_105_20
26. Graham AK, Weissman RS, Mohr DC. Resolving key barriers to advancing mental health equity in rural communities using digital mental health interventions. JAMA Health Forum. (2021) 2(6):e211149. doi: 10.1001/jamahealthforum.2021.1149
27. Maita KC, Maniaci MJ, Haider CR, Avila FR, Torres-Guzman RA, Borna S, et al. The impact of digital health solutions on bridging the health care gap in rural areas: a scoping review. Perm J. (2024) 28(3):130–43. doi: 10.7812/TPP/23.134
28. Richardson S, Lawrence K, Schoenthaler AM, Mann D. A framework for digital health equity. NPJ Digit Med. (2022) 5(1):119. doi: 10.1038/s41746-022-00663-0
29. Kaihlanen AM, Virtanen L, Buchert U, Safarov N, Valkonen P, Hietapakka L, et al. Towards digital health equity—a qualitative study of the challenges experienced by vulnerable groups in using digital health services in the COVID-19 era. BMC Health Serv Res. (2022) 22(1):188. doi: 10.1186/s12913-022-07584-4
30. Bauerly BC, McCord RF, Hulkower R, Pepin D. Broadband access as a public health issue: the role of law in expanding broadband access and connecting underserved communities for better health outcomes. J Law Med Ethics. (2019) 47(2 Suppl):39–42. doi: 10.1177/1073110519857314
31. Borghouts J, Eikey E, Mark G, De Leon C, Schueller SM, Schneider M, et al. Barriers to and facilitators of user engagement with digital mental health interventions: systematic review. J Med Internet Res. (2021) 23(3):e24387. doi: 10.2196/24387
32. Seegan PL, McGuire JF. Provider and patient barriers and facilitators to integration of digital mental health applications in routine clinical care. J Affect Disord. (2024) 363:55–62. doi: 10.1016/j.jad.2024.07.089
33. Feldman WB, Rand LZ, Carpenter D, Russo M, Bhaskar A, Lu Z, et al. Trust in the food and drug administration: a national survey study. Clin Pharmacol Ther. (2024) 116(2):408–14. doi: 10.1002/cpt.3292
34. Wu D, Lowry PB, Zhang D, Tao Y. Patient trust in physicians matters—understanding the role of a mobile patient education system and patient-physician communication in improving patient adherence behavior: field study. J Med Internet Res. (2022) 24(12):e42941. doi: 10.2196/42941
35. van Kessel R, Roman-Urrestarazu A, Anderson M, Kyriopoulos I, Field S, Monti G, et al. Mapping factors that affect the uptake of digital therapeutics within health systems: scoping review. J Med Internet Res. (2023) 25:e48000. doi: 10.2196/48000f
36. Jongebloed H, Anderson K, Winter N, Nguyen L, Huggins CE, Savira F, et al. The digital divide in rural and regional communities: a survey on the use of digital health technology and implications for supporting technology use. BMC Res Notes. (2024) 17(1):90. doi: 10.1186/s13104-024-06687-x
37. Connolly SL, Miller CJ, Koenig CJ, Zamora KA, Wright PB, Stanley RL, et al. Veterans’ attitudes toward smartphone app use for mental health care: qualitative study of rurality and age differences. JMIR Mhealth Uhealth. (2018) 6(8):e10748. doi: 10.2196/10748
38. Essén A, Stern AD, Haase CB, Car J, Greaves F, Paparova D, et al. Health app policy: international comparison of nine countries’ approaches. NPJ Digit Med. (2022) 5(1):31. doi: 10.1038/s41746-022-00573-1
39. Rodler S, Kowalewski KF, Scheibert H, Bensel M, Stadelmeier LF, Styn A, et al. Digital therapeutics in urology: an innovative approach to patient care and management. Eur Urol Open Sci. (2023) 55:23–7. doi: 10.1016/j.euros.2023.07.003
40. Labinsky H, Gupta L, Raimondo MG, Schett G, Knitza J. Real-world usage of digital health applications (DiGA) in rheumatology: results from a German patient survey. Rheumatol Int. (2023) 43:713–9. doi: 10.1007/s00296-022-05261-7
41. National Health Services Health Research Authority (UK). Addressing the barriers to people-centered clinical research: recommendations for system-wide action (2024). Available online at: https://s3.eu-west-2.amazonaws.com/www.hra.nhs.uk/media/documents/People-Centred_Clinical_Research_project_-_final_report.pdf (Accessed June 24, 2025).
42. Faul F, Erdfelder E, Lang AG, Buchner A. G*power 3: a flexible statistical power analysis program for the social, behavioral, and biomedical sciences. Behav Res Methods. (2007) 39(2):175–91. doi: 10.3758/bf03193146
43. Strowd RE, Strauss L, Graham R, Dodenhoff K, Schreiber A, Thomson S, et al. Rapid implementation of outpatient teleneurology in rural appalachia: barriers and disparities. Neurol Clin Pract. (2021) 11(3):232–41. doi: 10.1212/CPJ.0000000000000906
44. Serdar CC, Cihan M, Yücel D, Serdar MA. Sample size, power and effect size revisited: simplified and practical approaches in pre-clinical, clinical and laboratory studies. Biochem Med (Zagreb). (2021) 31(1):010502. doi: 10.11613/BM.2021.010502
45. Health Resources and Services Administration (US). How we define rural (2025). Available online at: https://www.hrsa.gov/rural-health/about-us/what-is-rural (Accessed August 13, 2025).
46. U.S. Department of Agriculture. Rural classifications—What is rural? Available online at: https://www.ers.usda.gov/topics/rural-economy-population/rural-classifications/what-is-rural#:∼:text=Whereas%20researchers%20often%20use%20the%20term%20rural%20when,on%20measures%20of%20housing%20unit%20and%20population%20density (Accessed August, 13, 2025).
47. Ratcliffe M, Burd C, Holder K, Fields A. Defining Rural at the U.S. Census Bureau: American Community Survey and Geography Brief. Washington, DC: United States Census Bureau (2016). Available online at: https://www2.census.gov/geo/pdfs/reference/ua/Defining_Rural.pdf (Accessed August 13, 2025)
48. U.S. Centers for Disease Control and Prevention (CDC). Social determinants of health (SDOH) (2024). Available online at: https://www.cdc.gov/about/priorities/why-is-addressing-sdoh-important.html (Accessed June 24, 2025).
49. Dibden L, Goldberg E, Leslie KM, Lynk A, Tonkin R, Westwood M, et al. Eating disorders in adolescents: Principles of diagnosis and treatment. Paediatr Child Health. (1998) 3(3):189–96. doi: 10.1093/pch/3.3.189
50. Nock MK, Kazdin AE, Hiripi E, Kessler RC. Prevalence, subtypes, and correlates of DSM-IV conduct disorder in the national comorbidity survey replication. Psychol Med. (2006) 36(5):699–710. doi: 10.1017/S0033291706007082
51. United States Census Bureau. Quick facts. Available online at: https://www.census.gov/quickfacts/fact/table/US/PST045224 (Accessed August 13, 2025).
52. Akinlotan M, Khodakarami N, Primm K, Bolin J, Ferdinand AO. Travel for medical or dental care by race/ethnicity and rurality in the U.S.: findings from the 2001, 2009 and 2017 national household travel surveys. Prev Med Rep. (2023) 35:102297. doi: 10.1016/j.pmedr.2023.102297
53. Hearn M, Pinto C, Moss JL. Evaluating the connection between rural travel time and health: a cross-sectional analysis of older adults living in the northeast United States. J Prim Care Community Health. (2024) 15::21501319241266114. doi: 10.1177/21501319241266114
54. Barbaresi WJ, Colligan RC, Weaver AL, Voigt RG, Killian JM, Katusic SK. Mortality, ADHD, and psychosocial adversity in adults with childhood ADHD: a prospective study. Pediatrics. (2013) 131(4):637–44. doi: 10.1542/peds.2012-2354
55. Armeni P, Polat I, De Rossi LM, Diaferia L, Meregalli S, Gatti A. Exploring the potential of digital therapeutics: an assessment of progress and promise. Digit Health. (2024) 10:20552076241277441. doi: 10.1177/20552076241277441
56. Visser SN, Danielson ML, Bitsko RH, Holbrook JR, Kogan MD, Ghandour RM, et al. Trends in the parent-report of health care provider-diagnosed and medicated attention-deficit/hyperactivity disorder: united States, 2003−2011. J Am Acad Child Adolesc Psychiatry. (2014) 53(1):34–46.e2. doi: 10.1016/j.jaac.2013.09.001
57. Deckler E, Ferland M, Brazis S, Mayer MR, Carlson M, Kantrowitz JT. Challenges and strategies for the recruitment of patients with schizophrenia in a research setting. Int J Neuropsychopharmacol. (2022) 25(11):924–32. doi: 10.1093/ijnp/pyac058
58. Ranganathan P. An introduction to statistics: choosing the correct statistical test. Indian J Crit Care Med. (2021) 25(Suppl 2):S184–6. doi: 10.5005/jp-journals-10071-23815
59. Shrider EA, Kollar M, Chen F, Semega J. Income and Poverty in the United States: 2020. Washington, DC: U.S. Census Bureau (2021). Available online at: https://www.census.gov/content/dam/Census/library/publications/2021/demo/p60-273.pdf (Accessed June 24, 2025).
60. Ramakrishnan S, Suandi M. Who Lives in Rural America? Washington, DC: Federal Housing Finance Agency (2024). Available online at: https://www.fhfa.gov/blog/insights/who-lives-in-rural-america#:∼:text=Median%20household%20income%20is%20lower,an%20income%20less%20than%20%2450%2C000 (Accessed June 24, 2025).
61. National Center for Education Statistics (US). Educational Attainment in Rural Areas. (2022). Available online at: https://nces.ed.gov/programs/coe/indicator/lbc (Accessed August 28, 2025).
62. Guzman G, Kollar M. Income in the United States: 2023. Washington, DC: U.S. Department of Commerce, U.S. Census Bureau (2024). Available on line at: https://www2.census.gov/library/publications/2024/demo/p60-282.pdf (Accessed June 24, 2025).
63. Wong H, Moore K, Angstman KB, Garrison GM. Impact of rural address and distance from clinic on depression outcomes within a primary care medical home practice. BMC Fam Pract. (2019) 20(1):123. doi: 10.1186/s12875-019-1015-7
64. AMCP Partnership Forum. AMCP partnership forum: digital therapeutics–what are they and where do they fit in pharmacy and medical benefits? J Manag Care Spec Pharm. (2020) 26(5):674–81. doi: 10.18553/jmcp.2020.19418
65. Shah AM, Shah SC. Digital therapeutics—a new era in health care. Natl J Physiol Pharm Pharmacol. (2023) 13(11):2190–6. doi: 10.5455/njppp.2023.13.09464202302102023
66. Woods L, Martin P, Khor J, Guthrie L, Sullivan C. The right care in the right place: a scoping review of digital health education and training for rural healthcare workers. BMC Health Serv Res. (2024) 24(1):1011. doi: 10.1186/s12913-024-11313-4
67. Whitehead L, Talevski J, Fatehi F, Beauchamp A. Barriers to and facilitators of digital health among culturally and linguistically diverse populations: qualitative systematic review. J Med Internet Res. (2023) 25:e42719. doi: 10.2196/42719
68. Youn SJ, Jaso B, Eyllon M, Sah P, Hoyler G, Barnes JB, et al. Leveraging implementation science to integrate digital mental health interventions as part of routine care in a practice research network. Adm Policy Ment Health. (2024) 51(3):348–57. doi: 10.1007/s10488-023-01292-9
69. Mogk JM, Matson TE, Caldeiro RM, Garza Mcwethy AM, Beatty T, Sevey BC, et al. Implementation and workflow strategies for integrating digital therapeutics for alcohol use disorders into primary care: a qualitative study. Addict Sci Clin Pract. (2023) 18(1):27. doi: 10.1186/s13722-023-00387-w
70. Graham AK, Greene CJ, Powell T, Lieponis P, Lunsford A, Peralta CD, et al. Lessons learned from service design of a trial of a digital mental health service: informing implementation in primary care clinics. Transl Behav Med. (2020) 10(3):598–605. doi: 10.1093/tbm/ibz140
71. Glass JE, Matson TE, Lim C, Hartzler AL, Kimbel K, Lee AK, et al. Approaches for implementing app-based digital treatments for drug use disorders into primary care: a qualitative, user-centered design study of patient perspectives. J Med Internet Res. (2021) 23(7):e25866. doi: 10.2196/25866
72. Graham AK, Lattie EG, Powell BJ, Lyon AR, Smith JD, Schueller SM, et al. Implementation strategies for digital mental health interventions in health care settings. Am Psychol. (2020) 75(8):1080–92. doi: 10.1037/amp0000686
73. Lord SE, Campbell ANC, Brunette MF, Cubillos L, Bartels SM, Torrey WC, et al. Workshop on implementation science and digital therapeutics for behavioral health. JMIR Ment Health. (2021) 8(1):e17662. doi: 10.2196/17662
Keywords: prescription digital therapeutics, mental health, rural health, barriers to care, digital health, mental health equity
Citation: Danon G, Dunn CE, Robins M, Nagendra A, Strand C, Palko L, Colborn A, Menjivar J and Saber J (2025) Assessing rural populations’ barriers to mental healthcare and perceptions towards prescription digital therapeutics: a cross-sectional survey. Front. Digit. Health 7:1655446. doi: 10.3389/fdgth.2025.1655446
Received: 27 June 2025; Accepted: 20 August 2025;
Published: 4 September 2025.
Edited by:
Lauren Staples, Macquarie University, AustraliaReviewed by:
Denise De Micheli, Universidade Federal de São Paulo, BrazilDr. Senthil T., Teerthanker Mahaveer University, India
Copyright: © 2025 Danon, Dunn, Robins, Nagendra, Strand, Palko, Colborn, Menjivar and Saber. This is an open-access article distributed under the terms of the Creative Commons Attribution License (CC BY). The use, distribution or reproduction in other forums is permitted, provided the original author(s) and the copyright owner(s) are credited and that the original publication in this journal is cited, in accordance with accepted academic practice. No use, distribution or reproduction is permitted which does not comply with these terms.
*Correspondence: Junko Saber, anVua28uc2FiZXJAaW5ub3BpcGhhbnkuY29t
†These authors have contributed equally to this work in an advisory capacity; views do not necessarily represent those of Mental Health America or the Society for Digital Mental Health