Abstract
Background:
Post-COVID fatigue (pCF) represents a significant burden for many individuals following SARS-CoV-2 infection. The unpredictable nature of fatigue fluctuations impairs daily functioning and quality of life, creating challenges for effective symptom management.
Objective:
This study investigated the feasibility of developing predictive models to forecast next-day fatigue levels in individuals with pCF, utilizing objective physiological and behavioral features derived from wearable device data.
Methods:
We analyzed data from 68 participants with pCF who wore an Axivity AX6 device on their non-dominant wrist and a VitalPatch electrocardiogram (ECG) sensor on their chest for up to 21 days while completing fatigue questionnaires every other day. HRV features were extracted from the VitalPatch single-lead ECG signal using the NeuroKit Python package, while activity and sleep features were derived from the Axivity wrist-worn device using the GGIR package. Using a 5-fold cross-validation approach, we trained and evaluated the performances of two machine learning models to predict next-day fatigue levels using Visual Analogue Scale (VAS) fatigue scores: Random Forest and XGBoost.
Results:
Using five-fold cross-validation, XGBoost outperformed Random Forest in predicting next-day fatigue levels (mean R² = 0.79 ± 0.04 vs. 0.69 ± 0.02; MAE = 3.18 ± 0.63 vs. 6.14 ± 0.96). Predicted and observed fatigue scores were strongly correlated for both models (XGBoost: r = 0.89 ± 0.02; Random Forest: r = 0.86 ± 0.01). Key predictors included heart rate variability features—sample entropy, low-frequency power, and approximate entropy—along with demographic (age, sex) and activity-related (moderate and vigorous duration) factors. These findings underscore the importance of integrating physiological, demographic, and activity data for accurate fatigue prediction.
Conclusions:
This study demonstrates the feasibility of combining heart rate variability with activity and sleep features to predict next-day fatigue levels in individuals with pCF. Integrating physiological and behavioral data show promising predictive accuracy and provides insights that could inform future personalized fatigue management strategies.
1 Introduction
Post-COVID fatigue (pCF) represents a significant and persistent symptom affecting 10%–35% of individuals following SARS-CoV-2 infection, even amongst those who only experienced mild initial symptoms of COVID-19 (1, 2). This debilitating symptom can persist for months or even years, severely impacting daily functioning, employment status, and overall quality of life (3). The World Health Organization has recognized post-COVID condition (PCC) as a major health concern, with fatigue consistently reported as one of the most prevalent and disabling symptoms (4). An estimated 1.3 million people in the UK are experiencing self-reported long COVID, with fatigue being the most reported symptom. This accounts for approximately 51% of individuals affected by long COVID (5).
The management of pCF presents unique challenges due to its unpredictable nature and complex etiology, which likely involves dysregulation of multiple physiological systems including autonomic nervous system dysfunction and circadian rhythm disruption (6, 7). Traditional fatigue management approaches often rely on retrospective symptom reporting via fatigue questionnaires and general energy conservation strategies, which are subjective and fail to account for the day-to-day variability in fatigue levels (8). This unpredictability of fatigue creates significant barriers to activity planning, pacing strategies, and effective symptom management, contributing to reduced quality of life, impaired work capacity, and increased healthcare utilization (9, 10).
The ability to predict next-day fatigue levels would represent a significant advancement in pCF management, enabling patients to proactively adjust their activity levels and implement targeted interventions before fatigue exacerbations occur. Recent advances in wearable technology and artificial intelligence have opened new possibilities for continuously monitoring physiological and behavioral parameters that may predict symptom fluctuations (11, 12). Wearable devices can capture detailed patterns of physical activity, rest, and sleep while providing physiological measurements such as heart rate variability (HRV) that might serve as digital biomarkers for fatigue prediction (13, 14).
HRV, reflecting autonomic nervous system function, has emerged as a promising physiological biomarker for fatigue and stress-related conditions. HRV features derived from time-domain (RMSSD, pNN50, SDNN), frequency-domain (LF/HF ratio, HF power), and non-linear analysis (SD1, SD2, entropy measures) provide insights into autonomic regulation that may be disrupted in post-COVID conditions. Integrating HRV with activity and sleep patterns offers a more comprehensive understanding of fatigue mechanisms and prediction. However, the complex, non-linear relationships between these physiological and behavioral parameters and next-day fatigue, particularly in pCF, remain poorly understood.
Several studies have explored the relationship between activity patterns and fatigue in chronic conditions such as multiple sclerosis (15), cancer-related fatigue (16), and myalgic encephalomyelitis/chronic fatigue syndrome (ME/CFS) (17). These investigations have identified potential associations between fatigue levels and various activity metrics, including daily step count (18), and time spent in some activity intensity levels like moderate-to-vigorous physical activity (MVPA) (19). Sleep parameters such as sleep efficiency, duration, and timing have also been linked to daytime fatigue in various populations (20, 21).
Traditional statistical approaches often struggle to capture these complex relationships due to their reliance on linear associations and predefined interaction terms (22). Machine learning (ML) techniques, on the other hand, can identify complex patterns in high-dimensional data without requiring a priori assumptions about feature relationships (23). These methods have shown promise in predicting symptom fluctuations in various chronic conditions (24, 25). Some studies have demonstrated the utility of ML approaches for classifying fatigue levels in immune and neurodegenerative disorders using gait variability, with support vector machines and other classification methods showing promise for fatigue identification (11). However, their application to pCF fatigue prediction using combined physiological and behavioral data remains limited. Tree-based ensemble methods, like Random Forest and XGBoost, are particularly suited for this task, as they can capture non-linear feature interactions while providing interpretable feature importance rankings (26).
This study aims to address these gaps by exploring machine learning models for next-day fatigue level prediction in individuals with pCF using a combination of heart rate variability and activity/sleep metrics. Specifically, we employ two distinct machine learning frameworks:
Random Forest: An ensemble learning method that builds multiple decision trees and averages their predictions, particularly effective at capturing complex feature interactions while providing robust feature importance estimates (27).
XGBoost: An optimized gradient boosting implementation that provides superior performance through iterative refinement of predictions, with built-in regularization to prevent overfitting (28).
By combining physiological HRV features with behavioral activity and sleep patterns, we aim to predict the next day's fatigue state using previous-day data while gaining insights into the relative importance of different physiological and behavioral factors. This approach addresses a critical need in pCF research: developing tools to predict fatigue fluctuations using objective, continuously monitored parameters. By identifying the key predictors of next-day fatigue, this work could inform strategies for behavioral and therapeutic interventions, though we acknowledge that association does not imply causation, and interventional studies would be needed to establish causal relationships.
2 Methods
2.1 Study design and participants
2.1.1 Study design and ethical approval
This investigation was conducted as part of a larger single-site, single-blind, sham-controlled, randomized research study examining the efficacy of non-invasive vagus nerve stimulation on post-COVID fatigue syndrome (https://research.ncl.ac.uk/covidfatigue/). The protocol received full ethical approval from the Faculty of Medical Sciences Research Ethics Committee at Newcastle University (Medical School, Framlington Place, NE2 4HH, UK) [Reference: (2284/18447/2021)] and the Declaration of Helsinki was followed in all study procedures, and the trial was registered in the ISRCTN registry, trial number (ISRCTN18015802).
2.1.2 Participant Recruitment and Eligibility Criteria
Recruitment was conducted between May 2022 and April 2024 through multiple channels, including the dedicated trial website (covidfatigue.co.uk) and various social media platforms. Potential participants were initially screened using an electronic implementation of the Fatigue Impact Scale. Participants were eligible for inclusion if they met the following criteria: (1) adults aged 18–65 years; (2) documented positive COVID-19 test result without requiring hospitalization; (3) minimum of 4 weeks post-diagnosis; (4) self-reported fatigue affecting daily functioning; (5) desire for fatigue treatment; and (6) English language fluency. Exclusion criteria comprised: (1) pre-existing neurological or psychiatric disorders; (2) cardiac disease (including cardiomyopathy, myocardial infarction, arrhythmia, or prolonged QT interval); (3) presence of implanted electronic devices (e.g., pacemakers); (4) pregnancy or breastfeeding; and (5) contraindications for transcranial magnetic stimulation.
2.1.3 Sample characteristics
While the trial enrolled 114 participants, not all had complete datasets for VitalPatch physiological monitoring, activity monitoring, and questionnaires due to technical issues, including Bluetooth connectivity problems, device malfunctions, and varying compliance with questionnaire completion. Therefore, our analysis focused on 68 participants with complete and usable data across these domains. Demographic and clinical characteristics of the analytical sample are presented in Table 1.
Table 1
| Characteristic | Value |
|---|---|
| Participants | 68 |
| Total observations | 383 |
| Sex | |
| Male | 19 |
| Female | 49 |
| Age (years) | |
| Mean ± SD | 47.9 ± 12.0 |
| Range | 0–64 |
| Treatment condition | |
| nVNS | 24 |
| Sham | 23 |
| Placebo | 21 |
| VAS fatigue score | |
| Mean ± SD | 63.1 ± 16.1 |
| Range | 19–100 |
Sample characteristics.
2.1.4 Intervention protocol
Participants were randomized to one of three intervention conditions, all utilizing transcutaneous electrical nerve stimulation (TENS) via a FlexiStim device applied to the external ear:
Active taVNS: Stimulation of the auricular branch of the vagus nerve via the tragus (nVNS wing)
Sham control: Resistor-modified clip on the tragus designed to prevent actual stimulation
Electrical stimulation control: Stimulation of the greater auricular nerve via the earlobe (Placebo)
The intervention protocol required participants to self-administer the assigned treatment three times daily for eight weeks. During the second phase of the trial, control group participants crossed over to active stimulation so that all participants received active stimulation during the study.
2.2 Data collection
2.2.1 Activity, sleep assessment and electrocardiography
Participants wore two devices during the study period:
Wearable device for activity and sleep assessment: An Axivity AX6 device (Axivity Ltd, UK) was worn continuously on the participant's non-dominant wrist for up to 21 days (14 days at baseline, 7 days at follow-up). The AX6 is a small (23 × 32.5 × 8.9 mm), lightweight (11 g) triaxial accelerometer with built-in temperature and light sensors. The device was configured to record raw acceleration data at 100 Hz with a dynamic triaxial accelerometer range of ±8 g, and a triaxial gyroscope range of ±2,000 degrees per second. This was passive monitoring requiring no participant interaction with the device.
ECG measurement: A VitalPatch biosensor (VitalConnect, Campbell, CA, USA) was utilized to collect continuous ECG data from participants during baseline and follow-up periods, each lasting 7 days. The device was worn on the left chest and adhered to the skin using a fully disposable, medical-grade patch. It features a single-lead ECG sensor, a triaxial accelerometer, and a thermistor, recording ECG at a sampling frequency of 125 Hz. Equipped with a zinc-air battery, the device lasts up to 7 days and can store up to 10 h of data locally, transmitting encrypted recordings wirelessly to a secure cloud platform for remote monitoring. The ECG data collected by VitalPatch facilitated the extraction of heart rate variability (HRV) features. Participants were instructed to wear the device continuously.
2.2.2 Fatigue assessment
Participants completed fatigue assessments every other day at any time during the day throughout the study using a Visual Analogue Scale (VAS) delivered through a secure web application. Each assessment day, participants rated their average fatigue level on a scale from 0 (no fatigue) to 100 (worst fatigue imaginable). The VAS for fatigue has demonstrated good reliability and validity in various clinical populations (29).
2.3 Data processing
2.3.1 Activity, sleep and HRV data processing
Raw accelerometer data from the Axivity AX6 device were processed using the validated GGIR package (version 2.7-1) (30) in R (version 4.1.0) (31), which handled auto-calibration, non-wear detection, and the extraction of physical activity, sleep, and circadian rhythm features from 24-hour wrist-worn recordings. A summary of all Activity and sleep features and their definitions is provided in Table 2.
Table 2
| Activity category | Feature type | Description |
|---|---|---|
| Physical activity | ACC_ | Accelerometry-based activity measures |
| dur_day_ | Duration of daytime activity periods | |
| dur_night_ | Duration of nighttime activity periods | |
| quantile_ | Activity intensity quantiles | |
| Total physical activity | ||
| Sleep metrics | sleep_ | Sleep duration and quality metrics |
| efficiency | Sleep efficiency measures | |
| Total sleep metrics | ||
| Circadian rhythm | M5 | Most active 5-hour period |
| L5 | Least active 5-hour period | |
| Total circadian rhythm |
Activity features.
ECG data from the VitalPatch sensors were processed to derive HRV features using the NeuroKit2 Python library. The HRV analysis pipeline consisted of: (1) ECG signal preprocessing and quality control, (2) R-peak detection and RR interval extraction, (3) segmentation into 5-minute windows, (4) computation of standard time-domain, frequency-domain, and non-linear HRV features for each window, and (5) aggregation of these features into daily summaries using 12 statistical descriptors (mean, median, standard deviation, minimum, maximum, first and third quartiles, interquartile range, range, coefficient of variation, skewness, and kurtosis). A summary of all HRV features and their definitions is provided in Table 3. Movement artifacts were addressed through multiple approaches: (1) chest-mounted device positioning to minimize motion artifacts,(2) automated quality control and artifact removal via NeuroKit2's built-in algorithms, (3) 5-minute windowing to ensure local stationarity of the signal, and (4) robust statistical aggregation (median, interquartile range, etc.) that naturally down-weights outlier windows affected by movement. HRV was computed across all 24-hour periods rather than isolated rest states to capture the full range of autonomic function throughout daily activities.
Table 3
| HRV category | Feature | Description |
|---|---|---|
| Time domain | Mean_RR | Mean RR interval between consecutive heartbeats (ms) |
| SDNN | Standard deviation of NN intervals, measuring overall HRV | |
| RMSSD | Root mean square of successive RR interval differences | |
| pNN50 | Percentage of successive RR intervals differing by >50ms | |
| SDSD | Standard deviation of successive RR interval differences | |
| Total time domain | ||
| Frequency domain | VLF_Power | Very low frequency power (0.003–0.04 Hz) |
| LF_Power | Low frequency power (0.04–0.15 Hz) | |
| HF_Power | High frequency power (0.15–0.4 Hz) | |
| LF_HF_Ratio | Low frequency to high frequency power ratio | |
| Total frequency domain | ||
| Geometric | SD1 | Standard deviation perpendicular to line of identity (Poincaré plot) |
| SD2 | Standard deviation along line of identity (Poincaré plot) | |
| SD1_SD2_Ratio | Ratio of short-term to long-term variability | |
| Total geometric | ||
| Nonlinear | ApEn | Approximate entropy, measuring regularity of heart rate patterns |
| SampEn | Sample entropy, measuring pattern complexity in RR intervals | |
| DFA_alpha1 | Short-term detrended fluctuation analysis scaling exponent | |
| DFA_alpha2 | Long-term detrended fluctuation analysis scaling exponent | |
| Total nonlinear |
HRV features.
Overall, a comprehensive set of daily features was derived from the recordings and grouped into four primary domains:
Activity features (e.g., mean acceleration, intensity-specific time, activity bouts, and fragmentation indices),
Sleep features (e.g., total sleep duration, sleep efficiency, timing, and movement-based parameters),
Circadian rhythm features (e.g., M5, L5, and relative amplitude),
HRV features, reflecting autonomic nervous system function based on ECG-derived RR intervals.
In total, 279 daily features were extracted per participant per day: 192 from HRV and 82 from activity, sleep, and circadian rhythm domains, plus 5 demographic and treatment condition variables, age, sex, and intervention condition dummy variables). (
Tables 2,
3show a breakdown of all the activity, sleep, circadian rhythm and HRV features used).
2.3.2 Data preprocessing and feature engineering
Prior to model training, comprehensive data quality control was implemented. Exact duplicate observations were identified and removed from the dataset. Participants with less than 2 days of complete data were excluded to ensure adequate data representation. Missing values were handled through complete case analysis, removing any observations with missing feature values.
Treatment conditions were consolidated into three categories (nVNS, Sham, Placebo) and converted to dummy variables for model input. Sex was encoded numerically (Male = 0, Female = 1). All continuous features were standardized using z-score normalization to ensure equal contribution to model training.
To predict next-day fatigue, we aligned the accelerometer and HRV features from each day (day n) with the fatigue score reported on the following day (day n + 1). This temporal alignment ensures that models learn to predict future fatigue states based on current physiological and behavioral patterns, reflecting real-world application scenarios where predictions would be made for the following day.
2.4 Predictive modeling
2.4.1 Model selection and implementation
We implemented two machine learning modeling approaches:
Random Forest (RF) is an ensemble of decision trees trained on bootstrap samples from the data. We utilized the “RandomForestRegressor” implementation in the scikit-learn package in Python, with hyperparameters optimized via grid search cross-validation.
XGBoost is a gradient boosting algorithm that builds trees sequentially, with each tree correcting errors made by earlier trees. We utilized the “XGBRegressor” package in Python, with learning rate, maximum tree depth, regularization parameters, and other hyperparameters optimized through extensive grid search.
Both models were optimized using a comprehensive grid search with 5-fold cross-validation to identify the best hyperparameter combinations for minimizing mean absolute error (MAE). The grid search explored multiple hyperparameter combinations for each model.
2.4.2 Training and evaluation strategy
We employed a rigorous 5-fold cross-validation methodology to ensure robust assessment of model performance and prevent overfitting. While participant-level validation (leave-one-subject-out cross-validation) would provide the most stringent test of generalizability across individuals, this approach was not feasible given our data structure. With participants contributing varying amounts of data (range: 2–11 days, median: 3.0 days), many participants had insufficient observations to serve as meaningful test sets in a leave-one-subject-out framework.
Therefore, we implemented standard 5-fold cross-validation where the complete dataset was randomly divided into five equal-sized, non-overlapping segments (folds) using stratified sampling to maintain representative distributions of fatigue scores across folds. This approach led to an 80%/20% train/test division for each fold, where four segments (80% of the data, approximately 306 observations) were used for model training while the remaining segment (20%, approximately 77 observations) acted as the independent test set. While this approach may include data from the same participants in both training and test sets within a fold, it provides more stable performance estimates given our data constraints and reflects the practical scenario where prediction models would be personalized to individual users over time.
The cross-validation process was implemented as follows: For each of the five iterations, one-fold was held out as the test set while the remaining four folds formed the training set. Hyperparameter optimization was performed exclusively on the training data using nested cross-validation to prevent data leakage. Feature scaling (standardization) was fit on the training data only and then applied to the test data to ensure no information from test sets influenced model training. This process was repeated five times, with each segment serving as the test set exactly once, ensuring that every observation was used for testing once while being utilized for training four times. Final performance metrics were calculated as the mean and standard deviation across all five folds, providing robust estimates of model generalizability.
For comprehensive model evaluation, we quantified performance using the following metrics:
R2 score: Proportion of variance in fatigue levels explained by the model.
Mean Absolute Error (MAE): Average absolute prediction error between predicted and actual fatigue levels.
Correlation coefficient: A Measure of linear association between predicted and actual fatigue levels.
2.4.3 Feature importance analysis
For tree-based models (RF and XGBoost), we used their built-in feature importance methods, which measure how much each feature contributes to prediction accuracy. For Random Forest, this indicates the mean decrease in impurity (Gini importance). In contrast, for XGBoost, it indicates the gain in information for each feature based on its contribution to model predictions.
We calculated feature importances from each fold of the 5-fold cross-validation process to ensure robust feature importance estimates and then aggregated these across all folds. This approach provides more stable rankings of importance and accounts for variability across different training sets. For each model and each fold, we extracted the feature importances attribute and then calculated:
Mean importance: Average importance across all five folds
Standard deviation: Variability in importance across folds
Consistency score: A Measure of how consistently important a feature is across folds
This cross-validation-based feature importance analysis guarantees that our rankings accurately reflect the learned relationships during model evaluation, rather than relying on importance calculated from a single training set. Features were ranked by their mean importance across all folds.
3 Results
3.1 Participant characteristics
The final analysis dataset included 389 observations from 68 unique participants with a mean age of 47.3 ± 11.5 years (range: 0–64 years). Participants were distributed across intervention conditions as follows: nVNS (n = 24 participants), Sham (n = 23 participatns), and placebo (n = 21 participatns).
Data availability varied across participants, with an average of 3.5 days of data per participant (range: 1–11 days, median: 3.0 days). This variation in data availability reflects the every-other-day assessment schedule and individual differences in questionnaire completion rates. All participants had complete data for the features included in the final models, and the processed dataset used for machine learning analysis had no missing values.
3.2 Model performance
Table 4 presents the cross-validated performance metrics for each model across all five folds. The XGBoost model demonstrated the strongest predictive performance, achieving a mean R² score of 0.789 ± 0.041 and a mean absolute error of 3.18 ± 0.63 (see Figure 1). The model showed excellent correlation between predicted and actual fatigue scores (r = 0.892 ± 0.022) (see Figure 2). Random Forest achieved a mean R² score of 0.691 ± 0.023 with a mean absolute error of 6.14 ± 0.96 and correlation coefficient of 0.864 ± 0.013.
Table 4
| Model | Metric | Mean | SD | Fold_1 | Fold_2 | Fold_3 | Fold_4 | Fold_5 |
|---|---|---|---|---|---|---|---|---|
| Random forest | R² Score | 0.691 | 0.023 | 0.731 | 0.681 | 0.661 | 0.697 | 0.683 |
| Random forest | MAE | 6.14 | 0.96 | 5.39 | 7.39 | 6.67 | 4.72 | 6.56 |
| Random forest | Correlation | 0.864 | 0.013 | 0.878 | 0.876 | 0.845 | 0.852 | 0.872 |
| XGBoost | R² Score | 0.789 | 0.041 | 0.849 | 0.799 | 0.796 | 0.78 | 0.722 |
| XGBoost | MAE | 3.18 | 0.63 | 2.49 | 3.34 | 3.68 | 2.41 | 3.98 |
| XGBoost | Correlation | 0.892 | 0.022 | 0.925 | 0.899 | 0.893 | 0.886 | 0.856 |
Model results.
Figure 1
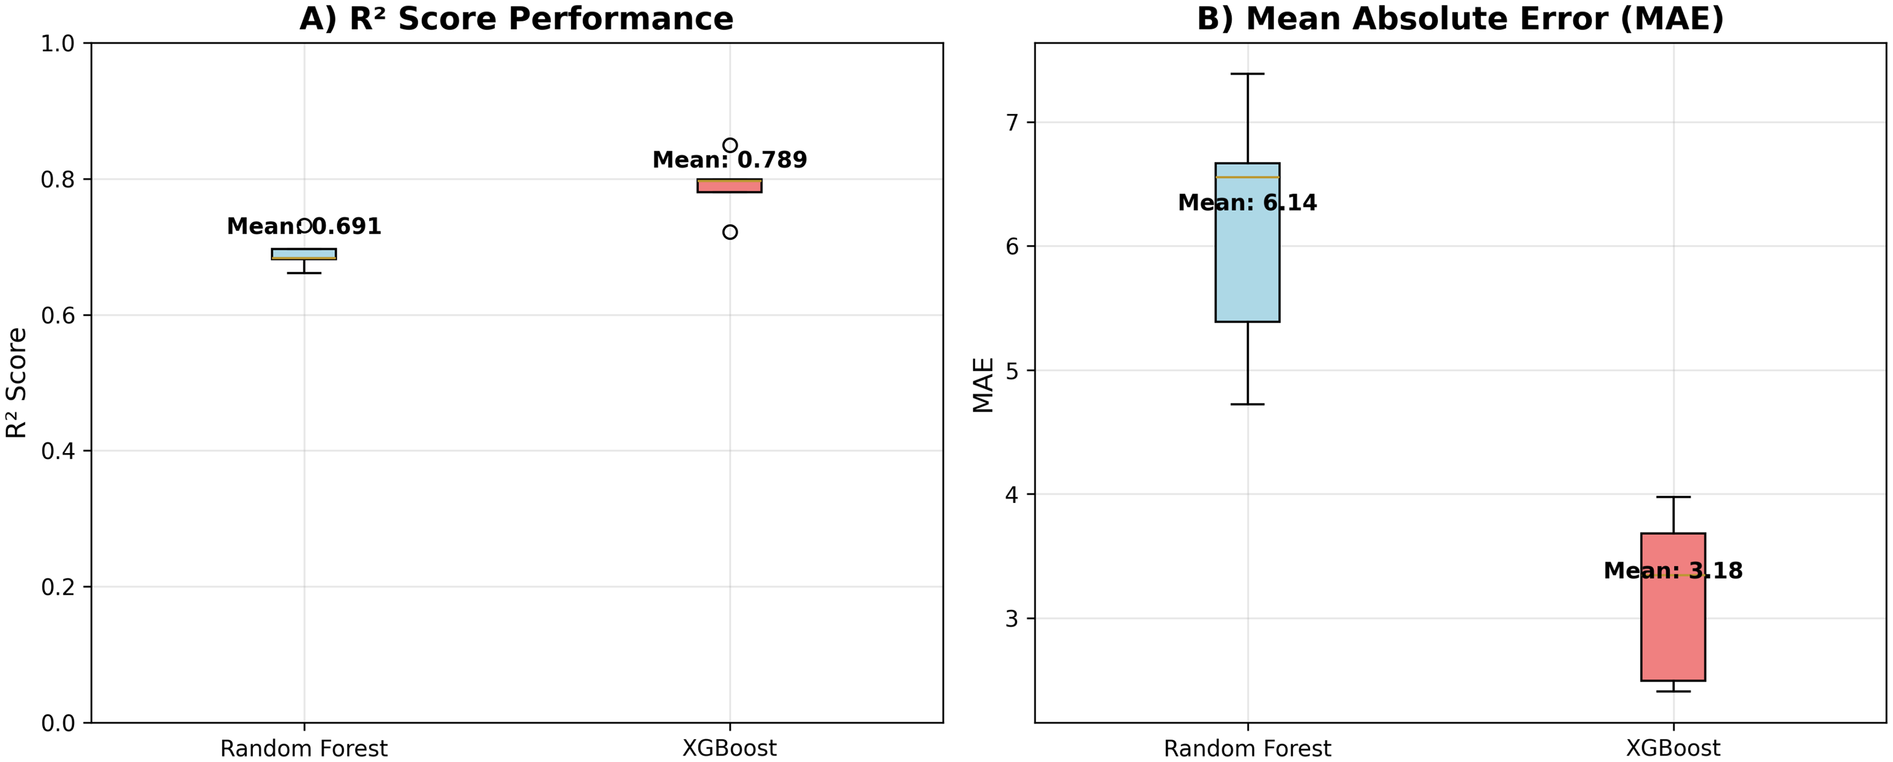
Model performance metrics. R² and MAE scores for both machine learning models. (A) R² values. (B) MAE values.
Figure 2
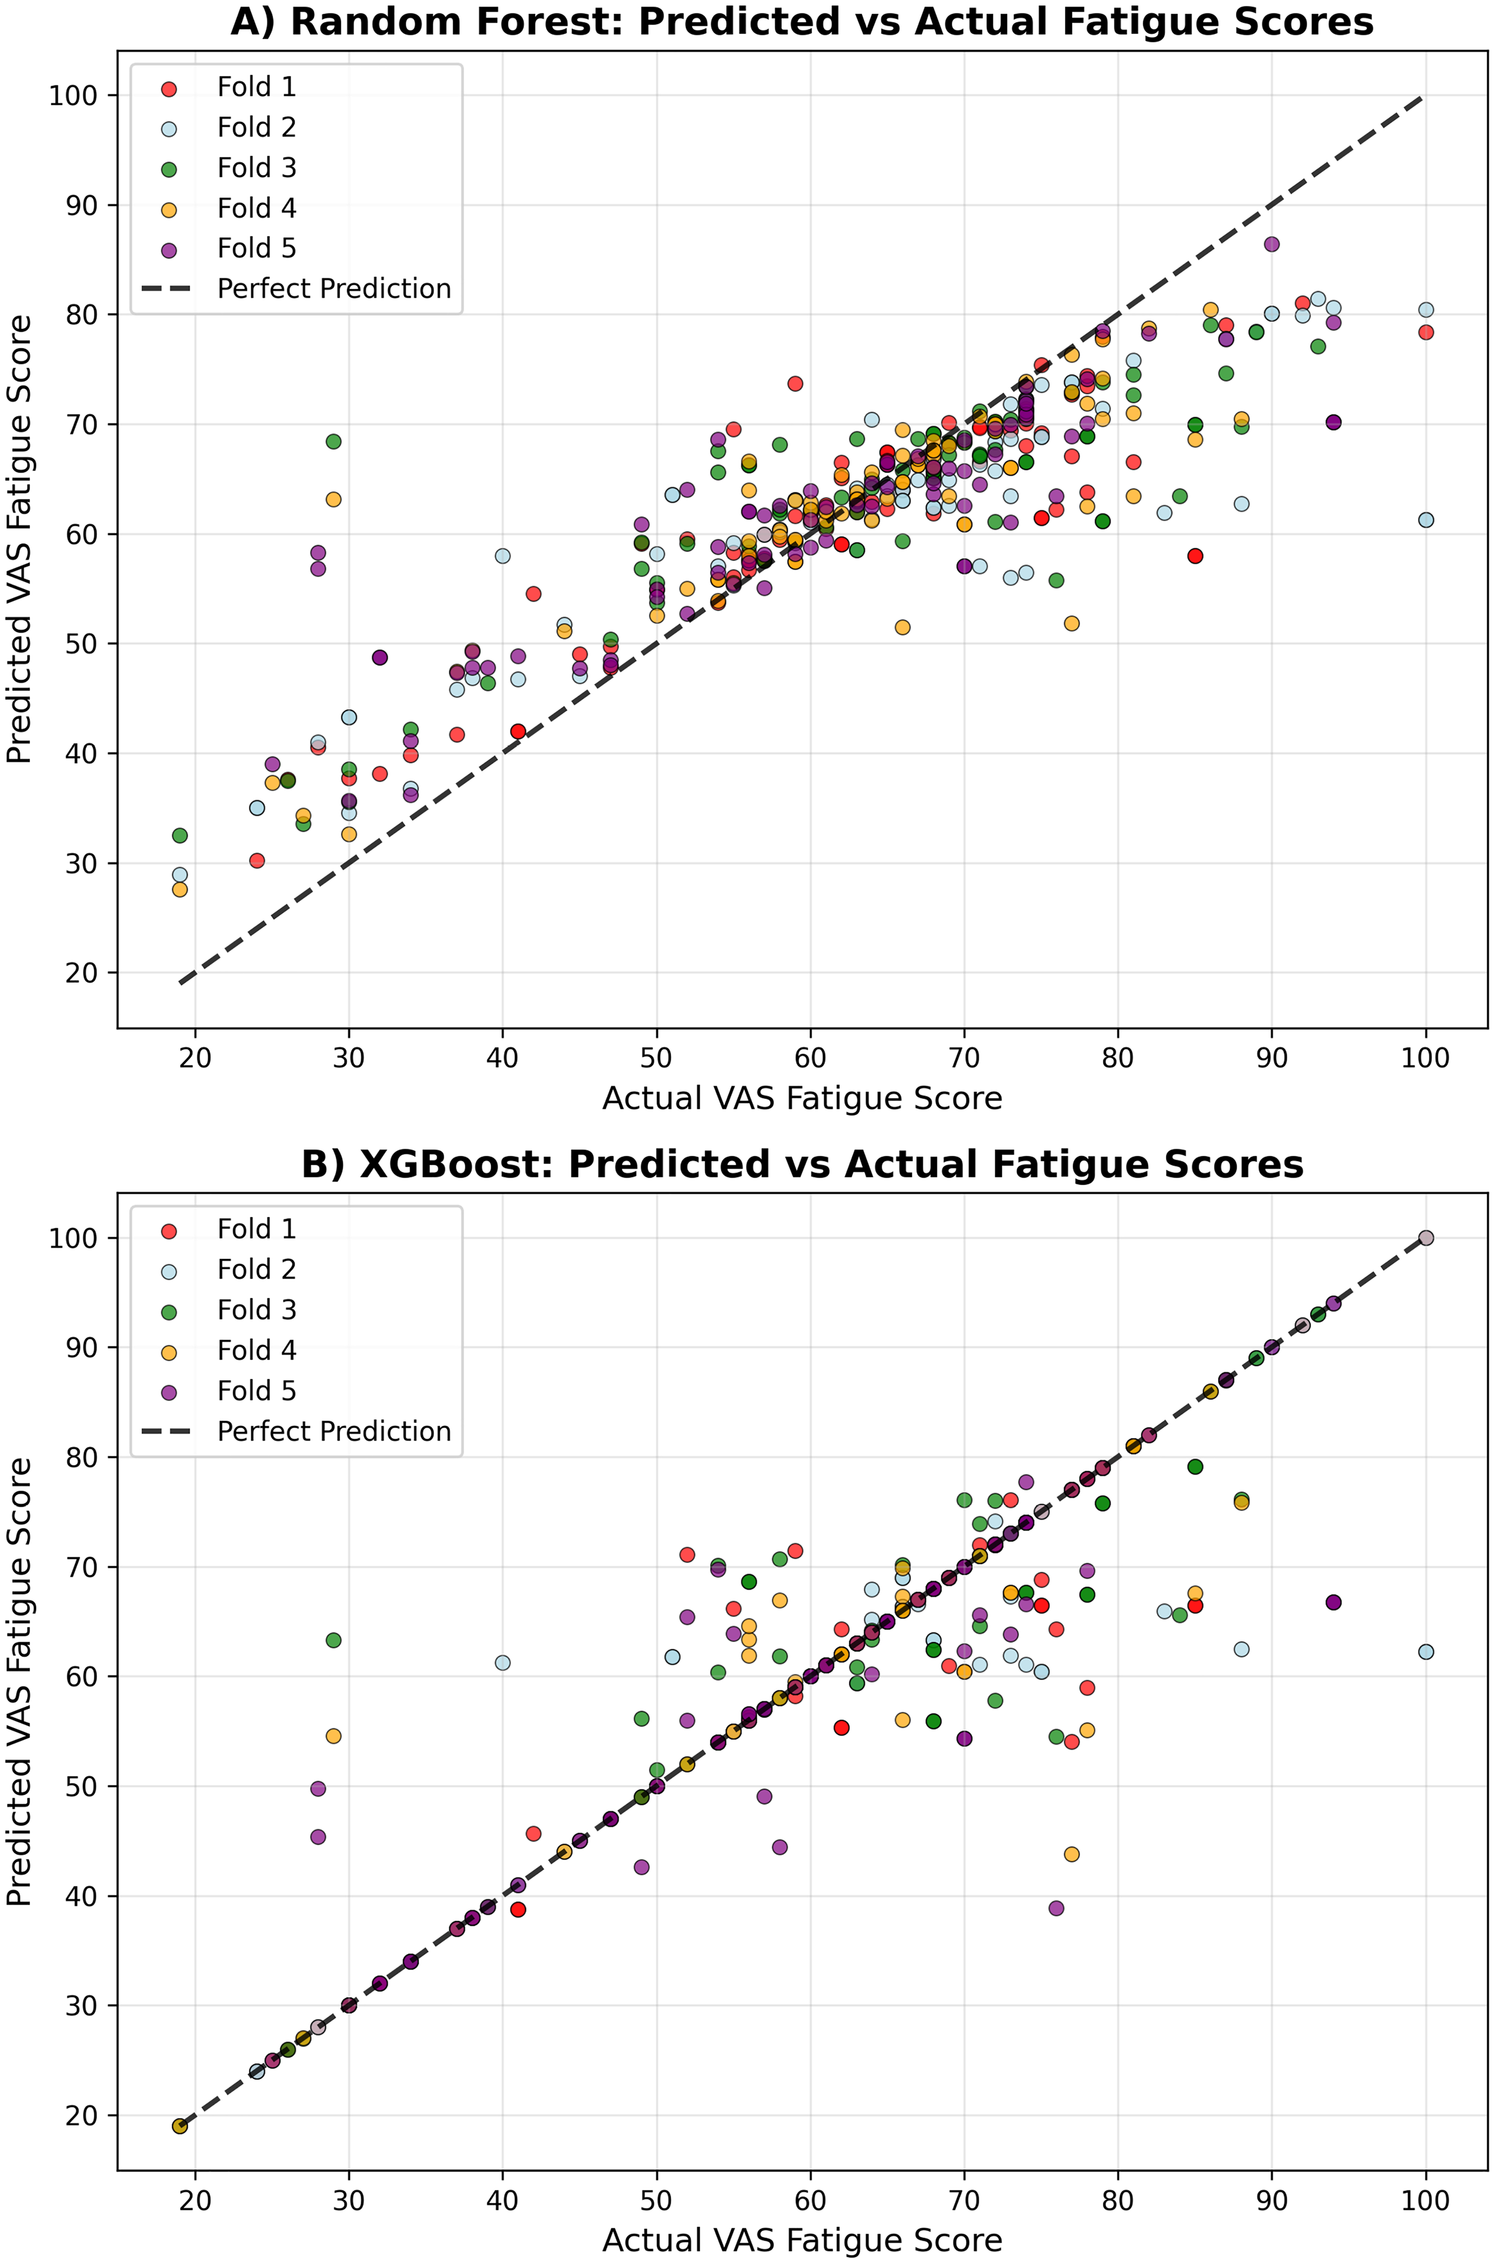
Prediction accuracy comparison. Correlation between observed and predicted fatigue scores for each model. (A) Random Forest. (B) XGBoost.
Both tree-based models demonstrated strong predictive capability, with XGBoost showing superior performance across all metrics. The consistently high correlation coefficients (>0.86 for both models) indicate strong linear relationships between predicted and actual fatigue scores, while the R² values demonstrate that both models can explain a substantial proportion of variance in next-day fatigue levels. The cross-validation standard deviations indicate good stability of performance across different data splits, with Random Forest showing slightly more consistent performance (lower standard deviation) than XGBoost.
XGBoost Top 5 Features:
LF_Power_min—Low frequency power minimum
SDSD_std—SDSD standard deviation
ApEn_mean—Approximate entropy mean
SDSD_kurtosis—SDSD kurtosis
ApEn_q1—Approximate entropy Q1
Random Forest Top 5 Features:
SampEn_cv (- Sample entropy coefficient of variation
SampEn_kurtosis—Sample entropy kurtosis
LF_Power_cv—Low frequency power coefficient of variation
age_at_baseline—Age
SDNN_kurtosis—SDNN kurtosis
The feature importance analysis revealed several key patterns:
HRV Dominance: Heart rate variability features, particularly non-linear measures (sample entropy variability, approximate entropy) and frequency domain characteristics (low-frequency power), emerged as the most important predictive features. These metrics reflect autonomic nervous system function and heart rate complexity.
Demographic Factors: Age emerged as a significant predictor in the Random Forest model (ranked 4th), while sex appeared in the top 10 for Random Forest, suggesting potential demographic differences in fatigue patterns or responses to physiological and behavioral factors.
Activity Patterns: Features related to the distribution and timing of physical activity were essential, particularly duration of moderate and vigorous activity periods, supporting the relationship between activity levels and next-day fatigue (see Figure 3).
Figure 3
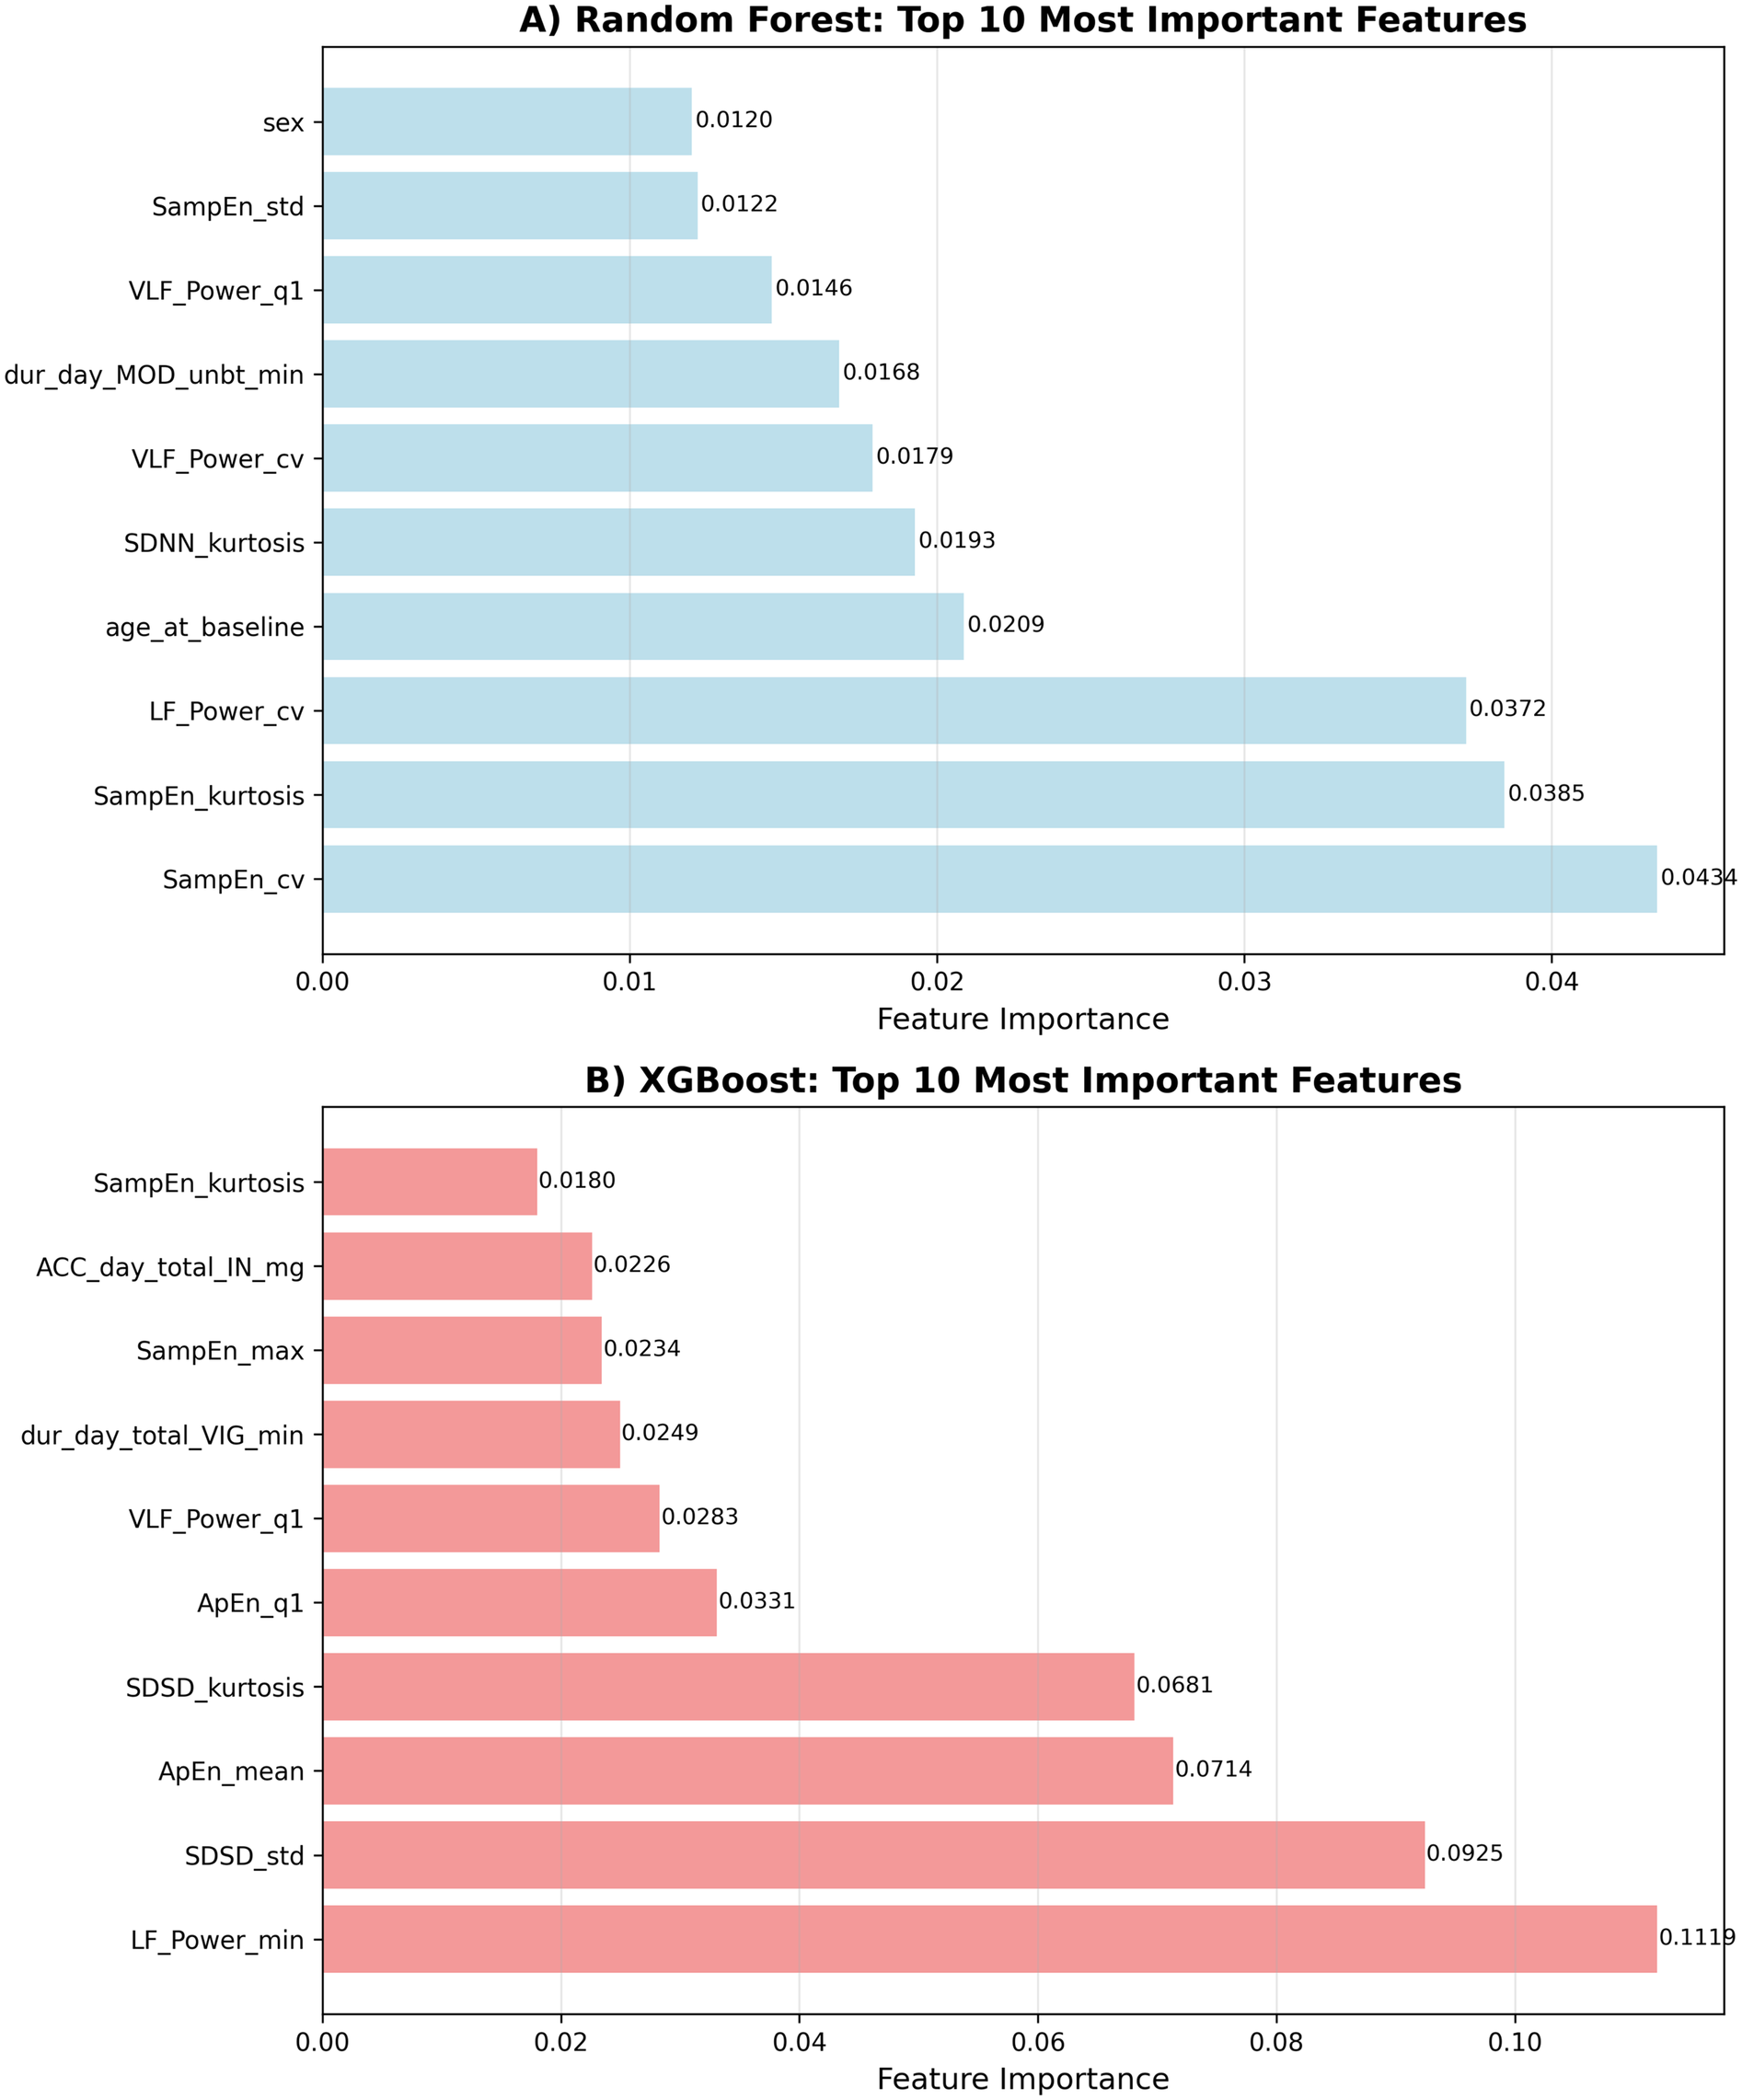
Feature importance rankings. Top 10 most influential predictors of next-day fatigue identified by each model. (A) Random Forest. (B) XGBoost.
4 Discussion
This pilot study has demonstrated the feasibility of using machine learning approaches to predict next-day fatigue levels in individuals with post-COVID fatigue based on objective physiological and behavioral metrics from wearable devices. Our findings suggest that it is possible to achieve a moderate prediction accuracy for next day fatigue state in participants with Long Covid by combining heart rate variability measures with activity and sleep patterns, indicating the potential for digital biomarkers to inform personalized fatigue management strategies in future larger-scale studies.
4.1 Key findings
4.1.1 Intervention control and model robustness
Intervention condition (nVNS, Sham, Placebo) was included as dummy variables in all predictive models to control for potential treatment effects. The final analysis included 68 unique participants (19 males, 49 females) with 389 total observations distributed across intervention groups: nVNS (n = 24 participants, 35.3%), Placebo (n = 23 participants, 33.8%), and Sham (n = 21 participants, 30.9%). Intervention control analysis revealed that model performance remained robust when intervention variables were excluded from the feature set. For XGBoost, R² decreased only slightly from 0.789 ± 0.041 (with intervention) to 0.759 ± 0.043 (without intervention), while Random Forest showed minimal change from 0.691 ± 0.023 to 0.689 ± 0.018. This indicates that the physiological and behavioral patterns captured by our features predict next-day fatigue independent of intervention status, demonstrating the generalizability of our predictive models across different treatment conditions.
4.1.2 Model performance
The performance of the tree-based models, particularly XGBoost, demonstrates that next-day fatigue prediction involves complex, non-linear interactions between physiological and behavioral features. XGBoost outperformed Random Forest likely due to its advanced gradient boosting algorithm and built-in regularization capabilities, which better handle feature interactions and prevent overfitting in this complex prediction task. This finding aligns with previous research in symptom prediction for chronic conditions, showing that ensemble methods often outperform traditional statistical approaches (33). The high correlation coefficients (>0.88) and significant variance explained (R2 score >0.8) indicate that objective wearable-derived metrics provide some form of predictive power for next-day fatigue levels. The achieved mean absolute errors of 3.04 and 6.54 for XGBoost and Random Forest, respectively, represent clinically meaningful prediction accuracy on the 0–100 VAS fatigue scale, as these fall within ranges that could inform practical decision-making for fatigue management. While minimal clinically important differences (MCID) for VAS fatigue scales in post-COVID populations have not been fully established, our prediction errors are minimal given a scale of a 0–100.
4.1.3 Feature importance
The emergence of HRV metrics as the strongest predictors represents a significant finding, highlighting the role of autonomic nervous system dysfunction in post-COVID fatigue. Frequency domain measures (LF_power), and non-linear measures (SampEn) consistently ranked among the top predictors, suggesting that autonomic dysregulation may be a key mechanism underlying fatigue fluctuations in pCF. This finding aligns with previous research demonstrating that real-world cardiorespiratory measures can stratify participants with persistent fatigue in other conditions, supporting the utility of physiological monitoring for fatigue assessment (34).
The importance of activity patterns, particularly moderate-to-vigorous physical activity duration and moderate activity bouts aligns with the energy envelope theory and the concept of post-exertional malaise observed in ME/CFS (35). Stratified analyses revealed that morning activity patterns (M5TIME < 12 h) were associated with superior predictive performance (XGBoost R² = 0.792 ± 0.106) compared to afternoon (R² = 0.070 ± 0.985) and evening (R² = 0.525 ± 0.438) patterns. These findings suggest that the distribution and timing of activity throughout the day, rather than simply the total amount, play a crucial role in determining next-day fatigue levels, with morning activity patterns showing higher predictability.
While some sleep-related variables (sleep duration, sleep efficiency) were included in the model, they did not rank among the most important predictors, suggesting that physiological measures (HRV) and activity patterns are more predictive of next-day fatigue than sleep metrics in this population.
Demographic factors, particularly sex and age, emerged as important predictors, suggesting potential gender and age-related differences in fatigue mechanisms or responses to physiological and behavioral factors. Stratified analyses revealed that models performed better for females (XGBoost R² = 0.703 ± 0.074, Random Forest R² = 0.694 ± 0.037) compared to males (XGBoost R² = 0.387 ± 0.321, Random Forest R² = 0.480 ± 0.206), with the difference reflecting both sample size disparities (49 vs. 19 unique participants) and distinct physiological patterns. This finding warrants further investigation into sex-specific approaches to fatigue management.
4.1.4 Physiological vs. behavioral contributions
The dominance of HRV features (40%–50% of top predictors) suggests that physiological monitoring provides the strongest signals for fatigue prediction, while behavioral factors (activity patterns, sleep) contribute approximately 45%–50% of predictive information. This finding supports the integration of both physiological and behavioral monitoring for comprehensive fatigue assessment and management.
4.2 Clinical implications
4.2.1 Personalized fatigue management
The strong predictive power of HRV metrics suggests that continuous autonomic monitoring could provide early warning signals for fatigue exacerbations. By identifying optimal HRV patterns associated with lower next-day fatigue, clinicians could develop personalized autonomic regulation strategies through interventions such as heart rate variability biofeedback, breathing exercises, or stress management techniques.
The importance of activity timing patterns indicates that personalized activity scheduling based on individual circadian rhythms and activity tolerance could help optimize next-day fatigue levels. Rather than generic activity recommendations, interventions could focus on identifying individual-specific timing windows and activity distributions associated with better autonomic function and lower fatigue.
Integrating physiological (HRV) and behavioral (activity/sleep) monitoring enables a more comprehensive approach to fatigue management than either domain alone. This multi-modal approach could inform personalized recommendations that address both autonomic regulation and behavioral pacing strategies.
4.2.2 Treatment planning
The identification of HRV metrics—particularly SampEn and LF_power—as the strongest predictors indicates that interventions targeting autonomic nervous system regulation may be especially effective for post-COVID fatigue. Potential strategies include heart rate variability biofeedback training to enhance autonomic control, breathing exercises and mindfulness practices to promote parasympathetic activation, and activity pacing approaches that integrate HRV monitoring for real-time feedback and self-regulation.
The observed importance of activity timing patterns (M5TIME) highlights the potential role of circadian rhythm–based interventions, such as light therapy or chronotherapy, in optimizing activity distribution and reducing next-day fatigue. Morning activity patterns were associated with superior predictive performance (XGBoost R² = 0.792 ± 0.106) compared to afternoon (R² = 0.070 ± 0.985) and evening (R² = 0.525 ± 0.438) patterns, suggesting that promoting earlier daily activity may represent a viable behavioral strategy for fatigue management.
The marked gender differences in model performance (females: R² = 0.703 ± 0.074; males: R² = 0.387 ± 0.321) further suggest the need for personalized, sex-specific intervention frameworks. Tailoring protocols to reflect the distinct physiological and behavioral fatigue patterns observed in each sex could enhance the efficacy of treatment strategies.
Importantly, the robust performance of our models even after excluding intervention variables (XGBoost R² decreased only from 0.789 to 0.759) indicates that physiological and behavioral patterns can predict fatigue independently of treatment status, supporting the potential generalizability of these findings across different clinical and lifestyle contexts.
Nevertheless, these associations are correlational and should not be interpreted as causal. Further validation through randomized controlled trials is essential to determine whether interventions targeting these identified predictors can directly improve fatigue outcomes.
4.2.3 Monitoring and prevention
The model's performance suggests that wearable-based prediction algorithms could serve as early warning systems for high-fatigue days. Real-time HRV monitoring combined with activity tracking could provide personalized alerts when physiological or behavioral patterns indicate an increased risk of next-day fatigue exacerbation.
Such systems could enable proactive intervention by alerting individuals when HRV patterns suggest increased fatigue risk, recommending activity modifications based on current physiological state, providing feedback on optimal timing for activities based on individual patterns, and guiding pacing decisions through integration of autonomic and activity data.
The dominance of physiological markers suggests that objective monitoring may be more reliable than subjective symptom reporting for fatigue prediction, offering a path toward more precise and personalized management approaches.
4.3 Limitations and future directions
4.3.1 Study limitations
Several limitations should be considered when interpreting our findings. First, the sample size, while adequate for initial modeling, could be expanded for more robust validation, particularly given the heterogeneity of post-COVID conditions. Second, the monitoring period (14 days at baseline plus 7 days at follow-up) might not capture longer-term patterns in activity and fatigue that could be relevant for prediction. Seasonal variations and major life events could influence both predictors and outcomes over longer timeframes.
Third, our cross-validation approach used standard 5-fold CV rather than participant-level (leave-one-subject-out) validation due to the limited number of observations per participant. While this provides stable performance estimates, it may overestimate model performance compared to true cross-participant generalization, as data from the same participants can appear in both training and test sets within folds. The varying data availability across participants (2–11 days per participant) necessitated this methodological choice, but future studies with more extensive longitudinal data per participant would benefit from participant-level validation to better assess cross-individual generalizability.
Our study population was limited to those with access to wearable technology and the ability to complete digital assessments every other day, potentially limiting generalizability to all individuals with pCF. Additionally, while our cohort showed a higher proportion of women compared to men, this gender distribution aligns with some published long-COVID literature showing consistent female predominance (ranging from 56%–79% across major cohorts) (2, 32) and likely reflects genuine sex differences in post-viral fatigue susceptibility rather than sampling bias. However, single-site recruitment and limited ethnic diversity may limit generalizability to other geographic regions and populations with different demographic characteristics. The study was conducted in a single center with limited ethnic diversity, which may not reflect the broader post-COVID population globally. Furthermore, while we controlled treatment conditions, the study was conducted in the context of an intervention trial, which might have influenced participants’ activity patterns and fatigue reporting. Finally, these conclusions are based on a single cohort, and validation in external, independent cohorts would strengthen the generalizability of our findings.
4.3.2 Future research
Future research should focus on validating these findings in larger, more diverse populations of individuals with pCF. Multicenter studies with extended monitoring periods (ideally 6–12 weeks per participant) would enhance generalizability and allow for examination of longer-term patterns. Such studies should aim to collect sufficient longitudinal data per participant to enable participant-level cross-validation, providing more stringent tests of cross-individual generalizability. Additionally, prospective validation studies could assess the real-world utility of predictive models for fatigue management.
Investigation of longer-term patterns and their impact on fatigue prediction could provide insights into adaptation processes and disease trajectories in pCF. Development of real-time monitoring systems based on these models represents a promising direction for clinical application. Such systems could provide personalized activity recommendations and early warnings of fatigue exacerbations, potentially improving self-management and quality of life.
Finally, investigation of causal relationships between identified predictors and fatigue through interventional studies would strengthen the evidence base for targeted interventions. Experimental manipulation of key predictors, such as activity distribution or sleep timing, could test causal hypotheses and inform intervention development.
5 Conclusions
This study demonstrates the feasibility of using machine learning approaches to predict next-day fatigue levels in individuals with post-COVID fatigue using objective physiological and behavioral metrics derived from wearable devices. The XGBoost model achieved strong performance (mean R² score = 0.789 ± 0.041, MAE = 3.18 ± 0.63), suggesting that combined HRV and activity/sleep metrics provide valuable predictive information for fatigue forecasting in larger studies.
Key findings include that heart rate variability features emerged as the strongest predictors of next-day fatigue levels, particularly non-linear measures such as sample entropy variability and approximate entropy, highlighting the importance of autonomic nervous system complexity monitoring. Activity timing patterns and demographic factors (age, sex) also showed significant predictive power. Finally, the integration of physiological (HRV) and behavioral (activity/sleep) data provides superior prediction compared to either domain alone.
These findings have important implications for personalized fatigue management strategies and the development of early warning systems for high-fatigue days. Future research should focus on validating these findings in larger, more diverse populations and developing real-time monitoring systems that integrate HRV and activity data. Such efforts could ultimately lead to more effective, personalized interventions for individuals living with post-COVID fatigue.
Statements
Data availability statement
The raw data supporting the conclusions of this article will be made available by the authors, without undue reservation.
Author contributions
NA: Writing – original draft, Writing – review & editing. MG: Supervision, Writing – review & editing. KB: Supervision, Validation, Writing – review & editing. MB: Supervision, Writing – review & editing. SD: Supervision, Writing – review & editing.
Funding
The author(s) declare that financial support was received for the research and/or publication of this article. NA is a PhD student funded by the National Institute for Health and Care Research (NIHR) Newcastle Biomedical Research Centre PhD Studentship. SDD is supported by the Innovative Medicines Initiative 2 Joint Undertaking (IMI2 JU) project IDEA-FAST - Grant Agreement 853,981. SDD and KB are supported by the National Institute for Health and Care Research (NIHR) Newcastle Biomedical Research Centre (BRC) based at Newcastle Upon Tyne Hospital NHS Foundation Trust, Newcastle University, and the Cumbria, Northumberland and Tyne and Wear (CNTW) NHS Foundation Trust. SDD is also supported by the NIHR/Wellcome Trust Clinical Research Facility (CRF) infrastructure at Newcastle upon Tyne Hospitals NHS Foundation Trust. SDD was supported by the UK Research and Innovation (UKRI) Engineering and Physical Sciences Research Council (EPSRC) (Grant Ref: EP/W031590/1, Grant Ref: EP/X031012/1, and Grant Ref: EP/X036146/1). SDD is also supported by the EPSRC-funded TORUS research programme (EP/X036146/1). KFB is also funded by an NIHR Advanced Fellowship (NIHR303620). MRB is also funded by an NIHR grant (COV-LT2-0022). The views expressed are those of the authors and not necessarily those of the funders.
Conflict of interest
SD is a shareholder in Enoda Health Ltd.
The remaining authors declare that the research was conducted in the absence of any commercial or financial relationships that could be construed as a potential conflict of interest.
Generative AI statement
The author(s) declare that no Generative AI was used in the creation of this manuscript.
Any alternative text (alt text) provided alongside figures in this article has been generated by Frontiers with the support of artificial intelligence and reasonable efforts have been made to ensure accuracy, including review by the authors wherever possible. If you identify any issue please contact us.
Publisher’s note
All claims expressed in this article are solely those of the authors and do not necessarily represent those of their affiliated organizations, or those of the publisher, the editors and the reviewers. Any product that may be evaluated in this article, or claim that may be made by its manufacturer, is not guaranteed or endorsed by the publisher.
Supplementary material
The Supplementary Material for this article can be found online at: https://www.frontiersin.org/articles/10.3389/fdgth.2025.1689846/full#supplementary-material
References
1.
Ceban F Ling S Lui LMW Lee Y Gill H Teopiz KM et al Fatigue and cognitive impairment in post-COVID-19 syndrome: a systematic review and meta-analysis. Brain Behav Immun. (2022) 101:93–135. 10.1016/j.bbi.2021.12.020
2.
Davis HE Assaf GS McCorkell L Wei H Low RJ Re'em Y et al Characterizing long COVID in an international cohort: 7 months of symptoms and their impact. EClinicalMedicine. (2021) 38:101019. 10.1016/j.eclinm.2021.101019
3.
Stephenson T Pereira SMP Shafran R de Stavola BL Rojas N McOwat K et al Physical and mental health 3 months after SARS-CoV-2 infection (long COVID) among adolescents in England (CLoCk): a national matched cohort study. Lancet Child Adolesc Health. (2022) 6(4):230–9. 10.1016/S2352-4642(22)00022-0
4.
World Health Organization. A Clinical Case Definition of Post COVID-19 Condition by a Delphi Consensus. Geneva: WHO (2021).
5.
Office for National Statistics. Prevalence of Ongoing Symptoms Following Coronavirus (COVID-19) Infection in the UK (2022). Available online at:https://www.ons.gov.uk/peoplepopulationandcommunity/healthandsocialcare/conditionsanddiseases/bulletins/prevalenceofongoingsymptomsfollowingcoronaviruscovid19infectionintheuk/6january2022
6.
Proal AD VanElzakker MB . Long COVID or post-acute sequelae of COVID-19 (PASC): an overview of biological factors that may contribute to persistent symptoms. Front Microbiol. (2021) 12:698169. 10.3389/fmicb.2021.698169
7.
Stanculescu D Larsson L Bergquist J . Hypothesis: mechanisms that prevent recovery in prolonged ICF related fatigue are similar to those that drive ME/CFS. Front Neurol. (2021) 12:701419. 10.3389/fmed.2021.628029
8.
Jason L Brown M Evans M Anderson V Lerch A Brown A et al Measuring substantial reductions in functioning in patients with chronic fatigue syndrome. Disabil Rehabil. (2011) 33(7):589–98. 10.3109/09638288.2010.503256
9.
Tabacof L Tosto-Mancuso J Wood J Allegretti M Putrino D . Post-acute COVID-19 syndrome negatively impacts physical function, cognitive function, health-related quality of life, and participation. Am J Phys Med Rehabil. (2022) 101(1):48–52. 10.1097/PHM.0000000000001910
10.
Blomberg B Mohn KG Brokstad KA Zhou F Linchausen DW Hansen BA et al Long COVID in a prospective cohort of home-isolated patients. Nat Med. (2021) 27(9):1607–13. 10.1038/s41591-021-01433-3
11.
Hinchliffe C Zia Ur Rehman R Pinaud C Branco D Jackson D Ahmaniemi T et al Evaluation of walking activity and gait to identify physical and mental fatigue in neurodegenerative and immune disorders: preliminary insights from the IDEA-FAST feasibility study. J Neuroeng Rehabil. (2024) 21:94. 10.1186/s12984-024-01390-1
12.
Izmailova ES McLean IL Bhatia G Hather G Cantor M Merberg D et al Evaluation of wearable digital devices in a phase I clinical trial. Clin Transl Sci. (2019) 12(3):247–56. 10.1111/cts.12602
13.
Rabinovich RA Louvaris Z Raste Y Langer D Van Remoortel H Giavedoni S et al Validity of physical activity monitors during daily life in patients with COPD. Eur Respir J. (2013) 42(5):1205–15. 10.1183/09031936.00134312
14.
Degroote L Hamerlinck G Poels K Maher C Crombez G De Bourdeaudhuij I et al Low-cost consumer-based trackers to measure physical activity and sleep duration among adults in free-living conditions: validation study. JMIR Mhealth Uhealth. (2020) 8(5):e16674. 10.2196/16674
15.
Torchio A Cattaneo D Rossi V Gervasoni E Pedrocchi A Bertoni R et al Objective and subjective measures of daily physical activity in persons with multiple sclerosis beginning a rehabilitation regime: a cross-sectional study. Mult Scler Relat Disord. (2022) 68:104394. 10.1016/j.msard.2022.104394
16.
Sada YH Poursina O Zhou H Workeneh BT Maddali SV Najafi B . Harnessing digital health to objectively assess cancer-related fatigue: the impact of fatigue on mobility performance.PLoS ONE. (2021) 16:e0246101. 10.1371/journal.pone.0246101
17.
Vergauwen K Huijnen IPJ Huysmans E Ickmans K Smeets RJEM Kos D et al An exploratory study of discrepancies between objective and subjective measurement of the physical activity level in female patients with chronic fatigue syndrome. J Psychosom Res. (2021) 144:110417. 10.1016/j.jpsychores.2021.110417
18.
Sada YH Cooper C Porter DP Hinchey A Rodriguez-Barradas MC Naik AD et al Harnessing digital health to objectively assess cancer-related fatigue: the impact of fatigue on mobility performance. PLoS One. (2021) 16(2):e0246101. 10.1371/journal.pone.0246101
19.
Jones CD Ketzan M Stephens SL Siengsukon CF Motl RW . Do fatigue and depression have a bivariate association with device-measured physical activity behavior in persons with multiple sclerosis?Disabil Rehabil. (2024) 46(10):2522–7. 10.1080/09638288.2023.2225876
20.
Martin T Twomey R Medysky ME Temesi J Culos-Reed SN Millet GY . The relationship between fatigue and actigraphy-derived sleep and rest-activity patterns in cancer survivors. Curr Oncol. (2021) 28(2):1170–82. 10.3390/curroncol28020113
21.
Stephens S Peterson E Till C Spitsin S Khankhanian P Chitnis T et al Sleep, physical activity, and psychological outcomes in children and adolescents with pediatric onset multiple sclerosis. Mult Scler Relat Disord. (2023) 79:105025. 10.1016/j.msard.2023.105025
22.
McArdle JJ Nesselroade JR . Longitudinal Data Analysis Using Structural Equation Models. Washington, DC: American Psychological Association (2014).
23.
Miotto R Wang F Wang S Jiang X Dudley JT . Deep learning for healthcare: review, opportunities and challenges. Brief Bioinform. (2018) 19(6):1236–46. 10.1093/bib/bbx044
24.
Liu YX Antwi-Amoabeng B Tang L Gu JL Xiao B Chen WJ et al Comparison and development of advanced machine learning tools to predict nonalcoholic fatty liver disease: an extended study. Hepatobiliary Pancreat Dis Int. (2021) 20(5):409–15. 10.1016/j.hbpd.2021.08.004
25.
Zou Q Qu K Luo Y Yin D Ju Y Tang H . Predicting diabetes mellitus with machine learning techniques. Front Genet. (2018) 9:515. 10.3389/fgene.2018.00515
26.
Kern C Klausch T Kreuter F . Tree-based machine learning methods for survey research.Surv. Res. Method. (2019) 13(1):73–93.
27.
Breiman L . Random forests. Mach Learn. (2001) 45(1):5–32. 10.1023/A:1010933404324
28.
Chen T Guestrin C . XGBoost: a scalable tree boosting system. In: Proceedings of the 22nd ACM SIGKDD International Conference on Knowledge Discovery and Data Mining; 2016 Aug 13-17; San Francisco, CA. New York: ACM (2016). p. 785–94
29.
Lee KA Hicks G Nino-Murcia G . Validity and reliability of a scale to assess fatigue.Psychiatry Res. (1991) 36(3):291–8. 10.1016/0165-1781(91)90027-m
30.
Migueles JH Rowlands AV Huber F Sabia S van Hees VT . GGIR: a research community-driven open source R package for generating physical activity and sleep outcomes from multi-day raw accelerometer data.J Meas Phys Behav. (2019) 2(3):188–96. 10.1123/jmpb.2018-0063
31.
R Core Team. R: A Language and Environment for Statistical Computing (version 4.1.0). Vienna, Austria: R Foundation for Statistical Computing (2021).
32.
Subramanian A Nirantharakumar K Hughes S Myles P Williams T Gokhale KM et al Symptoms and risk factors for long COVID in non-hospitalised adults. Nat Med. (2022) 28(8):1706–14. 10.1038/s41591-022-01909-w
33.
Walsh K Shah R Armstrong JK Moore ES Oliver BJ . Comparing traditional modeling approaches versus predictive analytics methods for predicting multiple sclerosis relapse. Mult Scler Relat Disord. (2022) 57:103330. 10.1016/j.msard.2021.103330
34.
Escorihuela RM Capdevila L Ramos-Castro J Zaragozà MC Maurel S Castro-Marrero J et al Reduced heart rate variability predicts fatigue severity in individuals with chronic fatigue syndrome/myalgic encephalomyelitis. J Transl Med. (2020) 18(1):4. 10.1186/s12967-019-02184-z
35.
Moore GE Keller BA Stevens J Mao X Stevens SR Chia JK et al Recovery from exercise in persons with myalgic encephalomyelitis/chronic fatigue syndrome (ME/CFS). Medicina (B Aires). (2023) 59(3):571. 10.3390/medicina59030571
Summary
Keywords
post-COVID syndrome, fatigue prediction, machine learning, heart rate variability, accelerometry, wearable technology, XGBoost, digital biomarkers
Citation
Aboagye NY, Germann M, Baker KF, Baker MR and Del Din S (2025) Feasibility of predicting next-day fatigue levels using heart rate variability and activity-sleep metrics in people with post-COVID fatigue. Front. Digit. Health 7:1689846. doi: 10.3389/fdgth.2025.1689846
Received
21 August 2025
Accepted
14 October 2025
Published
18 November 2025
Volume
7 - 2025
Edited by
Hadi Akbarzadeh Khorshidi, The University of Melbourne, Australia
Reviewed by
Richard Gevirtz, Alliant International University, United States
Shamsi Shekari Soleimanloo, The University of Queensland, Australia
Updates
Copyright
© 2025 Aboagye, Germann, Baker, Baker and Del Din.
This is an open-access article distributed under the terms of the Creative Commons Attribution License (CC BY). The use, distribution or reproduction in other forums is permitted, provided the original author(s) and the copyright owner(s) are credited and that the original publication in this journal is cited, in accordance with accepted academic practice. No use, distribution or reproduction is permitted which does not comply with these terms.
* Correspondence: Nana Yaw Aboagye n.y.aboagye2@newcastle.ac.uk
ORCID Nana Yaw Aboagye orcid.org/0000-0001-7627-4145 Maria Germann orcid.org/0000-0002-2747-9555 Kenneth F. Baker orcid.org/0000-0002-6735-2911 Mark R. Baker orcid.org/0000-0001-6916-1329 Silvia Del Din orcid.org/0000-0003-1154-4751
Disclaimer
All claims expressed in this article are solely those of the authors and do not necessarily represent those of their affiliated organizations, or those of the publisher, the editors and the reviewers. Any product that may be evaluated in this article or claim that may be made by its manufacturer is not guaranteed or endorsed by the publisher.