1 Introduction
Advancements in the fabrication of 2D magnetic van der Waals (vdW) materials have largely been driven by the potential to reveal unique magnetic states not achievable in three dimensions, and the possibility of engineering new magnetic phases through extrinsic perturbations, such as stacking (Park, 2016; Sivadas et al., 2018; Gong et al., 2017; Tang et al., 2023). Such progress is crucial for the production of future magnetic based spintronic devices (Hellman et al., 2017; Burch et al., 2018). The first steps towards this goal however, requires a comprehensive picture of a materials magnetic properties, which necessitates understanding the propagation of spin-waves.
The momentum and energy-resolved magnetic excitation spectra in bulk materials are readily measured by inelastic neutron scattering (INS) or resonant inelastic X-ray scattering (RIXS). However, the extremely small sample volumes of 2D magnetic materials make INS not feasible. Optical measurements can be used to obtain some information about the magnetic excitations in 2D materials, but are limited to negligible momentum transfers so can only provide limited information of magnetic excitations in antiferromagnets. Hence, X-ray scattering techniques are essential for advancing our understanding of 2D magnetism (Ahn et al., 2024).
Sample degradation has been a persistent problem in the fabrication of clean, few-layer vdW materials. A primary source of degradation is the physical adsorption of oxygen on the surface, or the chemisorption of oxygen into ligand vacancies (Grünleitner et al., 2022; Wu et al., 2021). Extensive research has been conducted on methods to protect exfoliated flakes from degredation in ambient atmosphere. These predominantly involve the placement of a capping layer of hBN or thin-films such as (Li Q. et al., 2019) on top of the 2D material. However, during an X-ray or light scattering experiment, large quantities of energy are potentially deposited into the 2D material, and in this case, it is also possible that the measurements damage or degrade the sample quality. For instance, light induced sample damage has been reported when conducting Raman measurements on exfoliated flakes, even when using low powers (Sandilands et al., 2010; Kuo et al., 2016; Kim et al., 2019). So far, little is known about how such damage occurs or about the robustness of any protections against such effects.
In this work, we demonstrate the X-ray induced generation of ligand vacancies using a combination of resonant inelastic X-ray scattering (RIXS) and X-ray absorption spectroscopy (XAS) in two contemporary magnetic vdW materials, and -, including both bare and graphene capped -, each studied for their potentially unique 2D magnetism. has emerged as a highly promising material for studying the XY model in a real 2D system, while - is recognized as a prime candidate to host the long-sought Kitaev quantum spin-liquid state in 2D (Kim et al., 2019; Sarikurt et al., 2018; Kim et al., 2022). Prolonged exposure to intense X-ray beams that is necessary to carry out RIXS measurements was found to result in significant degradation of both samples.
The RIXS spectra of show transient multiplet excitations and a transition towards predominantly fluorescence-like excitations as a function of X-ray dosage, which is reflected in the disappearance of majority multiplet excitation peaks in the XAS spectra. On the other hand, degradation of - was only observed and characterized post RIXS measurements.
Post-irradiation EDS analysis of revealed a reduction in sulfur and phosphorus when compared to a pristine sample, and increased levels of chemisorbed oxygen. Additionally, Raman spectra of both materials were indistinguishable from the Si substrate apart from a tapering background. These results are consistent with X-ray induced ligand expulsion and a significant crystallographic reorganization. These results emphasize the requirement for developing more robust and specialzed sample protection techniques in light of the necessity for synchrotron based X-ray scattering to explore dispersive magnetic excitations in the 2D limit of exfoliated flakes, and especially for novel heterostructure devices.
2 Materials and methods
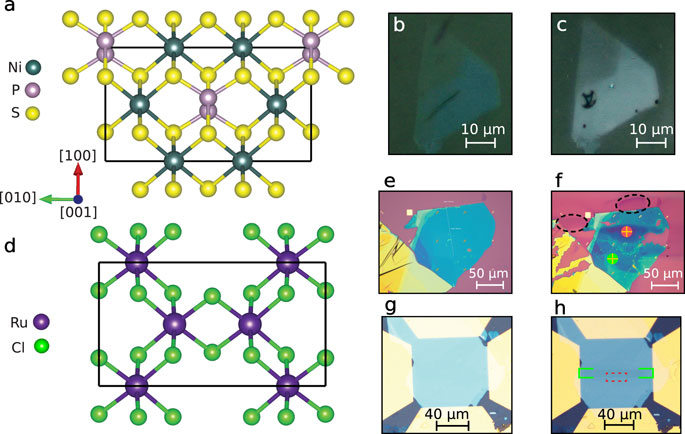
Single crystal samples of were grown by vapor transport, following previously published methods (Wildes et al., 2015; Lançon et al., 2018; DiScala et al., 2024; See supplementary material for details) (See Table. SI for more details). crystallizes in the monoclinic C2/m space group with Ni (S = 1) atoms on honeycomb lattices in the ab-planes. Each Ni atom is octahedrally coordinated by 6 S atoms, with P atoms situated between the 2D sheets of that form the vdW gap along the c-axis with an interlayer spacing of 0.636 nm (Kuo et al., 2016; Wildes et al., 2015). magnetically orders at a transition temperature of = 155 K, forming ferromagnetic zig-zag chains with moments parallel to the a-axis and antiferromagnetically coupled along the b-axis, along with a small out of plane component (Wildes et al., 2015; Wildes et al., 2022).
To prepare samples for RIXS measurements, bulk crystals were exfoliated using conventional scotch-tape methods (Kuo et al., 2016), deposited onto Polydimethylsiloxane (PDMS), and then transferred to Si substrates pre-patterned with Au fiducial markers, as seen in Supplementary Figure S1a. The Au fiducial markers provide a fluorescence contrast to the Si substrate that allows for unambiguous location of few layer samples whose signals were weak under an X-ray beam (DiScala et al., 2024; See supplementary material for details; Lupascu et al., 2012). Lastly, to protect from ambient air exposure, samples were coated with 3 nm thick using electron beam sputtering deposition. At this thickness, the capping layer is transparent to X-rays at the Ni L3 edge. Exfoliation and PDMS transfer were preformed in ambient air; within 1 hour of exfoliation, ideal samples were identified and transferred onto Si-substrates, then stored under vacuum and in an argon-filled glovebox until the capping layer was deposited. Post deposition, samples were returned to vacuum storage in an argon-filled glovebox. Optical contrast between sample and PDMS was used to determine sample layer count. The optical contrast on PDMS was determined using a combination of previously determined atomic-force microscope thickness measurements and optical contrast with substrate (DiScala et al., 2024). The thickness of the irradiated sample was determined to be 20 layers (L), or 12.72 nm.
To avoid stoichiometric variation between samples, pristine exfoliated samples used as a baseline for the various characterization techniques explored were exfoliated from the same bulk as the X-ray irradiated sample. These samples were prepared following the aforementioned exfoliation process, but then transferred onto Si/ substrates for further confirmation of sample thickness. Of these samples, one was left in air to test the effect of oxygen and water adsorption on exfoliated samples, while the other was kept under vacuum and stored in an argon-filled glovebox along with the X-ray irradiated sample; this latter sample was only removed from vacuum when measurements were taken, and immediately placed back under vacuum and in the glovebox afterwards.
- crystals were grown by the sublimation of powder sealed in a quartz tube under vacuum. About 1 g of powder was loaded in a quartz tube of 19 mm in outer diameter, 1.5 mm thick, and 10 cm long. The growth was performed in a box furnace. After dwelling at 1,060°C for 6 h, the furnace was cooled to 800°C at a rate of 4°C/h.
To prepare - samples for RIXS measurements, bulk crystals were exfoliated onto a Si/ substrate with pre-patterned Cr/Au alignment markers for easier optical identification of sample location. - flakes of varying thickness were characterized using optical contrast with the substrate as well as using atomic force microscopy.
To prepare graphene/- heterostructure (G/) samples, graphene films were transferred onto a Si/ substrate containing varying thicknesses of exfoliated and pre-characterized - crystals. The graphene films grown on Cu foils (Graphene Supermarket) were transferred using the conventional wet transfer method (Suk et al., 2011). The graphene was spin-coated with a thin layer of polymethyl methacrylate (495 PMMA A4 from Kayaku, 4,000 rpm, 1 min, bake at 180°C, 5 min) to provide mechanical support for the transfer. The backside graphene was removed by O2 plasma for a duration of 1 minute at 100 W. The PMMA/graphene was detached from the copper by placing the sample in copper etchant (Ammonium persulfate (NH4)2S2O8) for 2 h. After washing with DI water 3x, the floating PMMA/graphene layer was transferred to the Si/ substrate and dried in vacuum (1 Torr) overnight. Next, the sample was heated on a hot plate at 80°C for 20 min and 180°C for 20 min in an ambient environment. Finally, the sample was soaked in acetone for 30 min, rinsed with IPA, and dried with N2. All RuCl3 samples were prepared and characterized in air, with no additional precautions taken during the preparation of the G/ heterostructures with the wet transfer process due to the literature-reported stability of RuCl3 in air (Zhou et al., 2019). Raman after the wet-transfer process confirms that ambient oxygen and humidity did not affect the quality of either the bare RuCl3 or the G/ heterostructures, consistent with the findings in Refs. (Zhou et al., 2019; Breitner et al., 2023). While Breitner et al. perform heat treatment on RuCl3 in an inert environment, they demonstrate that clear signatures of sample degradation only appear for annealing temperatures beyond 300°C, temperatures which we do not approach in our sample preparation process.
All G/ heterostructure samples, and some of the - flakes, were coated with 10 nm thick , using atomic layer deposition in a Cambridge Nano Tech S200. Using electron beam lithography and evaporation, these samples were then patterned with Au markers, as shown in Figures 1e–h, for easier identification of sample location optically and with X-ray fluorescence, in addition to helping heat dissipate from the beam. To do so, samples were spun with a bilayer resist of 950k and 495k PMMA, at 50 nm and 200 nm, respectively. Electron beam exposure was done at 80 kV with a current of 10 nA, and the sample was subsequently developed in a 5°C solution of IPA: H2O (3:1). Cr/Au (3/50 nm) was then deposited, and the samples were subsequently immersed in acetone for metal lift-off. Samples were then stored at ambient pressure in a nitrogen-filled dry box.
RIXS and XAS measurements were carried out on the SIX 2-ID beamline of the National Synchrotron Light Source II (Dvorak et al., 2016). For , horizontal scattering geometry was set to and sample angle . RIXS spectra at Ni edge were collected in 20 min segments using linear vertical polarization with an 28.8 meV energy resolution (full width at half max, FWHM), after which XAS spectra were collected. Incident X-ray energies varied between 852.6–853.2 eV; with photons/s and a beam spot size of 15 m (H) x 1.7 m (V) (focused by an ellipsoidal mirror placed after the monochromator exit slit), resulting X-ray dosage at the Ni L3-edge is 8.3 J/m2s. Bulk spectra were collected with an identical scattering angle, but in specular geometry, and with an 55.1 meV overall energy resolution FWHM. Sample orientation and structure are shown in Figure 1a, with the c-axis along the direction of the incident beam. Microscope images of pre- and post-irradiation are shown in Figures 1b,c.
For -, horizontal scattering geometry was set to . RIXS spectra were collected for one and a half hours each at three incident energies across the Ru edge, using linear horizontal polarization, with 67 meV of energy resolution (full width at half max, FWHM). Incident X-ray energies varied between 460.7 and 465 eV; with photons/s and a projected beam spot size of 58 m (H) x 8.3 m (V) () and 20.2 m (H) x 8.3 m (V) (), resulting X-ray dosages at the Ru M3-edge are 1.58 J/m2s and 4.5 J/m2s, respectively. In the following, we will present the RIXS data taken at one excitation energy, coinciding with the maximum of the Ru edge. Sample orientation and structure are shown in Figure 1a, with the c-axis along the direction of the incident beam. Microscope images of - and G/, pre- and post-irradiation, are shown in Figures 1e–h.
For , Raman measurements were conducted on a pseudo-confocal Raman microscopy spectrometer (TriVista ) at room temperature in an Argon atmosphere, with an excitation wavelength of 633 nm, excitation power 1 mW, and spectrometer grating of 1,500 lines/mm. EDS measurements were conducted using a Thermo Scientific Quattro S using a 20 kV accelerating voltage. For -, Raman measurements were conducted using a Renishaw inVia micro-Raman spectrometer at room temperature in ambient air, with an excitation wavelength of 532 nm, excitation power 2 mW, and spectrometer grating of 1800 lines/mm.
3 Results
3.1 NiPS3
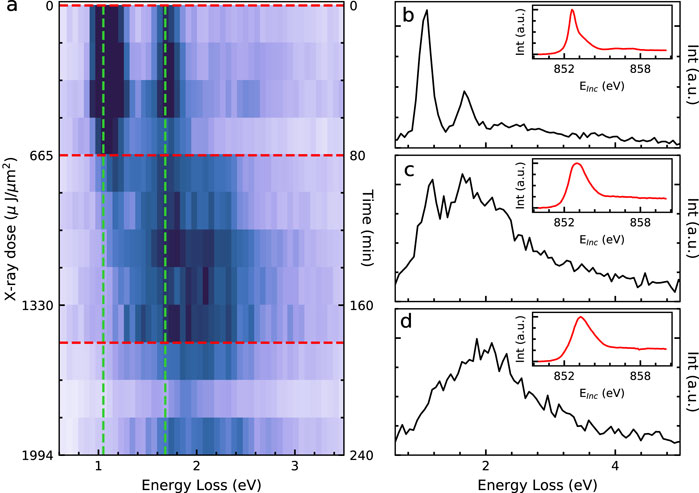
Figure 2A shows the evolution of the first two multiplet excitations, centered at = 1.05 eV and 1.68 eV respectively, as a function of X-ray beam dosage and exposure time. Figure 2b shows the characteristic RIXS spectrum at t = 0 min (), along with its respective XAS spectrum shown in the inset. These two multiplet excitations are clearly resolved up to t = 60 min (). At t = 80 min (Figure 2c) signatures of these two peaks can still be seen, however, superimposed by a large background. Additionally at this time, the XAS spectrum shows the first qualitative change, transitioning from a clear two-peak structure to a single peak, and shifting upwards in incident energy by 200 meV. As X-ray beam dosage increases, the two multiplet excitations vanish into the electron-hole continuum. Concurrently, the XAS peak continues to shift upward in incident energy, plateauing at 853.2 eV (Figure 2d). The full time evolution of RIXS and XAS are shown in the Supplementary Materials (Supplementary Figures S2–4) (See Supplementary Material for details).
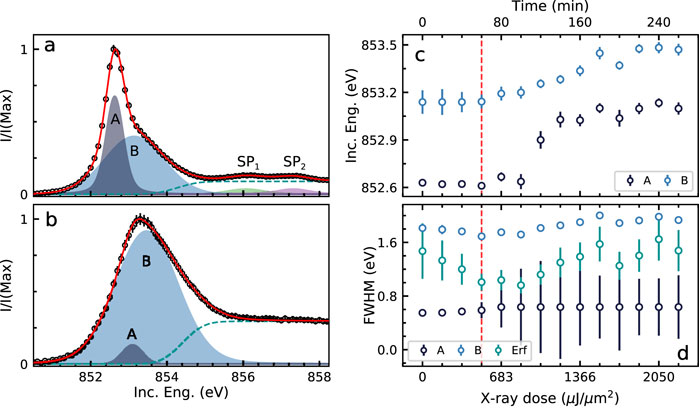
In order to elucidate the affect of prolonged X-ray beam exposure, we begin our analysis with the time/dosage dependent XAS signal. At we find that four Voigt profiles are required to fit the data, as shown in Figure 3a. The peaks labeled A and B correspond to the white-line, while and represent the satellite peaks (Kim et al., 2018; He et al., 2024). As X-ray beam exposure continues, both peaks A, , and decrease intensity, and after , and vanish into the background. Simultaneously, peak A nearly reached its minimum intensity and was significantly overlapped by the fit of peak B, causing the XAS to assume a seemingly one-peak structure (inset of Figures 2b,c and Figure 3b). However, from t , the best fits minimizing the residuals were still achieved with two peaks (Supplementary Figure S3). As seen in Figure 3c, from t = 0 260 min, peak A shifts upwards in incident energy by 470 40 meV. During the same time frame, peak B only shifts upwards in incident energy by 331 83 meV, with an average = 25 18 meV. Notably, the FWHM of peak B stayed fairly constant, averaging 1.85 0.01 eV across the full time range measured (Figure 3d). The change in FWHM of peak A, however, is not so readily gleaned after as discussed in the full fitting procedure found in the Supplementary Material (See supplementary material for details).
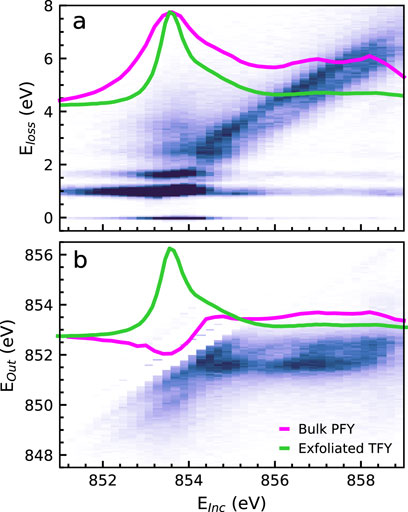
Using the bulk RIXS map, shown in Figure 4, we are able to disentangle the origin of each feature in the XAS. Figure 4a shows RIXS map function of incident energy () vs energy loss (). Features of constant are Raman-like excitations and have been previously characterized as multiplet excitations (DiScala et al., 2024; He et al., 2024), while the slopped features are fluorescence excitations (Ament et al., 2011). We then find great agreement between the exfoliated XAS at compared to the partial fluorescence yield (PFY), defined as the sum of values for each in the RIXS map. Figure 4b then shows the RIXS map as a function of vs outgoing energy (Eout) in order to highlight the constant outgoing energy of the fluorescence exciations. By subtracting the elastic line and first two multiplet excitations from the RIXS map in Figure 4b, we again compare the XAS and PFY and find that the majority of the intensity within the region of peak B is associated with fluorescence excitations.
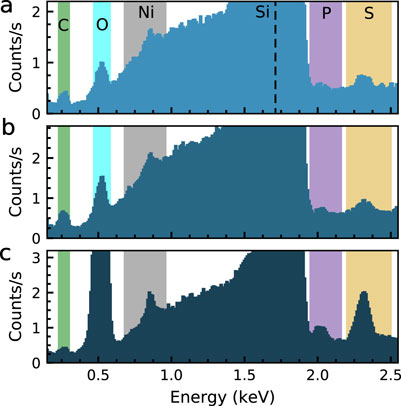
To better understand the effects of X-ray induced sample degradation, we performed a suite of sample characterization experiments and compared results with pristine flakes of comparable thickness. Figure 5 shows the elemental EDS mapping of the irradiated (Figure 5a) compared to a pristine sample (Figure 5c). The irradiated shows significantly less sulfur when compared to the pristine sample and, additionally, increased levels of carbon and oxygen. The oxygen is not associated with the substrate or capping layer, as evidenced by the EDS spectrum of the neighboring Si substrate, which showed lower oxygen levels than the sample and substrate combined (see Supplementary Figure S5 in (See Supplementary Material for details)). We note again that the pristine sample was exfoliated on an substrate, and thus, the oxygen in Figure 5c arises from the substrate alone. The presence of carbon on the sample can be explained by the outgassing of carbon from stainless steel in ultra-high vacuum (Calder and Lewin, 1967; Nevshupa and de Segovia, 2002; Ashraf et al., 2019). Physical adsorption of oxygen is a known source of contamination/degradation for a variety of exfoliated flakes (Li Q. et al., 2019). However, it has also been suggested that chemisorption of oxygen on exfoliated flakes is possible, especially in the presence of sulfur vacancies, albeit slow in ambient air (Grünleitner et al., 2022; Wu et al., 2021; Liu et al., 2016).
Although removal of adsorbed oxygen on the surface of exfoliated flakes is not widely reported, there is evidence suggesting high-vacuum annealing can expel this adsorbed oxygen (Grünleitner et al., 2022). Thus, we assessed the degree of oxygen passivization of sulfur vacancies through chemisorption on the irradiated sample via high-vacuum annealing at 120°C for 150 min. However, the elemental EDS mapping post-vacuum annealing did not show a reduced oxygen content (Figure 5b), suggestive of chemisorption of oxygen, rather than physical adsorption. By subtracting the EDS spectrum of the substrate alone, it is evident that the excess oxygen in the sample is not associated with capping layer. It is then likely that this oxygen originated from the short time frame of moving the sample from the ultra-high vacuum RIXS chamber to the vacuum desiccator; a normally slow process in ambient air sped up by the generation of sulfur vacancies.
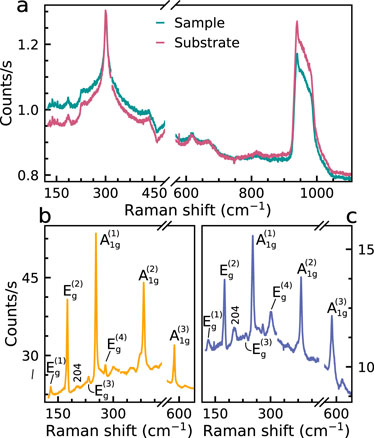
It is clear from the EDS analysis that the prolonged, high-flux X-ray beam exposure produced sulfur vacancies in exfoliated flakes of . Despite these vacancies, it is possible that the structure of stays somewhat intact (Grünleitner et al., 2022). We thus probe the structure of the irradiated sample using Raman spectroscopy with an excitation wavelength of 633 nm, again comparing to a pristine sample of comparable thickness. Figure 6a shows the Raman spectra of the irradiated sample, taken before high-vacuum annealing, which shows none of the Raman modes indicative of and appears indistinguishable from the Si substrate apart from a background shift that tapers off beyond the 520 Si peak. In contrast, Figure 6b shows the Raman spectrum for the pristine sample, where we clearly identify the previously reported 8 Raman-active phonon modes in (3 + 5), including the new peak at 204 that appears in thin exfoliated flakes (Kuo et al., 2016; Kim et al., 2019; Bernasconi et al., 1988). In addition, we find signals of amorphous carbon in the irradiated Raman spectra that is absent in the non-irradiated samples (Supplementary Figure S6a). Lastly, we tested the affect of physically adsorbed oxygen on the modulation of Raman modes in exfoliated . Figure 6c shows the Raman spectra of a five layer flake of left in ambient air for 3 weeks, where all previously reported Raman modes are identifiable. This result indicates that adsorbed oxygen is not responsible for the Raman mode suppression seen in the irradiated sample (Kuo et al., 2016).
3.2 α-RuCl3
The goal of the - measurements was to investigate the electronic evolution in - at the interface with graphene (Rizzo et al., 2020; Wang et al., 2020). A thin layer of - was preferred to enhance the contrast of the interface effect. Therefore, we first investigated several samples of - with variable thicknesses from, 100 nm (bulk) down to 7 nm, to explore possible changes in the electronic structure occurring due to the reduced number of layers (DiScala et al., 2024). For this step, we considered bare flakes of -, and flakes capped with and framed by gold markers. Next, we investigated heterostructures (G/) made by stacking -, graphene, and , ultimately framed by gold markers.
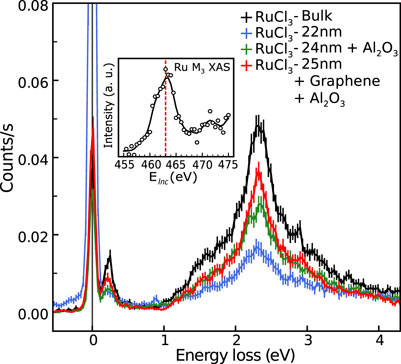
In Figure 7, we present the bulk Ru RIXS data compared to spectra obtained from - flakes of an intermediate thickness range (22–25 nm), chosen as a representative case. All spectra were measured with the same scattering geometry ( and ) and at the same excitation energy, main peak of the Ru XAS (see inset in Figure 7). The bulk RIXS spectrum is in good agreement with previous studies (Lebert et al., 2020). The RIXS spectrum measured on a 22 nm bare flake of - presents the overall same features observed in the bulk, but with reduced intensity and a strongly enhanced elastic line. The green and the red RIXS spectra in Figure 7 refer to the capped - flake (24 nm) and to the heterostructure - (25 nm)/graphene/, respectively. These spectra present similar intensity: they are weaker than the bulk signal, but stronger than the signal from the 22 nm flake. Their elastic lines are also comparable with the one from the bulk. The intensity variation obtained between these RIXS spectra opens the question whether the effect is intrinsic to the physics of the samples or caused by beam damage. For this reason, a post-characterization investigation was performed on all samples, including optical microscope images and Raman spectroscopy.
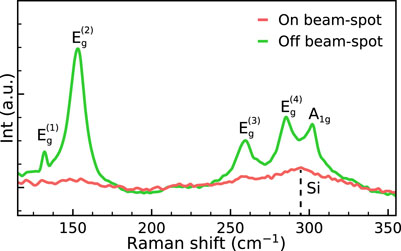
Post-irradiation characterization of bare - suggests that sample degradation due to X-ray beam exposure is remarkably similar to that of . The Raman spectra of irradiated - lacks any visible phonon modes indicative of - (Figure 8c). In contrast, the Raman spectra on the non-irradiated region of the sample retains the six characterizing phonon modes of - (Figure 8c) (Li G. et al., 2019). As was the case for irradiated sample, these results are indicative of a drastic structural reorganization of - due to irradiation. In addition, we find traces of amorphous carbon in the Raman spectra of bare -, on and off the beam-spot (Supplementary Figure S7b). The presence of amorphous carbon off the beam-spot originates from the X-ray beam rastering process used for sample localization.
Interestingly, signs of substrate damage can be seen when comparing the optical microscope images of bare - before (Figure 1e) and after irradiation (Figure 1f, black dashed circles). Optical contrast is a powerful tool to quickly and reliably determine the thickness of ultra-thin exfoliated flakes (Ivanova et al., 2024); a prerequisite of reliable optical contrast measurements is a nominally uniform layer beneath the sample. However, if irradiation alters the uniformity of the layer, then optical contrast would no longer be a reliable determinant of sample thickness.
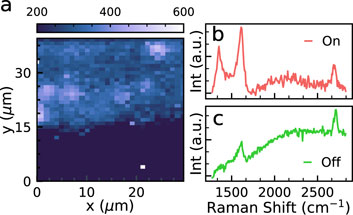
Similar optical indications of sample damage were seen on the G/ heterostructure, as displayed in Figure 1g (before) and Figure 1h (after, demarcated by green brackets). Herein, we explore the sample degradation of the graphene capping layer due to the prolonged irradiation. Figure 9c shows a spatial map of the carbon D-peak (1,350 ) fitted intensity extracted from Raman measurements. The mapped area is demarcated by a dashed red box in Figure 9b, and it spans across a beam irradiated area and a non-irradiated area. Figures 9d,e show characteristic Raman spectra measured on and off the irradiated region, respectively. Both spectra display characteristic graphene peaks, the G-peak (1,580 ) and the 2D-peak (2,690 ); whereas the D-peak is only visible in the spectra collected within the irradiated area (Figure 9d) and is a fingerprint of amorphous carbon (Saito et al., 2011). Additionally, fitting the intensity of the G-peak and 2D-peak across the scanned area resulted in an intensity ratio of (I2D/IG) two in the non-irradiated region and a ratio of 0.5 in the irradiated region: this ratio is representative of low and high levels of disorder in graphene, respectively (Saito et al., 2011; Kim et al., 2009).
4 Discussion
The EDS analysis on clearly indicates the expulsion of sulfur and phosphorus due to X-ray beam exposure. Yet, simply creating ligand vacancies does not tell the complete story of the extent of sample degradation. Ligand vacancies are naturally present in exfoliated samples, however the transience of multiplet excitations in the RIXS spectra, and the majority multiplet peaks in the XAS spectra (A, ,) are indicative of a more severe structural reorganization. Density functional theory (DFT) calculations on with 5% sulfur vacancies found drastic crystallographic and electronic structure changes (Wu et al., 2021). In fact, the calculated DOS of monolayer shows two new states; one of mostly S-3p character just below EF, and one of Ni-3d character in the energy gap above EF. These results are consistent with our RIXS spectra which showed progressively favorable fluorescence excitations with increasing sulfur vacancy generation.
The Raman spectra on the irradiated sample further substantiate the claim of drastic crystallographic structure changes due to ligand vacancies. The lack of visible phonon modes associated with , and the large tapering background that the Si modes sit atop, are suggestive of a disordered system with decoherent modes. In pristine , the modes below 220 are dominated by Ni-S, Ni-P, S-S, S-P, and P-P bond bending, while modes above 300 are mostly associated with intra-molecular vibrations from the (P4S6)4- bipyramid (Kim et al., 2019; Bernasconi et al., 1988). While small amounts of sulfur vacancies may lead to modulations in the (P4S6)4- bipyramidal dominant modes, the absence of the lower bond bending dominant modes is again indicative of a more severe structural reorganization.
The connection between the adsorbed oxygen and the absence of visible Raman modes, however, is still not fully understood. C.-T. Kuo et al. have shown that, for a three layer flake of left in air for 11 days, only remnants of the and modes are visible (Kuo et al., 2016), implying that adsorbed oxygen has a destructive affect on the modulation of sulfur planes and of the nickel atoms. However, when measuring the Raman spectra of a five layer flake of left in air for 3 weeks, we are still able to clearly resolve all reported Raman modes.
For the case of -, the Raman spectra of the irradiated bare flake show no visible phonon modes associated with crystalline -, suggesting similar sample damage as was characterized in . Additionally, the spatial D-peak Raman intensity map of G/ clearly depicts a departure from ordered graphene outside of the irradiated region, to disordered graphene, or amorphous carbon, within. The change in I2D/IG across the boundary of the irradiation region is further indicative of this departure. As previously mentioned, the outgassing of carbon from stainless steel in ultra-high vacuum is a commonly known phenomenon. Thus, a portion of the amorphous carbon within the irradiated area originated from the outgassing process, while the remainder was generated from the irradiation of the original ordered graphene. However, as no signatures of amorphous carbon were observed in the Raman spectra outside the irradiated region, it is reasonable to assume that most of the amorphous carbon observed within the irradiated region originates from the structural disorder of the graphene caused by the X-ray beam exposure. Based on this evidence, the RIXS spectra measured on the thin - samples were considered non-representative of the pristine systems. Although there was no post-characterization performed on the capped - flake, the fact that its RIXS spectrum overlapped well with that of the clearly damaged G/ heterostructure brings into question the - RIXS measurement quality as well.
The stability of exfoliated flakes is in general quantified by the materials defect generation energy (DGE), often calculated using DFT. (Wu et al., 2021; Hu et al.; Yang et al., 2023). capping layers have proven an effective passivization method to prevent oxidation in ambient conditions for a variety of vdW materials (Li Q. et al., 2019; Geiwitz et al., 2024). However, up to 10 nm of was unable to prevent sample damage during X-ray beam exposure. Thus, calculations detailing the changes in the DGE of various multilayer/capping layer systems are desirable as they can provide a means of testing various capping layers prior to experimentation.
In summary, we characterized the means of sample degradation due to high-flux synchrotron based X-ray scattering on two contemporary vdW materials, and -. RIXS and XAS measurements of showed transient multiplet excitations as a function of X-ray dosage, while EDS and Raman confirmed the expulsion of sulfur and structural reorganization. Although EDS measurements of post-irradiation - is needed to conclusively determine ligand expulsion as the exact means of sample damage, the remarkably similar Raman spectra of - and post-irradiation suggests a consistent degradation route. These results emphasize the necessity for more robust protection techniques for 2D exfoliated flakes beyond ambient conditions, else the novel magnetic prospects these, and other magnetic vdW materials offer will remain unrealized. In addition, we showed evidence of local graphene amorphousization in the irradiated region of G/. This finding is significant for future synchrotron experiments on graphene-based heterostructures, as the structural integrity of graphene is crucial for preserving the emergent phenomenon of these systems. More broadly, our work should stimulate systematic pre- and post-characterization methods of samples, especially when the thickness is reduced and when high-brilliance X-ray sources are used, including X-ray free electron lasers.
Data availability statement
The raw data supporting the conclusions of this article will be made available by the authors, without undue reservation.
Author contributions
MD: Conceptualization, Data curation, Formal Analysis, Investigation, Methodology, Supervision, Visualization, Writing – original draft, Writing – review and editing. VH: Data curation, Formal Analysis, Methodology, Writing – review and editing. BJ: Data curation, Formal Analysis, Methodology, Writing – review and editing. YG: Data curation, Formal Analysis, Writing – review and editing. DR: Data curation, Writing – review and editing. JA: Data curation, Writing – review and editing. XY: Data curation, Writing – review and editing. QW: Data curation, Writing – review and editing. MK: Data curation, Writing – review and editing. TK: Data curation, Formal Analysis, Writing – review and editing. MG: Methodology, Supervision, Validation, Writing – review and editing. GN: Methodology, Supervision, Writing – review and editing. JP: Investigation, Methodology, Supervision, Writing – review and editing. JH: Funding acquisition, Project administration, Resources, Supervision, Writing – review and editing. KB: Funding acquisition, Project administration, Resources, Supervision, Writing – review and editing. DB: Funding acquisition, Project administration, Resources, Supervision, Writing – review and editing. CD: Funding acquisition, Project administration, Resources, Supervision, Writing – review and editing. VBi: Conceptualization, Data curation, Formal Analysis, Funding acquisition, Investigation, Methodology, Project administration, Resources, Supervision, Writing – review and editing. KP: Conceptualization, Funding acquisition, Investigation, Project administration, Resources, Supervision, Writing – review and editing.
Funding
The author(s) declare that financial support was received for the research and/or publication of this article. Work at Brown University was supported by the National Science Foundation under Grant No. 2429695. The work on - was supported as part of Programmable Quantum Materials, an Energy Frontier Research Center funded by the U.S. Department of Energy (DOE), Office of Science, Basic Energy Sciences (BES), under award DE-SC0019443. This research uses the beamline 2-ID of the National Synchrotron Light Source II, a DOE Office of Science User Facility operated for the DOE Office of Science by Brookhaven National Laboratory under Contract No. DE-SC0012704. The work of GN was supported by the National Science Foundation (NSF) EPMD program via Grant No. EPMD-2211334. MGe acknowledges the primary support of the U.S. department of energy (DOE), Office of Science, Office of Basic energy Sciences under award number DE-SC0018675. K.S.B acknowledges support by the Air Force Office of Scientific Research under award number FA2386-24-1-4071.
Acknowledgments
We thank Matthias Kuehne for providing access to their Raman spectroscopy equipment and for their assistance during data collection.
Conflict of interest
The authors declare that the research was conducted in the absence of any commercial or financial relationships that could be construed as a potential conflict of interest.
Generative AI statement
The author(s) declare that no Generative AI was used in the creation of this manuscript.
Publisher’s note
All claims expressed in this article are solely those of the authors and do not necessarily represent those of their affiliated organizations, or those of the publisher, the editors and the reviewers. Any product that may be evaluated in this article, or claim that may be made by its manufacturer, is not guaranteed or endorsed by the publisher.
Supplementary material
The Supplementary Material for this article can be found online at: https://www.frontiersin.org/articles/10.3389/femat.2025.1572940/full#supplementary-material
References
Ahn, Y., Guo, X., Son, S., Sun, Z., and Zhao, L. (2024). Progress and prospects in two-dimensional magnetism of van der Waals materials. Prog. Quantum Electron. 93, 100498. doi:10.1016/j.pquantelec.2024.100498
CrossRef Full Text | Google Scholar
Ament, L. J. P., van Veenendaal, M., Devereaux, T. P., Hill, J. P., and van den Brink, J. (2011). Resonant inelastic x-ray scattering studies of elementary excitations. Rev. Mod. Phys. 83 (2), 705–767. doi:10.1103/RevModPhys.83.705
CrossRef Full Text | Google Scholar
Ashraf, A., Mehmood, M., and Janjua, S. A. (2019). Study of ultra-high-vacuum properties of carbon-coated stainless steel beam pipes for high-energy particle accelerators. Arab. J. Sci. Eng. 44 (7), 6593–6600. doi:10.1007/s13369-019-03761-6
CrossRef Full Text | Google Scholar
Bernasconi, M., Marra, G. L., Benedek, G., Miglio, L., Jouanne, M., Julien, C., et al. (1988). Lattice dynamics of layered MPX3(M=Mn,Fe,Ni,Zn; X=S,Se) compounds. Phys. Rev. B 38 (17), 12089–12099. doi:10.1103/PhysRevB.38.12089
PubMed Abstract | CrossRef Full Text | Google Scholar
Breitner, F. A., Jesche, A., Tsurkan, V., and Gegenwart, P. (2023). Thermal decomposition of the Kitaev material α-RuCl3 and its influence on low-temperature behavior. Phys. Rev. B 108 (4), 045103. doi:10.1103/physrevb.108.045103
CrossRef Full Text | Google Scholar
Calder, R., and Lewin, G. (1967). Reduction of stainless-steel outgassing in ultra-high vacuum. Br. J. Appl. Phys. 18 (10), 1459–1472. doi:10.1088/0508-3443/18/10/313
CrossRef Full Text | Google Scholar
DiScala, M. F., Staros, D., de la Torre, A., Lopez, A., Wong, D., Schulz, C., et al. (2024). Elucidating the Role of Dimensionality on the Electronic Structure of the Van der Waals Antiferromagnet NiPS3. Adv. Phys. Res. n/a 3 (n/a), 2300096. doi:10.1002/apxr.202300096
CrossRef Full Text | Google Scholar
Dvorak, J., Jarrige, I., Bisogni, V., Coburn, S., and Leonhardt, W. (2016). Towards 10 meV resolution: the design of an ultrahigh resolution soft X-ray RIXS spectrometer. Rev. Sci. Instrum. 87 (11), 115109. doi:10.1063/1.4964847
PubMed Abstract | CrossRef Full Text | Google Scholar
Geiwitz, M., Page, O. R., Marello, T., Nichols, M. E., Kumar, N., Hummel, S., et al. (2024). Graphene multiplexed sensor for point-of-need viral wastewater-based epidemiology. ACS Appl. Bio Mater. 7 (7), 4622–4632. doi:10.1021/acsabm.4c00484
PubMed Abstract | CrossRef Full Text | Google Scholar
Gong, C., Li, L., Li, Z., Ji, H., Stern, A., Xia, Y., et al. (2017). Discovery of intrinsic ferromagnetism in two-dimensional van der Waals crystals. Nature 546 (7657), 265–269. doi:10.1038/nature22060
PubMed Abstract | CrossRef Full Text | Google Scholar
Grünleitner, T., Henning, A., Bissolo, M., Zengerle, M., Gregoratti, L., Amati, M., et al. (2022). Real-time investigation of sulfur vacancy generation and passivation in monolayer molybdenum disulfide via in situ X-ray photoelectron spectromicroscopy. ACS Nano 16 (12), 20364–20375. doi:10.1021/acsnano.2c06317
PubMed Abstract | CrossRef Full Text | Google Scholar
He, W., Shen, Y., Wohlfeld, K., Sears, J., Li, J., Pelliciari, J., et al. (2024). Magnetically propagating Hund’s exciton in van der Waals antiferromagnet NiPS3. Nat. Commun. 15 (1), 3496. doi:10.1038/s41467-024-47852-x
PubMed Abstract | CrossRef Full Text | Google Scholar
Hellman, F., Hoffmann, A., Tserkovnyak, Y., Beach, G. y. S. D., Fullerton, E. E., Leighton, C., et al. (2017). Interface-induced phenomena in magnetism. Rev. Mod. Phys. 89 (2), 025006. doi:10.1103/RevModPhys.89.025006
PubMed Abstract | CrossRef Full Text | Google Scholar
Hu, J., Zhang, Y., Law, M., and Wu, R. (2012). First-principles studies of the electronic properties of native and substitutional anionic defects in bulk iron pyrite. Phys. Rev. B 85 (8), 085203. doi:10.1103/PhysRevB.85.085203
CrossRef Full Text | Google Scholar
Ivanova, T. V., Andres-Penares, D., Wang, Y., Yan, J., Forbes, D., Ozdemir, S., et al. (2024). Optical contrast analysis of α-RuCl3 nanoflakes on oxidized silicon wafers. Apl. Mater. 12 (7). doi:10.1063/5.0212132
CrossRef Full Text | Google Scholar
Kim, D. C., Jeon, D.-Y., Chung, H.-J., Woo, Y. S., Shin, J. K., and Seo, S. (2009). The structural and electrical evolution of graphene by oxygen plasma-induced disorder. Nanotechnology 20 (37), 375703. doi:10.1088/0957-4484/20/37/375703
PubMed Abstract | CrossRef Full Text | Google Scholar
Kim, K., Lim, S. Y., Lee, J.-U., Lee, S., Kim, T. Y., Park, K., et al. (2019). Suppression of magnetic ordering in XXZ-type antiferromagnetic monolayer NiPS3. Nat. Commun. 10 (1), 345. doi:10.1038/s41467-018-08284-6
PubMed Abstract | CrossRef Full Text | Google Scholar
Kim, S., Yuan, B., and Kim, Y.-J. (2022). α-RuCl3 and other Kitaev materials. Apl. Mater. 10 (8), 080903. doi:10.1063/5.0101512
CrossRef Full Text | Google Scholar
Kim, S. Y., Kim, T. Y., Sandilands, L. J., Sinn, S., Lee, M.-C., Son, J., et al. (2018). Charge-Spin Correlation in van der Waals Antiferromagnet NiPS3. Phys. Rev. Lett. 120 (13), 136402. doi:10.1103/PhysRevLett.120.136402
PubMed Abstract | CrossRef Full Text | Google Scholar
Kuo, C.-T., Neumann, M., Balamurugan, K., Park, H. J., Kang, S., Shiu, H. W., et al. (2016). Exfoliation and Raman Spectroscopic Fingerprint of Few-Layer NiPS3 Van der Waals Crystals. Sci. Rep. 6 (1), 20904. doi:10.1038/srep20904
PubMed Abstract | CrossRef Full Text | Google Scholar
Lançon, D., Ewings, R. A., Guidi, T., Formisano, F., and Wildes, A. R. (2018). Magnetic exchange parameters and anisotropy of the quasi-two-dimensional antiferromagnet NiPS3. Phys. Rev. B 98 (13), 134414. doi:10.1103/PhysRevB.98.134414
CrossRef Full Text | Google Scholar
Lebert, B. W., Kim, S., Bisogni, V., Jarrige, I., Barbour, A. M., and Kim, Y.-J. (2020). Resonant inelastic x-ray scattering study of α-RuCl3: a progress report. J. Phys. Condens. Matter 32 (14), 144001. doi:10.1088/1361-648X/ab5595
PubMed Abstract | CrossRef Full Text | Google Scholar
Li, G., Chen, X., Gan, Y., Li, F., Yan, M., Ye, F., et al. (2019b). Raman spectroscopy evidence for dimerization and Mott collapse in α - RuCl3 under pressures. Phys. Rev. Mater. 3 (2), 023601. doi:10.1103/PhysRevMaterials.3.023601
CrossRef Full Text | Google Scholar
Li, Q., Zhou, Q., Shi, L., Chen, Q., and Wang, J. (2019a). Recent advances in oxidation and degradation mechanisms of ultrathin 2D materials under ambient conditions and their passivation strategies. J. Mater. Chem. A 7 (9), 4291–4312. doi:10.1039/C8TA10306B
CrossRef Full Text | Google Scholar
Liu, Y., Stradins, P., and Wei, S.-H. (2016). Air passivation of chalcogen vacancies in two-dimensional semiconductors. Angew. Chem. 128 (3), 977–980. doi:10.1002/ange.201508828
CrossRef Full Text | Google Scholar
Lupascu, A., Feng, R., Sandilands, L. J., Nie, Z., Baydina, V., Gu, G., et al. (2012). Structural study of Bi2Sr2CaCu2Oδ exfoliated nanocrystals. Appl. Phys. Lett. 101 (22), 223106. doi:10.1063/1.4768234
CrossRef Full Text | Google Scholar
Nevshupa, R. A., and de Segovia, J. L. (2002). Outgassing from stainless steel under impact in UHV. Vacuum 64 (3), 425–430. doi:10.1016/S0042-207X(01)00345-1
CrossRef Full Text | Google Scholar
Park, J.-G. (2016). Opportunities and challenges of 2D magnetic van der Waals materials: Magnetic graphene? J. Phys. Condens. Matter 28 (30), 301001. doi:10.1088/0953-8984/28/30/301001
PubMed Abstract | CrossRef Full Text | Google Scholar
Rizzo, D. J., Jessen, B. S., Sun, Z., Ruta, F. L., Zhang, J., Yan, J.-Q., et al. (2020). Charge-transfer plasmon polaritons at graphene/α-RuCl3 interfaces. Nano Lett. 20 (12), 8438–8445. doi:10.1021/acs.nanolett.0c03466
PubMed Abstract | CrossRef Full Text | Google Scholar
Saito, R., Hofmann, M., Dresselhaus, G., Jorio, A., and Dresselhaus, M. S. (2011). Raman spectroscopy of graphene and carbon nanotubes. Adv. Phys. 60 (3), 413–550. doi:10.1080/00018732.2011.582251
CrossRef Full Text | Google Scholar
Sandilands, L. J., Shen, J. X., Chugunov, G. M., Zhao, S. Y. F., Ono, S., Ando, Y., et al. (2010). Stability of exfoliated Bi2Sr2DyxCa1−xCu2O8+δ studied by Raman microscopy. Phys. Rev. B 82 (6), 064503. doi:10.1103/PhysRevB.82.064503
CrossRef Full Text | Google Scholar
Sarikurt, S., Kadioglu, Y., Ersan, F., Vatansever, E., Üzengi Aktürk, O., Yüksel, Y., et al. (2018). Electronic and magnetic properties of monolayer α-RuCl3: a first-principles and Monte Carlo study. Phys. Chem. Chem. Phys. 20 (2), 997–1004. doi:10.1039/C7CP07953B
PubMed Abstract | CrossRef Full Text | Google Scholar
Sivadas, N., Okamoto, S., Xu, X., Fennie, C. J., and Xiao, D. (2018). Stacking-dependent magnetism in bilayer CrI 3. Nano Lett. 18 (12), 7658–7664. doi:10.1021/acs.nanolett.8b03321
PubMed Abstract | CrossRef Full Text | Google Scholar
Suk, J. W., Kitt, A., Magnuson, C. W., Hao, Y., Ahmed, S., An, J., et al. (2011). Transfer of CVD-grown monolayer graphene onto arbitrary substrates. ACS Nano 5 (9), 6916–6924. doi:10.1021/nn201207c
PubMed Abstract | CrossRef Full Text | Google Scholar
Tang, Y., Su, K., Li, L., Xu, Y., Liu, S., Watanabe, K., et al. (2023). Evidence of frustrated magnetic interactions in a Wigner–Mott insulator. Nat. Nanotechnol. 18, 233–237. doi:10.1038/s41565-022-01309-8
PubMed Abstract | CrossRef Full Text | Google Scholar
Wang, Y., Balgley, J., Gerber, E., Gray, M., Kumar, N., Lu, X., et al. (2020). Modulation doping via a two-dimensional atomic crystalline acceptor. Nano Lett. 20 (12), 8446–8452. doi:10.1021/acs.nanolett.0c03493
PubMed Abstract | CrossRef Full Text | Google Scholar
Wildes, A. R., Simonet, V., Ressouche, E., McIntyre, G. J., Avdeev, M., Suard, E., et al. (2015). Magnetic structure of the quasi-two-dimensional antiferromagnet NiPS 3. Phys. Rev. B 92 (22), 224408. doi:10.1103/PhysRevB.92.224408
CrossRef Full Text | Google Scholar
Wildes, A. R., Stewart, J. R., Le, M. D., Ewings, R. A., Rule, K. C., Deng, G., et al. (2022). Magnetic dynamics of NiPS3. Phys. Rev. B 106 (17), 174422. doi:10.1103/PhysRevB.106.174422
CrossRef Full Text | Google Scholar
Wu, Z., Xu, S., Zhou, Y., Guo, Q., Dedkov, Y., and Voloshina, E. (2021). Adsorption of water molecules on pristine and defective NiPX3 (X: S, Se) monolayers. Adv. Theory Simulations 4 (11), 2100182. doi:10.1002/adts.202100182
CrossRef Full Text | Google Scholar
Yang, W., Zhu, L., Lu, Y., Henriksen, E., and Yang, L. (2023). Point defects in two-dimensional RuCl3. Phys. Rev. Mater. 7 (6), 064004. doi:10.1103/PhysRevMaterials.7.064004
CrossRef Full Text | Google Scholar
Zhou, B., Wang, Y., Osterhoudt, G. B., Lampen-Kelley, P., Mandrus, D., He, R., et al. (2019). Possible structural transformation and enhanced magnetic fluctuations in exfoliated α-RuCl3. J. Phys. Chem. Solids 128, 291–295. doi:10.1016/j.jpcs.2018.01.026
CrossRef Full Text | Google Scholar
 M. F. DiScala1
 V. Hsieh2
 B. S. Jessen2
 Y. Gu3
 Q. Wang1
 J. Pelliciari3
 K. W. Plumb1*