 Julie J. H. Nati1*
 Charles Rodde1,2,3
 Felipe R. Blasco4,5Germain Salou1
 Alain Vergnet1
 Hugues de Verdal2,6
 Marc Vandeputte1François Allal1
 David J. McKenzie7*
- 1UMR Marbec, Université Montpellier, Ifremer, INRAE, CNRS, IRD, Palavas-les-Flots, France
- 2ISEM, Université Montpellier, CIRAD, CNRS, EPHE, IRD, Montpellier, France
- 3Worldfish, Bayan Lepas, Penang, Malaysia
- 4Department of Physiological Sciences, Federal University of São Carlos, São Carlos, SP, Brazil
- 5Joint Graduate Program in Physiological Sciences, Federal University of São Carlos—UFSCar/São Paulo State University, UNESP Campus Araraquara, Araraquara, SP, Brazil
- 6AGAP Institut, Université Montpellier, CIRAD, INRAE, Institut Agro, Montpellier, France
- 7UMR Marbec, Université Montpellier, CNRS, Ifremer, IRD, INRAE, Montpellier, France
We compared tolerance of acute progressive hypoxia and warming in the three recognized populations of European seabass, Atlantic (AT), West Mediterranean (WM) and East Mediterranean (EM), that have evolved within a North-West to South-East thermal gradient, from AT to EM. We reared progeny of captive broodstock in common garden at two temperatures, 18 and 24°C, representing summer temperatures in Atlantic and East Mediterranean, respectively. At about 1 year of age, hypoxia tolerance was evaluated with static respirometry, as critical saturation for regulation of standard metabolic rate (Scrit) and regulation index (RI); while warming tolerance was evaluated by swimming respirometry, as critical thermal maximum for aerobic swimming (CTSmax). We expected AT fish systematically to be least tolerant and EM most, with WM intermediate. At 18°C, the tolerance traits were similar among populations, but they responded differently when reared at 24°C. In AT and WM, Scrit increased—tolerance declined—from 18 to 24°C, whereas in EM it did not change. In AT and WM, RI did not change from 18 to 24°C whereas in EM it increased—tolerance increased, and EM had higher RI than WM at 24°C. In AT and EM, CTSmax was similar at 18 and 24°C whereas in WM it increased—tolerance increased, and WM had higher CTSmax than AT and EM at 24°C. Therefore, the EM population is able to avoid negative effects of warmer water on hypoxia tolerance, compared to AT and WM, but this was not related to improved thermal tolerance at the warmer temperature, where WM performed better than AT and EM. Consequently, the seabass exhibits inter-populational variation in tolerance of the stressors but patterns are complex and not consistent between hypoxia and warming. We explored some potential patterns of inter-individual variation in tolerance. We found no evidence that individuals relatively tolerant of hypoxia (low Scrit, high RI) were also relatively tolerant of warming (high CTSmax). There was evidence of complex relationships with body mass, whereby tolerance of warming declined with increasing mass at 18°C but tolerance of hypoxia increased with mass at 24°C. Finally, the traits of tolerance were not dependent on individual standard metabolic rate at either temperature.
1 Introduction
Fishes are an important component of human food security, provided by fisheries but also, increasingly, by aquaculture (1). Human-induced rapid environmental change (HIREC) is having profound effects on aquatic ecosystems globally, with poorly known consequences for wild and farmed fish populations. In aquatic habitats, there are two prominent elements of HIREC that can pose major physiological challenges to fish populations. It has been argued that the major threat is hypoxic episodes triggered by ongoing climate warming, nutrient pollution and changes in the water cycle (2–4). A further threat is the extreme summer heatwaves associated with the warming (5–7). Although hypoxic events and heatwaves can occur naturally in aquatic habitats, they are now increasing in frequency, intensity and duration across the globe (3, 6). It is important, therefore, to increase our understanding of the capacity of fish species and populations to tolerate these environmental stressors.
The European seabass Dicentrarchus labrax is a temperate coastal fish whose range extends from Norway to Senegal in the eastern Atlantic, and the entire Mediterranean (8). It is highly prized by commercial and sports fishermen, with the Atlantic the main area for fisheries, but it is also a key species in Mediterranean coastal and lagoon cage mariculture (72). Coastal and transitional ecosystems are particularly threatened by hypoxia and heatwaves (2, 9), and the Mediterranean is a climate change hotspot (10, 11), so it is valuable to investigate how well D. labrax tolerates hypoxia and warming. In fact, the effects of dissolved oxygen and temperature on the seabass, and the species' physiological responses to these environmental factors, have been studied relatively extensively [e.g., (12–18)]. Tolerance thresholds for progressive hypoxia and acute warming have been evaluated using loss of equilibrium (LOE) as an endpoint, in an incipient lethal oxygen saturation (ILOS) protocol or a critical thermal maximum (CTmax) protocol [e.g., (19, 20)].
However, none of these studies reported which European seabass population was under investigation. Three genetically distinguishable populations of European seabass exist across its geographical range: Atlantic (AT), West Mediterranean (WM) and East Mediterranean (EM) (8, 21). They started to diverge ~300,000 years ago (22, 23) in environments whose temperatures differed along a North-West to South-East gradient, from AT to EM (24). It is conceivable that the populations might now differ in their tolerance of temperature, due to processes of local adaptation (25, 26). At the same time, they may also exhibit differences in tolerance of hypoxia, if hypoxic episodes naturally occur less frequently in coastal areas of the cooler oceanic Atlantic compared to the warmer Eastern Mediterranean basin.
Acute hypoxia and warming may share a common physiological mode of action in fishes, because both stressors challenge the capacity of the cardiorespiratory system to provide sufficient O2 to respiring tissues. In hypoxia because availability falls, in warming because demand increases (27–29). This has stimulated research into whether tolerance of the two stressors is systematically interrelated, whereby tolerance of hypoxia is positively correlated to tolerance of warming. This has been investigated at the level of species (30), populations (31), and individuals within species (19, 20, 32–36). These studies mostly measured tolerance using ILOS and CTmax protocols and, although there was evidence of correlations at the level of species (30) and populations (31), there is very little evidence that inter-individual variation in tolerance of the two stressors was correlated (19, 20, 32, 34–36). This may, however, be because LOE occurs for different reasons at ILOS and CTmax (27, 34, 36, 37).
Sub-lethal protocols have been used to investigate correlations of individual tolerance of hypoxia and warming in fishes. In a tropical freshwater teleost, the Paranà pacu Piaractus mesopotamicus, there was a significant correlation between two measures of hypoxia tolerance, the critical oxygen saturation (Scrit) and the regulation index (RI), and the critical thermal maximum for aerobic swimming (CTSmax) (32). The Scrit and RI use static respirometry to evaluate the capacity of the cardiorespiratory system to regulate O2 uptake unchanged from normoxic rates, as water O2 availability diminishes in progressive hypoxia (38–41). The CTSmax uses fatigue from sustained exercise as endpoint when the fish is heated incrementally in a swim tunnel respirometer. Fatigue is attributed to an inability of the cardiorespiratory system to raise oxygen uptake and meet the combined oxygen demands of swimming plus the inexorable warming (42–45). A correlation among the sublethal traits may indicate that tolerance shares common physiological mechanisms but further work is needed on more fish species.
There has also been interest in evaluating whether body mass is significant for individual tolerance of hypoxia and warming in fishes, to gain insight into whether climate change impacts might be mass-dependent. Various studies have found that Scrit and RI are influenced by body mass although there is no clear consensus about the direction of effects, whereas there is evidence that CTSmax declines with increasing mass (32, 43, 46–51). It is also interesting to investigate whether individual Scrit, RI, and CTSmax depend on the magnitude of an individual's standard metabolic rate (SMR, an ectotherm's basal metabolic rate at their acclimation temperature). Basal oxygen demand could affect an individual's capacity to assure supply in progressive hypoxia and there is evidence that European seabass with low SMR have higher CTmax (49, 52, 53).
Given that European seabass farming is in coastal areas and transitional ecosystems such as lagoons, which are particularly susceptible to hypoxic events and heatwaves, it is valuable to understand whether the populations may differ in their tolerance of sublethal hypoxic and thermal stress, as this may have implications for selecting broodstock for fish to be farmed in different areas of Europe. Understanding patterns of individual variation in tolerance of sublethal hypoxia and warming in the seabass can not only extend the knowledge base for fishes in general, but can also be a useful first step toward selection programs for improved tolerance in the species' farmed populations.
In this study we investigated Hypothesis 1 that the three seabass populations would differ in their tolerance of progressive hypoxia and acute warming, evaluated as Scrit, RI and CTSmax, with the AT population being less tolerant than EM, and WM intermediate. Fish were reared in common garden at two constant temperatures, 18 and 24°C, which represent summer temperatures in AT and EM, respectively (54, 55). Differences in tolerance among populations at a common temperature can therefore be attributed to local adaptation, whereas differences in tolerance across temperatures provide insight into populational plasticity in tolerance (56). We then evaluated the patterns of individual tolerance within populations at each acclimation temperature, with the Hypothesis 2 that individuals relatively tolerant of hypoxia were also relatively tolerant of warming. The final objective was to explore whether individual tolerance was related to body mass and SMR in the seabass, considering data at an overall species level.
2 Materials and methods
2.1 Animals
Experiments were performed on 120 seabass from the three populations, that were produced by artificial fertilization of captive broodstock and reared at the Ifremer marine research platform in Palavas-les-Flots (Occitania, France) as described in detail by Rodde et al. (54, 55). All fish were PIT-tagged for individual identification (Biolog-id, www.biolog-id.com) and, after experimentation for their individual feed efficiency at 18 and 24°C in a separate study (55), they were grouped into two tanks (vol. 1,000 L) supplied with biofiltered water at either 18°C (18 AT, 19 WM, and 25 EM) or 24°C (14 AT, 17 WM, and 27 EM) and a constant photoperiod of 12:12, for a minimum of 12 weeks prior to any further experimentation, during which time they were fed a commercial feed ad libitum by self-feeder (54).
2.2 Measures of oxygen uptake and determination of Scrit and RI by static respirometry
Static respirometry was performed as described in Rodde et al. (54). Briefly, 1 week before respirometry fish at each temperature were distributed into three holding tanks supplied with biofiltered water at the correct temperature (vol. 1,000 L, 18–22 fish randomly assigned per tank) and fed ad-libitum by hand, daily. Segregating into three tanks ensured that fish were not disturbed by netting/handling more than once when placing them in respirometer chambers. A single tank was then fasted for 24 h and, in the subsequent afternoon, the fish were rapidly netted from it, identified by a PIT tag and weighed. The fish were distributed into individual semi-transparent respirometry chambers (volume either 1.8 or 3.0 L according to their size, in a system of 32 chambers) and left for 12 h (overnight) to recover from handling. Chambers were submerged in two polyvinyl chloride trays (100 × 200 × 28 cm) supplied with aerated biofiltered seawater at either 18 or 24°C, trays were shielded behind opaque black plastic with fish in dim light at 12:12 photoperiod (54). The fish could see their conspecifics (57) and all of the fish themselves could be observed through small holes in the plastic curtain.
Oxygen uptake rate (O2) was measured by intermittent stopped-flow respirometry (57, 58) as described in Rodde et al. (54) and McKenzie et al. (59), over a period of 24 h after the initial 12 h recovery. Water oxygen levels were measured and recorded each 10 s in the chambers by optodes (Firesting OXROB10 oxygen sensors, www.pyroscience.com) and associated oxygen meter (Firesting FSO2-O4) and software (Pyro Oxygen Logger) (54). At the end of this period, the flushing pumps of the respirometry system were switched off (at an external switch panel) and fish were left to consume the oxygen in the closed respirometry chambers, down to 10% O2 saturation, with careful observation by experimenters. When oxygen saturation dropped to 10% in a chamber, the pump was turned back on to supply aerated, normoxic seawater. When all fish had returned to normoxia for at least 30 min, they were removed from their chambers and returned to their rearing tank. Background oxygen consumption due to bacterial respiration was then measured over 20 min in all chambers; background respiration was also measured in empty chambers throughout each respirometry series (57, 60). For the calculation of O2, only slopes of R2 ≥ 0.94 from the intermittent closed cycle were used and rates were calculated as mg O2 kg−0.8 h−1, considering the mass scaling coefficient of b = 0.8 for routine metabolic rate in European seabass (54, 61). Background respiration represented about 2% of O2 by the fish, so no correction was applied. SMR was then calculated as described in Rodde et al. (54), as the 0.25 quantile of O2 values over the 24 h period (62).
To then estimate Scrit and RI, measures of O2 were resolved over 5-min intervals (35 sequential oxygen measurements) from 90 to 10% oxygen saturation, along the progressive decline in O2 saturation in the closed respirometer chamber. This resulted in between 16 and 24 measurements per individual, depending upon how rapidly they consumed the oxygen in their chamber, which typically took from 70 to 120 min. Only slopes of R2 ≥ 0.94 were used and, as for SMR, rates were calculated as mg O2 kg−0.8 h−1. The individual Scrit was calculated empirically, as the intersection between a horizontal line, drawn at SMR, and a least squares regression through O2 values in the oxyconforming range of hypoxic oxygen saturations below SMR (32, 41, 49). The lower the Scrit, the greater the tolerance of hypoxia (40). The RI was also calculated empirically, based upon the concept of Mueller and Seymour (39). Briefly, we considered that if an individual maintained their routine O2 unchanged between 90 and 10% saturation, this would be perfect regulation with an RI of 100% (RI 100). If, by contrast, routine O2 declined in a straight line from the rate measured at 90% saturation down to the lowest O2 at 10%, this would be complete conformity and an RI of 0% (RI 0). This line of conformity was calculated for each fish, from routine normoxic O2 at 90% to the lowest hypoxic O2, measured at 10%. At each measurement interval, the percentage regulation (%R) was calculated based on the prevailing O2 as
and then the average of these measurements during progressive hypoxia taken as the overall RI for that individual. The higher the RI, the greater the tolerance of hypoxia (32, 39).
2.3 Determination of CTSmax in swim tunnels
This was performed with two Steffensen-type swim tunnels constructed in PVC and plexiglass (swim chamber volume 49 or 30 L), on 10 fish per population per temperature. Two fish were captured at random from the three holding tanks described above and their PIT tag read, care was taken to avoid disturbing any one tank more frequently than once every 72 h, and the focal tank was fasted for 24 h before trials. Fish were caught in the afternoon and measured for mass, length, depth and width, to apply relative swimming speeds in body length per second (BL s−1) and correct for the solid blocking effect (63), then placed into one of two tunnels provided with biofiltered seawater at the appropriate temperature. Fish were left to recover from handling stress overnight at a low swimming speed of 1BL s−1. The next day, at 09:00 a.m., the current speed was increased by increments of 0.1 BL s−1 every 2 min until 2.5 BL s−1. At 2.5 BL s−1, all fish swam with a sustained aerobic body-caudal swimming gait. After 30 min at that speed, temperature was increased by 1°C every 30 min. If a seabass rested against the rear screen for at least 10 s, they were rapidly removed from the tunnel and placed in a recovery tank at their acclimation temperature for 30 min, then returned to their holding tank. Fatigue is not due to lack of endurance because the seabass can swim steadily at 2.5 BL s−1 for at least 8 h at their acclimation temperature, exceeding the duration of the CTSmax (44). The CTSmax was calculated as the last temperature step completed plus the proportion of the last temperature step that the fish tolerated prior to fatigue (42). O2 measurements were made by sealing the swim tunnel for the last 15 min at each temperature step, and the highest O2 was identified and denoted O2max, as described in detail previously (42, 44). The O2max was taken as a measure of cardiorespiratory performance, which might provide insight into variation in CTSmax among populations and individuals.
2.4 Data and statistical analysis
All statistical analyses were performed in R 4.0.2 (73). In particular, analysis of variance (ANOVA) with interaction terms with acclimation temperatures and populations or named ANOVAs followed by Tukey post-hoc tests. The normality of residuals was checked using the quantile-quantile method (comparing residual quantiles with theoretical normal quantiles). The homoscedasticity and independence of the residuals were checked by comparing the residuals with the fitted values from the models. The significance level was set at p < 0.05.
The following linear model was used to evaluate the effect of population and acclimation temperature on the phenotypic traits:
where Yijk is the phenotypic trait for population i (AT, WM or EM), acclimation temperature j (18 or 24°C), and individual k. Then, μ is a general mean, P a fixed effect of population, T a fixed effect of acclimation temperature, PT the interaction of these two effects, and εijk the residuals (εijk~ N(0; σe2)). Pairwise differences among populations and temperatures were further explored by Tukey post-hoc test.
Based upon the above analyses (see Section 3 below) correlations among traits were estimated with the Pearson coefficient, considering all populations together at each temperature and then all population and temperature data together. Dependence of tolerance traits on body mass and SMR was explored by least squares regression, considering all populations together at each temperature and then all population and temperature data together.
3 Results
The samples sizes and size of the fish from each population and temperature are shown in Table 1. For the hypoxia trials, body mass depended significantly on temperature, with fish at 24 being heavier than 18°C, but no effect of population or interaction. The populations did, however, differ significantly in mass at both 18 or 24°C, with WM significantly smaller than EM, and AT intermediate (Table 1). For the CTSmax trial, mass also depended significantly on temperature, increasing from 18 to 24°C within each population, but there were no effects of population or interaction—the populations did not differ in mass at either temperature. For forklength in CTSmax, there was a significant overall effect of temperature with fish being larger at 24 compared to 18°C. This effect was only significant within WM and EM, and populations did not differ in forklength at a common temperature (Table 1). Results of the linear model are carried in Table 2 and Supplementary Table S1.
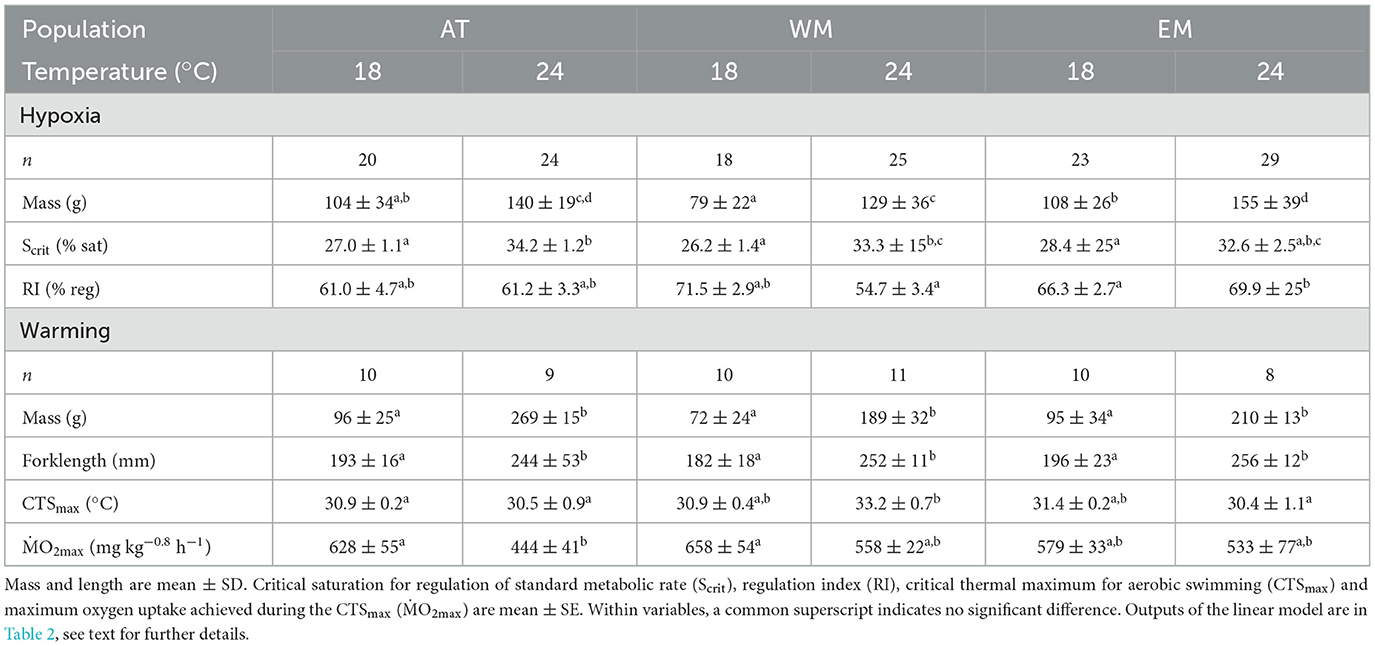
Table 1. Mean values for body size, and traits of tolerance of hypoxia and warming, in three seabass populations, Atlantic (AT), West Mediterranean (WM) and East Mediterranean (EM), reared at two temperatures, 18 and 24°C.
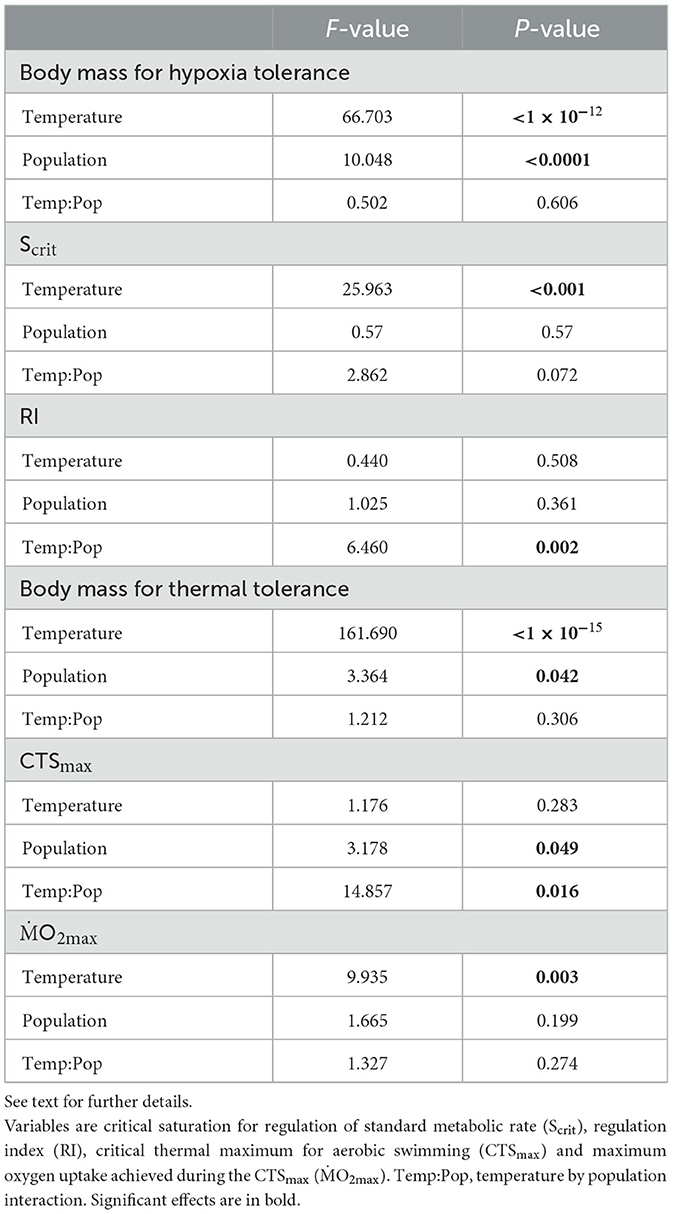
Table 2. Results of a linear model to investigate the effects of water temperature (18 vs. 24°C) and seabass population (Atlantic, Western or Eastern Mediterranean) on body mass, tolerance and performance variables.
3.1 Hypothesis 1, populations will differ in their tolerance of progressive hypoxia and acute warming
The seabass were carefully observed during progressive hypoxia and, although they hyperventilated vigorously, none of them showed any evidence of LOE. The averaged metabolic responses of the seabass populations showed a typical piscine oxyregulator response, maintaining routine O2 at normoxic rates until a critical oxygen level beyond which O2 declined below SMR and toward zero (Supplementary Figure S1). In actual fact, all of the seabass populations showed increases in mean O2 at intermediate levels of hypoxia, at both temperatures, although these were not accompanied by visible agitation (Supplementary Figure S1).
For Scrit, there was a significant effect of temperature but not of population, and an interaction of temperature and population that was not quite a significant result (Table 2). The Scrit of the three populations was statistically similar at 18°C; the overall Scrit increased from 18 to 24°C (Figure 1a, Table 1, Supplementary Table S1), indicating a decline in hypoxia tolerance. The effects of temperature were not, however, the same in all populations because Scrit increased significantly from 18 to 24°C in the AT and WM populations but not in the EM (Figure 1a, Table 1, Supplementary Table S1).
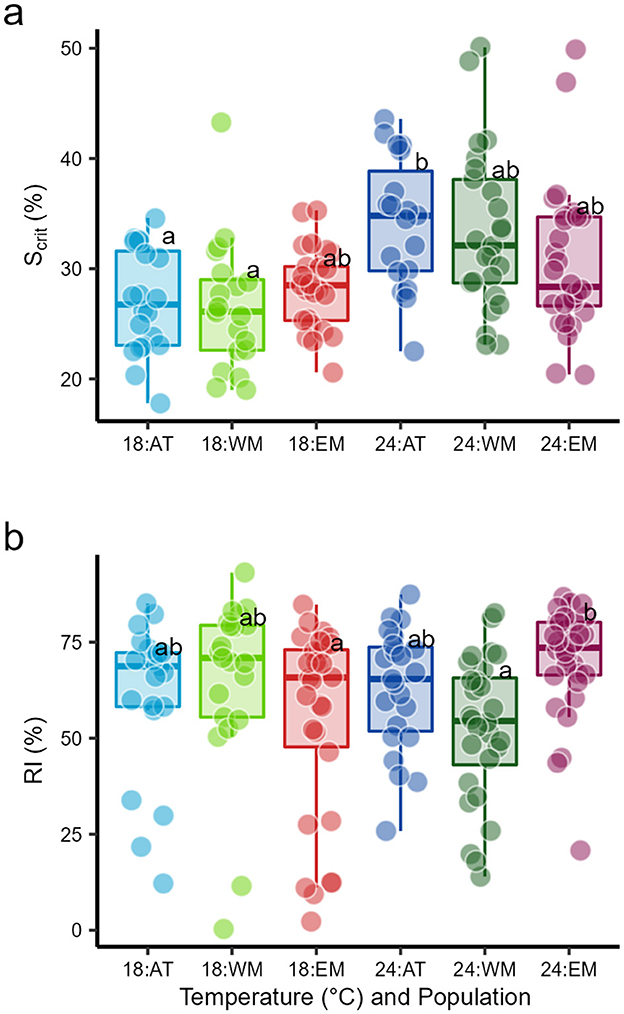
Figure 1. Box plots of (a) critical saturation for regulation of standard metabolic rate (Scrit) and (b) regulation index (RI), during progressive hypoxia in three seabass populations, Atlantic (AT), West Mediterranean (WM) and East Mediterranean (EM), reared at two temperatures, 18 and 24°C. Within variables, a common superscript indicates no significant difference, linear model outputs are in Table 2.
For RI, there was no significant effect of temperature or population, but a significant interaction (Tables 1, 2). The RI did not differ significantly among populations at 18°C and, although overall RI did not change with acclimation temperature, responses to temperature differed among populations (Figure 1b, Table 1, Supplementary Table S1). The RI did not change from 18 to 24°C for the AT and WM populations but it increased significantly in the EM and was significantly higher than the RI of the WM population at 24°C (Figure 1b, Table 1, Supplementary Table S1).
During the CTSmax, all individuals showed an increase in O2 as temperature was increased in steps, with an overall exponential Arrhenius-type metabolic response (Supplementary Figure S2). They all eventually transitioned in swimming gait, from an entirely steady aerobic gait with rhythmic beating of the tail, to increasing engagement of unsteady anaerobic “burst-and-coast” episodes. This led to fatigue within < 1 temperature increment (30 min). No individual showed any evidence of LOE in the swimming trials.
For CTSmax, there was no significant effect of temperature but a significant effect of population and a significant temperature:population interaction (Table 2). There were no significant differences in CTSmax at 18°C (Figure 2a, Table 1, Supplementary Table S1). CTSmax did not change with an increase from 18 to 24°C in the AT and EM populations, but it rose significantly in the WM population. At 24°C, CTSmax of the WM population was significantly higher than the AT and EM populations (Figure 2a, Table 1, Supplementary Table S1). There is also evidence that CTSmax was more variable at 24°C, with outliers in all populations that we had no reason to disregard (Figure 2a).
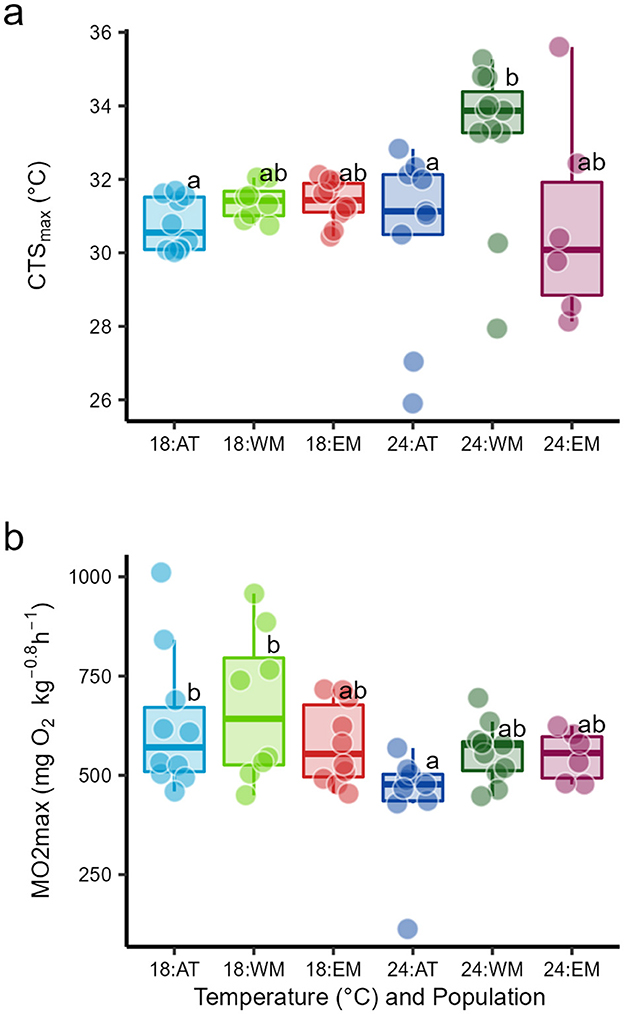
Figure 2. Box plots of (a) critical thermal maximum for aerobic swimming (CTSmax) and (b) maximum oxygen uptake achieved during the CTSmax (O2max), during progressive warming in three seabass populations, Atlantic (AT), West Mediterranean (WM) and East Mediterranean (EM), reared at two temperatures, 18 and 24°C. Within variables, a common superscript indicates no significant difference, linear model outputs are in Table 2.
With respect to cardiorespiratory performance in the CTSmax–the O2max–there was a significant effect of temperature but not of population, and no interaction (Table 2). That is, O2max declined significantly with an increase from 18 to 24°C, and this was significant within the AT population, where the O2max at 24°C was significantly lower than its own population and WM at 18°C (Figure 2b, Table 1).
3.2 Hypothesis 2, individuals relatively tolerant of hypoxia are also relatively tolerant of warming
We focus on simple correlations between Scrit, RI and CTSmax at a species level, because the sample sizes per population at each temperature were limited. Furthermore, if the populations differed, which they did somewhat at 24°C, the distribution of individuals at species level can still inform us about whether relative tolerance is correlated within all individuals across the total sample. The individual Scrit and RI were negatively correlated at 24°C and when considering all data together, with quite high correlation coefficients (Figure 3a, Table 3). This is the expected pattern, a relatively hypoxia-tolerant individual would have a low Scrit and a high RI. There was, however, no correlation between Scrit or RI and CTSmax, at either temperature or even when considering all data at both temperatures (Figures 3b, c, Table 3).
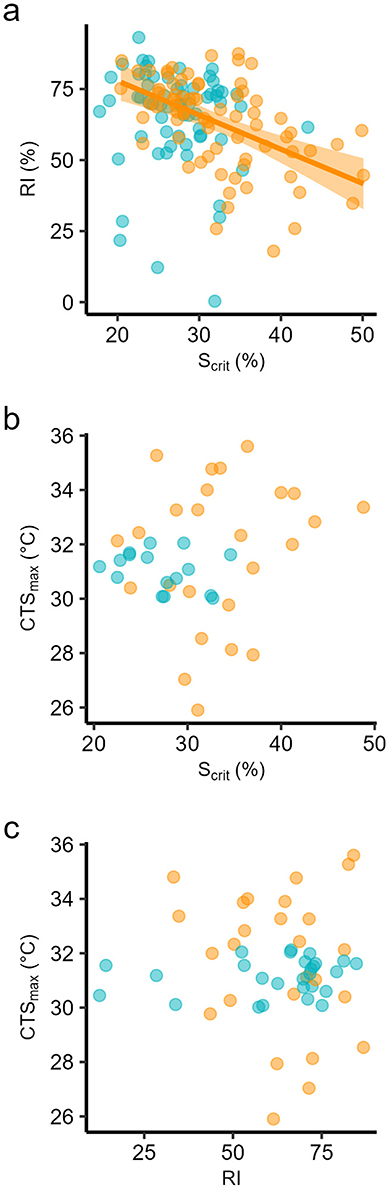
Figure 3. Pearson correlations among (a) individual critical saturation for regulation of standard metabolic rate (Scrit) and individual regulation index (RI) in progressive hypoxia; (b) individual Scrit and individual critical thermal maximum for aerobic swimming (CTSmax), and (c) individual RI and individual CTSmax, in seabass reared at two temperatures, 18 (blue dots) and 24°C (orange dots). Correlation coefficients are in Table 3.
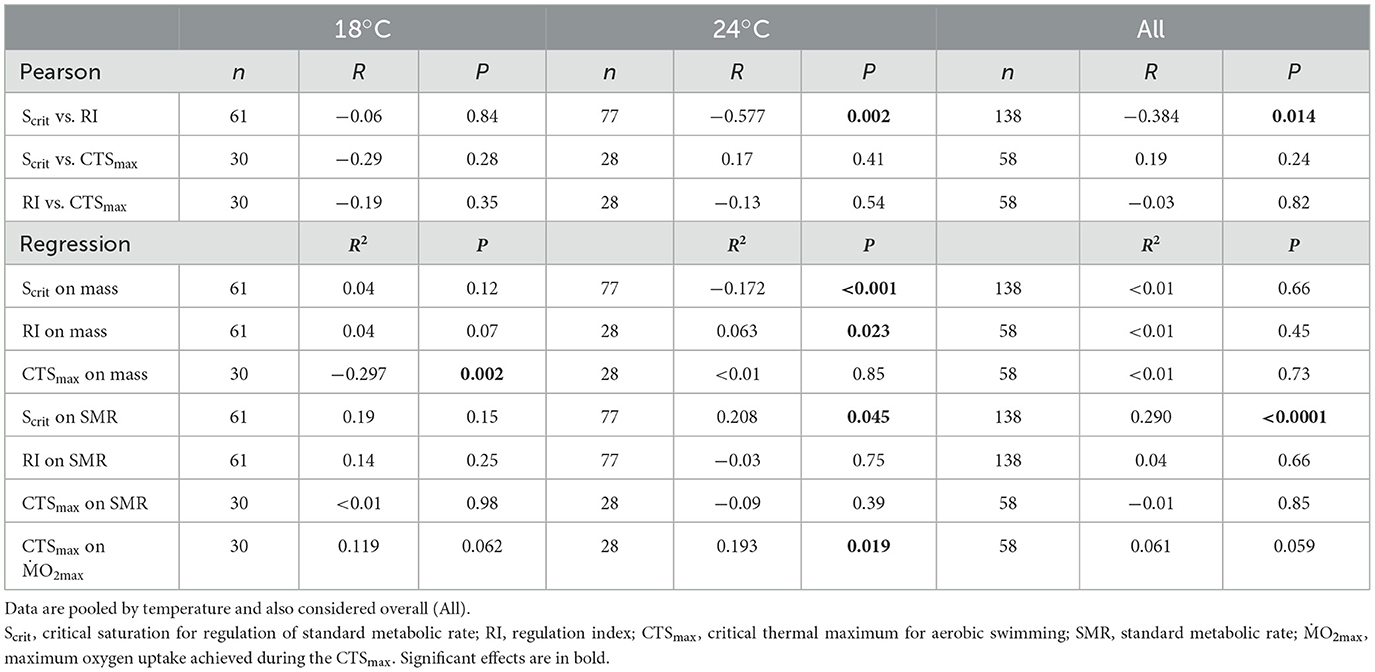
Table 3. Correlations among tolerance variables (Pearson correlation) and dependences of these variables on metabolic variables (least squares regression) in individuals from three seabass populations, Atlantic (AT), West Mediterranean (WM) and East Mediterranean (EM), reared at two temperatures, 18 and 24°C.
3.3 Exploration of the effects of individual body mass and standard metabolic rate on tolerance traits
There was no reliance of Scrit or RI on individual body mass at 18°C but a significant dependence on body mass at 24°C, whereby Scrit declined and RI increased, indicating improved tolerance with increasing mass, albeit with relatively low coefficients of determination. There were no significant effects of mass when data from both temperatures were combined (Figures 4a, b, Table 3). By contrast, CTSmax declined significantly with body mass at 18°C, indicating poorer tolerance as mass increased, and mass explained almost 30% of the variation in CTSmax at this temperature. There was, however, no dependence on body mass at 24°C, or when all data were considered together (Figure 4c, Table 3).
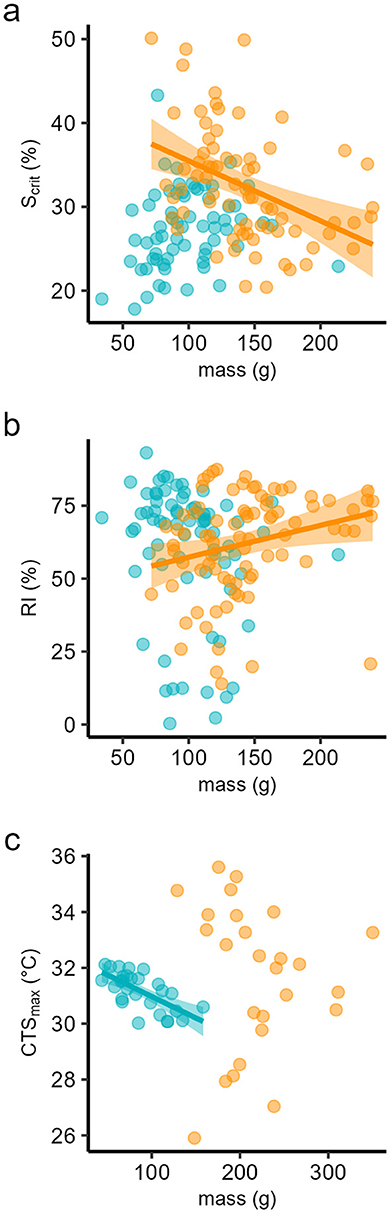
Figure 4. Least squares linear regression against individual body mass of (a) critical saturation for regulation of standard metabolic rate (Scrit); (b) regulation index (RI), and (c) critical thermal maximum for aerobic swimming (CTSmax), in seabass reared at two temperatures, 18 (blue dots) and 24°C (orange dots). Coefficients of determination are in Table 3.
The data for SMR of the three populations were reported in (54) as means for each population at each temperature. That study found no significant differences among SMRs at either temperature but that SMR was significantly higher at 24°C compared to 18°C in all populations. If the individual data are taken for each temperature, all populations considered, individual Scrit depended significantly upon individual SMR (Figure 5a, Table 3), and for all data together, SMR explained almost 30% of the variation in Scrit. By contrast, but individual RI did not depend on SMR (Figure 5b, Table 3). Individual CTSmax showed no evidence of a dependence on SMR (Figure 6a, Table 3), although it did depend on O2max at 24°C although the effect size was small in terms of coefficient of determination (Figure 6b, Table 3).
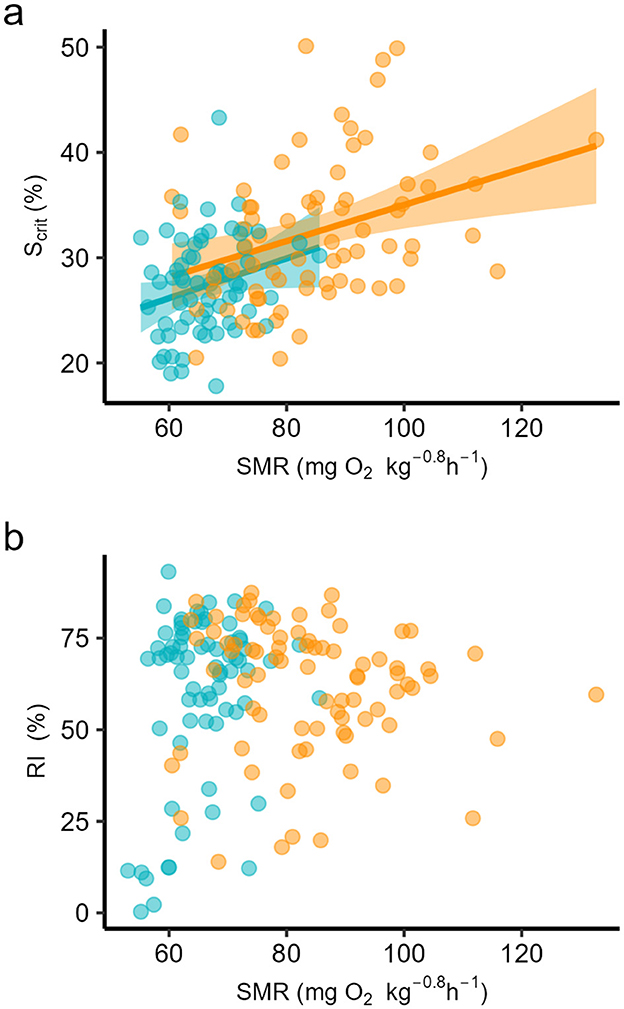
Figure 5. Least squares linear regression against individual standard metabolic rate (SMR) of (a) critical saturation for regulation of standard metabolic rate (Scrit), and (b) regulation index (RI), in seabass reared at two temperatures, 18 (blue dots) and 24°C (orange dots). Coefficients of determination are in Table 3.
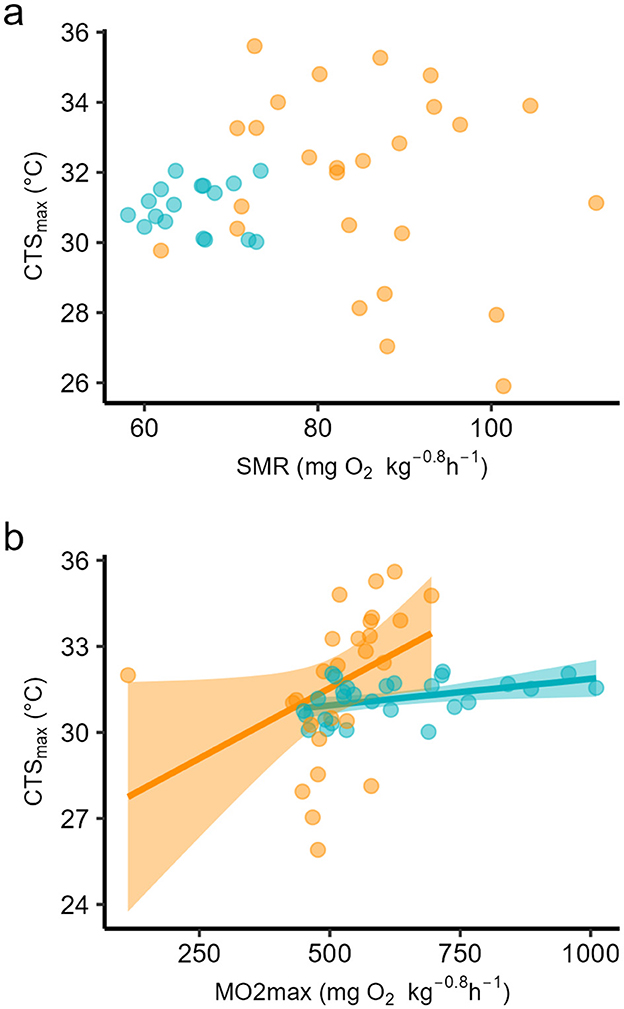
Figure 6. Least squares linear regression of (a) individual critical thermal maximum for aerobic swimming (CTSmax) against individual standard metabolic rate (SMR), and (b) individual CTSmax against individual maximum oxygen uptake achieved during the CTSmax (O2max), in seabass reared at two temperatures, 18 (blue dots) and 24°C (orange dots). Coefficients of determination are in Table 3.
4 Discussion
The results support our Hypothesis 1 to the extent that the populations differed in their tolerance of sublethal hypoxia and warming. There was some evidence that the EM population was better able to cope with hypoxia at a warmer temperature but it was not systematically more tolerant than AT, with WM intermediate. In fact, somewhat paradoxically, the WM population was the least tolerant of hypoxia at the warmer temperature but the most tolerant of warming. We obtained no evidence for Hypothesis 2, that seabass individuals tolerant of hypoxia were also tolerant of warming, nor of Hypothesis 3, that relative tolerance of the two stressors would depend upon individual SMR.
4.1 Hypothesis 1, populations will differ in their tolerance of progressive hypoxia and acute warming
These are the first data on comparative tolerance of HIREC-related stressors in the three European seabass populations. The finding that overall Scrit increased—hypoxia tolerance diminished—with an increase in temperature from 18 to 24°C is consistent with previous studies on other teleosts (40) and is attributed to an increase in SMR with temperature, such that the fish are defending a higher oxygen demand. Surprisingly, despite the quite extensive study of the physiology of hypoxia in seabass, dating back several decades (12, 14, 16–18), there is no published report of their Scrit. They have often been assumed to be quite tolerant of hypoxia because the juveniles inhabit enclosed coastal ecosystems such as estuaries and lagoons that are prone to hypoxia (64). Our Scrit measurements, of around 25% at 18°C and 30% at 24°C, indicate that the species has moderate hypoxia tolerance compared to other marine species at similar temperatures (40). Among the populations, the EM appeared better able to cope with hypoxia in warm water, based upon the absence of any change in Scrit within that population with warming.
The RI has been studied much less than Scrit in fishes but it is believed to provide a more accurate reflection of how well an animal regulates its oxygen uptake in progressive hypoxia because it integrates data throughout the exposure rather than simply revealing a threshold oxygen level (39, 41). It might be considered surprising that, in the seabass, overall RI did not decrease with the increase in temperature, given that overall Scrit decreased. This may be because RI was measured relative to an individual's actual normoxic O2 at each temperature, not in relation to their SMR, so that small changes in that routine O2 obscured effects of temperature. The RI in the seabass populations, ranging from 55 to 70%, is within the range of reports for other species such as the Paranà pacu with 79% at 26°C (32), the tropical freshwater mormyrid Petrocephalus degeni with 69–79% at 23°C (65), or the temperate marine tidepool sculpin Oligocottus maculosus with 60% at 12°C (66).
The finding that RI increased with warming in the EM population, and was significantly higher than the WM population at 24°C, is further evidence that the EM is better able to cope with hypoxia in warm waters. This may reflect local adaptation to hypoxia exposure at warm summer temperatures in the Eastern Mediterranean. The significant interaction between population and temperature for the effects of RI would also indicate differing levels of phenotypic plasticity in the hypoxia physiology of the three populations. The patterns of hypoxia tolerance require further study, not least because the low tolerance of the WM population at 24°C, based on their low RI, was linked unexpectedly to a relatively higher thermal tolerance at that temperature, based on their CTSmax.
This comparison of CTSmax among the seabass populations does not support the hypothesis that warming tolerance would increase from a population that evolved in a relatively cool Atlantic compared to a warmer Eastern Mediterranean. A previous study, on the WM population (44), found a very similar mean value at 18°C (30.3 ± 0.4°C, n = 8) and that CTSmax was significantly lower than CTmax (34.0 ± 0.4°C) in the same individuals. A similar relationship of CTSmax to CTmax has been observed in other teleost species (42). The CTSmax has been argued to be valid measure of thermal tolerance in active fish species because swimming is important for their ecological performance and because fatigue may occur due to a similar mechanism in all species—an inability to meet the combined oxygen demands of aerobic swimming and progressive warming (37, 43, 45, 67).
The data also indicate that the CTSmax threshold is relatively insensitive to acclimation temperature over the range of 18–24°C for the seabass. It is interesting that there were no differences in CTSmax at 18°C but that, at 24°C, the WM population had higher thermal tolerance than the AT and EM populations. This difference in thermal tolerance should presumably be attributed to local adaptation to acute heat stress in the WM population. This population is known to colonize lagoons as summer feeding grounds and these enclosed habitats are prone to heatwaves, although they are also prone to concurrent hypoxia. Once again, the interaction of population and temperature on CTSmax may indicate populational differences in plasticity of tolerance, which deserve further investigation.
The significant decline in O2max from 18 to 24°C was unexpected because the species has been reported to have higher aerobic scope and growth at 24 compared to 18°C (13, 55). It is not clear why O2max was lower at 24°C, this may reflect consequences of rearing at a constant temperature, which is not ecophysiologically realistic for temperate fish species. The fact that the decline in cardiorespiratory performance was only significant in the AT is a slight indication of a lower capacity to cope with warmer waters in this population, although it was not linked to a parallel decline in CTSmax from 18 to 24°C.
When considered together the data suggest that, in warmer waters, EM is somewhat more tolerant of hypoxia and WM of warming, with AT never being the best performer. The paradox of poor hypoxia but good warming tolerance in the WM clearly argues against our Hypothesis 2, for which we obtained no evidence whatsoever.
4.2 Hypothesis 2, individuals relatively tolerant of hypoxia are also relatively tolerant of warming
Despite previous indications that Scrit, RI and CTSmax might be correlated in individuals of the Paranà pacu, with those relatively tolerant of hypoxia being relatively tolerant of warming (32), we found no such evidence in the European seabass. The negative correlation of Scrit to RI is consistent with their relative relationship to hypoxia tolerance and indicates that they share a causal mechanism. That is, they both reflect aspects of cardiorespiratory capacity for regulation of aerobic metabolic rate as oxygen availability falls in progressive hypoxia (32, 39, 41, 49).
The endpoint in the CTSmax, fatigue from aerobic swimming, has been attributed to an inability of the cardiorespiratory system to meet the combined oxygen demands of exercise plus warming. This supposition is supported by the fact that fatigue is preceded by gait transition from aerobic to anaerobic swimming style, a response that has been observed in six teleost species so far [(42, 44, 45), D.J. McKenzie unpublished observations]. It is also supported by the positive correlation of CTSmax to O2max when all seabass were considered, irrespective of population or temperature. This positive correlation has also been observed in a tropical freshwater teleost, the Nile tilapia Oreochromis mossambicus (43) and would also seem to indicate that individuals with a greater capacity to increase their oxygen supply, in response to increased demand due to warming, were relatively more tolerant.
The absence of any evidence of a correlation of Scrit or RI to CTSmax in the seabass would, therefore, argue against the notion that the endpoints share common underlying causal mechanisms. Given our good understanding of how oxygen uptake is regulated in hypoxia (38, 40, 41, 68), these results indicate that our understanding of the role of oxygen uptake in CTSmax is imperfect. It is possible that cessation of swimming in a CTSmax does not occur due to an incapacity to provide oxygen to tissues, as recently argued for a tropical coastal marine species, the schoolmaster snapper Lutjanus apodus, because it showed no transition to anaerobic swimming prior to fatigue (69). For the seabass, however, there was a clear gait transition to anaerobic swimming prior to fatigue in all individuals in the CTSmax, a gait transition that is commonly assumed to indicate limitations in capacity for aerobic work in fishes (45, 69–71). It may indicate that individual CTSmax does not depend only upon intrinsic capacity for oxygen uptake, as hypoxia tolerance does, but also upon how the acute incremental temperature increase affects the physiology and cardiorespiratory capacity of each individual. The mechanisms underlying cessation of swimming in a CTSmax protocol may therefore differ among species and this requires further research. Nonetheless, these sublethal endpoints are not proving more useful than LOE, at ILOS vs. CTmax, when investigating whether individual tolerance of hypoxia and warming are correlated in fishes (19, 20, 32, 34–36).
4.3 Exploration of the effects of individual body mass and standard metabolic rate on tolerance traits
Although there were significant effects of body mass on tolerance of hypoxia and warming, these were complex and to some extent contrasting, with overall small effect sizes. It is not clear why hypoxia tolerance did not depend on mass at the cooler temperature but that both Scrit and RI showed a clear positive dependence at the warmer temperature. There is conflicting evidence about the effects of body mass on Scrit in fish species, with reports that it either decreases with mass (46, 49, 50), does not change (32, 47, 51), or increases (48). Little is known about effects of mass on RI in fishes, the current data on European seabass at 24°C are coherent with a previous report of an increase in RI with mass in Paranà pacu (32). At 24°C, the WM population had a lower Scrit and RI than the EM population, and also a lower body mass. Therefore, the difference in mass may have been a contributing factor to the difference in tolerance between these two populations.
It is also not clear why CTSmax depended on mass at 18°C but not at 24°C. The significant decline in CTSmax with mass at 18°C is coherent with a report for Nile tilapia, where tolerance declined significantly with mass (43). The contrasting effects of mass on hypoxia and warming tolerance deserve further investigation, they certainly do not suggest that tolerance of the two stressors should be positively correlated among individuals. Future studies of the effects of mass on environmental tolerance within species should explore a mass range that is >1 order of magnitude, to improve explanatory power (42).
There was clear evidence of the positive correlation of SMR to Scrit observed in Gulf killifish Fundulis grandis (49), which would seem axiomatic since individuals with lower basal oxygen demand might be expected to be less challenged to regulate their metabolism in hypoxia. This finding in seabass is consistent with a previous study that found a correlations between individual SMR and the behavioral responses to hypoxia of aquatic surface respiration in the seabass (15). There was, however, no evidence of a dependence of Scrit on SMR in the Paranà pacu, which presumably reflects diversity of hypoxia physiology among fish species (32). The absence of any dependence of RI on SMR presumably is because the tolerance indicator is measured against routine O2 in normoxia and does not contemplate basal oxygen demands, although SMR and routine metabolic rate, the average O2 over 24h in the respirometers, were extremely closely correlated in the seabass in this study (54). In terms of thermal tolerance, a previous report found evidence that individual CTmax was related to SMR in European seabass (53) but we found no evidence that this was the case for CTSmax. There was some evidence of a dependence of CTSmax on overall cardiorespiratory performance, but the effect size was limited. More studies are therefore required, in more species, to evaluate the extent to which tolerance of environmental stressors might depend upon intrinsic metabolic phenotype in fishes but, to date, the evidence is inconclusive.
4.4 Conclusions and perspectives
This study provides the first comparative measures of tolerance of hypoxia and warming in the three genetic populations of the European seabass. Our hypothesis 1 was only partially supported, in that EM and WM fish were better able to cope with hypoxia and warming, respectively, than AT fish, which were never the best performers. Therefore, although the seabass shows inter-populational variation in tolerance of hypoxia and warming, that presumably reflects processes of local adaptation, the pattern of variation does not simply reflect the broad scale thermal gradient over the species' geographic range. We also explored some potential patterns of inter-individual variation in tolerance. We found no evidence for Hypothesis 2 that, within the experimental subjects in general, individuals that were relatively tolerant of hypoxia (low Scrit, high RI) were also relatively tolerant of warming (high CTSmax). We found evidence that individual body mass explained some of the variation in tolerance at a species level although relationships were complex and effect sizes were small; and evidence that individual SMR affected hypoxia tolerance when measured as Scrit but had no effect on tolerance of warming when measured as CTSmax.
Clearly, there is a need to extend the knowledge base about patterns of intraspecific variation in tolerance of environmental stressors in fishes (26, 31, 32, 40, 56). The current results do not really reveal one seabass population that is most tolerant of major stressors of HIREC, for application in cage mariculture, except the general conclusion that the AT population is not suited to farming in warm waters if these are subject to hypoxic or warming episodes. They also do not contribute greatly to our understanding of general principles that underly patterns of inter-individual tolerance of hypoxia and warming within all fish species, although this remains a worthwhile objective.
Data availability statement
The raw data supporting the conclusions of this article will be made available by the authors, without undue reservation.
Ethics statement
The animal study was approved by C2EA−36 (Comité d'éthique en expérimentation animale Languedoc-Roussillon) under authorization APAFiS n° 2018100910598940. The study was conducted in accordance with the local legislation and institutional requirements.
Author contributions
JN: Data curation, Formal analysis, Investigation, Methodology, Validation, Writing – original draft, Writing – review & editing. CR: Data curation, Formal analysis, Investigation, Methodology, Validation, Writing – review & editing. FB: Investigation, Writing – review & editing. GS: Investigation, Writing – review & editing. AV: Investigation, Methodology, Resources, Writing – review & editing. HV: Funding acquisition, Project administration, Resources, Supervision, Writing – review & editing. MV: Funding acquisition, Project administration, Resources, Supervision, Writing – review & editing. FA: Funding acquisition, Project administration, Resources, Supervision, Writing – review & editing. DM: Conceptualization, Data curation, Formal analysis, Funding acquisition, Methodology, Project administration, Resources, Supervision, Validation, Writing – original draft, Writing – review & editing.
Funding
The author(s) declare that financial support was received for the research and/or publication of this article. The research was supported by H2020 AQUAEXCEL2020 (project No. 652831). JN was supported by an individual Marie Curie Fellowship (MSCA-IF-EF-ST 839038, INDITOL). CR was supported by the CGIAR Research Program on Fish Agrifood Systems (FISH) and the International Fund for Agricultural Development (IFAD). FB was supported by the Coordenação de Aperfeiçoamento de Pessoal de Nível Superior—Brasil (CAPES)—Finance Code 001; the AquaExcel Transnational2020 Access project AE120016 PhenoBass; and by a Company of Biologists Travel Grant.
Acknowledgments
The authors are grateful to Aurélien Lledo for technical support in developing the respirometry systems.
Conflict of interest
The authors declare that the research was conducted in the absence of any commercial or financial relationships that could be construed as a potential conflict of interest.
Generative AI statement
The author(s) declare that no Gen AI was used in the creation of this manuscript.
Publisher's note
All claims expressed in this article are solely those of the authors and do not necessarily represent those of their affiliated organizations, or those of the publisher, the editors and the reviewers. Any product that may be evaluated in this article, or claim that may be made by its manufacturer, is not guaranteed or endorsed by the publisher.
Supplementary material
The Supplementary Material for this article can be found online at: https://www.frontiersin.org/articles/10.3389/frish.2025.1542342/full#supplementary-material
References
1. Tacon AGJ. Contribution of fish and seafood to global food and feed supply: an analysis of the FAO food balance sheet for 2019. Rev Fish Sci Aquacult. (2023) 31:274–83. doi: 10.1080/23308249.2022.2124364
2. Breitburg D, Levin LA, Oschlies A, Grégoire M, Chavez FP, Conley DJ, et al. Declining oxygen in the global ocean and coastal waters. Science. (2018) 359:e7240. doi: 10.1126/science.aam7240
3. Deutsch C, Penn JL, Lucey N. Climate, oxygen, and the future of marine biodiversity. Ann Rev Mar Sci. (2024) 16:217–45. doi: 10.1146/annurev-marine-040323-095231
4. Zhan Y, Ning B, Sun J, Chang Y. Living in a hypoxic world: a review of the impacts of hypoxia on aquaculture. Mar Pollut Bull. (2023) 194:115207. doi: 10.1016/j.marpolbul.2023.115207
5. Smale DA, Wernberg T, Oliver ECJ, Thomsen M, Harvey BP, Straub SC, et al. Marine heatwaves threaten global biodiversity and the provision of ecosystem services. Nat Clim Chang. (2019) 9:306–12. doi: 10.1038/s41558-019-0412-1
6. Smith KE, Burrows MT, Hobday AJ, King NG, Moore PJ, Sen Gupta A, et al. Biological Impacts of Marine Heatwaves. Ann Rev Mar Sci. (2023) 15:119–45. doi: 10.1146/annurev-marine-032122-121437
7. Stillman JH. Heat waves, the new normal: Summertime temperature extremes will impact animals, ecosystems, and human communities. Physiology. (2019) 34:86–100. doi: 10.1152/physiol.00040.2018
8. Vandeputte M, Gagnaire P-A, Allal F. The European sea bass: a key marine fish model in the wild and in aquaculture. Anim Genet. (2019) 50:195–206. doi: 10.1111/age.12779
9. Frölicher TL, Fischer EM, Gruber N. Marine heatwaves under global warming. Nature. (2018) 560:360–4. doi: 10.1038/s41586-018-0383-9
10. Androulidakis YS, Krestenitis YN. Sea surface temperature variability and marine heat waves over the Aegean, Ionian, and Cretan seas from 2008–2021. J Mar Sci Eng. (2022) 10:42. doi: 10.3390/jmse10010042
11. Cos J, Doblas-Reyes F, Jury M, Marcos R, Bretonnière P-A, Samsó M. The Mediterranean climate change hotspot in the CMIP5 and CMIP6 projections. Earth Syst Dynam. (2022) 13:321–40. doi: 10.5194/esd-13-321-2022
12. Cadiz L, Zambonino-Infante J-L, Quazuguel P, Madec L, Le Delliou H, Mazurais D. Metabolic response to hypoxia in European sea bass (Dicentrarchus labrax) displays developmental plasticity. Compar Biochem Physiol B Biochem Mol Biol. (2018) 215:1–9. doi: 10.1016/j.cbpb.2017.09.005
13. Claireaux G, Couturier C, Groison A-L. Effect of temperature on maximum swimming speed and cost of transport in juvenile European sea bass (Dicentrarchus labrax). J Exp Biol. (2006) 209:3420–8. doi: 10.1242/jeb.02346
14. Claireaux G, Lagardère JP. Influence of temperature, oxygen and salinity on the metabolism of the European sea bass. J Sea Res. (1999) 42:157–68. doi: 10.1016/S1385-1101(99)00019-2
15. Killen SS, Marras S, Ryan MR, Domenici P, McKenzie DJ. A relationship between metabolic rate and risk-taking behaviour is revealed during hypoxia in juvenile European sea bass. Funct Ecol. (2012) 26:134–43. doi: 10.1111/j.1365-2435.2011.01920.x
16. Pichavant K, Person-Le-Ruyet J, Bayon NL, Severe A, Roux AL, Boeuf G. Comparative effects of long-term hypoxia on growth, feeding and oxygen consumption in juvenile turbot and European sea bass. J Fish Biol. (2001) 59:875–83. doi: 10.1111/j.1095-8649.2001.tb00158.x
17. Pichavant K, Maxime V, Soulier P, Boeuf G, Nonnotte G. A comparative study of blood oxygen transport in turbot and sea bass: effect of chronic hypoxia. J Fish Biol. (2003) 62:928–37. doi: 10.1046/j.1095-8649.2003.00089.x
18. Zambonino-Infante JL, Mazurais D, Dubuc A, Quéau P, Vanderplancke G, Servili A, et al. An early life hypoxia event has a long-term impact on protein digestion and growth in juvenile European sea bass. J Exp Biol. (2017) 220:1846–51. doi: 10.1242/jeb.154922
19. Claireaux G, Théron M, Prineau M, Dussauze M, Merlin FX, Le Floch S. Effects of oil exposure and dispersant use upon environmental adaptation performance and fitness in the European sea bass, Dicentrarchus labrax. Aquatic Toxicol. (2013) 130–131:160–70. doi: 10.1016/j.aquatox.2013.01.004
20. Mauduit F, Farrell AP, Domenici P, Lacroix C, Le Floch S, Lemaire P, et al. Assessing the long-term effect of exposure to dispersant-treated oil on fish health using hypoxia tolerance and temperature susceptibility as ecologically relevant biomarkers. Environ Toxicol Chem. (2019) 38:210–21. doi: 10.1002/etc.4271
21. Guinand B, Vandeputte M, Dupont-Nivet M, Vergnet A, Haffray P, Chavanne H, et al. Metapopulation patterns of additive and nonadditive genetic variance in the sea bass (Dicentrarchus labrax). Ecol Evol. (2017) 7:2777–90. doi: 10.1002/ece3.2832
22. Duranton M, Allal F, Fraïsse C, Bierne N, Bonhomme F, Gagnaire P-A. The origin and remolding of genomic islands of differentiation in the European sea bass. Nat Commun. (2018) 9:2518. doi: 10.1038/s41467-018-04963-6
23. Duranton M, Allal F, Valière S, Bouchez O, Bonhomme F, Gagnaire P-A. The contribution of ancient admixture to reproductive isolation between European sea bass lineages. Evol Lett. (2020) 4:226–42. doi: 10.1002/evl3.169
24. Lindgren D. Morphometric classification and GIS-based data analysis in coastal modeling and management. Open Environ Sci. (2011) 5:1–17. doi: 10.2174/1876325101105010001
25. Crestel D, Vergnet A, Clota F, Blanc M, Navarro T, Lallement S, et al. Do European seabass larvae grow better in their natural temperature regime? Evol Appl. (2025) 18:e70083. doi: 10.1111/eva.70083
26. Zillig KW, FitzGerald AM, Lusardi RA, Cocherell DE, Fangue NA. Intraspecific variation among Chinook Salmon populations indicates physiological adaptation to local environmental conditions. Conserv Physiol. (2023) 11:coad044. doi: 10.1093/conphys/coad044
27. Earhart ML, Blanchard TS, Harman AA, Schulte PM. Hypoxia and high temperature as interacting stressors: will plasticity promote resilience of fishes in a changing world? Biol Bull. (2022) 243:149–70. doi: 10.1086/722115
28. Fry FEJ. The effect of environmental factors on the physiology of fish. In:Hoar WS, Randall DJ, , editors. Fish Physiology Volume 6. New York, NY: Academic Press (1971). p. 1–98.
29. McBryan TL, Anttila K, Healy TM, Schulte PM. Responses to temperature and hypoxia as interacting stressors in fish: Implications for adaptation to environmental change. Integr Comp Biol. (2013) 53:648–59. doi: 10.1093/icb/ict066
30. Jung EH, Brix KV, Richards JG, Val AL, Brauner CJ. Reduced hypoxia tolerance and survival at elevated temperatures may limit the ability of Amazonian fishes to survive in a warming world. Sci Total Environ. (2020) 748:141349. doi: 10.1016/j.scitotenv.2020.141349
31. Anttila K, Dhillon RS, Boulding EG, Farrell AP, Glebe BD, Elliott JAK, et al. Variation in temperature tolerance among families of atlantic salmon (Salmo salar) is associated with hypoxia tolerance, ventricle size and myoglobin level. J Exp Biol. (2013) 216:1183–90. doi: 10.1242/jeb.080556
32. Blasco FR, Leite CAC, Rantin FT, Taylor EW, McKenzie DJ. Individual variation in sublethal tolerance of warming and hypoxia in the pacu Piaractus mesopotamicus: an investigation of correlations and dependence on intrinsic metabolic phenotype. Front Fish Sci. (2024) 2:1276161. doi: 10.3389/frish.2024.1276161
33. Bouyoucos IA, Morrison PR, Weideli OC, Jacquesson E, Planes S, Simpfendorfer CA, et al. Thermal tolerance and hypoxia tolerance are associated in blacktip reef shark (Carcharhinus melanopterus) neonates. J Exp Biol. (2020) 223:1937. doi: 10.1242/jeb.221937
34. Healy TM, Brennan RS, Whitehead A, Schulte PM. Tolerance traits related to climate change resilience are independent and polygenic. Glob Chang Biol. (2018) 24:5348–60. doi: 10.1111/gcb.14386
35. Joyce W, Perry SF. Hypoxia inducible factor-1 α knockout does not impair acute thermal tolerance or heat hardening in zebrafish. Biol Lett. (2020) 16:20200292. doi: 10.1098/rsbl.2020.0292
36. Strowbridge N, Northrup SL, Earhart ML, Blanchard TS, Schulte PM. Acute measures of upper thermal and hypoxia tolerance are not reliable predictors of mortality following environmental challenges in rainbow trout (Oncorhynchus mykiss). Conserv Physiol. (2021) 9:coab095. doi: 10.1093/conphys/coab095
37. Ern R, Andreassen AH, Jutfelt F. Physiological mechanisms of acute upper thermal tolerance in fish. Physiology. (2023) 38:141–58 doi: 10.1152/physiol.00027.2022
38. Chapman LJ, McKenzie DJ. Behavioral responses and ecological consequences. In:Richards JG, Farrell A, CJ B, , editors. Hypoxia, Fish Physiology Volume 27. San Diego, CA: Elsevier Inc. (2009). p. 25–77.
39. Mueller CA, Seymour RS. The regulation index: a new method for assessing the relationship between oxygen consumption and environmental oxygen. Physiol Biochem Zool. (2011) 84:522–32. doi: 10.1086/661953
40. Rogers NJ, Urbina MA, Reardon EE, Mckenzie DJ, Wilson RW. A new analysis of hypoxia tolerance in fishes using a database of critical oxygen level (P. crit). Conserv Physiol. (2016) 4:1–19. doi: 10.1093/conphys/cow012
41. Wood CM. The fallacy of the pcrit—Are there more useful alternatives? J Exp Biol. (2018) 221:163717. doi: 10.1242/jeb.163717
42. Blasco FR, Esbaugh AJ, Killen S, Rantin FT, Taylor EW, McKenzie DJ. Using aerobic exercise to evaluate sub-lethal tolerance of acute warming in fishes. J Exp Biol. (2020) 223:jeb218602. doi: 10.1242/jeb.218602
43. Blasco FR, Taylor EW, Leite CAC, Monteiro DA, Rantin FT, McKenzie DJ. Tolerance of an acute warming challenge declines with body mass in Nile tilapia: evidence of a link to capacity for oxygen uptake. J Exp Biol. (2022) 225:jeb244287. doi: 10.1242/jeb.244287
44. Nati JJH, Blasco FR, Rodde C, Vergnet A, Allal F, Vandeputte M, et al. In a marine teleost, the significance of oxygen supply for acute thermal tolerance depends upon the context and the endpoint used. J Exp Biol. (2023) 226:jeb245210. doi: 10.1242/jeb.245210
45. Steinhausen MF, Sandblom E, Eliason EJ, Verhille C, Farrell AP. The effect of acute temperature increases on the cardiorespiratory performance of resting and swimming sockeye salmon (Oncorhynchus nerka). J Exp Biol. (2008) 211:3915–26. doi: 10.1242/jeb.019281
46. Everett MV, Crawford DL. Adaptation versus allometry: population and body mass effects on hypoxic metabolism in Fundulus grandis. Physiol Biochem Zool. (2010) 83:182–90. doi: 10.1086/648482
47. Nilsson GE, Östlund-Nilsson S. Does size matter for hypoxia tolerance in fish? Biol Rev. (2008) 83:173–89. doi: 10.1111/j.1469-185X.2008.00038.x
48. Pan YK, Ern R, Esbaugh AJ. Hypoxia tolerance decreases with body size in red drum Sciaenops ocellatus. J Fish Biol. (2016) 89:1488–93. doi: 10.1111/jfb.13035
49. Reemeyer JE, Rees BB. Plasticity, repeatability, and phenotypic correlations of aerobic metabolic traits in a small estuarine fish. J Exp Biol. (2020) 223:jeb.228098. doi: 10.1242/jeb.228098
50. Sloman KA, Wood CM, Scott GR, Wood S, Kajimura M, Johannsson OE, et al. Tribute to R. G. Boutilier: the effect of size on the physiological and behavioural responses of oscar, Astronotus ocellatus, to hypoxia. J Exp Biol. (2006) 209:1197–205. doi: 10.1242/jeb.02090
51. Virani NA, Rees BB. Oxygen consumption, blood lactate and inter-individual variation in the gulf killifish, Fundulus grandis, during hypoxia and recovery. Compar Biochem Physiol A Mol Integr Physiol. (2000) 126:397–405. doi: 10.1016/S1095-6433(00)00219-1
52. Claireaux G, Chabot D. Responses by fishes to environmental hypoxia: Integration through Fry's concept of aerobic metabolic scope. J Fish Biol. (2016) 88:232–51. doi: 10.1111/jfb.12833
53. Ozolina K, Shiels HA, Ollivier H, Claireaux G. Intraspecific individual variation of temperature tolerance associated with oxygen demand in the European sea bass (Dicentrarchus labrax). Conserv Physiol. (2015) 4:1–10. doi: 10.1093/conphys/cov060
54. Rodde C, de Verdal H, Vandeputte M, Allal F, Nati J, Besson M, et al. An investigation of links between metabolic rate and feed efficiency in European sea bass Dicentrarchus labrax. J Anim Sci. (2021) 99:152. doi: 10.1093/jas/skab152
55. Rodde C, Vandeputte M, Allal F, Besson M, Clota F, Vergnet A, et al. Population, temperature and feeding rate effects on individual feed efficiency in European sea bass (Dicentrarchus labrax). Front Mar Sci. (2020) 7:851. doi: 10.3389/fmars.2020.578976
56. McKenzie DJ, Zhang Y, Eliason EJ, Schulte PM, Blasco FR, Claireaux G, et al. Intraspecific variation in tolerance of warming in fishes. J Fish Biol. (2020) 98:1536–55. doi: 10.1111/jfb.14620
57. Killen SS, Christensen EAF, Cortese D, Závorka LZ, Norin T, Cotgrove L, et al. Guidelines for reporting methods to estimate metabolic rates by aquatic intermittent-flow respirometry. J Exp Biol. (2021) 224:jeb242522. doi: 10.1242/jeb.242522
58. Steffensen JF. Some errors in respirometry of water breathers: how to avoid and correct for them. Fish Physiol Biochem. (1989) 6:49–59. doi: 10.1007/BF02995809
59. McKenzie DJ, Vergnet A, Chatain B, Vandeputte M, Desmarais E, Steffensen JF, et al. Physiological mechanisms underlying individual variation in tolerance of food deprivation in juvenile European sea bass, Dicentrarchus labrax. J Exp Biol. (2014) 217:3283–92. doi: 10.1242/jeb.101857
60. Svendsen MBS, Bushnell PG, Christensen EAF, Steffensen JF. Sources of variation in oxygen consumption of aquatic animals demonstrated by simulated constant oxygen consumption and respirometers of different sizes. J Fish Biol. (2016) 88:51–64. doi: 10.1111/jfb.12851
61. Lemarié G, Gasset E, Cam D, Fonchais de la E. Modélisationde la consommation en oxygène du loup (Dicentrarchus labrax L.) et la daurade (Sparus auratus L.). Ichtyophysiol Acta. (1992) 15:55–68.
62. Chabot D, Steffensen JF, Farrell AP. The determination of standard metabolic rate in fishes. J Fish Biol. (2016) 88:81–121. doi: 10.1111/jfb.12845
63. Bell WH, Terhune LDB. Water tunnel design for fisheries research. Fish Resour Board Can Tech Rep. (1970) 195:1–69.
64. Pickett GD, Pawson MG. Sea Bass Biology, Exploitation and Conservation. London: Chapman and Hall (1994).
65. Mucha S, Chapman LJ, Krahe R. Normoxia exposure reduces hemoglobin concentration and gill size in a hypoxia-tolerant tropical freshwater fish. Environ Biol Fishes. (2023) 106:1405–23. doi: 10.1007/s10641-023-01427-9
66. Somo DA, Chu K, Richards JG. Gill surface area allometry does not constrain the body mass scaling of maximum oxygen uptake rate in the tidepool sculpin, Oligocottus maculosus. J Compar Physiol B. (2023) 193:425–38. doi: 10.1007/s00360-023-01490-9
67. Ekström A, Hendriks B, Van Wert JC, Gilbert MJH, Farrell AP, Cooke SJ, et al. Impairing cardiac oxygen supply in swimming coho salmon compromises their heart function and tolerance to acute warming. Sci Rep. (2023) 13:21204. doi: 10.1038/s41598-023-47713-5
68. Somo DA, Chu K, Richards JG. Aerobic scope falls to nil at P. crit and anaerobic ATP production increases below P. crit in the tidepool sculpin, Oligocottus maculosus. Biol Lett. (2022) 18:20220342. doi: 10.1098/rsbl.2022.0342
69. Nati JJH, Malorey P, Gamperl AK. Near-maximally swimming schoolmaster snapper (Lutjanus apodus) have a greater metabolic capacity, and only a slightly lower thermal tolerance, than when tested at rest. J Exp Biol. (2024) 227:jeb249273. doi: 10.1242/jeb.249273
70. Farrell AP, Clutterham SM. On-line venous oxygen tensions in rainbow trout during graded exercise at two acclimation temperatures. J Exp Biol. (2003) 206:487–96. doi: 10.1242/jeb.00100
71. McKenzie DJ, Claireaux G. The effects of environmental factors on the physiology of aerobic exercise. In:Domenici P, Kapoor BG, , editors. Fish Locomotion: An Eco-ethological Perspective. Boca Raton, FL: CRC Press (2010). p. 308–344.
72. FAO. The State of World Fisheries and Aquaculture 2022. Towards Blue Transformation. Rome: FAO (2022). doi: 10.4060/cc0461en
73. R Core Team. R: A Language and Environment for Statistical Computing. Vienna (2018). Available online at: https://www.R-project.org/
Keywords: CTSmax, hypoxia, regulation index, standard metabolic rate, Scrit, warming, European seabass
Citation: Nati JJH, Rodde C, Blasco FR, Salou G, Vergnet A, de Verdal H, Vandeputte M, Allal F and McKenzie DJ (2025) Patterns of inter-populational and inter-individual variation in tolerance of sublethal progressive hypoxia and warming in the European seabass Dicentrarchus labrax. Front. Fish Sci. 3:1542342. doi: 10.3389/frish.2025.1542342
Received: 09 December 2024; Accepted: 06 June 2025;
Published: 11 July 2025.
Edited by:
Christel Lefrancois, UMR7266 Littoral, Environnement et Sociétés (LIENSs), FranceReviewed by:
Stephen T. Kinsey, University of North Carolina Wilmington, United StatesTakaaki Abe, Nihon University, Japan
Carlos Díaz-Gil, Xelect, Ltd., United Kingdom
Copyright © 2025 Nati, Rodde, Blasco, Salou, Vergnet, de Verdal, Vandeputte, Allal and McKenzie. This is an open-access article distributed under the terms of the Creative Commons Attribution License (CC BY). The use, distribution or reproduction in other forums is permitted, provided the original author(s) and the copyright owner(s) are credited and that the original publication in this journal is cited, in accordance with accepted academic practice. No use, distribution or reproduction is permitted which does not comply with these terms.
*Correspondence: Julie J. H. Nati, anVsaWVuYXRpM0BnbWFpbC5jb20=; David J. McKenzie, ZGF2aWQubWNrZW56aWVAY25ycy5mcg==