 Henrik Svedäng1,2*†
- 1Baltic Sea Centre, Stockholm University, Stockholm, Sweden
- 2Swedish Institute for the Marine Environment (SIME), Gothenburg University, Göteborg, Sweden
Almost 50 years ago, the first signs of population decline in the European eel (Anguilla anguilla) were observed when upstream migration of yellow eel and catches of silver eel decreased in the Baltic Sea. Since then, the decline in recruitment has continued throughout the eel's range, and many indices based on early life stages are now hovering at extremely low levels. Consequently, the European eel is considered critically endangered, which has been linked to overfishing and habitat destruction, including barriers, spread of parasites, contaminants, and climate change. Measurements of European eel escapement are considered difficult to obtain because return sea migrations occur diffusely from all possible coasts, including marine habitats. Currently, the main source of data is the reported commercial landings data, which are subject to several uncertainties. Such uncertainties make evaluating stock status and the efficiency of eel management plans (EMPs) difficult. In this study, data on eel catches are presented from fishery independent international trawl surveys, which often is a more consistent data source than fisheries-dependent data (i.e., tag returns and landing reports from commercial fisheries). The trawl survey data presented here show drastic declines in eel abundance over the last 30–35 years throughout the Baltic Sea, the Kattegat, and the southern North Sea both regardless of size and in the group of larger eels (≥50 cm). This decline in abundance of larger eels calls into question the effectiveness of national EMPs and the future of the European eel.
Introduction
European eel has been a matter of concern for a long time, but where are we?
The difficulty of assessing the threat of extinction of various species increases as the species becomes rarer. The International Union for Conservation of Nature criteria for assessing threat category are, in most cases, based on the ability to detect changes in abundance over three generations [e.g., (1)]. The quantification of the threat status of commercial fish species is regularly based on abundance indices, as there is rarely any assessment of changes in range or actual numbers. Due to the inability to detect changes in, for example, catch per unit effort (CPUE) at low levels, it may give rise to complacency in a “post-truth” world (2); absent evidence, uncertainty in assessments will not promote a precautionary approach to risk management, while increased uncertainty should, on the contrary, be seen as increased risk of extinction (3).
Half a century ago, the Swedish fisheries biologist Svärdson (4) observed an alarming development in the European eel (Anguilla anguilla) stock when he found that eel recruitment to Swedish inland waters and catches of eel along the Swedish Baltic coast were decreasing drastically. Since then, the status of the European eel has been viewed with increasing concern (5–8). Currently, the WGEEL (Working Group on Eels) (Joint European Inland Fisheries Advisory Commission; EIFAAC)/International Council for the Exploration of the Sea (ICES)/ General Fisheries Commission for the Mediterranean (GFCM) Working Group on Eels notes that the European eel's status remains critical, clarifying that “time series from 1980 to 2024 show that glass eel recruitment remains at a very low level,” that is, 93%−99% reductions in recruitment indices in Europe (9).
It has been suggested that the drivers of the decline are linked to, for instance, fishing at different life stages, loss of inland connectivity due to river constructions, parasites, pollution, and climate change [(9) and references therein]. Fisheries statistics, that is, the combined commercial catches of glass, yellow, and silver eel, indicate landing decreases of ~80% since the 1960s, that is, from ~10,000 tons to ~2,000 tons by 2023 (ICES, op. cit.). For 30 years, scientists have been urgently calling for better protection of the European eel [e.g., Quebec Declaration: (10)]. For example, ICES recommended in 2008 (56) “that all exploitation and other anthropogenic effects on eel production and escapement should be reduced to as close to zero as possible, until stock recovery has been achieved.” This statement was reinforced (7) as “ICES recommends that, applying the precautionary principle, there should be zero catches in all habitats by 2022. This applies to both recreational and commercial catches and includes catches of glass eel for restocking and aquaculture. All other anthropogenic mortalities should be minimized and eliminated where possible”.
The recovery plan for the European eel stock, as described in EU Council Regulation No 1100/2007 (11), has thus left member states relatively free to decide on the development of national eel management plans (EMPs), which has created the possibility of different approaches within the framework of the common fisheries policy (12). However, the EMPs have still not resulted in any significant improvement in the many recruitment indices examined (9).
At this critical time for the European eel, monitoring the evolution in abundance of larger yellow eel/silver eel life stages is of utmost interest. The current uncertainty about the effectiveness of various conservation measures stems from the fact that only recruitment estimates are used for describing stock status [e.g., (9)] when the overall management objective is to increase eel escapement and thus the spawning biomass in the Sargasso Sea. As no further declines in recruitment have been clearly demonstrated after 2011, eel recruitment is interpreted to have entered a phase of semi-stability, albeit at previously unprecedented low levels (9). By comparison, previous sufficient abundance to monitor stock status does not necessarily mean that current indices can qualify for trend analysis when recruitment is only about 1% of the level of a few decades ago. Trend analysis at such low levels may be too close to the shifting baseline syndrome (13).
Estimates of downstream eel migration are possible in some watercourses [e.g., (14)]. As many such measurements are often based on translocated eels (15, 16), where the restocked eels often originate from geographically distant areas, the actual value of the release for eel reproduction can be questioned [cf. (17)]. The informative value of the eel stock status in terms of the natural rate of escapement (escapement of not naturally recruited eel) can therefore be questioned. However, measurements of silver eel migration, or at least the occurrence of large eels, that is, then they are close to start maturing, at sea, could support the evaluation of EMPs and provide more accurate assessments of eel stock status for entire sea areas, as stocking rate was low already 30 years ago (18, 19), and has been kept at low levels since the turn of the century [e.g., (9)]. Because most eel recruitment indices are based on river catches, they may not accurately reflect the evolution of stock status as coastal waters in Northern Europe may be more important as growth habitat for yellow eel than inland waters [e.g., (20), and references therein].
ICES bottom trawl surveys [i.e., ICES Database on Trawl Surveys (DATRAS) (21), https://datras.ices.dk] may provide such an opportunity to obtain indices of eel abundance in regional sea areas, although the surveys were developed with the aim of monitoring other demersal species such as gadoids and flatfishes rather than European eel. Notably, eels are more likely to be caught during the second part of the year (i.e., the third and fourth quarters of the year, Q3 and Q4) than during the winter period [the first quarter, Q1; (22) and references therein]. Furthermore, gear selectivity [e.g., (23)] and catch handling procedures must also be taken into account to ensure that the presence of eel at the seafloor is detectable and accurately documented. However, spatial considerations were ignored as the suitability of trawl surveys was determined by the presence of eel in the time series of surveys.
Aim of the study
This study aims to investigate trends in time series of eel catches in ICES fishery-independent bottom trawl surveys in Northern European coastal waters. Furthermore, the study intends to use such indices of eel abundance, that is, CPUE, for evaluating the development of the eel stock at a regional level such as the Baltic Sea. Finally, the results are discussed in relation to current stock status and risk assessments at international, European Union, and national levels, including EMP outcomes.
Materials and methods
Data sources
Information on European eel catch per unit effort (CPUE) by length group and haul (number per trawling hour; no*h−1) was retrieved from ICES Database on Trawl Surveys (DATRAS, 2024-12-06, ICES, Copenhagen, Denmark. https://datras.ices.dk) for all bottom and beam trawl surveys in the Baltic Sea, the Skagerrak, the Kattegat, the North Sea, the English Channel, the Celtic Sea, the Irish Sea, the Bay of Biscay, and the Eastern Atlantic (Figure 1).
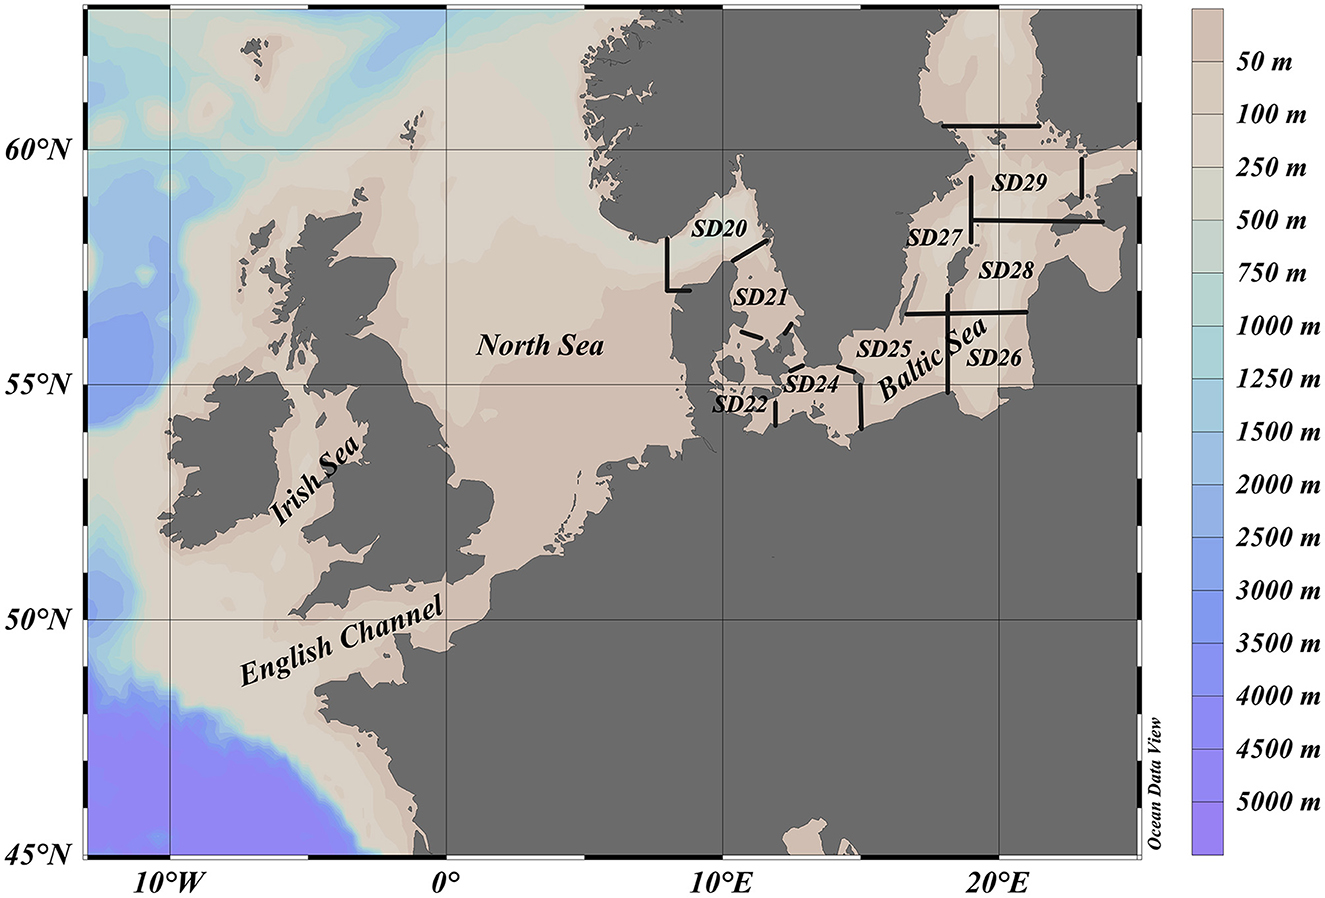
Figure 1. The study area for all bottom and beam trawl surveys in the Baltic Sea, the Skagerrak, the Kattegat, the North Sea, the English Channel, the Celtic Sea, and the Irish Sea, which are included in DATRAS (ICES Database on Trawl Surveys, https://datras.ices.dk) and used in this study. ICES subdivision 20 (SD20) corresponds to the Skagerrak and ICES subdivision 21 (SD21) the Kattegat.
The exploration of standardized trawl surveys was based on whether consistent time series could be retrieved on eel CPUE; that is, the time series contained (a) continuous length records of all fish species, (b) eel catches were made in trawls with sufficiently small mesh sizes to catch eels at least ~50 cm in length (23), (c) no assumption was made on whether the caught eels were in yellow or silver eel stage because no such records were kept. Thus, no statement was made on whether the eels were migrating or foraging. Seven surveys [BITSQ1 (Baltic International Trawl Survey first quarter), BITSQ4 (Baltic International Trawl Survey fourth quarter), NS-IBTSQ1 (North Sea International Bottom Trawl Survey first quarter), NS-IBTSQ3 (North Sea International Bottom Trawl Survey third quarter), BTS (Beam Trawl Survey), DYFS (International Demersal Young Fish Survey), and SNS (Sole Net Survey)] were included in the study with varying coverage between 1985 and 2024 (Figures 2–4; Table 1).
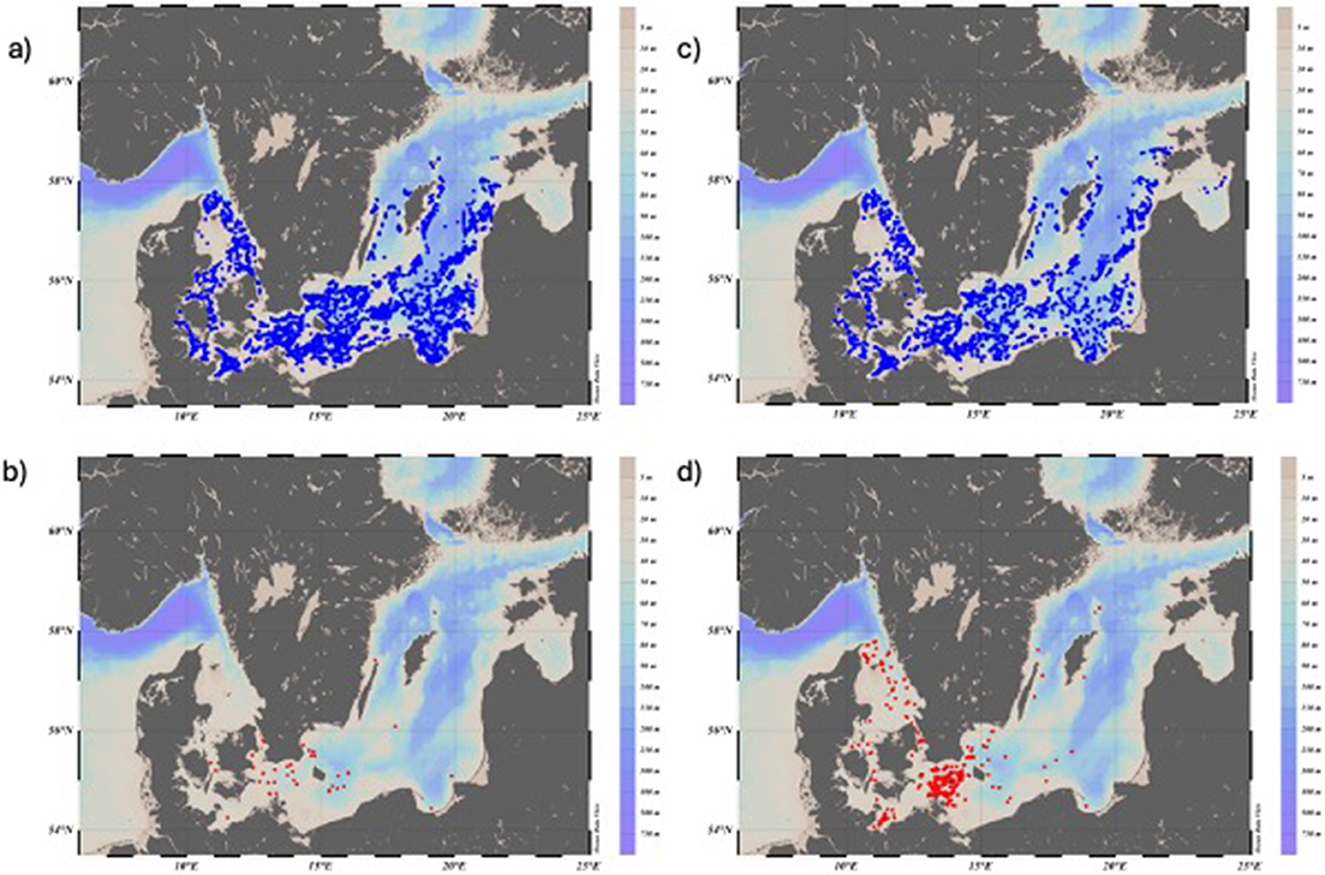
Figure 2. Map showing trawl locations in the Baltic International Trawl Survey (BITS). (a) All trawl hauls in Q1 between 1991 and 2024 with no catches of eel (A. anguilla) are marked in blue; (b) all hauls in Q1, where CPUE for eel ≥ 1 are marked in red; (c) all hauls in Q4 made between 1991 and 2023 with no catches of eel are marked in blue; and (d) all hauls in Q4 CPUE for eel ≥1 eel are marked in red.
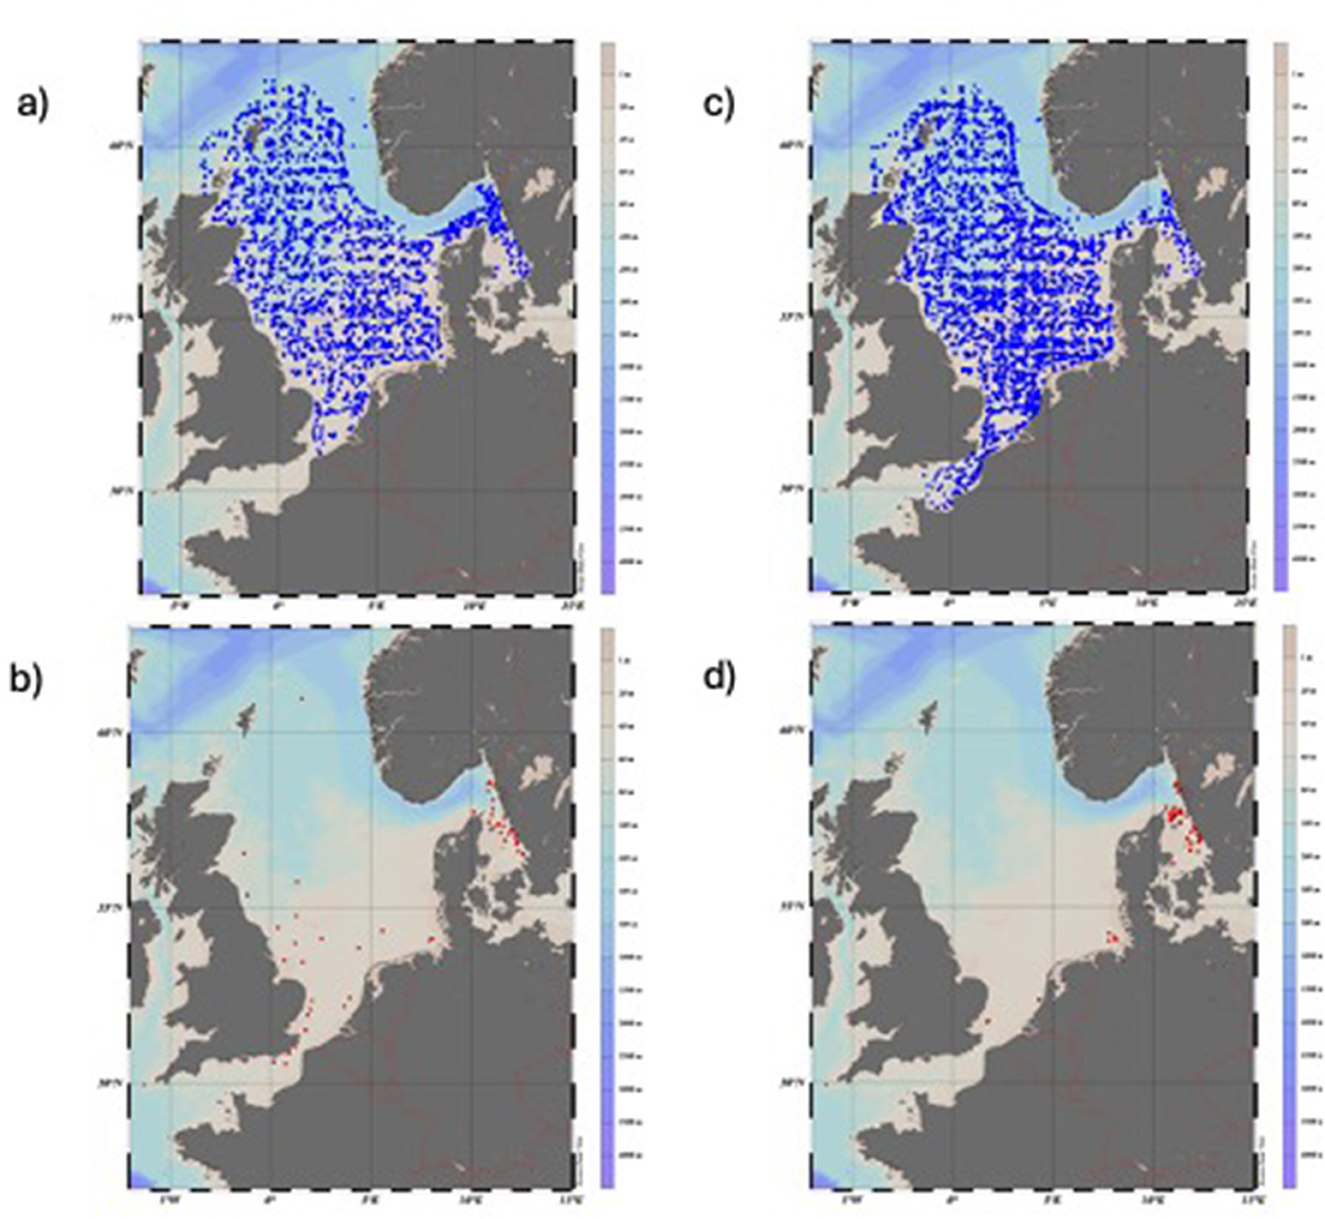
Figure 3. Map showing trawl locations in the North Sea International Bottom Trawl Survey (NS-IBTS) between 1991 and 2024. (a) All trawl hauls in Q1 between 1991 and 2024 with no catches of eel are marked in blue; (b) all hauls in Q1, where CPUE for eel (A. anguilla) ≥ 1, are marked in red; (c) all hauls made in Q3 with no catches of eel are marked in blue; and (d) all hauls in Q3, where CPUE for eel ≥1 eel are marked in red.
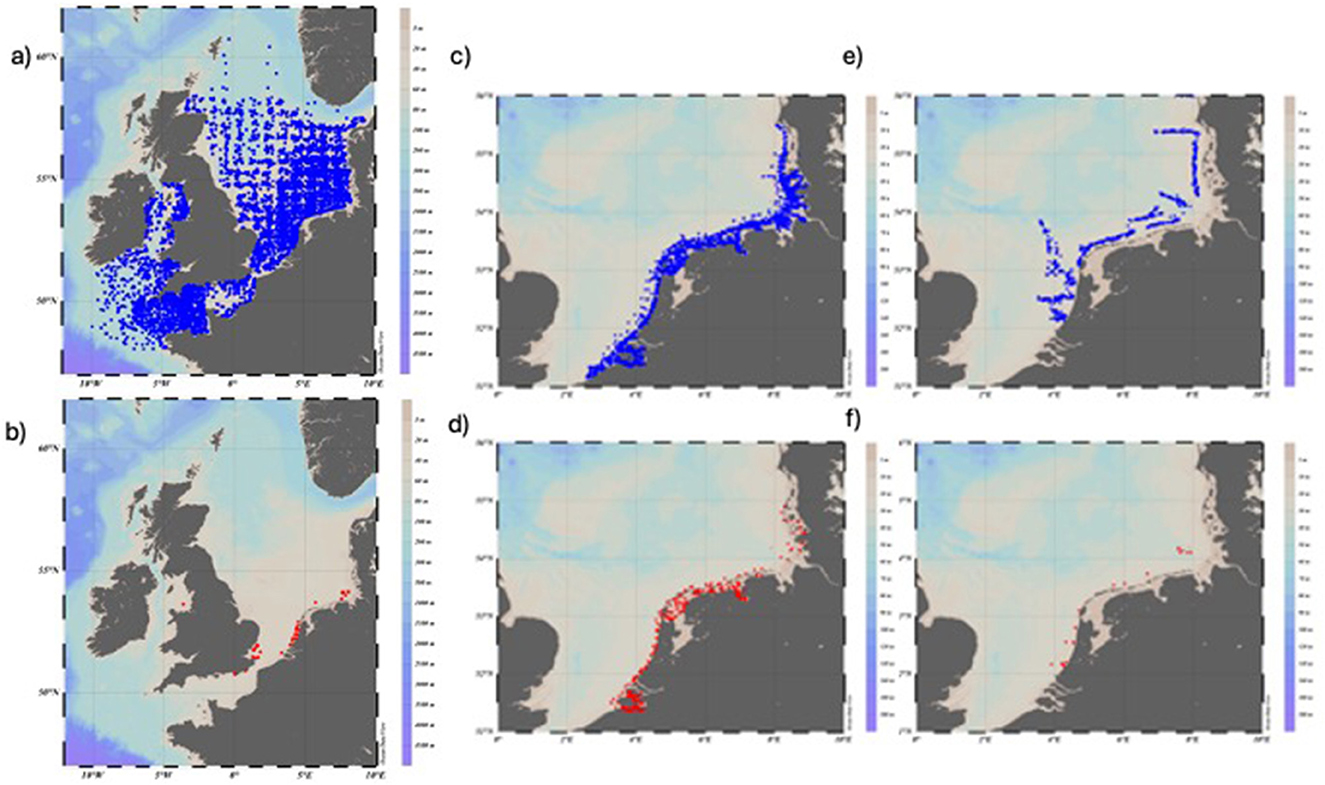
Figure 4. Map showing trawl locations in the North Sea: Beam Trawl Survey (BTS) in Q3 and Q4 combined between 1985 and 2023. (a) All made trawl hauls with no catches of eel are marked in blue; (b) all hauls where CPUE for eel (A. anguilla) ≥1 eel is marked in red. The international Demersal Young Fish Survey (DYFS) in Q3 and Q4 combined between 1985 and 2023. (c) All made trawl hauls with no catches of eel are marked in blue; (d) all hauls where CPUE for eel (Anguilla anguilla) ≥1 eel are marked in red. The Sole Net Survey (SNS) in Q3 and Q4 combined between 1985 and 2023. (e) All made trawl hauls with no catches of eel are marked in blue; (f) all hauls where CPUE for eel (A. anguilla) ≥1 eel is marked in red.
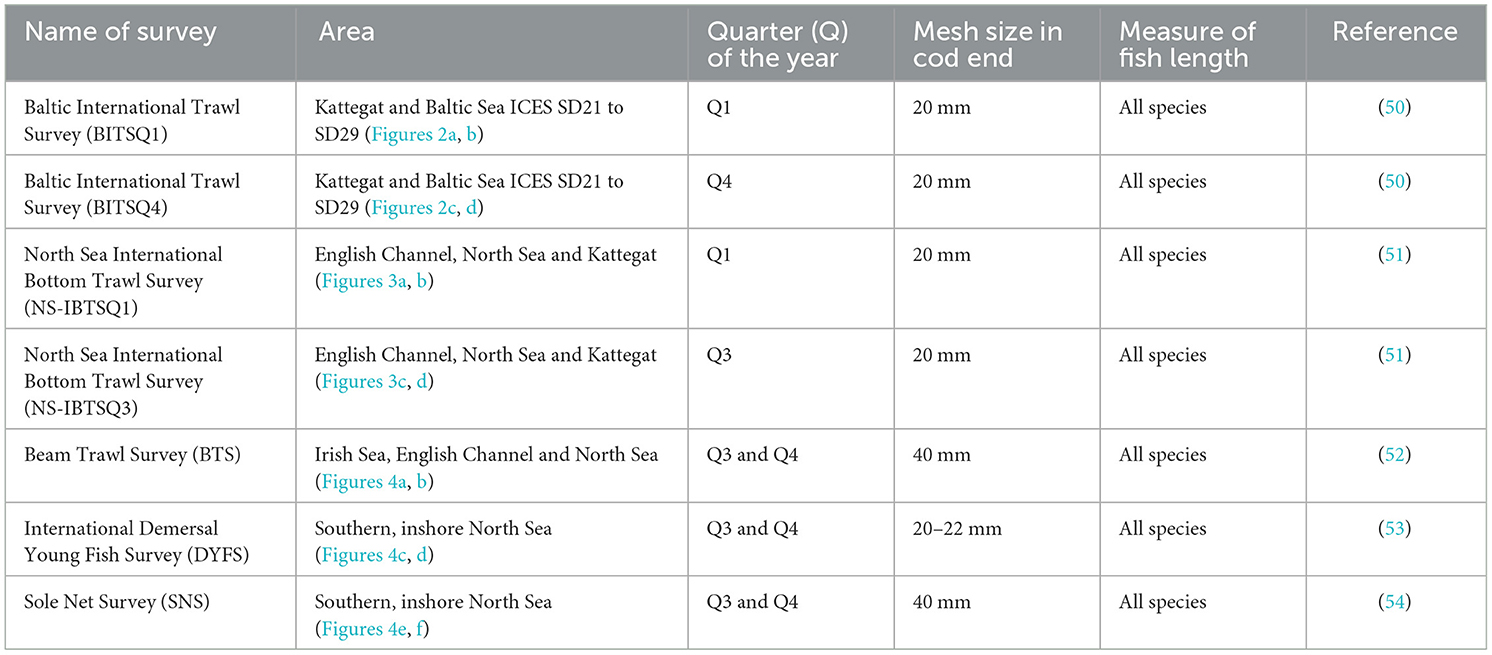
Table 1. Standardized trawl surveys included in the study, where consistent time series could be retrieved on eel CPUE over time.
Because mesh size in the cod end is likely to influence the catch size distribution, some assumptions must be made on the effects of differences between BITS, NS-IBTS, and DYFS, on one hand (mesh size ~20 mm), and BTS and SNS, on the other (~40 mm). The selectivity in fyke nets mesh size of 20 mm corresponds to 345 mm in fish length, over which all individuals are retained; for mesh size of 40 mm, the selectivity of ~0.5 corresponds above 500 mm (23).
However, the pressure on trawl cod end diamond meshes is different from that of fyke nets, which rest on the seafloor, leading to a higher retention of smaller eels in trawls. For comparison reasons, the recorded catch for each haul was hence divided between eels ≥50 cm and below this length limit for each trawl survey.
Other available bottom trawl surveys at DATRAS were omitted, because eel catch records were absent or almost absent (see Supplementary Table S1).
Information on eel landings in tons for Swedish Baltic coast, including the sound, between 1925 and 2022 was provided by Sweden Statistics through the Swedish University of Agriculture (Figure 5a).
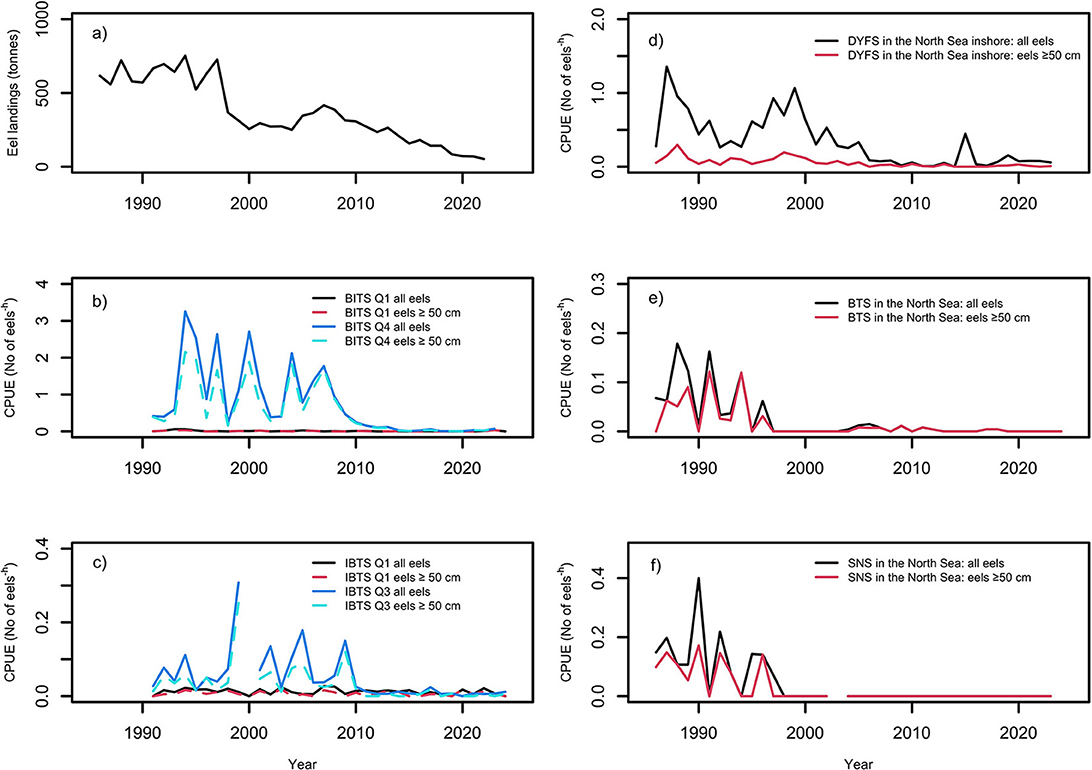
Figure 5. (a) Landings of eels (in tons) on the Swedish east coast 1925–2022 (provided by Sweden Statistics (SCB) through SLU). (b) Baltic International Trawl Survey (BITS) survey in between 1991 and 2024 for Q1 and between 1991 and 2023 for Q4: CPUE (no*h−1) of all eels, irrespectively of body length, and for eels ≥ 50 cm. (c) North Sea International Bottom Trawl Survey (NS-IBTS) survey in between 1991 and 2024 for Q1 and Q3: CPUE (no*h−1) of all eels, irrespectively of body length, and for eels ≥50 cm. (d) Beam Trawl Survey (BTS) survey between 1985 and 2024 for Q3 and Q4 combined: CPUE (no*h−1) of all eels, irrespectively of body length, and for eels ≥50 cm. The gap in the time series is due to a cancelation of the Swedish survey in the Kattegat and the Skagerrak in Q3 in 2000. (e) Demersal Young Fish Survey (DYFS) survey in between 1985 and 2023 for Q3 and Q4 combined: CPUE (no*h−1) of all eels, irrespectively of body length, and for eels ≥50 cm. (f) Sole Net Survey (SNS) survey in between 1985 and 2023 for Q3 and Q4 combined: CPUE (no*h−1) of all eels, irrespectively of body length, and for eels ≥ 50 cm. In 2003, no data were provided.
Statistical analysis
The distribution of all trawl hauls for each of the surveys with or without catches of eels (number ≥ 1) was visualized using Ocean Data View [(24); cf. Figures 2–4]. Annual mean CPUE (number per trawling hour; no*h−1) was estimated for all surveys, including all valid hauls in the nominator, regardless of location or depth. Visual inspection showed that the location of eel catches varied by longitude, as well as by depth, while less by latitude (Figures 2–4). Thus, each of the seven trawl surveys was analyzed separately as well as together. Differences in eel CPUE between surveys conducted in the same areas at different times of the year and therefore treated as separate trawl surveys (Table 1), that is, BITSQ1 vs. BITSQ4 and NS-IBTSQ1 vs. NS-IBTSQ3, respectively, were tested using the Wilcoxon rank-sum test with continuity correction within the stat package (version 4.4.1) in R (25).
Because the surveys were found to be dominated by zero catches for European eel, the effects of year, longitude depth, and mesh size on eel CPUE (no*h−1) were assessed by fitting zero-inflated negative binominal linear mixed effects models (glmm.zinb function) within the R package NBZIMM, version: 1.0 [cf. (26)], available in the public GitHub repository (http://github.com//nyiuab//NBZIMM; downloaded 2025-07-07). In the following model, the fixed effects of the variables Year and Longitude on eel CPUE were evaluated, with Depth treated as a random variable:
The analyses were repeated for both when all eels were included and for eels ≥ 50 cm. Because two different mesh sizes in the lift were used in the investigated surveys (Table 1), Model 1 was modified to include all seven surveys by including the fixed effects of the categorical variable Mesh size, that is, “small” and “large,” on eel CPUE:
To further examine the results of all surveys combined for eel ≥50 cm with similar gear selectivity covering the entire longitude spectrum present in the study, that is, with a small mesh size in the cod end, that is, 20 mm, GAM (Generalized Additive Models) analysis was performed using the R-script gam(), mgcv package version 1.9-3 (27) by applying the following model:
Finally, correlations between studied time series for eels ≥50 cm were tested using the non-parametric Spearman rho statistic, available in the R-script package Hmisc version 4.6 (28).
As the aim of this study was to evaluate the effects of introduced conservation measures on the abundance of larger eels, it was noted whether the abundance of larger eels (i.e., CPUE for eels ≥50 cm) had been affected since 2010.
Results
Distribution of eel catches and trends in surveys
BITSQ1 and BITSQ4 trawl hauls
The number and distribution of all trawl hauls in the Baltic, including the Kattegat, with or without catch of eel during Q1 and Q4, are shown in Table 2 and Figures 2a–d. Eels were caught in greater quantity and in more hauls in BITSQ4 than BITSQ1 (Figure 5b, Wilcoxon rank-sum test with continuity correction, W = 82.5, p = 1.8e-09) and occurred to a greater extent in the Kattegat and the western Baltic than in the rest of the Baltic Sea (Figures 2b, d). The fixed effects of the variables Year and Longitude on CPUE (no*h−1), when Depth was treated as a random variable, were highly significant in both cases, when all eel catches were included and for catches of eels ≥50 cm in both surveys (GLMM-ZINB (Generalized Linear Mixed Models – Zero-Inflated Negative Binomial): Tables 3a, b). There was no sign of recovery or stabilization since 2010.
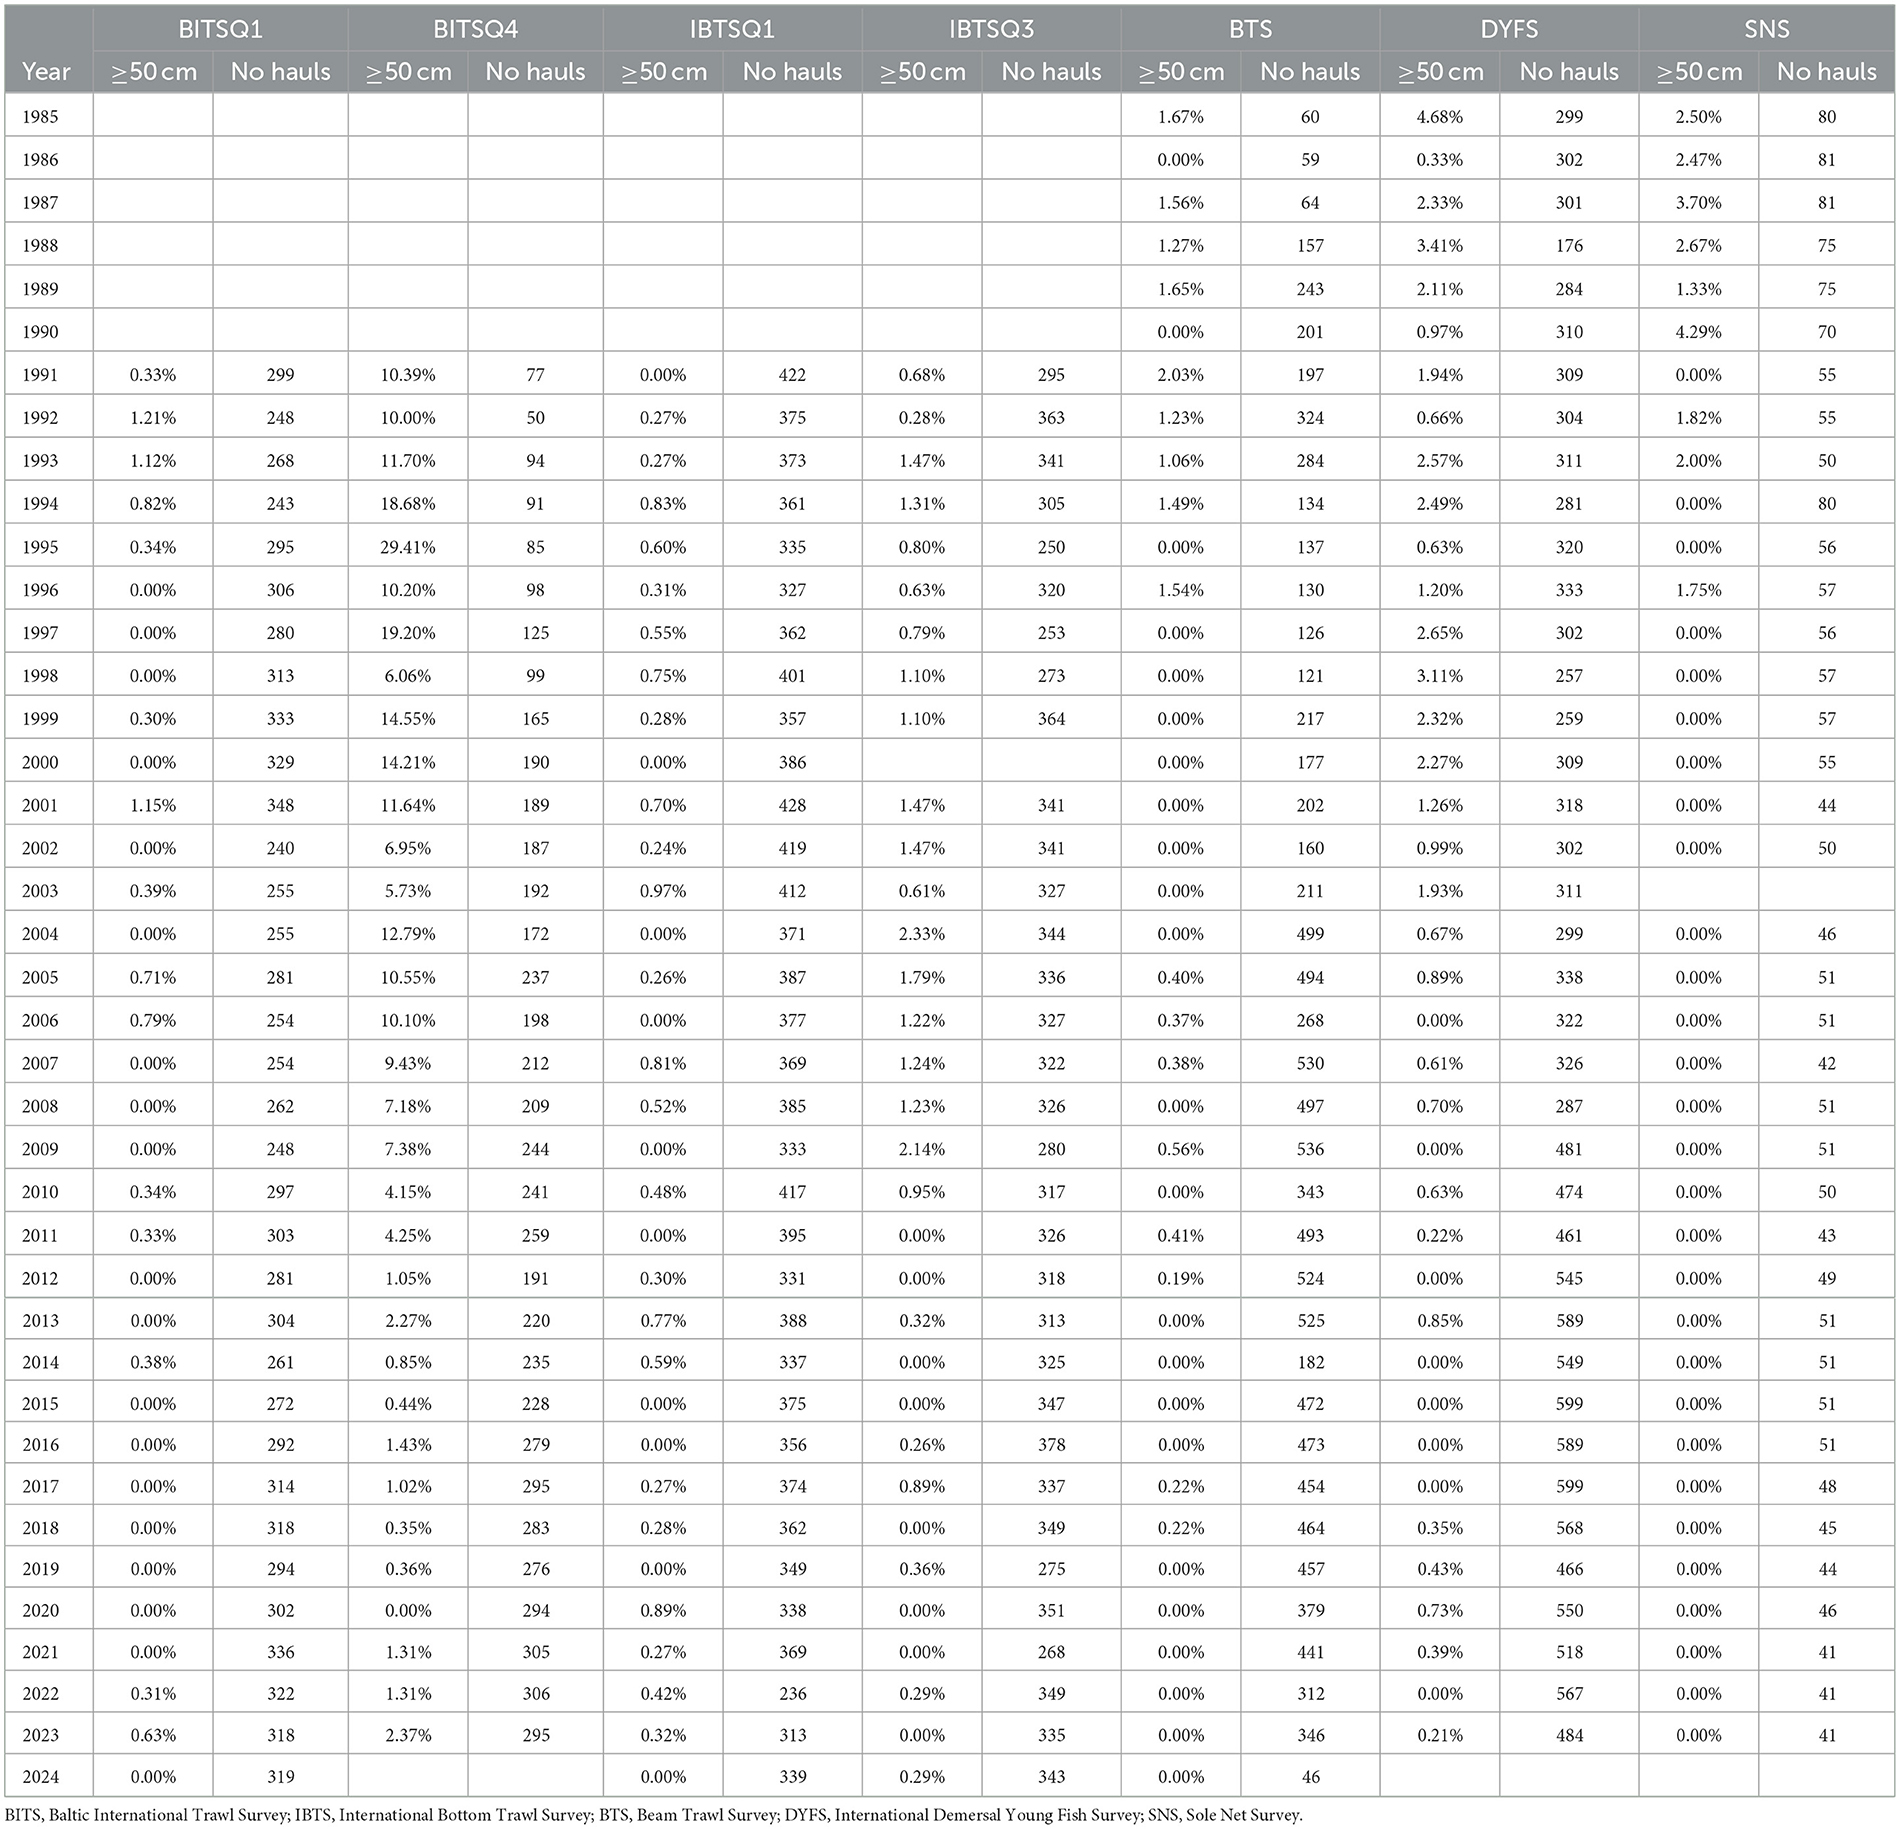
Table 2. All surveys included in the study: the annual percentage of hauls with catches (≥1) of large eels (≥50 cm) and the total number of hauls per survey.
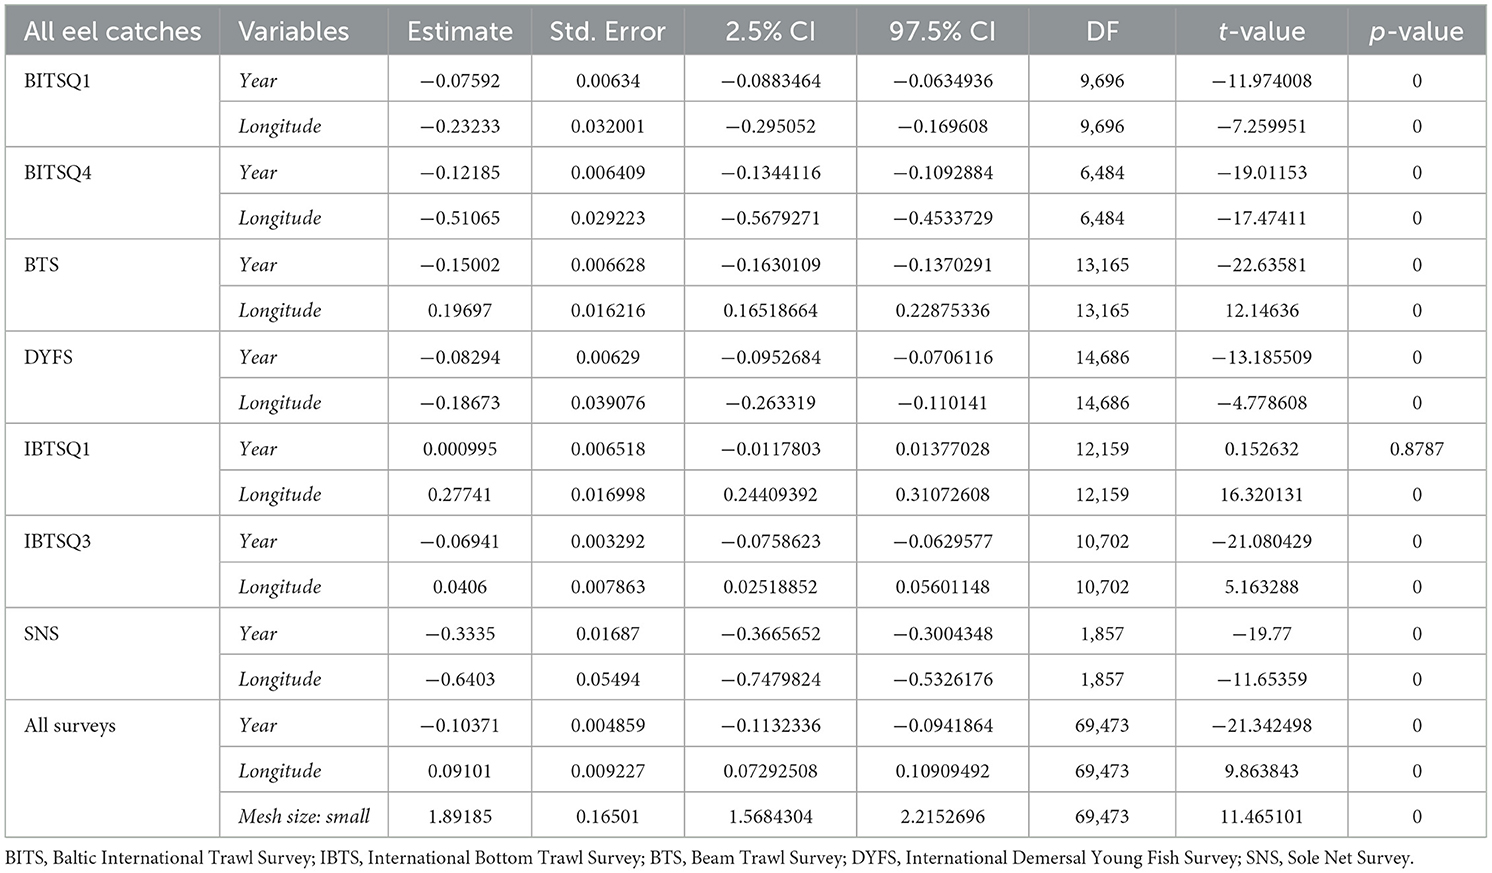
Table 3a. Results of generalized linear zero-inflated negative binominal mixed effects models (using glmm.zinb function) for seven trawl surveys treated separately (BITSQ1, BITSQ4, NS-IBTSQ1, NS-IBTSQ3, BTS, DYFS, and SNS): CPUE= (Year + Longitude, random = ~ 1|Depth), where all eel catches regardless of body length was the dependent variable (CPUE; no*h−1), and Year and Longitude were fixed effects and Depth was treated as random effects. Then all surveys were combined, the model included the fixed effects of the categorical variable Mesh size, that is, “small” and “large” mesh size in the cod end according to the model CPUE= (Year + Longitude + Mesh size, random = ~ 1|Depth).
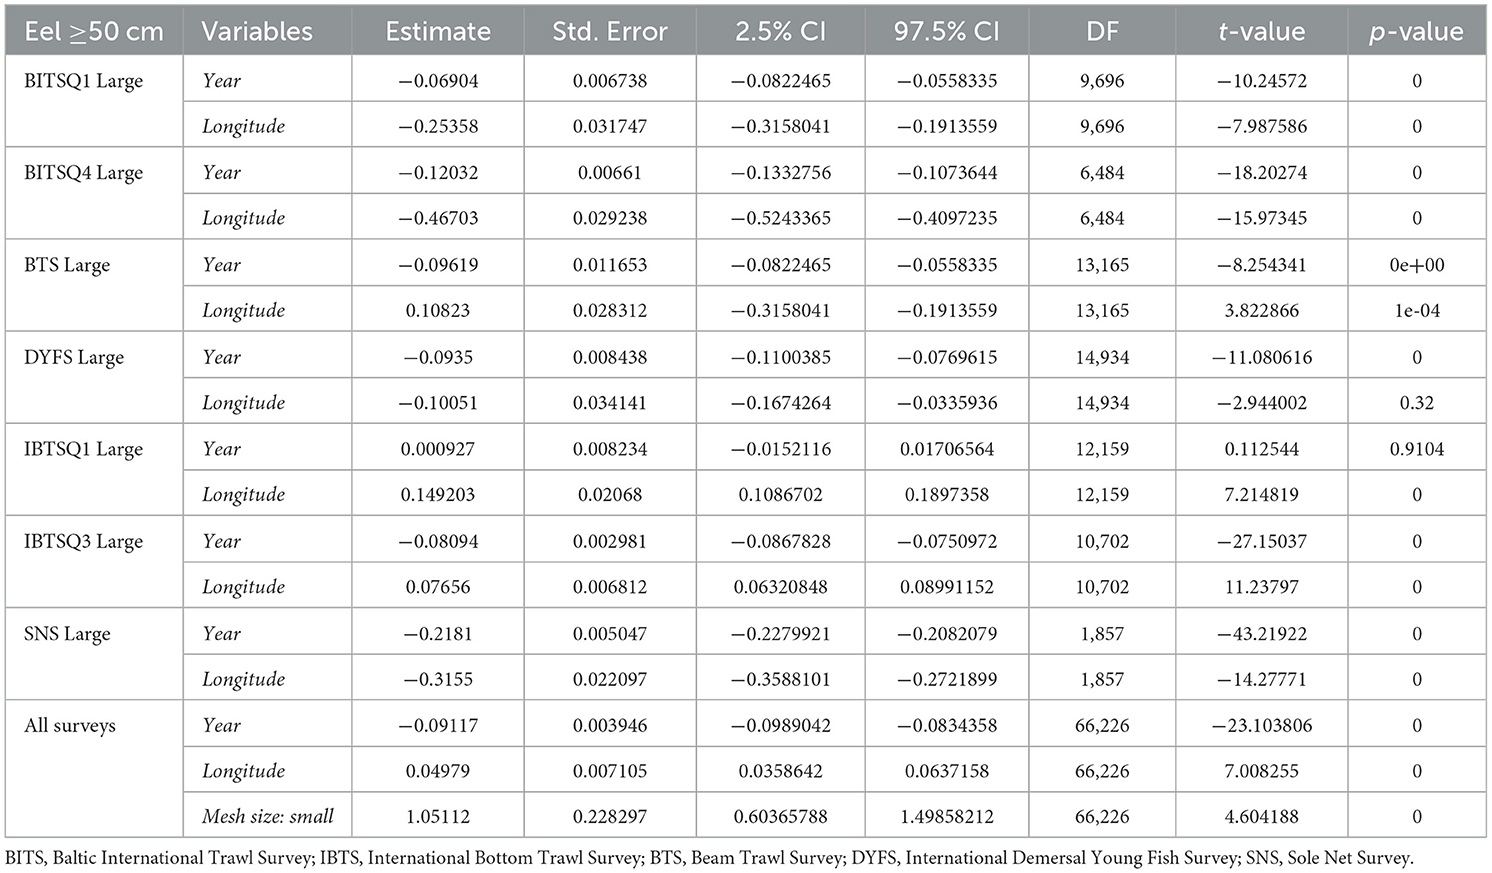
Table 3b. Results of generalized linear zero-inflated negative binominal mixed effects models (using glmm.zinb function) for seven trawl surveys treated separately (BITSQ1, BITSQ4, NS-IBTSQ1, NS-IBTSQ3, BTS, DYFS, and SNS): CPUE= (Year + Longitude, random = ~ 1|Depth), where eel catches only included larger eels (≥50 cm) was the dependent variable (CPUE; no*h−1), and Year and Longitude were fixed effects and Depth was treated as random effects. Then all surveys were combined, the model included the fixed effects of the categorical variable Mesh size, that is, “small” and “large” mesh size in the cod end according to the model CPUE = (Year + Longitude + Mesh size, random = ~ 1|Depth).
NS-IBTSQ1 and NS-IBTSQ3 trawl hauls
The number and distribution of trawl hauls in NS-IBTSQ1 and NS-IBTSQ3 in the North Sea, including the Kattegat and the Skagerrak, with or without eel catches, are shown in Table 2 and Figures 3a–d. The abundance of eels in the surveys was also higher in the Kattegat and the Skagerrak, while eel catches were almost absent in the rest of the North Sea except along the southern North Sea coast. CPUE was higher in NS-IBTSQ3 than in NS-IBTSQ1 (Figure 5c; Wilcoxon rank-sum test with continuity correction, W = 311, p < 0.0017). The fixed effects of the variables Year and Longitude on CPUE (no*h−1), while treating Depth as a random variable, were highly significant in both cases, when all eel catches were included and for catches of eels ≥50 cm in NS-IBTSQ3, while no Year effect was indicated in NS-IBTSQ1 (GLMM-ZINB: Tables 3a, b). There was no sign of either recovery or stabilization of the CPUE level after 2010.
BTS in Q3 and Q4 combined
The combined number and distribution BTS trawl hauls in Q3 and Q4, with and without eel catches, in the North Sea, the English Channel, and the Irish Sea are shown in Table 2 and Figures 4a, b. Eel catches in the BTS survey were mostly found in the coastal waters of the southern North Sea. Over time, eel catches declined to almost nil around the turn of the century (Table 2, Figure 5d). The fixed effects of the variables Year and Longitude on CPUE, while treating Depth as a random variable, were strongly significant for all eels included and eels ≥50 cm (GLMM-ZINB: Tables 3a, b). No recovery of the CPUE level could be evidenced after 2010, as eel catches had already declined 25 years ago to almost nil.
DYFS in Q3 and Q4 combined
The combined number and distribution DYFS trawl hauls in Q3 and Q4, with and without eel catches, along the southern North Sea coast are shown in Table 2, Figures 4c, d. The eel catches in the survey were found close to the coast of the southern North Sea. The fixed effects of Year on CPUE, treating Depth as random variable, were strongly significant in both cases, when all eel catches were included and for catches of eels ≥50 cm, while the Longitude effect was only significant in the case when all eel catches were included (Figure 5e; GLMM-ZINB: Tables 3a, b). There is no sign of a recovery in the CPUE level, which has remained low since 2010.
SNS in Q3 and Q4 combined
The combined number and distribution SNS trawl hauls in Q3 and Q4, with and without eel catches, along the southern North Sea coast are shown in Table 2 and Figures 4e, f. Eel catches are closer to the coast compared to the overall distribution of hauls. The fixed effects of Year and Longitude on CPUE, while treating Depth as a random variable, were highly significant for in both cases, when all eel catches were included and for catches of eels ≥50 cm (Figure 5f; GLMM-ZINB: Tables 3a, b). There was no evidence of CPUE-level recovery after 2010, as eel catches had already declined ~25 years ago to almost zero.
All surveys combined
The fixed effects of all three variables, Year, Longitude, and Mesh size, on CPUE when all surveys were combined, while treating Depth as a random variable, were highly significant in both cases, when all eel catches were included and for catches of eels ≥50 cm (GLMM: Tables 3a, b). The GAM modeling for catches of eels ≥50 cm in the trawl surveys using a small mesh size (20 mm in the cod end) shows the effects of Year, Longitude, and Depth graphically, with all variables being highly significant (Figure 6, Supplementary Table S2).
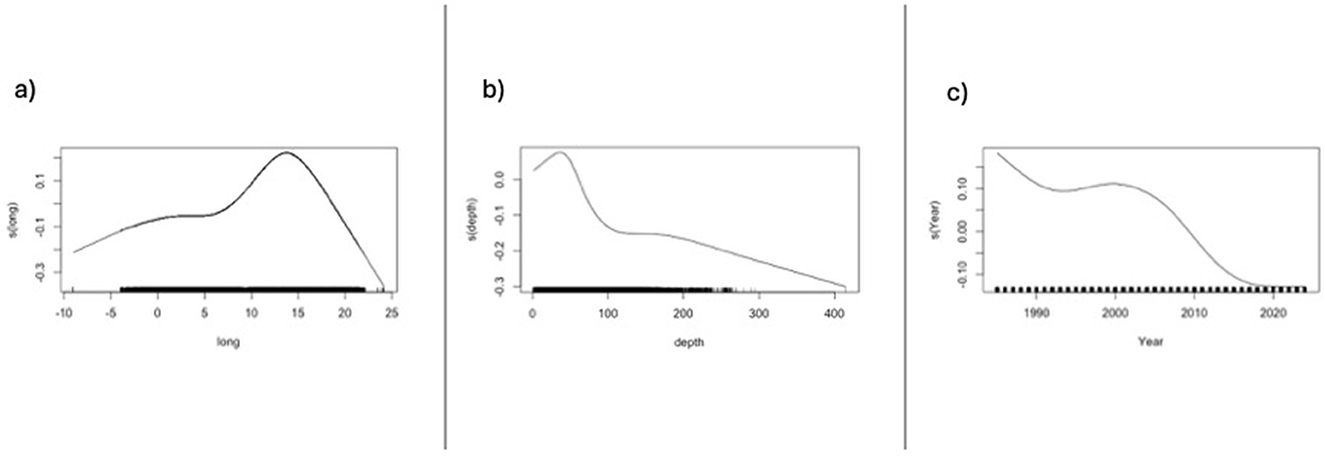
Figure 6. GAM modeling results of surveys combined with small mesh size in the cod end, that is, 20 mm, and where catches of eel ≥50 cm: (a) depth effects; (b) longitude effects; (c) year effects.
Correlation between survey indices for eels ≥50 cm and Swedish eel coast landings
Correlation matrix (Spearman rho, p-value, and number of observations) between years, total annual Swedish Baltic eel landings, average annual CPUE (number per trawling hour; no*h−1) are shown in Table 4 for large eels (≥50 cm) in surveys BITSQ1 and BITSQ4, NS-IBTSQ1 and NS IBTSQ3, BTS, DYFS, and SNS. All indices, except BITSQ1 and NS-IBTSQ1, were negatively correlated to year. Swedish Baltic eel landings were well correlated with all other indices except the NS-IBTSQ1. The surveys BITSQ4, NS-IBTSQ3, and DYFS were well correlated to each other. While the BTS, DYFS, and SNS were rather well correlated to each other, however between the BTS and the DYFS only at p < 0.10, indicating a partially differentiated development in annual CPUE over time between indices from the Baltic/Kattegat and the southern North Sea (see also Figures 5a–f).
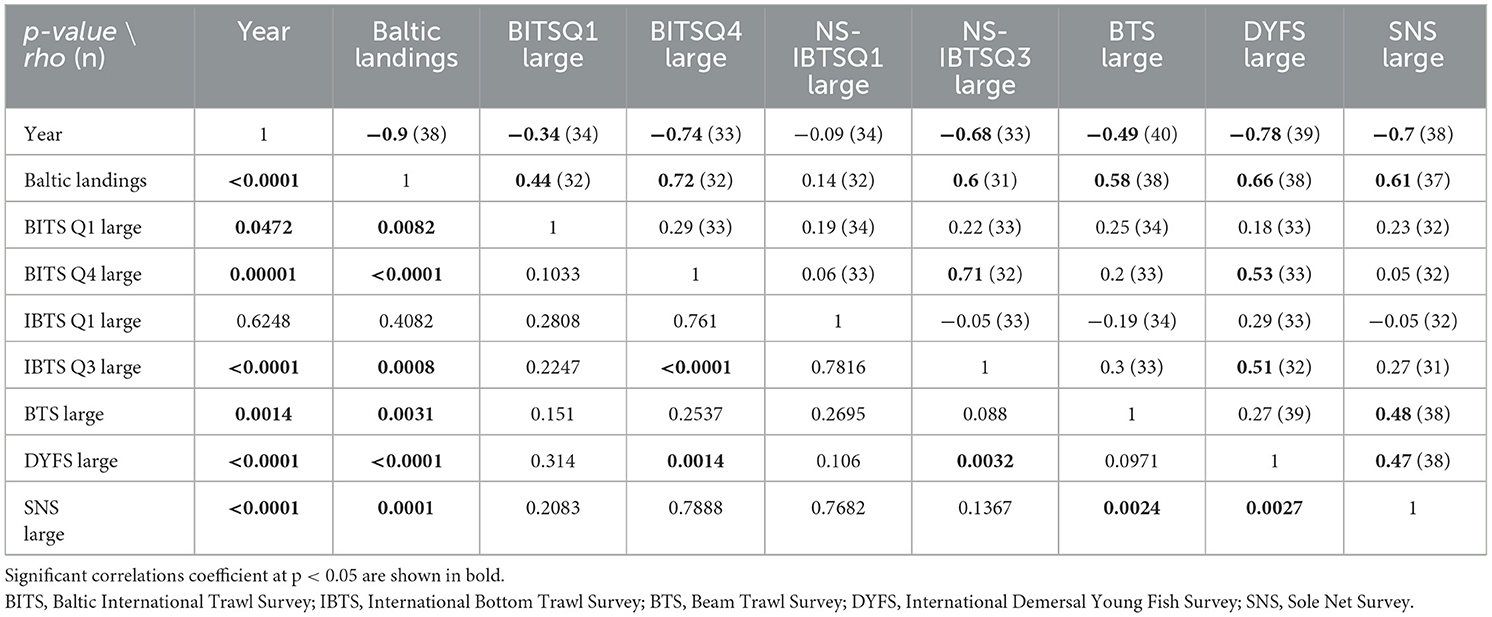
Table 4. Correlation matrix (Spearman rho: p-value below diagonal; rho correlation coefficient above, number of observations within parenthesis) between year of monitoring, total annual landings of eels on the Swedish Baltic coast (SD23–25, SD27–31, see Figure 1), mean annual CPUE (no*h−1) of large eels (≥50 cm) in the surveys BITSQ1, BITSQ4, NS-IBTSQ1, NS-IBTSQ3, BTS, DYFS, and SNS.
All surveys have similar patterns regardless of whether all size groups were included or only fish ≥50 cm were selected (Figures 5a–f). However, the BTS and SNS surveys showed the largest differences between the two size groups (Figures 5d, f), with relatively lower representation of fish ≥50 cm compared to smaller size groups. Because the mesh size in the cod end was larger in the BTS and SNS surveys compared to the other surveys (40 mm vs. 20 mm), the presence of smaller eels may have been even higher than depicted by the surveys.
Discussion
Here, the evolution in eel abundance is described and followed over extensive areas of Northern European coastal waters at a critical time for the future of European eel. All surveys in this study, except the IBTSQ1, despite large annual fluctuations at the beginning of some of the time series, showed significant negative trends in CPUE, that is, number of eels caught per trawling hour (no*h−1), regardless of whether they included all size groups (the yearly decline in CPUE varied between −0.069 and −0.333) or solely contained fish ≥50 cm (the yearly decline in CPUE varied between −0.069 and −0.218; Table 3, Figure 5). The pooled surveys indicated an annual decline of ~-0.10 in CPUE. The effects of longitude, although significant for all surveys except one (DYFS Large), showed both positive and negative trends in the surveys. The GAM modeling for surveys with small mesh sizes indicated a unimodal gradient in the eel catches (Figure 6).
The variation in CPUE between years (Figure 5) is likely related to annual effects in the surveys; that is, the catchability of the trawls shows large annual variation. In addition, all surveys except NS-IBTSQ1 were negatively correlated to Swedish Baltic eel landings (Table 4). Commercial landings and the surveys thus have similar trends, suggesting that the decline in eel landings is not an indication of a lower impact of the fishery (29, 30) but of lower eel abundance. Furthermore, fishery-independent and fishery-dependent data can be combined to model the spatiotemporal distribution of diadromous and threatened fishes at sea [e.g., (31, 32)]. Such modeling work can shed light on rare species' habitats and migratory behaviors.
Eels were caught in greater quantity and frequency during Q3 and Q4 than during Q1. The differential occurrence of eels across the year was expected, as eels are more likely to be caught during the second part of the year (i.e., Q3 and Q4) than during the winter period (Q1). European eel tends to migrate during the second part of the year when most eels in northern waters hibernate during the winter (20, and references therein) and are also more active and thus easier to catch at higher than at lower water temperatures (33).
The strong effect of longitude in all surveys was expected, as higher eel catches were observed in the western Baltic Sea, including the Kattegat, and areas along the southern North Sea coast than in areas elsewhere covered by the surveys. Eel catches were also limited to shallow areas but not exclusively to the coast or inshore, as indicated by the surveys in the Baltic Sea and the Kattegat. As migrating eels in deeper areas can swim in the open water mass continuously during the day (22), eel catches in demersal gears can be expected to be lower in deep-sea areas, compared to shallower areas where the eel may rest on the seabed during daytime (34). Furthermore, shallow marine or brackish water is a major habitat for “freshwater eels” also during growth phase [cf. (20), and references therein]. Eel fishing has also been dominated by coastal fishing rather than inland fishing for a very long time (18).
The uncorrelated trends in CPUE between the two groups of surveys, that is, BITS and NS-IBTS at the outlet of the Baltic, on one hand, and BTS, DYFS, and SNS in the southern North Sea, on the other, may indicate differentiation in population dynamics between the two areas. A severe decline in eel abundance may have occurred earlier in, for instance, Dutch coastal waters (35, 36) than in the Kattegat and the Baltic (18, 37). This differentiation between the Baltic Sea region and the southern North Sea could reflect differences in recruitment level and/or exploitation rates. When further evaluating the suitability of the trawl surveys presented here and how these could be combined with landing statistics, Bayesian modeling, for example, may be an alternative (38, 39). Such approaches open up the possibility of spatiotemporal modeling of population dynamics [e.g., (40)].
The reported international trawl surveys can thus provide an alternative method for estimating changes in eel abundance at a regional scale. As such, it can also confront previous ways of measuring the degree of exploitation. For example, the main method for assessing the amount of southbound silver eel migrating along the Swedish east coast toward the entrance of the Baltic Sea [cf. (41, 42)], relies on the proportion of externally attached tag returns (43). Due to a low tag return rate, fishing mortality was estimated at 0.003 year–1 for the 2020 decade (30). It must be emphasized that such figures for fishery mortality close to zero, if correct, would have no demonstrable significance for eels (escapement) migrating out of the Baltic Sea. In other words, the Swedish coastal eel fishery would no longer have any significance for the development of the eel population. However, because the eel landings along the Swedish east coast are not even recently completely insignificant—the average annual landings over the 2013–2022 decade are equal to 144 tons (16)—estimates of the total size of the stock give extremely high records, ~10,000 tons in just one Swedish east coast county due to the purported low fishing mortality rate (16).
For the 1981–2013 period, Westerberg and Wickström (44), based on a theoretical recruitment level and low natural mortality during the early juvenile phase, proposed similar stock levels in the Baltic Sea of ~50,000 tons and escapement corresponding to 20,000 tons per year(45). Fishing mortality was estimated to be low (0.05–0.10) but not as low as proposed by van Gemert et al. (16), as the landings were higher compared to 2013–2022.
Furthermore, such stock levels, as suggested by Westerberg and Wickström (44) and van Gemert et al. (16), would effectively invalidate the alleged threatened status of European eel. The fact that the BITSQ1, BITSQ4, and NS-IBTSQ4 indices have decreased drastically over the last 15 years, and that the decreasing trend in eel landings along the Swedish east coast is in line with such a decrease in eel abundance, contradicts the existence of such high stock levels as suggested by van Gemert et al. (16) and Westerberg and Wickström (44). Svedäng and Cardinale (45) argued in response to Westerberg and Wickström (44) that the reported stable landings per unit effort (LPUE) in the Swedish eel coastal fishery over the past 50 years, while the fishing effort has significantly decreased (29), was due to hyperstability and that it also reflected stability in F [e.g., (46)]. The catchability of the pond nets thus increases as the number decreases, partly due to different fishing opportunities between fishing sites as better locations will be maintained while others are abandoned. While effort has decreased due to fewer nets (29), F has remained stable (or increased) due to increased catchability of remaining nets. In other words, if the eel stock had remained stable, decreased effort should have resulted in increased LPUE.
According to Council regulation (EC) no 1100/2007 on measures for the recovery of the stock of European eel, national recovery plans shall be developed to meet the targets set by the European Commission. These obligations have not been met in the Baltic Sea basin or countries in the southern North Sea. On the contrary, this serious and continuing decline in the European eel stock, as here indicated, puts the very survival of this iconic and ecologically important fish species at high risk, suggesting that ICES (47) recommendation in 2024 should be followed, for instance, by introducing a fishing ban on all exploitable life stages in all habitats.
If conservation measures had been effective, higher survival rates of eels in coastal and inland waters would probably have resulted in higher abundances of larger yellow eels, which can be observed in some parts of the Swedish west coast inshore, where a total ban on yellow eel fishing was introduced in 2012 (16). The disappearance of large, or near-maturing, eels in the surveys thus reflects the prolonged period of reduced recruitment since at least the beginning of the 1980s (4, 9), and ineffective measures to bring down fishing mortality and other factors affecting survival. In fact, a comparative study on yellow eel abundance along the German Baltic coast between 2009–2014 and 2015–2020 supports the view that increased mortality may be the driving factor behind the decline as depicted in BITSQ4 (48). Despite the increased abundance of younger eels of ages 3–4, there was a pronounced decrease in age groups ≥6 between the first and the second study period.
This study underlines the unsatisfactory status of governance in the EMP, according to the European Parliament resolution of 21 November 2023 on the implementation of Council Regulation EC No 1100/2007 (55), which specified that “there is no feedback mechanism ensuring follow-up action and regular policy updates by the member states in the Eel Regulation; highlights the fact that the ICES advice of 2012, 2018, and 2021, post-evaluating the national implementation of the Eel Regulation, has not been put into practice sufficiently”. Contrary to any suggestion that the EMP is on the way to success, the decline in the abundance of adult eel likely indicates a continued reduction in spawning stock biomass (SSB). As the European eel belongs to a marine fish species that is easily overexploited due to its high age at sexual maturity (49), further declines in SSB may result in even lower recruitment, endangering the species.
Conclusion
ICES bottom trawl surveys confirm the deteriorating status of European eel. Surveys conducted during the second half of the year have a better representation of eels than in Q1, suggesting that these surveys may be useful for assessing the eel stock status also in the future. The study could not confirm that implemented regulations have resulted in a recovery of the eel stock in the areas studied. The prolonged period of low eel recruitment to European waters is now reflected in declining densities of eels in all sizes. Fishing and other factors, such as pollutants and parasites, may not have been restricted to an extent that allows the eel stock to recover. For future assessment of the status of the European eel stock, rely more on fishery-independent sources, such as bottom trawl surveys, and coastal monitoring with passive gears such as fyke nets, as information from commercial fisheries can easily be misinterpreted.
Data availability statement
Publicly available datasets were analyzed in this study. Data are available at ICES Database on Trawl Surveys (DATRAS), ICES, Copenhagen, Denmark. https://datras.ices.dk.
Ethics statement
Ethical approval was not required for the study involving animals in accordance with the local legislation and institutional requirements because the author used published data from international trawl surveys.
Author contributions
HS: Conceptualization, Data curation, Formal analysis, Funding acquisition, Investigation, Methodology, Project administration, Resources, Software, Supervision, Validation, Visualization, Writing – original draft, Writing – review & editing.
Funding
The author(s) declare that no financial support was received for the research and/or publication of this article.
Conflict of interest
The author declares that the research was conducted in the absence of any commercial or financial relationships that could be construed as a potential conflict of interest.
Generative AI statement
The author(s) declare that no Gen AI was used in the creation of this manuscript.
Publisher's note
All claims expressed in this article are solely those of the authors and do not necessarily represent those of their affiliated organizations, or those of the publisher, the editors and the reviewers. Any product that may be evaluated in this article, or claim that may be made by its manufacturer, is not guaranteed or endorsed by the publisher.
Supplementary material
The Supplementary Material for this article can be found online at: https://www.frontiersin.org/articles/10.3389/frish.2025.1580250/full#supplementary-material
References
1. Mace GM, Collar NJ, Gaston KJ, Hilton-Taylor G, Akçakaya HR, Leader-Williams N, et al. Quantification of extinction risk: IUCN's system for classifying threatened species. Conserv Biol. (2008) 22:1424–42. doi: 10.1111/j.1523-1739.2008.01044.x
2. Sutherland WJ, Wordley CFR. Evidence complacency hampers conservation. Nat Ecol Evol. (2017) 1:1215–6. doi: 10.1038/s41559-017-0244-1
3. FAO. Precautionary Approach to Capture Fisheries and Species Introductions, Elaborated by the Technical Consultation on the Precautionary Approach to Capture Fisheries (Including Species Introductions) (6–13 June 1995, Lysekil, Sweden), FAO Tech. In: Guidelines for Responsible Fisheries, No. 2. Rome: FAO. (1996). Available online at: https://openknowledge.fao.org/items/b2111592-5233-490b-89a8-15baadc6ca1c (Accessed February 15, 2025).
4. Svärdson G. Interspecific population dominance in fish communities of Scandinavian Lakes. Rep Inst Freshwater Res Drottningholm. (1976) 55:144–71.
5. Åström M, Dekker W. When will the eel recover? A full lifecycle model. ICES J Mar Sci. (2007) 64:1491–8. doi: 10.1093/icesjms/fsm122
6. Jacoby D, Gollock, M. Anguilla anguilla. The IUCN Red List of Threatened Species 2014: e.T60344A45833138. (2014). doi: 10.2305/IUCN.UK.2014-1.RLTS.T60344A45833138.en
7. ICES. European eel (Anguilla anguilla) throughout its natural range. In: Report of the ICES Advisory Committee, 2021. ICES Advice 2021, ele.2737. Copenhagen: ICES (2021).
9. ICES (2024). Joint EIFAAC/ICES/GFCM Working Group on Eels (WGEEL). ICES Scient. Rep. 6:146. doi: 10.17895/ices.pub.27233457
10. Dekker W, Casselman JM, Cairns DK, Tsukamoto K, Jellyman D, Lickers H, et al. Québec declaration of concern: worldwide decline of eel resources necessitates immediate action. Fisheries. (2003) 28:28–30. doi: 10.1080/03632415.2014.979342
11. EU Council. Council Regulation (EC) No. 1100/2007 of 18 September 2007 establishing measures for the recovery of the stock of European eel. Official J. Eur. Union. (2007) 248:17−23.
12. Svedäng H, Gipperth L. Will regionalisation improve fisheries management in EU? –An analysis of the Swedish eel management plan reflects difficulties. Mar Pol. (2012) 36:801–8. doi: 10.1016/j.marpol.2011.11.011
13. Pauly D. Anecdotes and the shifting baseline syndrome of fisheries. TREE. (1995) 10:430. doi: 10.1016/S0169-5347(00)89171-5
14. Wickström H, Westin L, Clevestam P. The biological and economic yield from a long-term eel stocking experiment. Ecol Freshw Fish. (1996) 5:140–7. doi: 10.1111/j.1600-0633.1996.tb00046.x
15. ICES. Report of the 2009 session of the Joint EIFAC/ICES Working Group on Eels (WGEEL) and Country Reports 2008–2009. In: ICES Expert Group Reports (until 2018). Rome; Copenhagen: FAO; ICES (2009).
16. van Gemert R, Holliland P, Karlsson K, Sjöberg N, Säterberg T. Assessment of the eel stock in Sweden, spring 2024; Fifth post-evaluation of the Swedish eel management. In: Aqua Reports 2024:5. Uppsala: Swedish University of Agricultural Sciences (SLU). (2024).
17. Durif CMF, Stockhausen HH, Skiftesvik AB, Cresci A, Nyqvist D, Browman HI. A unifying hypothesis for the spawning migrations of temperate anguillid eels. Fish Fish. (2021) 23:358–75. doi: 10.1111/faf.12621
18. Svedäng H. The development of the eel Anguilla anguilla (L.) stock in the Baltic Sea: an analysis of catch and recruitment statistics. Bullet. Sea Fisher. Instit. (1996) 3:29–41.
19. Limburg K, Wickström H, Svedäng H, Elfman M, Kristiansson P. Do stocked freshwater eels migrate? Evidence from the Baltic suggests “yes”. Am Fisher Soc Symposium. (2003) 33:275–84.
20. Secor DH. Fish migration and the unit of the stock: Three formative debates. In:Cadrin SX, Friedland KD, Waldman JR, , editors. Stock Identification Methods. Applications in Fishery Science. Cambridge, MA: Elsevier Academic Press. (2005). p. 17–44.
21. ICES Database on Trawl Surveys (DATRAS) (2024). Copenhagen, Denmark: ICES. Available online at: https://datras.ices.dk (Accessed December 6, 2024).
22. Righton D, Westerberg H, Feunteun E, Okland F, Gargan P, Amilhat E, et al. Empirical observations of the spawning migration of European eels: the long and dangerous road to the Sargasso Sea. Sci. Adv. (2016) 2:e1501694. doi: 10.1126/sciadv.1501694
23. Bevacqua D, De Leo GA, Gatto M, Melià P. Size selectivity of fyke nets for European eel Anguilla anguilla. J Fish Biol. (2009) 74:2178–86. doi: 10.1111/j.1095-8649.2009.02243.x
24. Schlitzer R. Ocean Data View. (2023). Available online at: https://odv.awi.de (Accessed December 4, 2024).
25. R Core Team. R: A Language and Environment for Statistical Computing. Vienna: R Foundation for Statistical Computing. (2021). Available online at: https://www.R-project.org/ (Accessed July 8, 2025).
26. Zhang X, Yi N. NBZIMM: negative binomial and zero-inflated mixed models, with application to microbiome/metagenomics data analysis. BMC Bioinform. (2020) 21:488. doi: 10.1186/s12859-020-03803-z
27. Wood SN. Fast stable restricted maximum likelihood and marginal likelihood estimation of semiparametric generalized linear models. JRSS (B). (2011) 73:3–36. doi: 10.1111/j.1467-9868.2010.00749.x
28. Harrell F, Dupont C. Hmisc. (2021). Available online at: https://cran.rstudio.com/bin/macosx/contrib/4.0/Hmisc_4.6-0.tgz (Accessed November 26, 2021).
29. Andersson J, Florin A-B, Petersson E. Escapement of eel (Anguilla anguilla) in coastal areas in Sweden over a 50 year period. ICES J Mar Sci. (2012) 69:991–9. doi: 10.1093/icesjms/fss094
30. van Gemert R, Holliland P, Jacobson P, Sjöberg N, Säterberg T. Report on the eel stock, fishery, and other impacts in: Sweden 2023-2024. ICES. 2024. Joint EIFAAC/ICES/GFCM Working Group on Eels (WGEEL). ICES Scient. Rep. (2024) 6:146. doi: 10.17895/ices.pub.27233457
31. Elliott SAM, Acou A, Beaulaton L, Guitton J, Réveillac E, Rivot E. Modelling the distribution of rare and data-poor diadromous fish at sea for protected area management. Prog Oceanogr. (2023) 210:102924. doi: 10.1016/j.pocean.2022.102924
32. Elliott SAM, Deleys N, Beaulaton L, Rivot E, Réveillac E, Acou A. Fisheries-dependent and -independent data used to model the distribution of diadromous fish at-sea. Data Brief. (2023) 48:109107. doi: 10.1016/j.dib.2023.109107
33. Durif CMF, Travade F, Rives J, Elie P, Gosset C. Relationship between locomotor activity, environmental factors, and timing of the spawning migration in the European eel, Anguilla anguilla. Aquat Living Resour. (2008) 21:163–70. doi: 10.1051/alr:2008031
34. Westerberg H, Lagenfelt I, Svedäng H. Silver eel migration behaviour in the Baltic. ICES J Mar Sci. (2007) 64:1457–62. doi: 10.1093/icesjms/fsm079
35. Dekker W. Impact of yellow eel exploitation on spawner production in Lake IJsselmeer, the Netherlands. DANA. (2000) 12:25–40.
36. Dekker W. What caused the decline of the Lake IJsselmeer eel stock after 1960? ICES J. Mar Sci. (2004) 61:394–404. doi: 10.1016/j.icesjms.2004.01.003
37. Svedäng H. Vital population statistics of the exploited eel stock on the Swedish west coast. Fish Res. (1999) 40:251–65. doi: 10.1016/S0165-7836(98)00226-4
38. Quinn TJ. Ruminations on the development and future of population dynamics models in fisheries. Nat Resour Model. (2003) 16:341–92. doi: 10.1111/j.1939-7445.2003.tb00119.x
39. Simmonds EJ, Portilla E, Skagen D, Beare D, Reid DG. Investigating agreement between different data sources using Bayesian state-space models: an application to estimating NE Atlantic mackerel catch and stock abundance. ICES J Mar Sci. (2010) 67:1138–53. doi: 10.1093/icesjms/fsq013
40. Olmos M, Cao J, Thorson JT, Punt AE, Monnahan CC, Alglave B, et al. A step towards the integration of spatial dynamics in population dynamics models: eastern Bering Sea snow crab as a case study. Ecol Modell. (2023) 85:110484. doi: 10.1016/j.ecolmodel.2023.110484
41. Nordquist O, Alm G. Investigations on age, size and growth rate of eel in Sweden. Svensk Hydr Biol Komm Skr. (1920) 1920:10.
42. Määr A. Ober die Aalwanderung im Baltichen Meer auf Grund der Wanderaalmarkierungsversuche im Finnischen und Livischen Meerbusen i. d J 1937–1939. Medd Stat Unders Forsöksanst Sötvattenfisket 27. (1947) 1–56.
43. Dekker W, Sjöberg NB. Assessment of the fishing impact on the silver eel stock in the Baltic using survival analysis. Can. J. Fish. Aquat. Sci. (2013) 70:1673–1684. doi: 10.1139/cjfas-2013-0250
44. Westerberg H, Wickström H. Stock assessment of eels in the Baltic: reconciling survey estimates to achieve quantitative analysis. ICES J. Mar. Sci. (2016) 73:75–83. doi: 10.1093/icesjms/fsv049
45. Svedäng H, Cardinale M. Comment on stock assessment of eels in the Baltic by Westerberg and Wickström (2015): do we need more unknowns? ICES J. Mar Sci. (2016) 73:1610–2. doi: 10.1093/icesjms/fsv246
46. Ellis N, Wang Y-G. Effects of fish density distribution and effort distribution on catchability. ICES J Mar Sci. (2007) 64:178–91. doi: 10.1093/icesjms/fsl015
47. ICES. European eel (Anguilla anguilla) throughout its natural range. In: ICES Advice: Recurrent Advice. Report. Copenhagen: ICES (2024).
48. Dorow M, Kullmann L, Buck M, Frankowski J. Yellow eel (Anguilla anguilla) density trends along the German part of the southern Baltic Sea between 2009 and 2020. Fish. Res. (2023) 257:106497. doi: 10.1016/j.fishres.2022.106497
49. Reynolds JD, Dulvy NK, Goodwin NB, Hutchings JA. Biology of extinction risk in marine fishes. Proc R Soc B. (2010) 272:2337–44. doi: 10.1098/rspb.2005.3281
50. ICES. SISP 7 - Manual for the Baltic International Trawl Surveys (BITS). In: Series of ICES Survey Protocols (2012–2020). Report. Copenhagen: ICES (2017).
51. ICES. SISP 10 – manual for the north sea international bottom trawl surveys. In: Series of ICES Survey Protocols (2012–2020). Report. Copenhagen: ICES (2020).
52. ICES. SISP 14 - manual for the offshore beam trawl surveys (WGBEAM). In: Series of ICES Survey Protocols (2012–2020). Report. Copenhagen: ICES (2019).
53. Beier U, de Boois IJ, Haslob H, Raat H, Vrooman J. ICES Survey Protocols –Inshore Beam Trawl Surveys, Coordinated by Working Group on Beam Trawl Surveys (WGBEAM). Copenhagen: ICES (2024).
54. ICES. Working Group on Beam Trawl Surveys (WGBEAM). ICES Scient. Rep. (2023) 5:84. doi: 10.17895/ices.pub.22726112
55. European Parliament. Implementation of the Regulation establishing measures for the recovery of the stock of European eel. In: European Parliament Resolution of 21 November 2023 on the Implementation of Council Regulation (EC) No 1100/2007 Establishing Measures for the Recovery of the Stock of European eel (2023/2030(INI)): P9_TA(2023)0411. (2023). Available online at: http://data.europa.eu/eli/C/2024/4214/oj (Accessed February 18, 2025).
Keywords: assessment, eel management plan, European eel, escapement, population dynamics, surveys
Citation: Svedäng H (2025) Bottom trawl surveys show a sharp decline in European eel (Anguilla anguilla) abundance in northern European coastal waters. Front. Fish Sci. 3:1580250. doi: 10.3389/frish.2025.1580250
Received: 20 February 2025; Accepted: 21 July 2025;
Published: 12 August 2025.
Edited by:
Periklis Kleitou, Marine and Environmental Research Lab (MER), CyprusReviewed by:
Cinzia Podda, International Marine Centre Foundation, ItalySophie Elliott, Game and Wildlife Conservation Trust (GWCT), United Kingdom
Copyright © 2025 Svedäng. This is an open-access article distributed under the terms of the Creative Commons Attribution License (CC BY). The use, distribution or reproduction in other forums is permitted, provided the original author(s) and the copyright owner(s) are credited and that the original publication in this journal is cited, in accordance with accepted academic practice. No use, distribution or reproduction is permitted which does not comply with these terms.
*Correspondence: Henrik Svedäng, aGVucmlrLnN2ZWRhbmdAc3Uuc2U=
†ORCID: Henrik Svedäng orcid.org/0000-0002-3639-7105