Abstract
Fish from Cambodia's Tonle Sap Lake are economically, culturally, and nutritionally significant for people in the Lower Mekong Basin, providing income, livelihoods, and protein. Fish in this system generally migrate toward upstream Mekong River in dry season and return in early wet season. However, drivers of fish migration from Tonle Sap Lake to the Mekong River are not well-understood. In this paper, we utilized Mixed Effects Random Forest to predict the catch weight of six fish species migrating from the Tonle Sap Lake to the Mekong River using precipitation, lunar cycle, and hydrologic conditions like river stage, streamflow, flow magnitude, and timing as predictors. As a surrogate for fish migration, we used daily fish catch weight from 2002 through 2008 at the bagnet, or Dai, fisheries along Tonle Sap River, a migration corridor connecting Tonle Sap Lake to the Mekong River. We found that migration of large fish was mainly cued by streamflow and flow magnitude, while smaller fish migrate depending on the combination of streamflow and flow timing. Streamflow less than average cumulative flow was the most important driver for migration of Pangasianodon hypophthalmus, and Cirrhinus microlepis. Migration of Cyclocheilichthys enoplos and Osteochilus melanopleurus was highly dependent on the number of low- and minimum-flow days. Cumulative flows, period of high flow and water level were the main predictors of the small mud-carp Henicorhynchus entmema's migration, while individuals of Labiobarbus leptocheilus migrated out of the Tonle Sap Lake depending on the number of days after 7-, 30-, and 90-day minimum flows. These results suggest that flow characteristics can be used to aid conservation and adaptive management of Cambodia's Dai fisheries.
1 Introduction
Inland fisheries have broad and wide-ranging benefits, supporting individuals, societies, environmental functions, and ecosystem services (Lynch et al., 2016). In low-income countries, inland fisheries are especially important because they provide livelihoods for over 60 million people (FAO, 2014). However, inland fisheries are threatened by biological invasion (FAO, 2014), overfishing (Ngor et al., 2018c), and dam development (Barbarossa et al., 2020). Existing dams have already reduced fish biodiversity and catches in the Lower Mekong Basin (Sor et al., 2023), while the range of fish species migration is likely to be reduced in other tropical rivers due to future dams (Barbarossa et al., 2020).
In the Lower Mekong Basin, freshwater fish are economically and culturally important, providing food security to ~65 million people (Mekong River Commission, 2019). Hotspots of fish diversity and biomass include Cambodia's Tonle Sap Lake and three Mekong River tributaries formed by the Se Kong, Se San, and Sre Pok Rivers, collectively called the 3S Basin (Ngor et al., 2018a; Sor et al., 2023). An industrial bagnet, or “Dai,” fishery as it is locally known, in Cambodia's Tonle Sap River yields an average of ~12,000 tons of fish each year (Baran, 2006). The Dai fishery has been operating for more than 140 years, and relies on the unique hydrology of the Tonle Sap system (Halls et al., 2013). In the dry season from October to May, fish migrate from Tonle Sap Lake to spawning grounds and dry season refuges in the Mekong River and upstream tributaries (Baird et al., 2004). The Dai closes in the wet season when flow of the Tonle Sap River reverses, flowing from the Mekong River into Tonle Sap Lake and providing crucial habitat for fish feeding and rearing (Chan et al., 1999; Halls et al., 2013). This flow reversal increases Tonle Sap Lake's area from roughly 2,600 km2 in the dry season to about 15,000 km2 in the wet season (Cochrane et al., 2014), expanding to about one and a half times larger than Lake Erie in the United States. The wet and dry seasons of the Mekong Basin support unparalleled aquatic biodiversity (Sor et al., 2014, 2017; Ngor et al., 2018a; Tudesque et al., 2019).
Recent and ongoing hydropower dam construction throughout the basin is homogenizing flows, creating drier wet seasons and wetter dry seasons (Hecht et al., 2019; Null et al., 2021; Chann et al., 2022), changing water quality and habitats (Lohani et al., 2020; Sor et al., 2021), and threatening fishes that rely on the annual flood-pulse (Ngor et al., 2018b; Null et al., 2021). Proposed future dams in the Lower Mekong Basin could further alter hydrology and ecosystems (Arias et al., 2014; Morovati et al., 2023). For instance, fish biomass and diversity have decreased in Mekong tributaries that have the highest concentrations of dams, while biomass has increased in free-flowing rivers or those with few dams because they offer the last remnants of connected habitats (Sor et al., 2023). Proposed dams threaten the remaining migration corridor between Tonle Sap Lake, the mainstem Mekong River, and the Sekong River (Null et al., 2021; Sor et al., 2023). Intense and indiscriminate fishing also threatens fish in the Tonle Sap system (Ngor et al., 2018c). While total catch has remained stable over time, fast-growing, small fish have replaced larger fish due to overfishing (Ngor et al., 2018c). Lower diversity of fishes leads to ecosystems that may be less resilient to changing environmental conditions from climate change, water development, land use change, and other anthropogenic alterations.
Identifying daily migration triggers for native fish species is important to understand how existing and future dams, drought intensification, and land use changes could alter streamflow components in the Tonle Sap River and disrupt fish migrations. The indicators of hydrologic variation approach (Richter et al., 1997) and, more conceptually, the natural flow paradigm (Poff, 1997), assume that streamflow is a master variable for ecological function. Streamflow can be characterized by magnitude, frequency, timing, duration, and rate of change to understand hydrologic components that cue fish to migrate (Richter et al., 1997). Similarly, precipitation and lunar cycle are physical drivers that may drive fish movement. In the Lower Mekong Basin, previous research has linked fish migration with discharge, water level, rainfall, and lunar cycle (Baran, 2006). In the Tonle Sap system, flood extent and duration (Halls et al., 2013) and flood pulse extent and hydrologic variance (Sabo et al., 2017) have been correlated with fish biomass, as indicated by Dai catch per unit effort. However, few studies have evaluated hydrologic predictors for individual species. One of the studies that we identified illustrated that water level is significantly correlated with daily catch of the small mud carp Henicorhynchus entmema (Chan et al., 2019) and another reported correlation between water levels and catch of juvenile striped catfish (Pangasianodon hypophthalmus; Chhuoy et al., 2022). However, these studies did not evaluate which hydrological and physical predictors cue fish migration.
Our objective is to test whether lunar cycle, precipitation, and streamflow conditions cue six fish species to migrate from Cambodia's Tonle Sap Lake to the Mekong River. Our fish species included a large river catfish (Pangasianodon hypophthalmus), three medium-sized carp (Cyclocheilichthys enoplos, Osteochilus melanopleurus, and Cirrhinus microlepis), a keystone species mud carp (Henicorhynchus entmema), and a highly abundant mud carp (Labiobarbus leptocheilus). The latter two species are particularly important as local food sources. These species are representative of ecologically and economically important fish in the Lower Mekong Basin. We expected that the migration of these fish species are influenced by river flow, water level, precipitation, and lunar cycle, as found in the Lower Mekong Basin (Baird and Flaherty, 2001; Baran, 2006).
2 Materials and methods
2.1 Study area and fish data
The Tonle Sap system includes Tonle Sap Lake and River (Figure 1A). The Tonle Sap system is well-known for rich aquatic fauna biodiversity, ranging from invertebrates such as rotifers (Sor et al., 2014), aquatic insects (Sor et al., 2017; Chhorn et al., 2020; Doeurk et al., 2022), annelids and crustaceans (Sor et al., 2017), and molluscs (Sor et al., 2017, 2020) to fish (So et al., 2018). Most migratory fish belong to two families, Cyprinidae and Pangasiidae (Ngor et al., 2018b; Sor et al., 2023). The species of these families are diverse and make up ~82% of the fish catch in Cambodia, and their catch weight has been declining at the Dai fishery over the last 15 years (Ngor et al., 2018c).
Figure 1

(A) The Tonle Sap River flows from Tonle Sap Lake to the Mekong River in the dry season, and from the Mekong River toward Tonle Sap Lake in the wet season. Gray arrows indicate the direction of the Mekong River. The red arrow indicates the bi-directional Tonle Sap River. The black line is Cambodia's boundary. (B) The Dai (bagnet) fishery on the Tonle Sap River (yellow circles) is made up of 64 units across 14 rows.
We used daily catch per unit effort (CPUE) of six fish species collected from the Dai fishery in the Tonle Sap River from 2002 to 2008. Five species (all except P. hypophthalmus) belong to Cyprinidae, the family of fishes most widely caught in this system, while P. hypophthalmus belongs to the catfish family, Pangasiidae, which are also widely caught. The five cyprinid species are economically and ecologically important, as they are keystone species, prey for predatory fish and Irrawaddy dolphins (Orcaella brevirostris), and are widely sold in fish markets (Fukushima et al., 2014; Ngor et al., 2018c). The species H. entmema is the most harvested species in the Dai fishery (Ngor et al., 2018c). The giant striped-catfish P. hypophthalmus is important as a food source, income for local people, and regulates aquatic fauna diversity (e.g., mollusc and smaller fish; Ngor et al., 2018c; Sor et al., 2020).
The Dai fishery operates from October to March, which is the tail end of the wet season through much of the dry season. Peak catch usually occurs in December and January. The Dai fishery comprises a total of 64 Dai units belonging to 14 Dai rows along the Tonle Sap River, and they cover ~30 km from the first to the final row (Figure 1B). The mouth of each Dai unit is ~25 m (Supplementary Figure 1), with mesh size ranging from ~15 cm at the mouth to 1 cm at the cod end. Nets face upstream to catch fish migrating from Tonle Sap Lake to the Mekong River (Halls et al., 2013).
The 2002 to 2008 fish sampling effort followed a random stratification of the Dai units, based on location of the Dai rows and units (high vs. low catch units), and the peak and low catch periods. Fish catch and composition was analyzed for each selected Dai unit. Fishing took place up to 17 days/month, with daily sampling during the peak period and sampling every 2nd or 3rd day in the low catch period. During peak catch, nets were hauled every 15–30 min, with 48–96 hauls per day, and catch was weighed and identified to species. During low catch periods, nets were hauled every 2–3 h, or 8–12 hauls per day. Then, Catch Per Unit Effort (CPUE), a daily catch rate of the Dai unit (kg), was estimated as the product of sampled weight for every haul sampled per day, and the average daily CPUE was calculated using the mean daily catch per haul multiplying by the total number of hauls per day. Further detail on the sampling procedure and CPUE computation is in Ngor et al. (2018c).
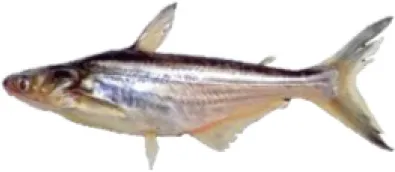
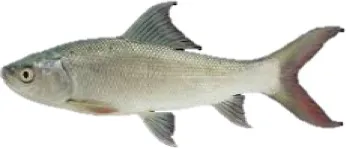
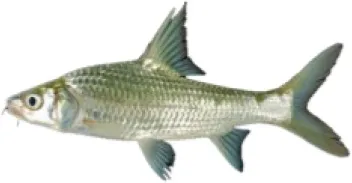
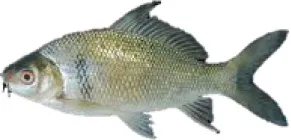
The maximum total length, the length from the tip of snout to the tip of depressed caudal fin, and catch weight characteristics for the six study species are provided in Table 1. Catch weight time-series, log-transformed catch weight time-series (natural logarithm), catch weight distribution and log-transformed catch weight distribution (natural logarithm) for each species are provided in Supplementary Figures 2–7.
Table 1
| Species names | Photo of each species | Max total length, cm | Mean daily catch weight, kg | SD daily catch weight, kg | Mean log daily catch weight | SD log daily catch weight | Economic value; role in the food-web |
|---|---|---|---|---|---|---|---|
| Pangasianodon hypophthalmus (large river catfish) |
|
158.6 | 214.07 | 250.02 | 4.90 | 0.96 | High value; predator/ omnivore |
| Cirrhinus microlepis (medium-large carp) |
|
79.3 | 108.11 | 125.14 | 4.27 | 0.83 | High value; predator/ omnivore |
| Cyclocheilichthys enoplos (medium-large carp) |
|
90.3 | 61.53 | 98.48 | 3.09 | 1.44 | High value; predator/ omnivore |
| Osteochilus melanopleurus (medium-large carp) |
|
73.2 | 270.29 | 283.39 | 4.87 | 1.44 | High value; herbivore |
| Henicorhynchus entmema (small mud carp) |
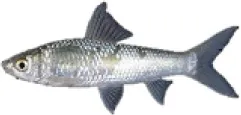
|
18.3 | 11.39 | 4.55 | 2.35 | 0.41 | Low value; prey/omnivore/keystone |
| Labiobarbus leptocheilus (small mud carp) |
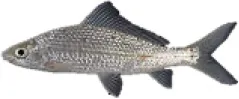
|
15.5 | 8.96 | 3.63 | 2.11 | 0.41 | Low value; prey/omnivore |
Maximum total length and mean catch weight statistics for each study fish species from the Dai fishery, 2002–2008.
SD is standard deviation. Max total length: is “the length from the tip of snout to the tip of depressed caudal fin” measured from the fish catch. Mean log daily catch weight was computed by log-transforming individual catches and then taking the mean of these log-transformed catches.
We assume fish migration from Tonle Sap Lake to the Mekong River is represented by fish daily catch weight from the Dai (i.e., CPUE) because the stationary bagnets are designed to catch migratory fish. Each Dai unit can capture up to 2.8% of migrating fish. From the first to the final row, an estimated 83% of migrating fish are collectively caught in Tonle Sap River bagnet fishery (Halls et al., 2013; Ngor et al., 2018c). Note that, catch is generally highest in the first few Dai rows, and gradually decreased until the final row.
2.2 Environmental predictors
Environmental predictors used in this study are streamflow (three predictors), flow magnitude (seven predictors), flow timing (10 predictors), flow rate of change (one predictor), precipitation (one predictor), and lunar cycle (one predictor; Table 2). Flow characteristics, including magnitude, timing, and rate of change, are hydrologic components which drive ecosystem function and support freshwater biodiversity, habitat, and ecosystem services (Richter et al., 1996). For example, the magnitude of flows can be an indicator of habitat availability. Timing of flows can serve as a measure of flow requirements needed for species to complete parts of the life cycle or as an indicator of stress (e.g., floods or droughts). The rate of change of flows can illustrate changing habitat conditions (Richter et al., 1996). Our flow characteristics were calculated using Tonle Sap River discharge (Tonle Sap Lake outflow) from October to March with equations from Kummu et al. (2014):
Table 2
| Characteristic | Code | Predictor description | Mean | Min–max | Biological signal |
|---|---|---|---|---|---|
| Flow | FL1 | Cumulative flow by Julian day (m3s−1) | 357,103 | 4,371–711,691 | Movement/growth |
| Flow | FL2 | Difference between current year Julian day cumulative flow and average Julian day cumulative flow (m3s−1) | −7,926 | −401,914–216,825 | Movement/growth |
| Flow | FL3 | Tonle Sap River flow calculated with Equations (1–3) (m3s−1) | 3,535 | 292–9,774 | Movement/growth |
| Magnitude | MF1 | Number of days in a water year that flow exceeded the 75th percentile flow (count) | 35.4 | 0–46 | Habitat availability |
| Magnitude | MF2 | Number of days in a water year that flow was below the 25th percentile flow (count) | 1.9 | 0–29 | Habitat availability |
| Magnitude | MF3 | Flow magnitude exceeds 75th percentile of flow in each water year (binary) | 0.3 | 0–1 | Habitat availability |
| Magnitude | MF4 | Flow magnitude is below 25th percentile of flow in each water year (binary) | 0.1 | 0–1 | Habitat availability |
| Magnitude | MF5 | Water level at Prek Kdam (m) (Supplementary Figure 9) | 4.5 | 1.0–9.4 | Habitat availability |
| Magnitude | MF6 | Water level at Phnom Penh Port (m) | 4.0 | 1.1–8.9 | Habitat availability |
| Magnitude | MF7 | Water level at Kompong Luong (m) | 5.6 | 1.2–9.6 | Habitat availability |
| Timing | TF1 | Days since annual 1-day minimum (count) | −21.4 | −169–144 | Life cycle completion/stress |
| Timing | TF2 | Days since annual 1-day maximum (count) | 56.5 | −25–161 | Life cycle completion/stress |
| Timing | TF3 | Days since annual 3-day minimum (count) | −79.3 | −168–71 | Life cycle completion/stress |
| Timing | TF4 | Days since annual 3-day maximum (count) | 65.1 | −25–161 | Life cycle completion/stress |
| Timing | TF5 | Days since annual 7-day minimum (count) | −82.5 | −170–70 | Life cycle completion/stress |
| Timing | TF6 | Days since annual 7-day maximum (count) | 50.6 | −26–138 | Life cycle completion/stress |
| Timing | TF7 | Days since annual 30-day minimum (count) | −81.2 | −170–86 | Life cycle completion/stress |
| Timing | TF8 | Days since annual 30-day maximum (count) | 39.5 | −59–135 | Life cycle completion/stress |
| Timing | TF9 | Days since annual 90-day minimum (count) | −81.2 | −170–86 | Life cycle completion/stress |
| Timing | TF10 | Days since annual 90-day maximum (count) | 28.8 | −47–118 | Life cycle completion/stress |
| Rate of change | RC | Change from previous day (m3s−1) | −25.8 | −2,030–1,944 | Habitat change |
| Precipitation | OP1 | Daily precipitation at Tonle Sap River at Kampong Chhang gauge station (mm) between October and March (Supplementary Figure 10) | 0.8 | 0–98.5 | Life cycle completion/movement |
| Lunar cycle | OP2 | Daily lunar cycle (0: no moon, 1: full moon) | 0.5 | 0.04–0.96 | Movement |
Description of 23 predictor variables and their biological signal for fish.
The numerical data of each variable (e.g., cumulative flow, counts, and water level measurement) was calculated for each water year.
where F is the seasonal flow direction from the Mekong River toward Tonle Sap Lake or from Tonle Sap Lake toward the Mekong River, WLPK is water level (m) at Prek Kdam on the Tonle Sap River, WLPP is the water level (m) at Phnom Penh Port at the confluence of the Tonle Sap River and Mekong River, WLKL is the water level (m) at Kompong Luong in Tonle Sap Lake, QTSR, in is Tonle Sap River flow (m3s−1) into Tonle Sap Lake during the wet season, and QTSR, out is the Tonle Sap River flow (m3s−1) out of Tonle Sap Lake during the dry season. Daily Tonle Sap River flows were calculated for 2002 to 2008. The hydrograph for Tonle Sap River shows the dry season as negative flows leaving Tonle Sap Lake to the Mekong River and the wet season as positive flows toward Tonle Sap Lake (Supplementary Figure 8). Precipitation data at the Kampong Chhnang gauge station was obtained from the Mekong River Commission (2020). In each water year, the daily data of each environmental predictor corresponding to fish CPUE data (i.e., between October and March from each water year) were combined and used as model input.
2.3 Modeling and statistical analysis
To identify hydrologic and environmental predictors of fish migration, we used Mixed Effects Random Forest (MERF; Capitaine et al., 2021). MERF is a new approach to model hierarchical data with random forests (Pellagatti et al., 2021) and adapted to model longitudinal data by adding a stochastic process for covariance structure or serial correlations between predictors and outcomes over time (Capitaine et al., 2021). This random forest-based approach has previously been used to predict the invasion success of a freshwater fish species in diminished riparian systems of temperate regions of North America (Krabbenhoft and Kashian, 2022). The robustness of the approach has also been reported in several medical and public health studies (Capitaine et al., 2021; Haran et al., 2021).
MERF was developed based on a generalized linear mixed-effects model, which estimates fixed effects by using a random forest algorithm that constructs multiple ensemble trees. When the most important predictors are identified in the most trees, their input values are then averaged across all trees to regress against total catch weight of each fish species. MERF has fixed (or population-averaged) effects and random effects. This approach allows for multiple covariates and non-linear effects (Pellagatti et al., 2021).
A MERF model was implemented for each species. Log-catch weight of each species was the response variable and hydrologic and environmental conditions were the predictors. Environmental data are from six October—March dry seasons, spanning 2002–2008. All predictors were represented as fixed effects, except water levels in Phnom Penh and Kompong Luong (MF6 and MF7), which were modeled as random effects because they are influenced by the Mekong River and Tonle Sap Lake water level, respectively. The mtry parameter in the model controls the number of candidate variables to select at each split of a tree. We set mtry to 7, following the default setting where mtry equals the number of predictors divided by 3, exceeding the suggested minimum mtry value of 5 (Hastie et al., 2008). For modeling log-catch weight of each fish species, 15 replicates were made to assure model stability. The 15 replicates provide 15 samples to estimate the distribution of log-catch weight of each species (Minitab, 2017). The MERF model was performed using the function “MERF” of the LongituRF package of R (Capitaine et al., 2021).
The predicted fish log-catch weight obtained from the fitted MERF was recorded and then correlated against the observed log-catch weight to determine model performance using the coefficient of determination (R2). Predictor variable importance was assessed using the percentage increase in mean square error (%IncMSE) and the percentage increase in node purity (%IncNodePurity) of regression trees to identify the most important predictors. The percentage increase in node purity is measured by the residual sum of squares and defines the level of homogeneity averaged over all trees. Higher values of the two measures indicate more important predictor variables (Dewi and Chen, 2019). Then the mean of R2, percentage increase in mean square error, and percentage increase in node purity were calculated across the 15 replicates for final model performance and ranked variable importance. The variables with the highest average mean square error and largest percentage increase in node purity were considered the most important predictors of fish catch weight for each fish species. This correlation analysis was conducted using the function “cor” of the base stats package of R (R Core Team, 2024).
To test whether a group of fish species was affected by similar factors, cluster analysis was further conducted based on dissimilarities between the daily catch of each fish species, using the “correlation” method in the “pvclust” function of the pvclust package in R (Suzuki and Shimodaira, 2006). A bootstrap probability (BP) value ranging from 0 to 100%, indicating the lowest to highest level of correct clustering, was calculated based on the multiscale bootstrap resampling procedure (nboot = 1,000 for this study) for each cluster (Suzuki and Shimodaira, 2006). All statistical modeling and analyses were performed using R statistical programing language (R Core Team, 2024).
3 Results
MERF performed well in predicting the log-catch weight of each fish species, with models ranging from R2 = 0.89 to 0.93 and standard deviation ranging from 0.001 to 0.01 (Figure 2). When predicting the large striped catfish, P. hypophthalmus, the difference between current year Julian day cumulative flow and average Julian day cumulative flow (FL2) was the most important predictor, measured by both the percentage increase in mean square error and the percentage increase in node purity. Cumulative flow (FL1) and days since annual 3-day minimum (TF3) alternated between the second and third most important variables, followed by the water level at Prek Kdam (MF5) or daily moon illumination (OP2; Figure 3A).
Figure 2

Mixed Effects Random Forest (MERF) performance based on model goodness of fit (R2 ± standard deviation) between the observed and the predicted log-catch weight of each fish species.
Figure 3

Mixed Effects Random Forest (MERF) importance ranking of hydrologic and environmental predictors based on contribution percentage of each variable measured by the percentage increase in mean square error and the percentage increase in node purity. Error bars show 1 standard deviation from the mean. See Table 2 for predictor definitions. (A)Pangasianodon hypophthalmus. (B)Cirrhinus microlepis. (C)Cyclocheilichthys enoplos. (D)Osteochilus melanopleurus. (E)Henicorhynchus entmema. (F)Labiobarbus leptocheilus.
For the medium-size cyprinid species, C. microlepis, the most important predictors were also the difference between current year Julian day cumulative flow and average Julian day cumulative flow (FL2) and cumulative flow (FL1). Tonle Sap River streamflow (FL3) and water level at Prek Kdam (MF5) alternated between the third and fourth most important variables (Figure 3B). For the other two medium-size cyprinid species, C. enoplos and O. melanopleurus, the number of low-flow days (MF2) was the most important predictor, followed by the difference between current year Julian day cumulative flow and average Julian day cumulative flow (FL2), water level at Prek Kdam (MF5), cumulative flow (FL1), and days since annual 1-day minimum (TF1) for C. enoplos (Figure 3C), and days since annual 1-day minimum (TF1), days since annual 3-day minimum (FL3), the difference between current year Julian day cumulative flow and average Julian day cumulative flow (FL2), water level at Prek Kdam (MF5) and/or lunar cycle (OP2) and rate of change (RC) for O. melanopleurus (Figure 3D).
For the smaller cyprinid species H. entmema, the most important predictors were cumulative flow (FL1) and days since the annual 30-day-maximum flow (TF8), followed by water level at Prek Kdam (MF5), lunar cycle (OP2) and the difference between current year Julian day cumulative flow and average Julian day cumulative flow (FL2; Figure 3E). For L. leptocheilus, the most important predictors were days since the 7-, 30-, or 90-day-minimum flow (TF5, TF7, and TF9), followed by the water level at Prek Kdam (MF5), and days since the annual 7-day-maximum flow (TF6; Figure 3F).
Based on the cluster analysis, three clusters were identified: cluster Ia grouped P. hypopthalmus and C. microlepis, cluster Ib grouped O. melanopleurus and C. enoplos, and cluster II grouped L. leptocheilus and H. entmema. Clusters Ia, Ib, and II have bootstrap probability values of 44, 44, and 100%, respectively (Figure 4). These values indicate the percentage of correct clustering out the 1,000 bootstraps.
Figure 4

Cluster analysis of the six fish species in the Lower Mekong Basin based on the CPUE computed from 2002 to 2008. Numbers in the parentheses are the bootstrap probability value (%) indicating the level of correct clustering. Height is the distance at which the CPUE of fish species are fused.
4 Discussion
Multiple flow metrics, including streamflow, flow magnitude, and flow timing were key factors cueing migration of the six species from Tonle Sap Lake to the Mekong Basin and upstream tributaries. Streamflow is an important driver of fish migration in other systems (Rytwinski et al., 2020), including catfish and other mega fish in tropical Australia (O'Mara et al., 2021) and salmonids in temperate river systems (Morales-Marín et al., 2019; Goodrum and Null, 2022). Altogether, flow characteristics are critical for migratory fish—they predicate habitat, food availability, reproduction success, and movement timing (Ngor et al., 2018b; Chan et al., 2019; Chhuoy et al., 2022). However, we did not find that lunar cycle or precipitation were correlated with fish migrations, although these predictors have been previously identified in the Lower Mekong River (Baird and Flaherty, 2001; Baran, 2006).
Streamflow metrics (FL predictors) were key drivers of large and medium fish species migration in cluster Ia, comprising P. hypophthalmus and C. microlepis. These results add support to previous research showing that streamflow is an important driver of fish migrations (Poff, 1997; Richter et al., 1997). For example, P. hypophthalmus migrate through the Tonle Sap River during low streamflow, which corresponds to the dry period between March and April, then spend the wet season in their spawning habitat in the Mekong River (Chhuoy et al., 2022). Streamflow also drives C. microlepis larvae dispersal (Chhuoy et al., 2022).
For the medium-size fish C. enoplos and C. microlepis in cluster Ib, flow magnitude metrics (MF predictors), especially low-flow days (MF2), were the most important factors influencing migration. Migration of both C. enoplos and O. melanopleurus was triggered by the occurrence of low-flow days (MF2), consistent with previous research showing these species migrate to the Mekong River and upstream tributaries to reproduce when low flows are between 1,000 and 5,000 m3s−1 (Baran, 2006).
For the small mud carps in cluster II, flow volume and timing were particularly important for movement. Flow timing, as days since the 30-day flow maximum (TF8) was an important predictor for H. entmema. This coincides with a previous study that showed that migration of H. entmema occurs at the Dai fisheries about 15 weeks after peak water level in the Tonle Sap River at Prek Kdam (Chan et al., 2019). The L. leptocheilus migration is sensitive to flow timing, in particular the period following the 7-day minimum flow (TF5) and the 30- and 90-day minimum flow (TF7 and TF9). All of these are indicators that timing surrounding the critically low flow period is a main driver for small mud carp species migration, consistent with previous studies (Chan et al., 1999; Rytwinski et al., 2020; O'Mara et al., 2021).
Migratory species primarily migrate from Tonle Sap Lake to the Mekong River during the recession limb of the Tonle Sap River and Mekong River, typically from October to February (Ngor et al., 2018a; Chan et al., 2019). As indiscriminate fishing alters fish abundance and biodiversity, shifting catch from larger to smaller species (Ngor et al., 2018c), our research suggests the hydrologic and environmental conditions when fishing could be reduced to protect larger species. Limiting fish catch could be based on streamflow volume (e.g., FL1, FL2), flow magnitude (MF2, MF5), and flow timing (TF1, TF3). The flow variables identified here provide thresholds upon which to base decisions. For example, a moratorium on fishing to preserve species could be enacted when water recedes at Tonle Sap Lake.
One of the limitations of our study and dataset is that it does not include water quality and other abiotic metrics, which have previously been shown to influence fish habitat and ecosystem function (Olden and Naiman, 2010). Water quality variables such as turbidity can affect fish gill function and increase or decrease fish movement (Hildebrandt and Parsons, 2016). Water temperature influences metabolic rates, physiology, and reproduction of fish, which affects fish movement and growth (Webb et al., 2008). Nutrients are key fish migration triggers because when food is scarce, fish compete for food and migrate in search of better feeding grounds (Baran, 2006).
Another limitation is the challenge of interpreting the MERF model. Although this approach has been implemented in several fields like freshwater ecology (Krabbenhoft and Kashian, 2022), education sciences (Pellagatti et al., 2021), and public health (Haran et al., 2021), improved documentation and better parameter guidelines would improve model utility. In particular, the model is sensitive to mtry value, where small or large mtry leads to underfitting or overfitting the model, respectively (Hastie et al., 2008). Functional explanation of the model results, such as linear or non-linear, positive or negative relationships should be further investigated.
5 Implications for the future
Flow characteristics have changed remarkably in the twenty-first century due to anthropogenic disturbances like hydropower dams, land use changes, and drought (Ngor et al., 2018b; Null et al., 2021; Chann et al., 2022; Sor et al., 2023). Future work aiming to identify main drivers of fish migration would benefit from combining every possible category of predictors, such as hydrological variables (as in the case of our study), and other physical-chemical variable such as water temperature, turbidity, dissolved oxygen, phosphate, and nitrate as these variables have been reported to influence fish communities in the Mekong Basin (Chea et al., 2016).
The Dai fishery in the Tonle Sap system contributes 60% to the annual commercial fish market in Cambodia and feeds tens of millions of people (McCann et al., 2015; Yoshida et al., 2020). However, the Dai fishery is dependent on the unique hydrology of the Tonle Sap system that supports migratory fish. Previous research on the impacts of dams throughout the Mekong River Basin have provided evidence of the alteration of flows and fragmented migratory fish habitats (Arias et al., 2014; Hecht et al., 2019; Sor et al., 2023). With 11 proposed dams on the mainstem Mekong River, and more in tributaries, flow alteration could shift or impact migratory cues for fishes, potentially disrupting migratory patterns. Our findings of the key drivers of fish migration for six species provide a better understanding of hydrologic and environmental conditions needed to maintain fish migrations, fish harvest, and biodiversity in the Lower Mekong Basin and Tonle Sap system.
Statements
Data availability statement
The analyzed data in this study is provided by the Mekong River Commission and is available in raw form via request to the Mekong River Commission. Requests to access the datasets should be directed to PN (pengbun.ngor@gmail.com).
Ethics statement
The animal study was approved by the Inland Fisheries Research and Development Institute (IFReDI), Cambodia Fisheries Administration, and all methods were carried out in accordance with relevant guidelines and regulations of IFReDI. The study was conducted in accordance with the local legislation and institutional requirements.
Author contributions
RS: Writing – review & editing, Writing – original draft, Visualization, Validation, Software, Project administration, Methodology, Investigation, Formal analysis, Data curation, Conceptualization. LP: Writing – review & editing, Validation, Data curation, Conceptualization. ZH: Writing – review & editing, Supervision, Project administration, Investigation, Funding acquisition. SC: Writing – review & editing, Supervision, Project administration, Funding acquisition. PN: Writing – review & editing, Project administration, Investigation, Data curation. SN: Writing – review & editing, Validation, Supervision, Resources, Project administration, Methodology, Investigation, Funding acquisition, Conceptualization.
Funding
The author(s) declare financial support was received for the research, authorship, and/or publication of this article. This research was funded by United States Agency for International Development's “Wonders of the Mekong” Cooperative Agreement No: AID-OAA-A-16-00057.
Acknowledgments
We thank the Mekong River Commission for providing the environmental database for our analysis.
Conflict of interest
The authors declare that the research was conducted in the absence of any commercial or financial relationships that could be construed as a potential conflict of interest.
The author(s) declared that they were an editorial board member of Frontiers, at the time of submission. This had no impact on the peer review process and the final decision.
Publisher’s note
All claims expressed in this article are solely those of the authors and do not necessarily represent those of their affiliated organizations, or those of the publisher, the editors and the reviewers. Any product that may be evaluated in this article, or claim that may be made by its manufacturer, is not guaranteed or endorsed by the publisher.
Supplementary material
The Supplementary Material for this article can be found online at: https://www.frontiersin.org/articles/10.3389/ffwsc.2024.1426350/full#supplementary-material
References
1
Arias M. E. Piman T. Lauri H. Cochrane T. A. Kummu M. (2014). Dams on Mekong tributaries as significant contributors of hydrological alterations to the Tonle Sap Floodplain in Cambodia. Hydrol. Earth Syst. Sci. 18, 5303–5315. 10.5194/hess-18-5303-2014
2
Baird I. G. Flaherty M. S. (2001). Mekong River Artisanal Fisheries: Gill Netting for Medium-Sized Migratory Carps Below the Khone Falls in Southern Lao PDR. Technical Report for the Environmental Protection and Community Development in Siphandone Wetland Project. Pakse: CESVI; Lao PDR 28.
3
Baird I. G. Flaherty M. S. Phylavanh B. (2004). Mekong River Pangasiidae catfish migrations and the Khone Falls wing trap fishery in Southern Laos. Nat. Hist. Bull. Siam Soc. 52, 81–109. Available online at: https://www.researchgate.net/publication/234093167_Mekong_River_Pangasiidae_catfish_migrations_and_the_Khone_Falls_wing_trap_fishery_in_southern_Laos
4
Baran E. (2006). Fish Migration Triggers in the Lower Mekong Basin and Other Tropical Freshwater Systems, MRC Technical Paper No. 14. MRC Technical Paper No. 14 (Vientiane: Mekong River Commission), 56.
5
Barbarossa V. Schmitt R. J. P. Huijbregts M. A. J. Zarfl C. King H. Schipper A. M. (2020). Impacts of current and future large dams on the geographic range connectivity of freshwater fish worldwide. Proc. Natl. Acad. Sci. U. S. A. 117, 3648–3655. 10.1073/pnas.1912776117
6
Capitaine L. Genuer R. Thi R. (2021). Random forests for high-dimensional longitudinal data. Stat. Methods Med. Res. 30, 166–184. 10.1177/0962280220946080
7
Chan B. Sor R. Ngor P. B. Baehr C. Lek S. (2019). Modelling spatial and temporal dynamics of two small mud carp species in the Tonle Sap flood-pulse ecosystem. Ecol. Modell. 392, 82–91. 10.1016/j.ecolmodel.2018.11.007
8
Chan S. Chhuon K. C. Viravong S. Bouakhamvongsa K. Suntornratana U. Yoorong N. et al . (1999). Fish Migrations and Spawning Habits in the Mekong Mainstream—a Survey Using Local Knowledge, MRC Technical Report. Vientiane: Mekong River Commission.
9
Chann K. Sok T. Khoeun R. Men V. Visessri S. Oeurng C. et al . (2022). Prolonged and severe drought in the most dammed tributaries of the Lower Mekong Basin. Sustainability14:16254. 10.3390/su142316254
10
Chea R. Lek S. Ngor P. B. Grenouillet G. (2016). Large-scale patterns of fish diversity and assemblage structure in the longest tropical river in Asia. Ecol. Freshw. Fish26, 575–585.
11
Chhorn S. Chan B. Sin S. Doeurk B. Chhy T. Phauk S. et al . (2020). Diversity, abundance and habitat characteristics of mayflies (Insecta: Ephemeroptera) in Chambok, Kampong Speu Province, southwest Cambodia. Cambod. J. Nat. Hist. 2020, 61–68. Available online at: https://rupp.edu.kh/cjnh/journal/CJNH-2020-2/CJNH%202020(2)%20Chhorn%20et%20al.pdf
12
Chhuoy S. Hogan Z. S. Chandra S. Chheng P. Touch B. Utsugi K. et al . (2022). Daily otolith ring validation, age composition, and origin of the endangered striped catfish in the Mekong. Glob. Ecol. Conserv. 33:e01953. 10.1016/j.gecco.2021.e01953
13
Cochrane T. A. Arias M. E. Piman T. (2014). Historical impact of water infrastructure on water levels of the Mekong River and the Tonle Sap system. Hydrol. Earth Syst. Sci. 18, 4529–4541. 10.5194/hess-18-4529-2014
14
Dewi C. Chen R. C. (2019). Random forest and support vector machine on features selection for regression analysis. Int. J. Innov. Comput. Inf. Control15, 2027–2037. 10.24507/ijicic.15.06.2027
15
Doeurk B. Chhorn S. Sin S. Phauk S. Sor R. (2022). Diversity, distribution and habitat associations of aquatic beetles (Order Coleoptera) in Chambok, southwest Cambodia. Cambod. J. Nat. Hist. 2022, 90–98. Available online at: https://rupp.edu.kh/cjnh/journal/CJNH-2022-2/CJNH%2021-60%20Doeurk%20et%20al.pdf
16
FAO (2014). The State of World Fisheries and Aquaculture 2014. Rome: Food and Agriculture Organization of the United Nations (FAO).
17
Fukushima M. Jutagate T. Grudpan C. Phomikong P. Nohara S. (2014). Potential effects of hydroelectric dam development in the Mekong River Basin on the Migration of Siamese Mud Carp (Henicorhynchus siamensis and H. lobatus) elucidated by otolith microchemistry. PLoS ONE9:103722. 10.1371/journal.pone.0103722
18
Goodrum G. C. Null S. E. (2022). Reduced complexity models for regional aquatic habitat suitability assessment. J. Am. Water Resour. Assoc. 77, 1–20. 10.1111/1752-1688.13077
19
Halls A. S. Paxton B. R. Hall N. Peng Bun N. Lieng S. Pengby N. et al . (2013). The Stationary Trawl (Dai) Fishery of the Tonle Sap-Great Lake System, Cambodia. MRC Technical Paper No. 32. Phnom Penh: MRC.
20
Haran J. P. Ward D. V. Bhattarai S. K. Loew E. Dutta P. Higgins A. et al . (2021). The high prevalence of Clostridioides difficile among nursing home elders associates with a dysbiotic microbiome. Gut Microbes13:e1897209. 10.1080/19490976.2021.1897209
21
Hastie T. Tibshirani R. Friedman J. (2008). The Elements of Statistical Learning, 2nd Edn. Bethel, CA: Springer.
22
Hecht J. S. Lacombe G. Arias M. E. Dang T. D. Piman T. (2019). Hydropower dams of the Mekong River basin: a review of their hydrological impacts. J. Hydrol. 568, 285–300. 10.1016/j.jhydrol.2018.10.045
23
Hildebrandt E. K. Parsons G. R. (2016). Effect of turbidity on the swimming performance of the golden shiner, Notemigonus crysoleucas. Copeia149, 1–4. 10.1643/CI-14-149
24
Krabbenhoft C. A. Kashian D. R. (2022). Invasion success of a freshwater fish corresponds to low dissolved oxygen and diminished riparian integrity. Biol. Invasions. 22:1. 10.1007/s10530-022-02827-1
25
Kummu M. Tes S. Yin S. Adamson P. Józsa J. Koponen J. et al . (2014). Water balance analysis for the Tonle Sap Lake-floodplain system. Hydrol. Process. 28, 1722–1733. 10.1002/hyp.9718
26
Lohani S. Dilts T. E. Weisberg P. J. Null S. E. Hogan Z. S. (2020). Rapidly accelerating deforestation in Cambodia' s Mekong River Basin: a comparative analysis of spatial patterns and drivers. Water12:2191. 10.3390/w12082191
27
Lynch A. J. Cooke S. J. Deines A. M. Bower S. D. Bunnell D. B. Cowx I. G. et al . (2016). The social, economic, and environmental importance of inland fish and fisheries. Environ. Rev. 24, 115–121. 10.1139/er-2015-0064
28
McCann K. S. Gellner G. McMeans B. C. Deenik T. Holtgrieve G. Rooney N. et al . (2015). Food webs and the sustainability of indiscriminate fisheries. Can. J. Fish. Aquat. Sci. 665, 656–665. 10.1139/cjfas-2015-0044
29
Mekong River Commission (2019). State of the Basin Report 2018, Mekong River Commission. Vientiane: Mekong River Commission.
30
Mekong River Commission (2020). MRC—Data Portal [WWW Document]. Available online at: https://portal.mrcmekong.org/home (accessed June 05, 2020).
31
Minitab (2017). One-Way ANOVA. Available online at: https://support.minitab.com/en-us/minitab/media/pdfs/translate/Assistant_One_Way_ANOVA.pdf
32
Morales-Marín L. A. Rokaya P. Sanyal P. R. Sereda J. Lindenschmidt K. E. (2019). Changes in streamflow and water temperature affect fish habitat in the Athabasca River basin in the context of climate change. Ecol. Modell. 407:108718. 10.1016/j.ecolmodel.2019.108718
33
Morovati K. Tian F. Kummu M. Shi L. Tudaji M. Nakhaei P. et al . (2023). Contributions from climate variation and human activities to flow regime change of Tonle Sap Lake from 2001 to 2020. J. Hydrol. 616:128800. 10.1016/j.jhydrol.2022.128800
34
Ngor P. B. Grenouillet G. Phem S. So N. Lek S. (2018a). Spatial and temporal variation in fish community structure and diversity in the largest tropical flood-pulse system of South-East Asia. Ecol. Freshw. Fish2018, 1–14. 10.1111/eff.12417
35
Ngor P. B. Legendre P. Oberdorff T. Lek S. (2018b). Flow alterations by dams shaped fish assemblage dynamics in the complex Mekong-3S river system. Ecol. Indic. 88, 103–114. 10.1016/j.ecolind.2018.01.023
36
Ngor P. B. Mccann K. Grenouillet G. So N. McMeans B. C. Fraser E. et al . (2018c). Evidence of indiscriminate fishing effects in one of the world's largest inland fisheries. Sci. Rep. 8:8947. 10.1038/s41598-018-27340-1
37
Null S. E. Farshid A. Goodrum G. Gray C. A. Lohani S. Morrisett C. N. et al . (2021). A meta-analysis of environmental tradeoffs of hydropower dams in the Sekong, Sesan, and Srepok (3S) Rivers of the Lower Mekong Basin. Water13:13010063. 10.4211/hs.5e57b81fa6994fc3b63f6b7d5dc54cf0
38
Olden J. D. Naiman R. J. (2010). Incorporating thermal regimes into environmental flows assessments: modifying dam operations to restore freshwater ecosystem integrity. Freshw. Biol. 55, 86–107. 10.1111/j.1365-2427.2009.02179.x
39
O'Mara K. Venarsky M. Stewart-Koster B. McGregor G. B. Schulz C. Kainz M. et al . (2021). Connectivity of fish communities in a tropical floodplain river system and predicted impacts of potential new dams. Sci. Total Environ. 788:147785. 10.1016/j.scitotenv.2021.147785
40
Pellagatti M. Masci C. Ieva F. Paganoni A. M. (2021). Generalized mixed-effects random forest: a flexible approach to predict university student dropout. Stat. Anal. Data Min. ASA Data Sci. J. 14, 241–257. 10.1002/sam.11505
41
Poff N. (1997). Landscape filters and species traits: towards mechanistic understanding and prediction in stream ecology. North Am. Benthol. Soc. 16, 391–409. 10.2307/1468026
42
R Core Team (2024). R: A Language and Environment for Statistical Computing. Available online at: http://www.r-project.org/
43
Richter B. D. Baumgartner J. V. Powell J. Braun D. P. (1996). A method for assessing hydrologic alteration within ecosystems. Conserv. Biol. 10, 1163–1174. 10.1046/j.1523-1739.1996.10041163.x
44
Richter B. D. Braun D. P. Mendelson M. Master L. L. (1997). Threats to imperilled freshwater fauna. Conserv. Biol. 11, 1081–1093. 10.1046/j.1523-1739.1997.96236.x
45
Rytwinski T. Harper M. Taylor J. J. Bennett J. R. Donaldson L. A. Smokorowski K. E. et al . (2020). What are the effects of flow-regime changes on fish productivity in temperate regions? A systematic map. Environ. Evid. 9, 1–26. 10.1186/s13750-020-00190-z
46
Sabo J. L. Ruhi A. Holtgrieve G. W. Elliott V. Arias M. E. M. Ngor P. B. et al . (2017). Designing river flows to improve food security futures in the Lower Mekong Basin. Science358:eaao1053. 10.1126/science.aao1053
47
So N. Utsugi K. Shibukawa K. Thach P. Chhuoy S. Kim S. et al . (2018). Fishes of Cambodian Freshwater Bodies (Phnom Penh: Inland Fisheries Research and Development Institute, Fisheries Administration), 197.
48
Sor R. Boets P. Chea R. Goethals P. L. M. Lek S. (2017). Spatial organization of macroinvertebrate assemblages in the Lower Mekong Basin. Limnologica64, 20–30. 10.1016/j.limno.2017.04.001
49
Sor R. Meas S. Wong K. K. Y. Min M. Segers H. (2014). Diversity of Monogononta rotifer species among standing waterbodies in northern Cambodia. J. Limnol. 74, 192–204. 10.4081/jlimnol.2014.995
50
Sor R. Ngor P. B. Boets P. Goethals P. L. M. Lek S. Hogan Z. S. et al . (2020). Patterns of mekong mollusc biodiversity: identification of emerging threats and importance to management and livelihoods in a region of globally significant biodiversity and endemism. Water12:92619. 10.3390/w12092619
51
Sor R. Ngor P. B. Lek S. Chann K. Khoeun R. Chandra S. et al . (2023). Fish biodiversity declines with dam development in the Lower Mekong Basin. Sci. Rep. 13:8571. 10.1038/s41598-023-35665-9
52
Sor R. Ngor P. B. Soum S. Chandra S. Hogan Z. S. Null S. E. (2021). Water quality degradation in the lower Mekong Basin. Water13:1555. 10.3390/w13111555
53
Suzuki R. Shimodaira H. (2006). Pvclust: an R package for assessing the uncertainty in hierarchical clustering. Bioinformatics22, 1540–1542. 10.1093/bioinformatics/btl117
54
Tudesque L. Pool T. K. Chevalier M. (2019). Planktonic diatom community dynamics in a tropical flood-pulse lake: the Tonle Sap (Cambodia). Diatom Res. 34, 1–22. 10.1080/0269249X.2019.1585960
55
Webb B. Hannah D. Moore R. Brown L. Nobilis F. (2008). Recent advances in stream and river temperature research. Hydrol. Process22, 902–918. 10.1002/hyp.6994
56
Yoshida Y. Lee H. S. Trung B. H. Tran H. D. Lall M. K. Kakar K. et al . (2020). Impacts of mainstream hydropower dams on fisheries and agriculture in lower mekong basin. Sustainability12, 1–21. 10.3390/su1206240
Summary
Keywords
Tonle Sap Lake, Mekong River, flow, duration, timing, Dai fisheries, adaptive management
Citation
Sor R, Prudencio L, Hogan ZS, Chandra S, Ngor PB and Null SE (2024) Factors influencing fish migration in one of the world's largest inland fisheries. Front. Freshw. Sci. 2:1426350. doi: 10.3389/ffwsc.2024.1426350
Received
01 May 2024
Accepted
15 July 2024
Published
06 August 2024
Volume
2 - 2024
Edited by
Peter Goethals, Ghent University, Belgium
Reviewed by
Leandro E. Miranda, US Geological Survey and Mississippi State University, United States
Carlos Cano-Barbacil, Senckenberg Research Institute and Natural History Museum Frankfurt, Germany
Updates
Copyright
© 2024 Sor, Prudencio, Hogan, Chandra, Ngor and Null.
This is an open-access article distributed under the terms of the Creative Commons Attribution License (CC BY). The use, distribution or reproduction in other forums is permitted, provided the original author(s) and the copyright owner(s) are credited and that the original publication in this journal is cited, in accordance with accepted academic practice. No use, distribution or reproduction is permitted which does not comply with these terms.
*Correspondence: Ratha Sor sorsim.ratha@gmail.com
Disclaimer
All claims expressed in this article are solely those of the authors and do not necessarily represent those of their affiliated organizations, or those of the publisher, the editors and the reviewers. Any product that may be evaluated in this article or claim that may be made by its manufacturer is not guaranteed or endorsed by the publisher.