
- Center for Research on Genomics and Global Health, National Human Genome Research Institute, Bethesda, MD, USA
Association studies are a staple of genotype–phenotype mapping studies, whether they are based on single markers, haplotypes, candidate genes, genome-wide genotypes, or whole genome sequences. Although genetic epidemiological studies typically contain data collected on multiple traits which themselves are often correlated, most analyses have been performed on single traits. Here, I review several methods that have been developed to perform multiple trait analysis. These methods range from traditional multivariate models for systems of equations to recently developed graphical approaches based on network theory. The application of network theory to genetics is termed systems genetics and has the potential to address long-standing questions in genetics about complex processes such as coordinate regulation, homeostasis, and pleiotropy.
Introduction
To date, most genetic studies designed to map trait loci have focused on single traits. However, both small-scale studies of experimental crosses of model organisms and large-scale clinical and epidemiological studies in humans often include data collection for multiple traits. For example, studies of human obesity might include multiple measures of obesity, such as the body mass index, percent fat mass, and waist circumference, that are moderately to strongly correlated. Studies might also have measures for related traits, such as hypertension, serum lipids, and type 2 diabetes. Statistical advantages of performing joint analysis of correlated traits include increased power to detect loci and increased precision of parameter estimation (Jiang and Zeng, 1995; Zhu and Zhang, 2009). Biological advantages of performing joint analysis of correlated traits include the ability to address the issue of pleiotropy (one locus influencing multiple correlated traits) vs. tight linkage (linked loci each influencing one of the traits; Almasy et al., 1997; Liu et al., 2007) as well as the ability to investigate endophenotypes (Wojczynski and Tiwari, 2008) intermediate between a gene and a trait, e.g., serum metabolites, as a step toward understanding how biochemical pathways relate to complex traits.
Many methods for multiple trait analysis in genetics were first employed in linkage analysis, often from experimental crosses. These traditional multivariate methods are easily adapted to genome-wide association data from human studies. Recently, graphical-based methods for jointly analyzing multiple traits have been developed based on network theory. The application of network theory to genetics has given rise to systems genetics, which is the study of networks of interactions between genes and traits as well as networks of interactions among traits, ideally integrating functional data into the genotype–phenotype map (Ayroles et al., 2009; Nadeau and Dudley, 2011). I describe both non-graphical- and graphical-based methods for multiple trait analysis, focusing on methods already implemented in freely available software.
Univariate Analysis
Suppose one trait is measured for i = 1,2,…,n unrelated individuals. The generalized linear model takes the form E(y) = μ = f−1(Xβ), in which E(y) are the expected values for a single measure for the n individuals, Xβ are the linear predictors, and f is the link function. For continuous traits, the link function is identity, μ = Xβ. For binary traits, e.g., case (yi = 1) or control (yi = 1) data, the link function is the logit function,  Probit regression can also be used for traits that are binomially distributed. The probit model is a latent variable model of the form y* = Xβ, in which yi is an indicator for the latent variable
  and defined by
The latent variable  is known as the liability and is assumed to be normally distributed. Extensions for polytomous variables include the multinomial logit and probit models for nominal or unordered categorical dependent variables and the ordered logit and probit models for ordered categorical dependent variables.
Dimension Reduction
A general class of approaches to deal with multiple traits is to first perform dimension reduction on the traits. Dimension reduction techniques include principal components analysis and linear discriminant analysis. Principal components analysis seeks to identify linear combinations of the variables that explain the most variance in the data, whereas linear discriminant analysis seeks to identify linear combinations of the variables that discriminate between classes or disjoint subgroups of the data. Weller et al. (1996) proposed multiple analysis of univariate, uncorrelated eigentraits derived by eigen decomposition of the covariance matrix for the original traits. Korol et al. (2001) proposed eigen decomposition of the phenotypic covariance matrix in order to reduce the multiple traits into a single variable, but over short genomic intervals to account for the natural stratification of a sample by genotype. Elston et al. (2000) transformed the traits to their principal components, performed univariate regression analysis on each principal component, and then summed the squared non-negative univariate t-statistics, assuming that this sum asymptotically follows a mixture of χ2 distributions. The major limitation of these approaches is that it is not always possible to find a canonical transformation guaranteeing that all loci influence only one canonical trait.
Principal components analysis of heritability (Ott and Rabinowitz, 1999) can be used to extract the eigenvector explaining the most heritability (Lange et al., 2004; Wang et al., 2007; Klei et al., 2008). If the number of traits exceeds the number of individuals, as in a typical gene expression experiment, a ridge penalty can be added to prevent overfitting (Wang et al., 2007).
Canonical correlation analysis is a multivariate generalization of the Pearson product–moment correlation (Hotelling, 1936). Ferreira and Purcell (2009) use canonical correlation analysis between a marker and a set of traits to extract the linear combination of traits that explain the most covariance. Their test is based on Wilk’s lambda and approximately follows the F-distribution.
Multivariate and Graphical Models
Graphical models represent a synthesis of multivariate probabilistic theory and graph theory. The former provides the mathematical details of the relationships among the multiple traits, which are either correlations or conditional dependencies. The latter provides visualization and algorithmic efficiencies, which are increasingly important as the number of traits increases beyond three or four.
Suppose there are t = 1,2,…,T continuous traits measured for i = 1,2,…,n individuals. We can specify a system of equations as
in which yt is the vector of phenotypic values for trait t, μt is the grand mean for trait t, Xt is the matrix of predictors for trait t, βt is the vector of regression coefficients for trait t, and εt is a vector of zero-mean, normally distributed random errors. The traditional multivariate model assumes that X1 = X2 = … = XT (e.g., see Knott and Haley, 2000).
The likelihood function for the joint distribution of correlated phenotypes can be difficult to specify, particularly for mixed outcomes. Liang and Zeger (1986) and Zeger and Liang (1986) proposed an extension of generalized linear models called generalized estimating equations. Generalized estimating equation models do not rely on assumptions of standard parametric distributions such as multivariate normality. In the absence of a joint error model, this approach assumes only that the marginal distributions of the outcomes follow univariate generalized linear error models. The user is required to specify the mean function, the variance function, and the “working” correlation matrix. Sandwich estimators of SE for parameter estimates are generally robust to misspecification of the working correlation matrix. Generalized estimating equation models allow for dependence within clusters of observations, such as may occur with panel data. In genetics, generalized estimating equations are commonly used as an alternative to generalized linear mixed models to model the random effect of family (Lange et al., 2003).
Seemingly unrelated regression extends ordinary least squares estimation to a system of linear equations with correlated error terms (Zellner, 1962; Verzilli et al., 2005; Banerjee et al., 2008). The model assumes that the residual errors are identically and independently distributed for each individual within each trait but allows for the residual errors to be correlated for an individual across traits. For the system of equations  ,
,  and
and  for i ≠ i′ and all t but
  for t ≠ t′ and all i. In contrast to the traditional multivariate model, different traits can have different sets of predictors.
A major difficulty in formulating analyses for multiple traits is evident in the difference between traditional multivariate analysis and seemingly unrelated regression: parameter estimation may include unconstrained effects for each independent variable or may include constrained effects for some or all independent variables. These possibilities reflect different alternative hypotheses to be compared to the global null hypothesis. Ideally, the analyst would specify one of these alternative hypotheses a priori but sometimes interest may be in more than one or even all of the alternative hypotheses. To deal with this situation, which raises considerable uncertainty about how to appropriately correct for multiple comparisons, Stephens (2010) suggested using Bayesian model averaging, allowing the data to indicate which hypothesis is most strongly supported.
Less work has been done with non-parametric tests for multiple traits. Zhang et al. (2010) described a rank-based approach using the generalized Kendall’s τ and corresponding U-statistics. This approach can handle mixed outcomes but does not consider covariates.
Bivariate normal regression analyzes two normally distributed dependent variables jointly as functions of possibly different sets of independent variables. The joint outcome is described by two continuous variables that follow the bivariate normal distribution:
in which μ1 is the mean for y1, μ2 is the mean for y2,  is the variance of y1,
  is the variance of y2, and ρ is the correlation between y1 and y2. Generalized estimating equations have been described for two quantitative traits in single marker analysis (Yang et al., 2009).
Bivariate logistic regression analyzes two binary dependent variables jointly as functions of possibly different sets of independent variables. The joint outcome follows a Bernoulli distribution:
with the constraint that π00 + π10 + π01 + π11 = 1. These joint probabilities are modeled with three parameters: the marginal probability P(y1 = 1) = π10 + π11, the marginal probability P(y2 = 1) = π01 + π11, and the odds ratio that relates the two dependent variables  . The bivariate probit regression model also analyzes two binary dependent variables jointly as functions of possibly different sets of independent variables. The joint outcomes are described by two latent continuous variables that follow the bivariate normal distribution:
in which μ1 is the mean for  , μ2 is the mean for
  , ρ is the correlation between
  and
and , and
, and
for j = 1,2.
Bivariate analysis of a continuous trait and a binary trait is more challenging but has been described. Liu et al. (2007) used a mixed linear–probit model for the joint outcome (yi1,yi2), in which y1 is the continuous trait and y2 is the binary trait, assuming the bivariate normal distribution
with the indicator function
Liu et al. (2009) combined two extended generalized estimating equations under the seemingly unrelated regression framework, using an identity link for the continuous trait and a logit link for the binary trait. The main difficulty with this approach is specifying the correlation between the continuous and binary traits, and the authors rely on extended generalized estimating equations to provide an “association parameter” as an alternative to the correlation coefficient. In the mixed linear–probit model, the correlation ρ is between two normal distributions and therefore is more easily interpretable than the association parameters in generalized estimating equations. Using generalized estimating equations, Prentice and Zhao (1991) also used the identity link for the continuous trait and the logistic link for the binary trait. Fitzmaurice and Laird (1997) factorized the joint likelihood into the product of the marginal distribution of the binary outcome and the conditional distribution of the continuous outcome given the binary outcome. Factorization takes advantage of conditional dependencies and is the basis of calculating the joint probability distribution of a network, as described below.
A graph is a set of nodes and edges. In multiple trait analysis, nodes represent traits and edges represent the relationships between traits. There are many ways to define whether an edge should be drawn between two nodes. For example, one could compute correlation coefficients for all pairs of traits and connect two nodes with an edge if the correlation coefficient is larger than some threshold value. The resulting correlation graph is referred to as a relevance network (Butte and Kohane, 1999). In the absence of a threshold, all edges exist and can be assigned weights equal to the corresponding correlation coefficients. The graph-guided fused lasso approach makes use of these types of graphs (Kim and Xing, 2009). Alternatively, one could use pairwise mutual information to construct a relevance network (Butte and Kohane, 2000). An adjacency matrix, also known as a proximity matrix, is a matrix-based representation of a graph. Generally, an adjacency matrix is an integer-valued matrix in which the elements indicate which nodes are connected by edges, but conventions for allowed values of elements can vary according to the type of graph. Adjacency matrices can be used as variables in generalized linear models after vectorization.
Tree-based approaches include classification trees and regression trees, which are both based on recursive partitioning of a sample into homogeneous disjointed subgroups (Hastie et al., 2009). In gene mapping, tree-based approaches have been used more with multiple independent variables (Kooperberg and Ruczinski, 2005; Yu et al., 2005; Pan et al., 2009) than with multiple dependent variables. Chen et al. (2003) used classification trees to identify candidate genes affecting fasting plasma glucose in offspring while also considering body mass index, blood pressure, and maternal triglyceride levels.
A Bayesian network is a directed acyclic graph in which the nodes represent random variables and edges represent conditional dependencies between random variables (Heckerman, 1995). A set of random variables is a Bayesian network with respect to the graph if each variable is conditionally independent of its non-descendants given its parents. The joint probability distribution for an entire network requires the evaluation of conditional dependencies and can be simplified by factorization. To illustrate, consider the Bayesian network in Figure 1A (Stephens, 2010). Node M represents the genetic marker of interest, node D represents the subset of traits directly associated with the marker, node I represents the subset of traits indirectly associated with the marker, and node U represents the subset of traits unassociated with the marker. M and U are parent nodes for D. D and U are parent nodes for I. M and I are conditionally independent given D. U is independent of M. The joint probability distribution of this network factorizes as P(M, D, I, U) = P(M) P(D|M, U) P(I|D, U) P(U). In the corresponding adjacency matrix, rows represent parent nodes and columns represent child nodes (Figure 1B). An edge’s presence is indicated by 1 and its absence is indicated by 0. The adjacency matrix is asymmetric because the graph is directed.
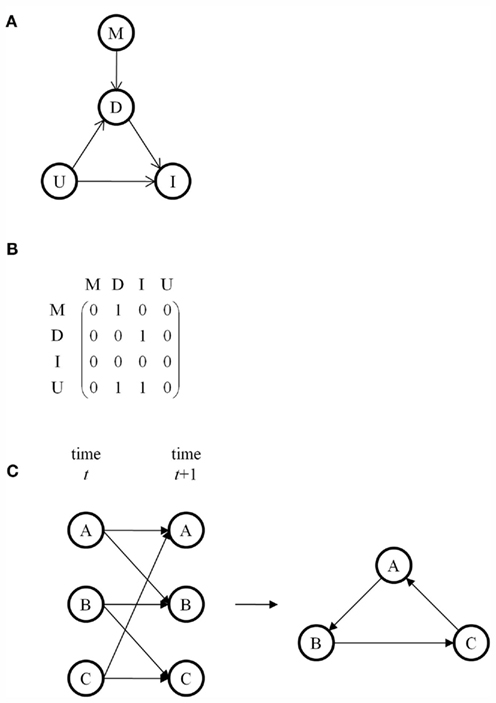
Figure 1. (A) A Bayesian network consisting of a marker M, traits D directly associated with M, traits I indirectly associated with M, and traits U unassociated with M. Edges represent conditional dependencies, with the arrow pointing from the parent node to the child node. (B) The adjacency matrix corresponding to the graph in (A). (C) A dynamic Bayesian network for a cycle using an underlying Bayesian network that is acyclic.
A major limitation of Bayesian networks is that directed acyclic graphs disallow feedback loops. One workaround is to use a Markov network, also called a Markov random field, in which the edges are undirected and in which loops are permitted. Alternatively, dynamic Bayesian networks are Bayesian networks for use with time series data (Murphy and Mian, 1999). By representing all nodes at more than time point and drawing edges from nodes at earlier times to nodes at later times, dynamic Bayesian networks can model feedback loops while using an underlying acyclic Bayesian network (Figure 1C). A widely used example of a dynamic Bayesian network is a hidden Markov model (Rabiner, 1989). Another alternative is structural equation modeling, which uses correlations to evaluate edges rather than conditional dependencies but which allows for cycles (Wright, 1921; Valente et al., 2010).
Post Hoc Summaries
Methods for analysis of summary-level data of multiple univariate analyses have been described. Karasik et al. (2010) compared the number of shared associated markers from single trait analyses to the total number of non-associated markers; an excess of shared associated markers given the number expected by chance was considered evidence of pleiotropy. Cotsapas et al. (2011) developed the Cross Phenotype Meta-Analysis statistic to assess if the distribution of association p-values from single trait analyses showed that a marker was associated with at least some but not necessarily all of the traits. Yang et al. (2010) used cross-validation to improve O’Brien’s linear combination test (Xu et al., 2003) when effect sizes for a single marker are heterogeneous for the multiple traits. Huang et al. (2011) developed the Pleiotropy Index to quantify the number of traits with low association p-values at a specified region in the genome, accounting for linkage disequilibrium between markers in the region, and estimated the statistical distribution of the Pleiotropy Index under the global null hypothesis of no phenotype–genotype association for any of the traits. Gupta et al. (2011) used biclustering of markers associated with at least one trait from multiple univariate analyses to identify clusters of markers having similar effects on clusters of traits. These approaches are necessarily limited by the power and precision of the univariate analyses upon which they are based.
Software
Software for many multivariate and graphical models is freely available (Table 1). The R package Zelig is particularly noteworthy for its inclusiveness and flexibility (Imai et al., 2008).
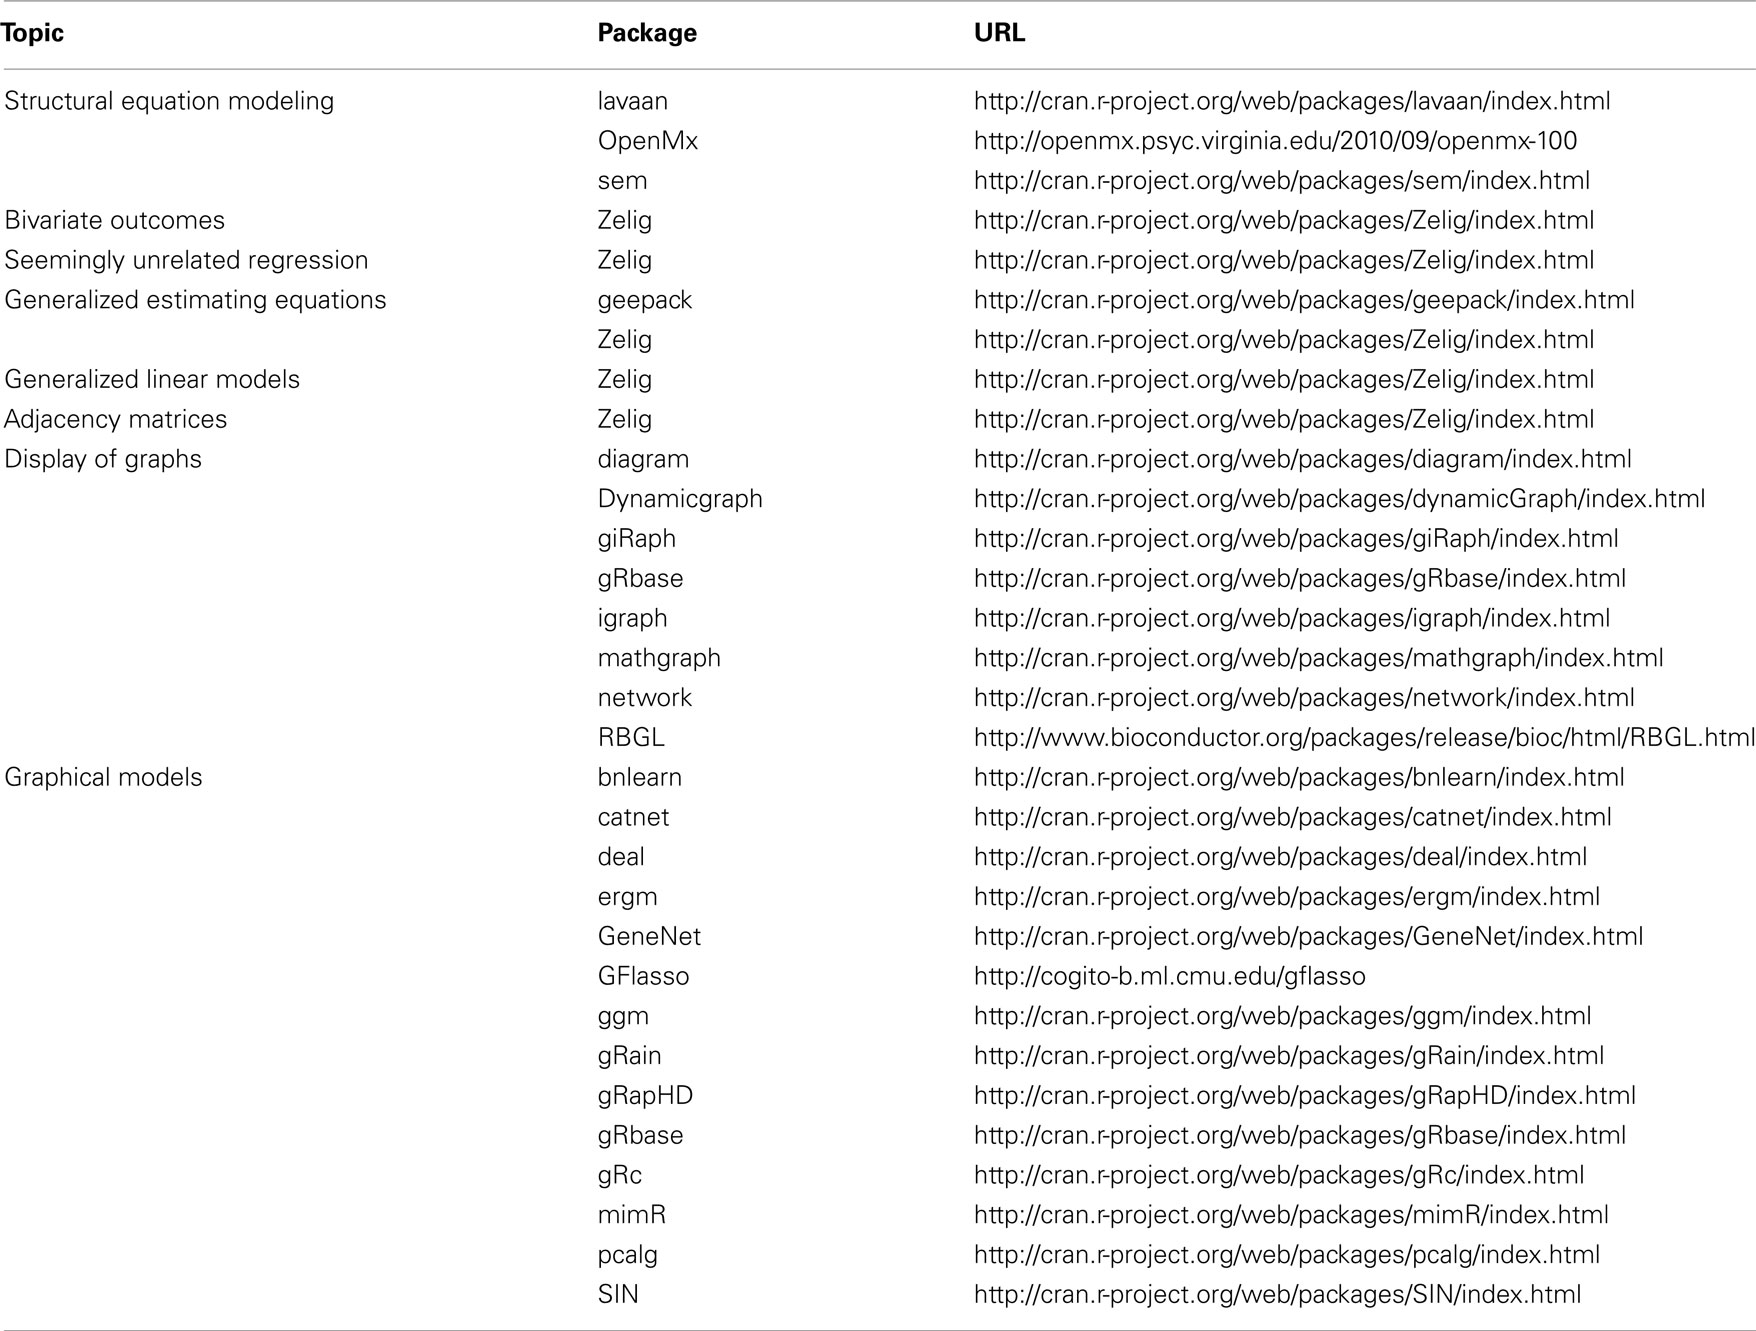
Table 1. Software freely available for multiple trait analysis.
Conclusion
Multivariate approaches are generally more efficient than multiple univariate approaches in the presence of correlated outcomes and when outcomes depend on different sets of independent variables and predictors (Teixeira-Pinto and Normand, 2009). Generalized estimating equations are robust to misspecified correlation structures but will be outperformed by multivariate approaches if the parametric form of correlation is correctly specified. Multivariate analysis can prevent problems arising from missing data and interpretation that may complicate multiple univariate analyses when different sets of individuals are included. Traditional multivariate analysis can simplify the multiple comparisons issue but more flexible approaches such as seemingly unrelated regression can exacerbate the problem. Bayesian model averaging represents one solution to this problem.
The extent of pleiotropy has direct bearing on the genetic architecture of diseases and traits. The frequency distribution of the degree of pleiotropy tends to be L-shaped, i.e., a small number of genes affect many traits and most genes affect a small number of traits (Wagner and Zhang, 2011). If loci are under balancing selection due to antagonistic pleiotropy (negative covariance), susceptibility alleles may be common in human populations (Wang et al., 2010). This scenario is consistent with autoimmune diseases being relatively amenable to genome-wide association studies (Wang et al., 2010). On the other hand, if purifying selection removes deleterious mutations from highly connected “hub” genes, then susceptibility alleles may preferentially reside in functionally and topologically peripheral genes that are non-essential and are less likely to be pleiotropic, as may be the scenario for metabolic disorders (Goh et al., 2007).
Multiple trait analysis with genetic association data is full of promise in the context of systems genetics. Foremost, both data and methods currently exist to allow researchers to move beyond single trait analysis and address higher order questions of biology, evolution, and genetics. Additionally, metabolic networks, regulatory networks, and signaling networks are all examples of flow networks (Hyduke and Palsson, 2010). A future direction is to use network theory to integrate genetic epidemiological data with these types of flow networks to better understand the genotype–phenotype map.
Conflict of Interest Statement
The author declares that the research was conducted in the absence of any commercial or financial relationships that could be construed as a potential conflict of interest.
Acknowledgments
The contents of this publication are solely the responsibility of the author and do not necessarily represent the official view of the National Institutes of Health. This work was supported by the Intramural Research Program of the Center for Research on Genomics and Global Health. The Center for Research on Genomics and Global Health is supported by the National Human Genome Research Institute, the National Institute of Diabetes and Digestive and Kidney Diseases, the Center for Information Technology, and the Office of the Director at the National Institutes of Health (1ZIAHG200362-02). I thank Laura Kelly Vaughan for comments on this manuscript.
References
Almasy, L., Dyer, T. D., and Blangero, J. (1997). Bivariate quantitative trait linkage analysis: pleiotropy versus co-incident linkages. Genet. Epidemiol. 14, 953–958.
Ayroles, J. F., Carbone, M. A., Stone, E. A., Jordan, K. W., Lyman, R. F., Magwire, M. M., Rollmann, S. M., Duncan, L. H., Lawrence, F., Anholt, R. R. H., and Mackay, T. F. C. (2009). Systems genetics of complex traits in Drosophila melanogaster. Nat. Genet. 41, 299–307.
Banerjee, S., Yandell, B. S., and Yi, N. (2008). Bayesian quantitative trait loci mapping for multiple traits. Genetics 179, 2275–2289.
Butte, A. J., and Kohane, I. S. (1999). Unsupervised knowledge discovery in medical databases using relevance networks. Proc. AMIA Symp. 711–715.
Butte, A. J., and Kohane, I. S. (2000). Mutual information relevance networks: functional genomic clustering using pairwise entropy measurements. Pac. Symp. Biocomput. 5, 415–426.
Chen, C.-H., Chang, C. J., Yang, W.-S., Chen, C.-L., and Fann, C. S. J. (2003). A genome-wide scan using tree-based association analysis for candidate loci related to fasting plasma glucose levels. BMC Genet. 4(Suppl. 1), S65. doi:10.1186/1471-2156-4-S1-S65
Cotsapas, C., Voight, B. F., Rossin, E., Lage, K., Neale, B. M., Wallace, C., Abecasis, G. R., Barrett, J. C., Behrens, T., Cho, J., De Jager, P. L., Elder, J. T., Graham, R. R., Gregersen, P., Klareskog, L., Siminovitch, K. A., Van Heel, D. A., Wijmenga, C., Worthington, J., Todd, J. A., Hafler, D. A., Rich, S. S., and Daly, M. J. (2011). Pervasive sharing of genetic effects in autoimmune disease. PLoS Genet. 7, e1002254. doi:10.1371/journal.pgen.1002254
Elston, R. C., Buxbaum, S., Jacobs, K. B., and Olson, J. M. (2000). Haseman and Elston revisited. Genet. Epidemiol. 19, 1–17.
Ferreira, M. A., and Purcell, S. M. (2009). A multivariate test of association. Bioinformatics 25, 132–133.
Fitzmaurice, G. M., and Laird, N. M. (1997). Regression models for mixed discrete and continuous responses with potentially missing values. Biometrics 53, 110–122.
Goh, K.-I., Cusick, M. E., Valle, D., Childs, B., Vidal, M., and Barabási, A.-L. (2007). The human disease network. Proc. Natl. Acad. Sci. U.S.A. 104, 8685–8690.
Gupta, M., Cheung, C.-L., Hsu, Y.-H., Demissie, S., Cupples, L. A., Kiel, D. P., and Karasik, D. (2011). Identification of homogeneous genetic architecture of multiple genetically correlated traits by block clustering of genome-wide associations. J. Bone Miner. Res. 26, 1261–1271.
Hastie, T., Tibshirani, R., and Friedman, J. (2009). The Elements of Statistical Learning: Data Mining, Inference, and Prediction. New York, NY: Springer Science + Business Media, LLC.
Heckerman, D. (1995). A Tutorial on Learning with Bayesian Networks. Microsoft Research, Advanced Technology Division, Redmond, WA.
Huang, J., Johnson, A. D., and O’Donnell, C. J. (2011). PRIMe: a method for characterization and evaluation of pleiotropic regions from multiple genome-wide association studies. Bioinformatics 27, 1201–1206.
Hyduke, D. R., and Palsson, B. Ø. (2010). Towards genome-scale signalling-network reconstructions. Nat. Rev. Genet. 11, 297–307.
Imai, K., King, G., and Lau, O. (2008). Toward a common framework for statistical analysis and development. J. Comput. Graph. Stat. 17, 892–913.
Jiang, C., and Zeng, Z.-B. (1995). Multiple trait analysis of genetic mapping for quantitative trait loci. Genetics 140, 1111–1127.
Karasik, D., Hsu, Y.-H., Zhou, Y., Cupples, L. A., Kiel, D. P., and Demissie, S. (2010). Genome-wide pleiotropy of osteoporosis-related phenotypes: the Framingham Study. J. Bone Miner. Res. 25, 1555–1563.
Kim, S., and Xing, E. P. (2009). Statistical estimation of correlated genome associations to a quantitative trait network. PLoS Genet. 5, e1000587. doi:10.1371/journal.pgen.1000587
Klei, L., Luca, D., Devlin, B., and Roeder, K. (2008). Pleiotropy and principal components of heritability combine to increase power for association analysis. Genet. Epidemiol. 32, 9–19.
Knott, S. A., and Haley, C. S. (2000). Multitrait least squares for quantitative trait loci detection. Genetics 156, 899–911.
Kooperberg, C., and Ruczinski, I. (2005). Identifying interacting SNPs using Monte Carlo logic regression. Genet. Epidemiol. 28, 157–170.
Korol, A. B., Ronin, Y. I., Itskovich, A. M., Peng, J., and Nevo, E. (2001). Enhanced efficiency of quantitative trait loci mapping analysis based on multivariate complexes of quantitative traits. Genetics 157, 1789–1803.
Lange, C., Silverman, E. K., Xu, X., Weiss, S. T., and Laird, N. M. (2003). A multivariate family-based association test using generalized estimating equations: FBAT-GEE. Biostatistics 4, 195–206.
Lange, C., Van Steen, K., Andrew, T., Lyon, H., Demeo, D. L., Raby, B., Murphy, A., Silverman, E. K., Macgregor, A., Weiss, S. T., and Laird, N. M. (2004). A family-based association test for repeatedly measured quantitative traits adjusting for unknown environmental and/or polygenic effects. Stat. Appl. Genet. Mol. Biol. 3, Article17.
Liang, K.-Y., and Zeger, S. L. (1986). Longitudinal data analysis using generalized linear models. Biometrika 73, 13–22.
Liu, J., Liu, Y., Liu, X., and Deng, H.-W. (2007). Bayesian mapping of quantitative trait loci for multiple complex traits with the use of variance components. Am. J. Hum. Genet. 81, 304–320.
Liu, J., Pei, Y., Papasian, C. J., and Deng, H.-W. (2009). Bivariate association analyses for the mixture of continuous and binary traits with the use of extended generalized estimating equations. Genet. Epidemiol. 33, 217–227.
Murphy, K., and Mian, S. (1999). Modeling Gene Expression Data Using Dynamic Bayesian Networks. Computer Science Division, University of California, Berkley, CA.
Ott, J., and Rabinowitz, D. (1999). A principal-components approach based on heritability for combining phenotype information. Hum. Hered. 49, 106–111.
Pan, F., McMillan, L., Pardo-Manuel de Villena, F., Threadgill, D., and Wang, W. (2009). TreeQA: quantitative genome wide association mapping using local perfect phylogeny trees. Pac. Symp. Biocomput. 415–426.
Prentice, R. L., and Zhao, L. P. (1991). Estimating equations for parameters in means and covariances of multivariate discrete and continuous responses. Biometrics 47, 825–839.
Rabiner, L. R. (1989). A tutorial on hidden Markov models and selected applications in speech recognition. Proc. IEEE 77, 257–286.
Stephens, M. (2010). “A unified framework for testing multiple phenotypes for association with genetic variants,” in 60th Annual Meeting of the American Society of Human Genetics, Washington, DC.
Teixeira-Pinto, A., and Normand, S. L. (2009). Correlated bivariate continuous and binary outcomes: issues and applications. Stat. Med. 28, 1753–1773.
Valente, B. D., Rosa, G. J. M., de los Campos, G., Gianola, D., and Silva, M. A. (2010). Searching for recursive causal structures in multivariate quantitative genetics mixed models. Genetics 185, 633–644.
Verzilli, C. J., Stallard, N., and Whittaker, J. C. (2005). Bayesian modelling of multivariate quantitative traits using seemingly unrelated regressions. Genet. Epidemiol. 28, 313–325.
Wagner, G. P., and Zhang, J. (2011). The pleiotropic structure of the genotype-phenotype map: the evolvability of complex organisms. Nat. Rev. Genet. 12, 204–213.
Wang, K., Baldassano, R., Zhang, H., Qu, H.-Q., Imielinski, M., Kugathasan, S., Annese, V., Dubinsky, M., Rotter, J. I., Russell, R. K., Bradfield, J. P., Sleiman, P. M. A., Glessner, J. T., Walters, T., Hou, C., Kim, C., Frackelton, E. C., Garris, M., Doran, J., Romano, C., Catassi, C., Van Limbergen, J., Guthery, S. L., Denson, L., Piccoli, D., Silverberg, M. S., Stanley, C. A., Monos, D., Wilson, D. C., Griffiths, A., Grant, S. F., Satsangi, J., Polychronakos, C., and Hakonarson, H. (2010). Comparative genetic analysis of inflammatory bowel disease and type 1 diabetes implicates multiple loci with opposite effects. Hum. Mol. Genet. 19, 2059–2067.
Wang, Y., Fang, Y., and Jin, M. (2007). A ridge penalized principal-components approach based on heritability for high-dimensional data. Hum. Hered. 64, 182–191.
Weller, J. I., Wiggans, G. R., Vanraden, P. M., and Ron, M. (1996). Application of a canonical transformation to detection of quantitative trait loci with the aid of genetic markers in a multi-trait experiment. Theor. Appl. Genet. 92, 998–1002.
Xu, X., Tian, L., and Wei, L. J. (2003). Combining dependent tests for linkage or association across multiple phenotypic traits. Biostatistics 4, 223–229.
Yang, F., Tang, Z., and Deng, H. (2009). Bivariate association analysis for quantitative traits using generalized estimation equation. J. Genet. Genomics 36, 733–743.
Yang, Q., Wu, H., Guo, C.-Y., and Fox, C. S. (2010). Analyze multivariate phenotypes in genetic association studies by combining univariate association tests. Genet. Epidemiol. 34, 444–454.
Yu, K., Xu, J., Rao, D. C., and Province, M. (2005). Using tree-based recursive partitioning methods to group haplotypes for increased power in association studies. Ann. Hum. Genet. 69, 577–589.
Zeger, S. L., and Liang, K.-Y. (1986). Longitudinal data analysis for discrete and continuous outcomes. Biometrics 42, 121–130.
Zellner, A. (1962). An efficient method of estimating seemingly unrelated regressions and tests for aggregation bias. J. Am. Stat. Assoc. 57, 348–368.
Zhang, H., Liu, C.-T., and Wang, X. (2010). An association test for multiple traits based on the generalized Kendall’s tau. J. Am. Stat. Assoc. 105, 473–481.
Keywords: multivariate analysis, pleiotropy, systems genetics
Citation: Shriner D (2012) Moving toward system genetics through multiple trait analysis in genome-wide association studies. Front. Gene. 3:1. doi: 10.3389/fgene.2012.00001
Received: 04 November 2011;
Paper pending published: 23 November 2011;
Accepted: 01 January 2012;
Published online: 16 January 2012.
Edited by:
Xiaogang Wu, Indiana University-Purdue University Indianapolis, USAReviewed by:
Fan Zhang, Mount Sinai School of Medicine, USAYuedong Yang, Indiana University-Purdue University at Indianapolis, USA
Chi Zhang, University of Nebraska – Lincoln, USA
Copyright: © 2012 Shriner. This is an open-access article distributed under the terms of the Creative Commons Attribution Non Commercial License, which permits non-commercial use, distribution, and reproduction in other forums, provided the original authors and source are credited.
*Correspondence: Daniel Shriner, Center for Research on Genomics and Global Health, Building 12A, Room 4047, 12 South Drive, MSC 5635, Bethesda, MD 20892-5635, USA. e-mail:c2hyaW5lcmRhQG1haWwubmloLmdvdg==