


 Paul Siegel3

- 1 Department of Animal Breeding and Genetics, Swedish University of Agricultural Sciences, Uppsala, Sweden
- 2 Department of Animal Sciences, Purdue University, W. Lafayette, IN, USA
- 3 Department of Animal and Poultry Sciences, Virginia Polytechnic Institute and State University, Blacksburg, VA, USA
- 4 Department of Cell and Molecular Biology, Uppsala University, Uppsala, Sweden
Most biological traits are regulated by a complex interplay between genetic and environmental factors. By intercrossing divergent lines, it is possible to identify individual and interacting QTL involved in the genetic architecture of these traits. When the loci have been mapped, alternative strategies are needed for fine-mapping and studying the individual and interactive effects of the QTL in detail. We have previously identified, replicated, and fine mapped a four-locus QTL network that determines nearly half of the eightfold difference in body weight at 56 days of age between two divergently selected chicken lines. Here, we describe, to our knowledge, the first generation of a three-locus QTL introgression line in chickens. Recurrent marker-assisted backcrossing was used to simultaneously transfer QTL alleles from the low-weight selected line into the high-weight selected line. Three generations of backcrossing and one generation of intercrossing resulted in an introgression line where all three introgressed QTL and several unlinked and linked control-loci were segregating at nearly expected allele frequencies. We show how intensive selection can be applied using artificial insemination to rapidly generate a multi-locus introgression line and provide recommendations for future breeding of introgression lines. This confirmed introgression line will facilitate later detailed studies of the effects of genetic interactions on complex traits in this population, including growth, and body-composition traits.
Introduction
QTL mapping in intercrosses between phenotypically divergent inbred or outbred lines is a commonly used strategy to identify genetic loci that regulate complex traits. This approach enhances the power to map loci underlying the difference between the crossed lines. The loci are, however, mapped with low resolution and as the genetic effects are estimated in the genetic background of an intercross, they are likely to be different from the effects of the loci in the parental populations. By transferring important genes or QTL from one line into another, it is possible to, e.g., study their functional genetic effects in a more homogenous background or to improve the performance of the recipient line within a breeding program. This transfer of QTL alleles can be done using recurrent backcrossing of a donor line to a recipient line. Such an introgression program is initiated by generating an F1 population from the two founder lines. Genetic markers within the QTL region are used to identify individuals that carry desirable QTL donor alleles and therefore will be used as parents when producing the next backcross generation (Visscher et al., 1996; Hospital and Charcosset, 1997). After backcrossing to the recipient line for a desired number of generations, the introgression process is completed by generating a population with all three genotypes segregating at the QTL. This is achieved by intercrossing within the last backcross generation. Most introgression experiments involve introgressing limited genetic regions from one inbred line into another, resulting in congenic lines that are genetically identical everywhere in the genome except the locus where introgression has taken place. Here, we do not name the final population a congenic line, but rather an introgression line, to indicate that the donor-, recipient-, and QTL introgressed-lines will not be congenic. This as the founder lines are outbred, resulting in an introgression line that will be polymorphic both in the QTL regions as well as in other regions of the genome. QTL introgression lines have mostly been generated in plants, but have also been reported in domestic animals (e.g., Elsen et al., 1994; Lecomte et al., 2004; Koudandé et al., 2005).
The Virginia lines are a unique chicken resource population for studying the genetic effects of long-term divergent artificial selection. They contain two chicken lines selected for high- and low-body weight at 56 days of age since 1957. After 53 generations they show a 12-fold difference in weight as well as correlated responses in other traits including growth of different organs, appetite, metabolic, reproductive, and immune response traits (Dunnington and Siegel, 1996; Marquez et al., 2010). QTL analyses in a reciprocal intercross between the high-weight selected (HWS) and low-weight selected (LWS) lines have earlier identified 13 QTL with small individual effects on body weight (Jacobsson et al., 2005) and an epistatic network of four loci explaining nearly half of the weight difference (Carlborg et al., 2006). Using an advanced intercross line (AIL) between the lines, the four loci in the network were replicated and fine mapped (Besnier et al., 2011; Pettersson et al., 2011). The four epistatic QTL are connected in a radial network, where the central locus is located on chromosome 7. In the F2 population, the HWS allele at this locus releases the genetic effects of the radial loci located on chromosomes 3, 4, and 20. HWS alleles at these three loci jointly release the genetic effect of the locus on chromosome 7, i.e., the release of the genetic effects is reciprocal. In addition to replicate the effect of the four QTL on body weight, the higher mapping resolution in the AIL population allowed dissection of the original QTL region on chromosome 7 into two separate loci (Besnier et al., 2011). Further investigations of the epistatic interactions confirmed the radial four-locus network and that one of the two QTL on chromosome 7 were primarily involved in the epistatic interactions (region 7–1; Pettersson et al., 2011). The replication of the originally reported epistatic loci (Carlborg et al., 2006) provides strong empirical evidence for the biological importance of the epistatic network as well as its contribution to the genetic architecture of the large selection response in the Virginia lines.
Carlborg et al. (2006) only explored the effects of the four QTL network on body weight and fat deposition. In a later study, Ek et al. (2010) investigated how the network regulated other traits including breast muscle, abdominal fat, and shank weight. The results indicated that the overall effect of the network is a symmetric growth of tissue, rather than a relative increase in their respective weights. An exception is the interaction between the loci on chromosome 3 and 7, which, in addition to its contribution to the general increase in body weight, also alters the relative amounts of breast muscle and abdominal fat (Ek et al., 2010).
Here, we describe the breeding of a multi-locus introgression line. The LWS QTL alleles for the central locus (locus 7–1 on chromosome 7) and two radial loci (on chromosome 3 and 4) were simultaneously introgressed into a HWS genetic background. The HWS line was selected as the recipient line as it has a higher survival rate than the LWS line. The genotype at the fourth locus in the original epistatic network (on chromosome 20) as well as the second linked, but non-interacting, locus on chromosome 7 (7–2) was not introgressed due to limitations in the number of offspring that could be bred per generation. Instead the genotypes at these loci were monitored to trace the removal of background QTL alleles at important loci. This is to our knowledge the first introgression of multiple loci in chicken and this line can be highly useful to detect and further study the effects of multi-locus genetic interactions on metabolic phenotypes in chicken.
Materials and Methods
Animal Management
Breeding and management of the birds was done at the Purdue Animal Sciences Research Center (ASREC). All procedures involving animals were carried out in accordance with the Purdue Animal Care and Use Committee (approval number 08-001). Eggs were incubated in commercial incubators, and upon hatch chicks were toe clipped, blood samples collected onto FTA cards via clipped toe, and vaccinated for Marek’s, Newcastle bronchitis, infectious bursal disease (IBD), and avian encephalomyelitis (AE). Birds were placed in cages (61 cm W × 61 cm D × 41 cm H). Water and food was provided ad lib and birds were reared on various diets depending on age. Growing birds up to 20 weeks of age were given a dietary formulation of corn soybean mash progressing from starter (0–4 weeks, 20% crude protein, and 3009 ME kcal/kg) to grower (4–8 weeks, 18.6% crude protein, and 3005 ME kcal/kg), diets. At 56 days of age, birds were weighed, and fed a pre-layer diet (18% crude protein and 2920 kcal/kg). At 16 weeks of age individuals to be used for breeding were transferred to individual cages measuring (37 cm W × 51 cm D × 46 cm H). From 20 weeks of age and onward, the birds were fed a standard layer diet (17.3% crude protein, 3046 ME kcal/kg). Mating by artificial insemination was initiated when female birds were at peak production (30 weeks of age). Semen collection was initiated in pure-line and final intercross (IC1) males at 30 weeks of age. Collection was initiated at the same time for all backcross males, and as these were hatched in four to six separate hatches the age at initiation of collection varied between 24 and 30 weeks. Hens were inseminated using glass straws twice a week for 2 weeks prior to egg collection and twice a week during egg collection. In the first generation, insemination was done using semen from individual males. For maintaining the HWS line, roosters were mated to a single hen and to breed the first backcross line (BC1) the males were mated to four hens. For the following generations, semen was pooled to improve fertility. Thus in the second backcross (BC2), third backcross (BC3) and IC1, four pools each containing semen from three males were used to inseminate from 8 to 15 females depending on the amount of semen produced. Eggs were collected for 2 weeks and stored in a cooler prior to incubation.
Selection of QTL Regions to be Introgressed
As the number of birds that could be bred per generation was limited, we decided to generate a QTL introgression line containing three interacting QTL – the central locus in the reported interaction network (locus 7–1 on chromosome 7) and the two of the radial loci that displayed the strongest capacitating epistasis with the central locus (loci on chromosome 3 and 4). The chromosomal segments to be introgressed were determined from the QTL profiles for the three regions selected in the previously reported AIL study (Besnier et al., 2011). Figure 1 shows the QTL profiles and the segments that were introgressed. The figure also shows the location of the markers genotyped in the regions, all in relation to the QTL curves for the regions in the AIL.
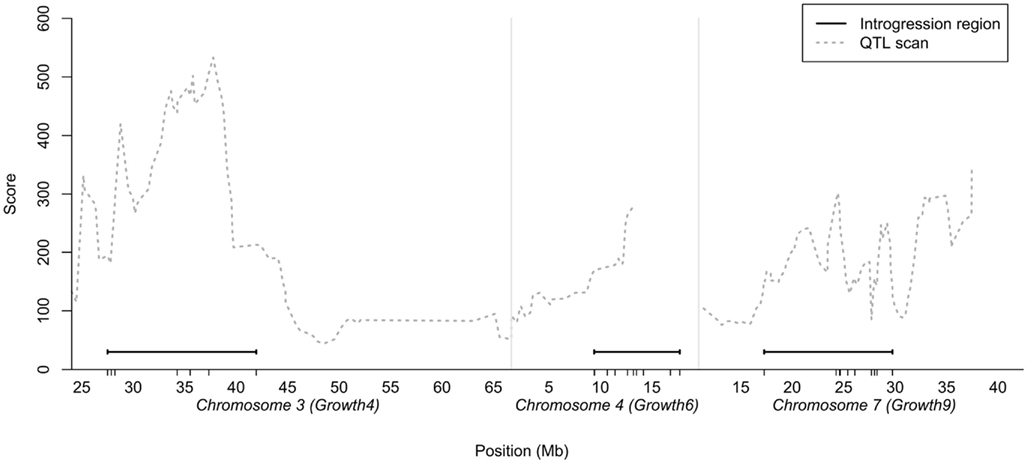
Figure 1. Chromosomal segments on chicken chromosome 3, 4, and 7 selected for introgression plotted in relation to the statistical support-curve for the corresponding QTL in these regions from a QTL replication study in a nine generation Advanced Intercross Line (Besnier et al., 2011). The short vertical lines on the x-axis show the locations of the markers genotyped in the regions.
Selection of Markers to Identify Line Origin of Introgressed Segments
To trace the inheritance of LWS alleles through the recurrent backcrossing to HWS females, a SNP marker panel of 32 markers was developed. It included nine SNPs previously used for selective sweep mapping in the HWS and LWS lines as part of a 13-K SNP chip genotyping array (Wahlberg et al., 2009). These nine SNPs had allele frequency differences between the HWS (n = 15) and LWS (n = 15) founders of an earlier F2 intercross between the lines (Jacobsson et al., 2005; Carlborg et al., 2006) in the range 0.8–1.0. Additionally, 23 new SNPs were developed from the sequence generated in a ∼5X genome resequencing experiment of two HWS and LWS DNA pools from generation 41 (Rubin et al., 2010). The markers were selected to have a large expected allele frequency difference between the lines. To achieve this objective, the selected SNPs had a relatively large number of sequencing reads (12 on average, range 8–16), and indicated fixation for different alleles in the two lines. To select the best possible markers, the sequencing read pattern among neighboring SNPs possibly in LD with the target SNP was also evaluated (Marklund and Carlborg, 2010). Of the 32 SNPs, 28 were located within or very close to the three target regions to be introgressed. Three markers were located in a second QTL region on chromosome 7 (7–2; Besnier et al., 2011) a few Mbp upstream of the target (7–1) region to be introgressed, and one marker was located in a QTL region on chromosome 20 (Besnier et al., 2011). The number of offspring that could be bred in each generation allowed simultaneous introgression of three regions. To avoid potential residual phenotypic effect in the introgression line of the two other QTL regions (7–2 and 20) involved in the original network, we genotyped four markers in these regions as well to monitor the removal of the HWS alleles at these loci As no selection was applied at these loci, the genotypes for the four markers in these regions could also be used to indicate the efficiency of LWS allele removal in linked and unlinked non-selected regions. A full genome-wide evaluation of the efficiency of LWS allele removal was both beyond the scope of this study and less important than during breeding of congenic lines as there will be a large degree of allele-sharing across the genome in this population anyway due to the recent common founder population of the selected lines.
Visual and Genetic Sexing
In this type of projects where the hatches are small and female backcross individuals are not used for breeding, the cost for employing the highly skilled individuals for visual vent sexing at hatch would be high. Therefore, we used visual sexing at 16 weeks of age and also developed a panel of W-specific genetic markers for sex determination to be evaluated later against the visual sexing results. Five markers were selected within sequences included in the W-specific HUR0417 and HUR0423 PCR amplicons presented by Granevitze et al., 2007; Marklund et al., in preparation).
Genotyping
Genotyping was performed by NEOGEN–GeneSeek using the iPLEX technology based on primer extension and MALDI-TOF mass spectrometry (SEQUENOM Inc., http://www.sequenom.com). The 32 SNP markers were combined with the five sexing markers in this arrangement. The sexing markers were not SNPs, but tests for presence or absence of W-chromosomal sequences.
Breeding of the Three-Locus Introgression Line
In Figure 2, we provide a detailed description of the breeding plan for the three-locus introgression line. In short, an F1 population was generated by crossing 14 LWS males to 56 HWS females from generation 50 of the purebred Virginia lines (Dunnington and Siegel, 1996; Marquez et al., 2010). Fourteen randomly selected males from the F1 population were then backcrossed to 41 HWS females to generate the first backcross generation (BC1). The BC2 and BC3 generations were generated as follows. All birds were visually sexed at 16 weeks of age. Females were culled whereas males were bled and genotyped for 32 SNP markers in the three QTL regions to be introgressed as well as two QTL control regions. In the BC2 and BC3 generations, the five sexing markers on the W-chromosome were used in addition to the visual sexing both to get preliminary sexing results and evaluate the potential usefulness of this method in future introgression experiments by comparing it to visual sexing (Marklund et al., in preparation). The same 32 plus 5 SNP marker panel was used to genotype all individuals in the first intercross (IC1) generation. In each backcross generation 12 males, heterozygous across all three QTL regions to be introgressed, were selected for breeding of the next backcross generation. The actual breakpoints at the edges of the LWS haplotype blocks were not monitored in the selected sires outside of the intended introgression region and thus they are likely to differ. In BC1 and BC2, the males were mated to pure-line HWS females. In BC3, males were intercrossed with 60 BC3 females that were also selected based on their heterozygosity in the QTL regions. In IC1, the birds are expected to segregate with an intermediate allele frequency (expected p = q = 0.5) in the three QTL regions, i.e., have all three possible genotypes in the QTL regions at frequencies 0, 25, 0.5, and 0.25, while having an expected allele frequency of the LWS alleles of p = 0.0625 in the rest of the genome.
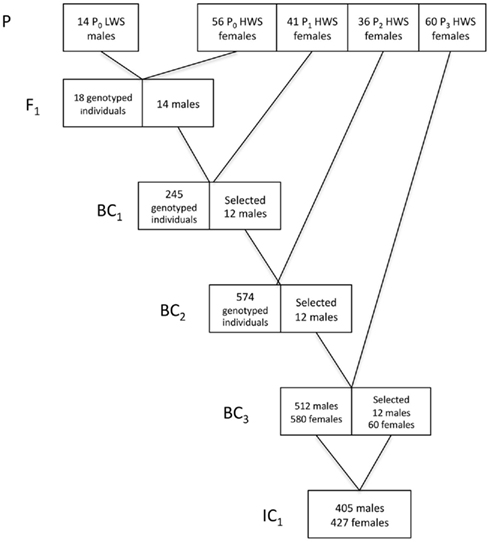
Figure 2. Breeding scheme for the three-locus introgression line. Numbers in boxes gives the number of males and/or females (F) selected for breeding and the number of individuals in IC1.
Results and Discussion
Characterization of LWS QTL Regions to be Introgressed
Table 1 summarizes the details of the selected QTL regions, their location, sizes, and average SNP density. To characterize the regions, we first genotyped 10 LWS and 48 HWS chickens together with 18 of their F1 male offspring using the 32 SNP marker panel. The allele frequency difference between the LWS (n = 10) and HWS (n = 48) was calculated to evaluate the usefulness of each marker individually as well as the total multi-marker information of all markers in the region for correctly assigning the parental line allelic origin. In each genotyped backcross generation, the most likely line origin of the paternal alleles transmitted to offspring was derived using these markers.
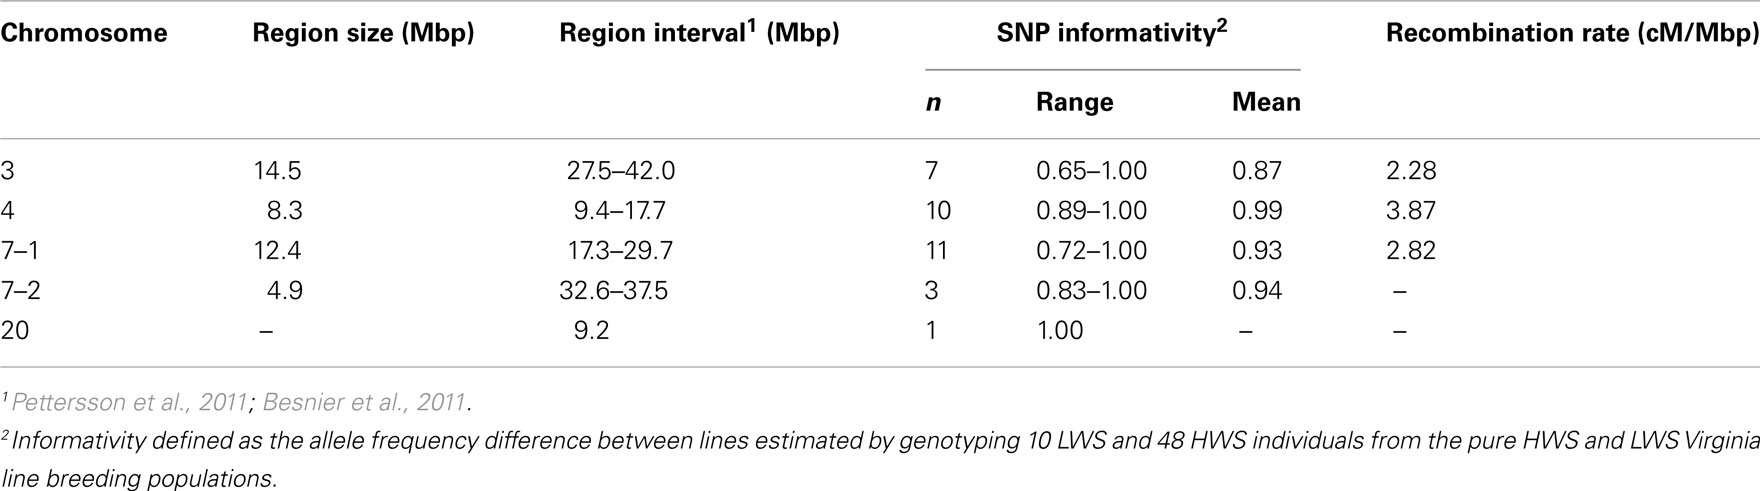
Table 1. Detailed information about the three introgressed chromosomal segments on chromosome 3, 4, and 7 (7–1) as well as the linked and unlinked genotyped QTL control regions [on chromosome 7 (7–2) and 20] in the chicken introgression line.
Evaluating QTL Introgression Efficiency
To study the efficiency of the introgression procedure across generations, we traced the LWS allele frequency for all the 32 genotyped markers in generations BC1–BC3 as well as in IC1 (Figures 3A–C). Only males were genotyped at the QTL in BC1, all males and 50% of the females in BC2, and all individuals of both sexes in BC3 and IC1. The figures clearly illustrate that the LWS allele frequency, as expected in a successful introgression experiment, remains close to 25% for the selected QTL regions in the BC1–BC3 generations. We did, however, observe some deviations from this expectation for markers on chromosome 3 and 7. The SNP at 24599037 Mbp was scored to have an LWS allele frequency near 0.7 in BC3. This was considerably higher than the frequencies in both earlier and later generations for this marker and also much higher than that of the flanking SNPs that were located less than 400 kb away. All of this suggested an error in the genotyping or processing of the genotypes of this particular marker, but this potential error could not be identified but it was despite this disregarded as the result is so unlikely given the other available information. There were also some smaller deviations for the two first proximal markers on chromosome 7. Here, however, the increase in the LWS allele frequency is consistent with the fact that the same allele is also present in the HWS line used for backcrossing at a frequency of p = 0.15. The IC1 is generated by intercrossing males and females from BC3 that were selected for their heterozygosity at the three QTL to be introgressed. As a result the allele frequency in this generation is expected to be near p = q = 0.5 for LWS and HWS alleles. When selecting BC3 breeders to generate IC1, there was a shortage of females that were LWS heterozygous for the entire QTL segments in all three regions. It was therefore decided that a smaller number of females that were recombinant in the region on chromosome 3 would be used as parents for the IC1 generation. As a result, there is a lower frequency of LWS alleles (40–45%) in this region (Figure 3A).
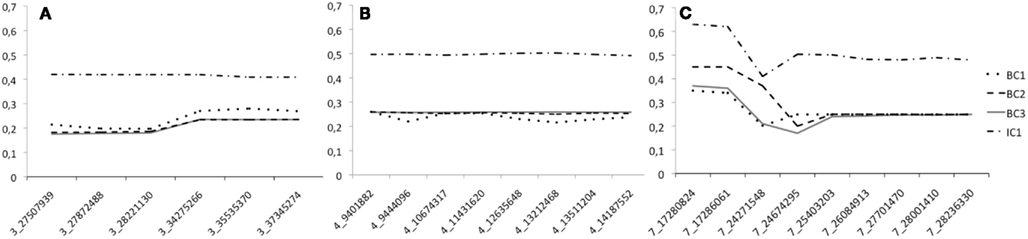
Figure 3. The LWS allele frequency across the four generations (BC1–IC1) bred when generating the three-locus chicken introgression line. Dotted lines show the backcross generations and the solid line IC1. Panes (A–C) give the allele frequency at each marker in the introgressed regions on chromosome 3, 4, and 7, respectively. The scored markers in each segment are provided on the x-axis and are named according to the system “Chromosome”_”Position on chromosome in Mbp.”
Evaluating the decrease in LWS background in linked and unlinked parts of the genome
The genotyping of four markers in two QTL regions outside of the three introgression regions allowed us to monitor the removal of LWS alleles at unselected linked and unlinked QTL regions in the genome. The allele frequency of the LWS allele at the unlinked marker on chromosome 20 decreases to eventually reach the expectation of 6% in generation IC1 (Table 2). The three unselected markers on chromosome 7 (Chromosome 7–2) are located approximately 4–9 Mb (12–27 cM) away from the selected chromosomal segment (Chromosome 7–1). The decrease in the LWS allele at these markers is, as expected due to linkage, slower. The rate of removal of LWS alleles does, however, approximately follow the expected decrease in allele frequency (Table 2). The deviation from the expectation was largest for the most distal marker in region 7–2. Upon closer inspection of the inheritance of this marker through the pedigree, the observed frequencies in all studied generations were consistent with the frequencies observed among the parental males for each of the generations. Since only 12 were selected and the number of offspring per male are likely to differ due to semen-pooling and differential fertility, the most likely explanation for this observation is therefore that the random sampling effect when picking the founder males for the next generation.
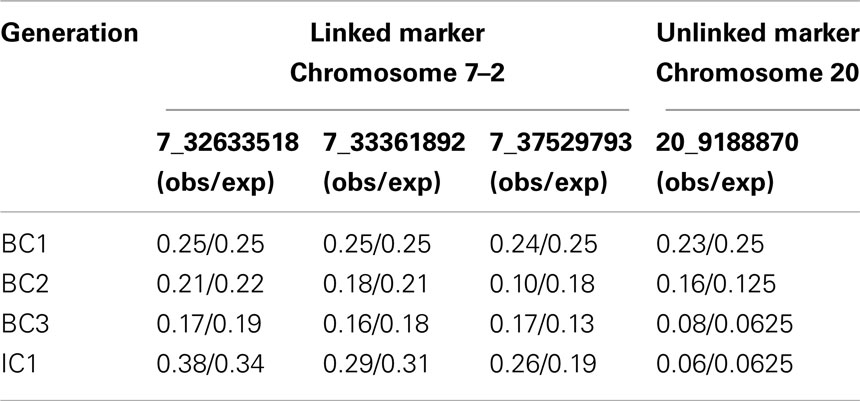
Table 2. LWS allele frequencies for linked and unlinked markers on chromosome 7 (7–2) and 20 across the four generations (BC1–IC1).
Breeding of Introgression Lines in Chicken
The chicken has several advantages for generating multi-locus introgression lines when compared to mammals. First, it is possible to hatch a large number of offspring from each female breeder. If selection of breeders for the next generation can be done rapidly, high cost–efficiency can be achieved by allowing evaluation of many offspring from each adult breeder. By using artificial insemination it is then possible to breed large half-sib families from each male. If selection is done in males and performed early in life, very few adult breeding males therefore need to be kept. All this allows high intensity of selection and decreased costs for animal maintenance. Our experiment involved evaluation of between 50 and 100 (10–20) offspring for each male (female) using a breeding population of only 12 males and approximately 60 females. If sufficiently large numbers of offspring are bred in each generation, a marker-assisted backcross scheme would allow selection not only on the QTL regions to be introgressed, but also for a decreased content of LWS alleles in the rest of the genome. This procedure increases both the precision in the introgression and decreases the number of generations needed to achieve a pre-defined LWS background allele frequency. The original plan for this experiment was to use this technique, but fewer selectable chicks were obtained from the breeding females than planned, this scheme was ultimately implemented in practice. The residual genetic background from the LWS line at loci that are not linked to the selected region is therefore expected to be 6.25% in the final introgression line. Although this might have some influence on the final results, we do not expect it to be of any major concern. The intended use of the introgression line is to confirm and further explore the mean phenotypic effect of three loci with known epistatic effects. The residual LWS alleles at unlinked loci are expected to be randomly associated with the genotypes at the epistatic loci and will therefore not have any profound effect on the mean estimates. They could potentially increase the variance slightly and thereby decrease the power in statistical testing, but as the expected multi-locus mean pattern is known the influence of this in practice is expected to be marginal. More importantly, though, the primary intended use of the multi-locus introgression lines is to explore epistatic interactions that are almost entirely displayed in combinations of homozygous genotypes at the involved loci. Consequently, the potential influence of residual genetic background epistatic effects are further marginalized at these residual allele frequencies as <0.5% of the intercross individuals are expected to be homozygous for the LWS allele at these background loci.
Semen-pooling to increase the number of offspring
In BC1, we obtained only about 30% of the chicks expected. In order to increase this in the coming generations and allow more efficient selection of breeders, we pooled semen from three males when generating BC2, BC3, and IC1. The potential drawback of the pooling is an increased challenge to trace the allelic line origin for the markers in the QTL segments and the sensitivity in detection of recombinants, as the pedigree will not be known with certainty. This did, however, not have any negative impact on the resulting introgression line as most markers included in the panel showed a very large allele frequency difference between lines (mean 0.93; Table 1) and semen was pooled from males with as similar QTL marker haplotypes as possible. This is thus a strategy that can be recommended to increase the number of offspring when breeding of chicken introgression lines when there are fertility issues.
Determining the number of required offspring in each generation
When generating an introgression line, multiple factors are important for determining the number of individuals needed in each backcross generation. To simultaneously introgress l loci, where selection is done in a single sex, recombination in the loci is not considered, and nB breeders are required from the selected sex, the average total number of individuals needed (n) is:

When introgression is performed on chromosomal segments, where recombination cannot be ignored, it is necessary to account for the number of recombinant offspring that are not useful as breeders. When l segments of length θi (Morgan) are introgressed, the total number of individuals needed increases to:

The number of recombinants per Mbp varies both between species and across the genome. It is thus necessary to account for the fraction of recombinant segments rather than the physical size of the segments when designing the study.
In this experiment, the introgressed segments are approximately 33, 32, and 35 cM long, respectively. In each generation, 12 male breeders are required. The expected total number of hatched offspring needed to obtain this number was:

or approximately 324 males assuming an equal sex-ratio.
Accounting for Experiment-Specific Recombination Rates
In mammals, the average recombination rate is approximately 1 cM/Mb (Kong et al., 2002). In the chicken, however, the rate is considerably higher. We estimated the recombination rates across the three QTL regions that we aimed to introgress (Table 1). This was done by scoring all offspring that showed differential line origin in that region, based on at least two markers on each side of the recombination point being recombinants. The first two SNPs in the chromosome 7–1 region were located about 5 kbp apart, and as they showed complete LD they were scored as a single marker. The observed recombination rates ranged from 2.58 to 3.87 cM/Mbp (Table 1) and are thus fairly consistent with earlier reported rates in the corresponding chicken chromosomal segments (Groenen et al., 2009). Our results, however, show an apparent trend in that the regions with lower marker information have lower estimated recombination frequencies (Table 1). It is therefore likely that the average recombination rate in these regions is higher than the present estimates indicate.
Particular Considerations When Breeding Introgression Lines from Outbred Founders
When generating introgression lines from non-inbred founder lines, the informativity of the markers used for tracing the line origin of the introgressed segments is of crucial importance. Thus, the setup of an efficient marker panel for this purpose is a central, but particularly challenging task, when introgressing segments originating from outbred and closely related lines. Here, the founders originated from the HWS and LWS Virginia chicken lines that have been divergently selected for juvenile body weight for more than 50 generations from a common base population. As selection was fairly intense (Marquez et al., 2010), considerable genetical divergence within the QTL regions was anticipated. In a recent study, however, Johansson et al. (2010) showed that much of the selection response in the lines was due to selection on standing genetic variation that was already present in the base population. They also showed that the clusters of SNPs with fixation for different alleles in the two lines cover only a minor part of the genome. Upon closer examination of the introgressed QTL regions, it can be seen that a major part of the QTL region on chromosome 4 overlaps with such clusters, whereas most of the introgressed regions on chromosome 3 and 7 do not show such overlaps. Consequently, the unique haplotype block(s) carrying the causative mutation(s) in these regions might therefore be rather short, perhaps less than 50 kbp in a species with as high a recombination rate as chicken (Groenen et al., 2009; Marklund and Carlborg, 2010). The QTL regions are therefore likely to contain many alleles and haplotypes that occur in both lines, which makes marker-assisted introgression more challenging. This is consistent with our observations during the development of the SNP panel and evaluation of the informativity of SNPs across these regions. Our results, however, show that despite this challenge it is possible to generate multi-locus introgression lines from closely related founders using SNP markers selected from SNP-chips and re-sequence data.
Conclusion
Here, we describe the breeding of a multi-locus introgression line from two outbred founder lines. We show that it is possible to simultaneously introgress multiple chromosomal segments with high precision in outbred chicken and that the overall genome-wide content of donor alleles decreased at an expected rate for non-selected linked and unlinked QTL regions. Semen-pooling was shown to be a useful technique for increasing the number of offspring from each female and it did not compromise efficiency in introgression. These lines can be a highly useful future resource for further dissection of the epistasis that the introgressed loci have previously been shown to be part of (Carlborg et al., 2006; Besnier et al., 2011; Pettersson et al., 2011). For this purpose, the final introgression line will be extensively phenotyped including measurements including conformational phenotypes such as body- and tissue-weights at 56 days of age. In addition, tissues will be harvested to evaluate the expression profiles in various tissues in individuals with alternative genotypes at the introgressed QTL.
Conflict of Interest Statement
The authors declare that the research was conducted in the absence of any commercial or financial relationships that could be construed as a potential conflict of interest.
Acknowledgments
This study was funded by a EURYI Award to Örjan Carlborg. The Royal Swedish Academy for Agriculture and Forestry (KSLA) provided travel support for two visits for Weronica Ek at Purdue University. We are grateful to Mats Pettersson and Francois Besnier for their help to prepare Figure 1.
References
Besnier, F., Wahlberg, P., Rönnegård, L., Ek, W., Andersson, L., Siegel, P. B., and Carlborg, Ö. (2011). Fine mapping and replication of QTL in outbred chicken advanced intercross lines. Genet. Sel. Evol. 43, 3.
Carlborg, Ö., Jacobsson, L., Åhgren, P., Siegel, P. B., and Andersson, L. (2006). Epistasis and the release of genetic variation during long-term selection. Nat. Genet. 38, 418–420.
Dunnington, E. A., and Siegel, P. B. (1996). Long-term divergent selection for eight-week body weight in white Plymouth rock chickens. Poult. Sci. 75, 1168–1179.
Ek, W., Strömstedt, L., Wahlberg, P., Siegel, P. B., Andersson, L., and Carlborg, Ö. (2010). Genetic analysis of metabolic traits in an intercross between body weight-selected chicken lines. Physiol. Genomics 42, 20–22.
Elsen, J. M., Bodin, L., Francois, D., Poivey, J. P., and Teyssier, J. (1994). “Genetic improvement of litter size in sheep,” in Proceedings of the 5th World Congress of Genetics Applied to Livestock Production (Guelph, ON: University of Guelph), 237–243.
Granevitze, Z., Blum, S., Cheng, H., Vignal, A., Morisson, M., Ben-Ari, G., Feldman, M. W., Weigend, S., and Hillel, J. (2007). Female-specific DNA sequence in the chicken genome. J. Hered. 98, 238–241.
Groenen, M. A., Wahlberg, P., Foglio, M., Cheng, H. H., Megens, H. J., Crooijmans, R. P., Besnier, F., Lathrop, M., Muir, W. M., Wong, G. K., Gut, I., and Andersson, L. (2009). A high-density SNP-based linkage map of the chicken genome reveals sequence features correlated with recombination rate. Genome Res. 19, 510–519.
Hospital, F., and Charcosset, A. (1997). Marker-assisted introgression of quantitative trait loci. Genetics 147, 1469–1485.
Jacobsson, L., Park, H.-B., Wahlberg, P., Fredriksson, R., Perez-Enciso, M., Siegel, P. B., and Andersson, L. (2005). Many QTLs with minor additive effects are associated with a large difference in growth between two selection lines in chickens. Genet. Res. 86, 115–125.
Johansson, A. M., Pettersson, M. E., Siegel, P. B., and Carlborg, Ö. (2010). Genome-wide effects of long-term divergent selection. PLoS Genet. 6, e1001188. doi:10.1371/journal.pgen.1001188
Kong, A., Gudbjartsson, D. F., Saintz, J., Jonsdottir, G. M., Gudjonsson, S. A., Richardsson, B., Sigurdadottir, S., Barnard, J., Hallbeck, B., Masson, G., Shlien, A., Palsson, S. T., Frigge, M. L., Thorgeirsson, T. E., Gulcher, J. R., and Stefansson, K. (2002). A high-resolution recombination map of the human genome. Nature 31, 241–247.
Koudandé, O. D., van Arendonk, J. A. M., and Iraqi, F. (2005). Marker-assisted introgression of Trypanotolerance QTL in mice. Mamm. Genome 16, 112–119.
Lecomte, L., Duffe, P., Buret, M., Servin, B., Hospital, F., and Causse, M. (2004). Marker-assisted introgression of five QTLs controlling fruit quality traits into three tomato lines revealed interactions between QTLs and genetic backgrounds. Theor. Appl. Genet. 109, 658–668.
Marklund, S., and Carlborg, Ö. (2010). SNP detection and prediction of variability between chicken lines using genome resequencing of DNA pools. BMC Genomics 25, 665. doi:10.1186/1471-2164-11-665
Marquez, G. C., Siegel, P. B., and Lewis, R. M. (2010). Genetic diversity and population structure in lines of chickens selected for high and low eight-week body weight. Poult. Sci. 89, 2580–2588.
Pettersson, M., Besnier, F., Siegel, P. B., and Carlborg, Ö. (2011). Replication and explorations of high-order epistasis using a large advanced intercross line pedigree. PLoS Genet. 7, e1002180. doi:10.1371/journal.pgen.1002180
Rubin, C. J., Zody, M. C., Eriksson, J., Meadows, J. R., Sherwood, E., Webster, M. T., Jiang, L., Ingman, M., Sharpe, T., Ka, S., Hallböök, F., Besnier, F., Carlborg, Ö., Bed’hom, B., Tixier-Boichard, M., Jensen, P., Siegel, P., Lindblad-Toh, K., and Andersson, L. (2010). Whole-genome resequencing reveals loci under selection during chicken domestication. Nature 464, 587–591.
Visscher, P. M., Haley, C. S., and Thompson, R. (1996). Marker-assisted introgression in backcross breeding programs. Genetics 144, 1923–1932.
Keywords: chicken, introgression, QTL, epistasis
Citation: Ek W, Marklund S, Ragavendran A, Siegel P, Muir W and Carlborg Ö (2012) Generation of a multi-locus chicken introgression line to study the effects of genetic interactions on metabolic phenotypes in chickens. Front. Gene. 3:29. doi: 10.3389/fgene.2012.00029
Received: 01 November 2011; Accepted: 15 February 2012;
Published online: 02 March 2012.
Edited by:
Jason Wolf, University of Bath, UKReviewed by:
Danielle Renee Reed, Monell Chemical Senses Center, USAGuifang Fu, Penn State University, USA
Jean Michel Claude Elsen, Institut National de la Recherche Agronomique, France
Jenny Howie, University of Manchester, UK
Copyright: © 2012 Ek, Marklund, Ragavendran, Siegel, Muir and Carlborg. This is an open-access article distributed under the terms of the Creative Commons Attribution Non Commercial License, which permits non-commercial use, distribution, and reproduction in other forums, provided the original authors and source are credited.
*Correspondence: Örjan Carlborg, Department of Animal Breeding and Genetics, Swedish University of Agricultural Sciences, Box 7023, SE-75007 Uppsala, Sweden. e-mail:b3JqYW4uY2FybGJvcmdAc2x1LnNl