 Xiaoli Qiang
 Huangrong Chen2
 Ran Su
 Leyi Wei
- 1Institute of Computing Science and Technology, Guangzhou University, Guangzhou, China
- 2School of Computer Science and Technology, Tianjin University, Tianjin, China
- 3Department of Computer Science, University of Tsukuba, Tsukuba, Japan
- 4School of Software, Tianjin University, Tianjin, China
As one of the well-studied RNA methylation modifications, N6-methyladenosine (m6A) plays important roles in various biological progresses, such as RNA splicing and degradation, etc. Identification of m6A sites is fundamentally important for better understanding of their functional mechanisms. Recently, machine learning based prediction methods have emerged as an effective approach for fast and accurate identification of m6A sites. In this paper, we proposed “M6AMRFS”, a new machine learning based predictor for the identification of m6A sites. In this predictor, we exploited a new feature representation algorithm to encode RNA sequences with two feature descriptors (dinucleotide binary encoding and Local position-specific dinucleotide frequency), and used the F-score algorithm combined with SFS (Sequential Forward Search) to enhance the feature representation ability. To predict m6A sites, we employed the eXtreme Gradient Boosting (XGBoost) algorithm to build a predictive model. Benchmarking results showed that the proposed predictor is competitive with the state-of-the art predictors. Importantly, robust predictions for multiple species by our predictor demonstrate that our predictive models have strong generalization ability. To the best of our knowledge, M6AMRFS is the first tool that can be used for the identification of m6A sites in multiple species. To facilitate the use of our predictor, we have established a user-friendly webserver with the implementation of M6AMRFS, which is currently available in http://server.malab.cn/M6AMRFS/. We anticipate that it will be a useful tool for the relevant research of m6A sites.
Introduction
To date, more than 150 types of RNA modifications have been discovered (Maden, 1990; Wang X. et al., 2014). Of these modifications, N6-methyladenosine (m6A) is the most common and abundant one and exists in various species. It is found to be closely associated with diverse biological processes, such as RNA localization and degradation (Wang X. et al., 2014), RNA structural dynamics (Roost et al., 2015), alternative splicing (Liu N. et al., 2015), primary microRNA processing (Alarcón et al., 2015), cell differentiation, and reprogramming (Chen et al., 2015), and regulation of circadian clock (Geula et al., 2015). Thus, identification of m6A sites is of great importance for better understanding of their functional mechanisms. In the past few years, high-throughput experimental methods, such as MERIP (Meyer et al., 2012) and m6A-seq (Dominissini et al., 2012), have been utilized to identify m6A modifications, and more and more m6A peaks have been characterized. However, they have the following limitations: (1) they cannot accurately locate the positions of m6A sites; (2) they are highly cost; and (3) they are not applicable for the large-scale identification of m6A sites. Hence, it is highly desirable to develop fast and accurate computational methods for the identification of m6A sites (Chen et al., 2015b, 2016).
In recent years, machine learning based prediction methods have emerged as effective approach for predicting m6A sites. For example, Chen et al. (2015a) developed the first machine learning based predictor, called “iRNA-Methyl”, for m6A site identification. They exploited physicochemical properties and sequence-order information embedded in PseDNC (pseudo dinucleotide composition) (Liu B. et al., 2015), and used support vector machine for model construction. Later, Liu Z. et al. (2016) proposed to incorporate more additional physicochemical properties coupled with a scalable transformation algorithm into their feature extraction model. To improve the predictive performance, Jia et al. proposed to fuse three types of feature descriptors, such as bi-profile Bayes, dinucleotide composition and KNN scores. Their results showed that this fusion strategy is able to achieve better performance than single one feature descriptor (Jia et al., 2016). Similarly, Xiang et al. (2016b) found that combining binary encoding scheme together with k-mer frequency could contribute to the improved performance. Recently, Zhou et al. (2016) developed “SRAMP”, a powerful prediction tool using multiple types of feature descriptors, including positional binary encoding of nucleotide sequence, k-nearest neighbor encoding, nucleotide pair spectrum encoding, and secondary structure pattern, to train an ensemble predictive model with random forest for the identification of m6A sites. SRAMP is reported to achieve relatively good performance as compared to other predictors. More recently, Xiang et al. (2016a) proposed a new predictor called “RNAMethyPre”, using compositional information and position-specific information to build predictive models for the prediction of m6A sites on both human and mouse. Additionally, in our previous study, we proposed to use deep learning algorithm to generate high-latent features to improve the predictive performance (Wei et al., 2018d). However, we found that most of existing predictors are species-specific. Currently, there is not any predictor that is capable of predicting m6A sites for multiple species.
For this purpose, we proposed a novel sequence-based predictor, namely “M6AMRFS” for detecting m6A sites in RNA sequences. For feature extraction (Mrozek et al., 2007, 2013), we proposed a feature representation algorithm to encode sequences with dinucleotide binary encoding and local position-specific dinucleotide frequency. To optimize the feature space, we combined the F-score algorithm with SFS (Sequential Forward Search) (Wei et al., 2018a,c,e) to improve the representation ability of our features. For model training, we trained the optimal feature representations under XGBoost algorithm. Our experimental results showed that the proposed M6AMRFS is able to achieve competitive and robust performance as compared to state-of-the-art predictors for four different species. To the best of our knowledge, this is the first predictor that is applicable for multiple species. Furthermore, we have established a user-friendly webserver that implements the proposed M6AMRFS, which is currently available in http://server.malab.cn/M6AMRFS/. We anticipate that it will be a useful tool complementary for existing tools, facilitating to further reveal the functional mechanisms of m6A sites.
Materials and Methods
Benchmark Datasets
To predict the m6A sites in multiple species, we employed four benchmark datasets from four species, including Saccharomyces cerevisiae, Arabidopsis thaliana, Musculus, and Homo sapiens. The detail of the four benchmark datasets is listed in Table 1. For the four benchmark datasets, the positives are the sequences centered with true m6A sites, while the negatives are usually the sequences centered with adenines but without any m6A peaks detected. The datasets can be found in the following website: http://server.malab.cn/M6AMRFS/.

TABLE 1. Summary of the benchmark datasets from four species.
Prediction Framework of the Proposed Predictor
Figure 1 illustrates the overall procedure of the proposed predictor. As we can see from Figure 1, there are two steps in the predictor. The first step is data pre-processing, including data clean and feature extraction. It filters out those irrelevant sequences from input sequences. Then, the resulting sequences are submitted into the feature representation algorithm, in which the sequences are encoded with feature vectors. The second step is feature optimization and model training. For feature space optimization, we used the F-score algorithm combined with SFS (Sequential Forward Search) to search for the optimal features. Afterward, the resulting optimal feature representations are fed into a well-trained XGBoost model to predict whether the sequences are true m6A sites or not. In our predictor, the predicted outcome for each sequence is 0 or 1, where 0 denotes non-m6A site and 1 denotes true m6A site.
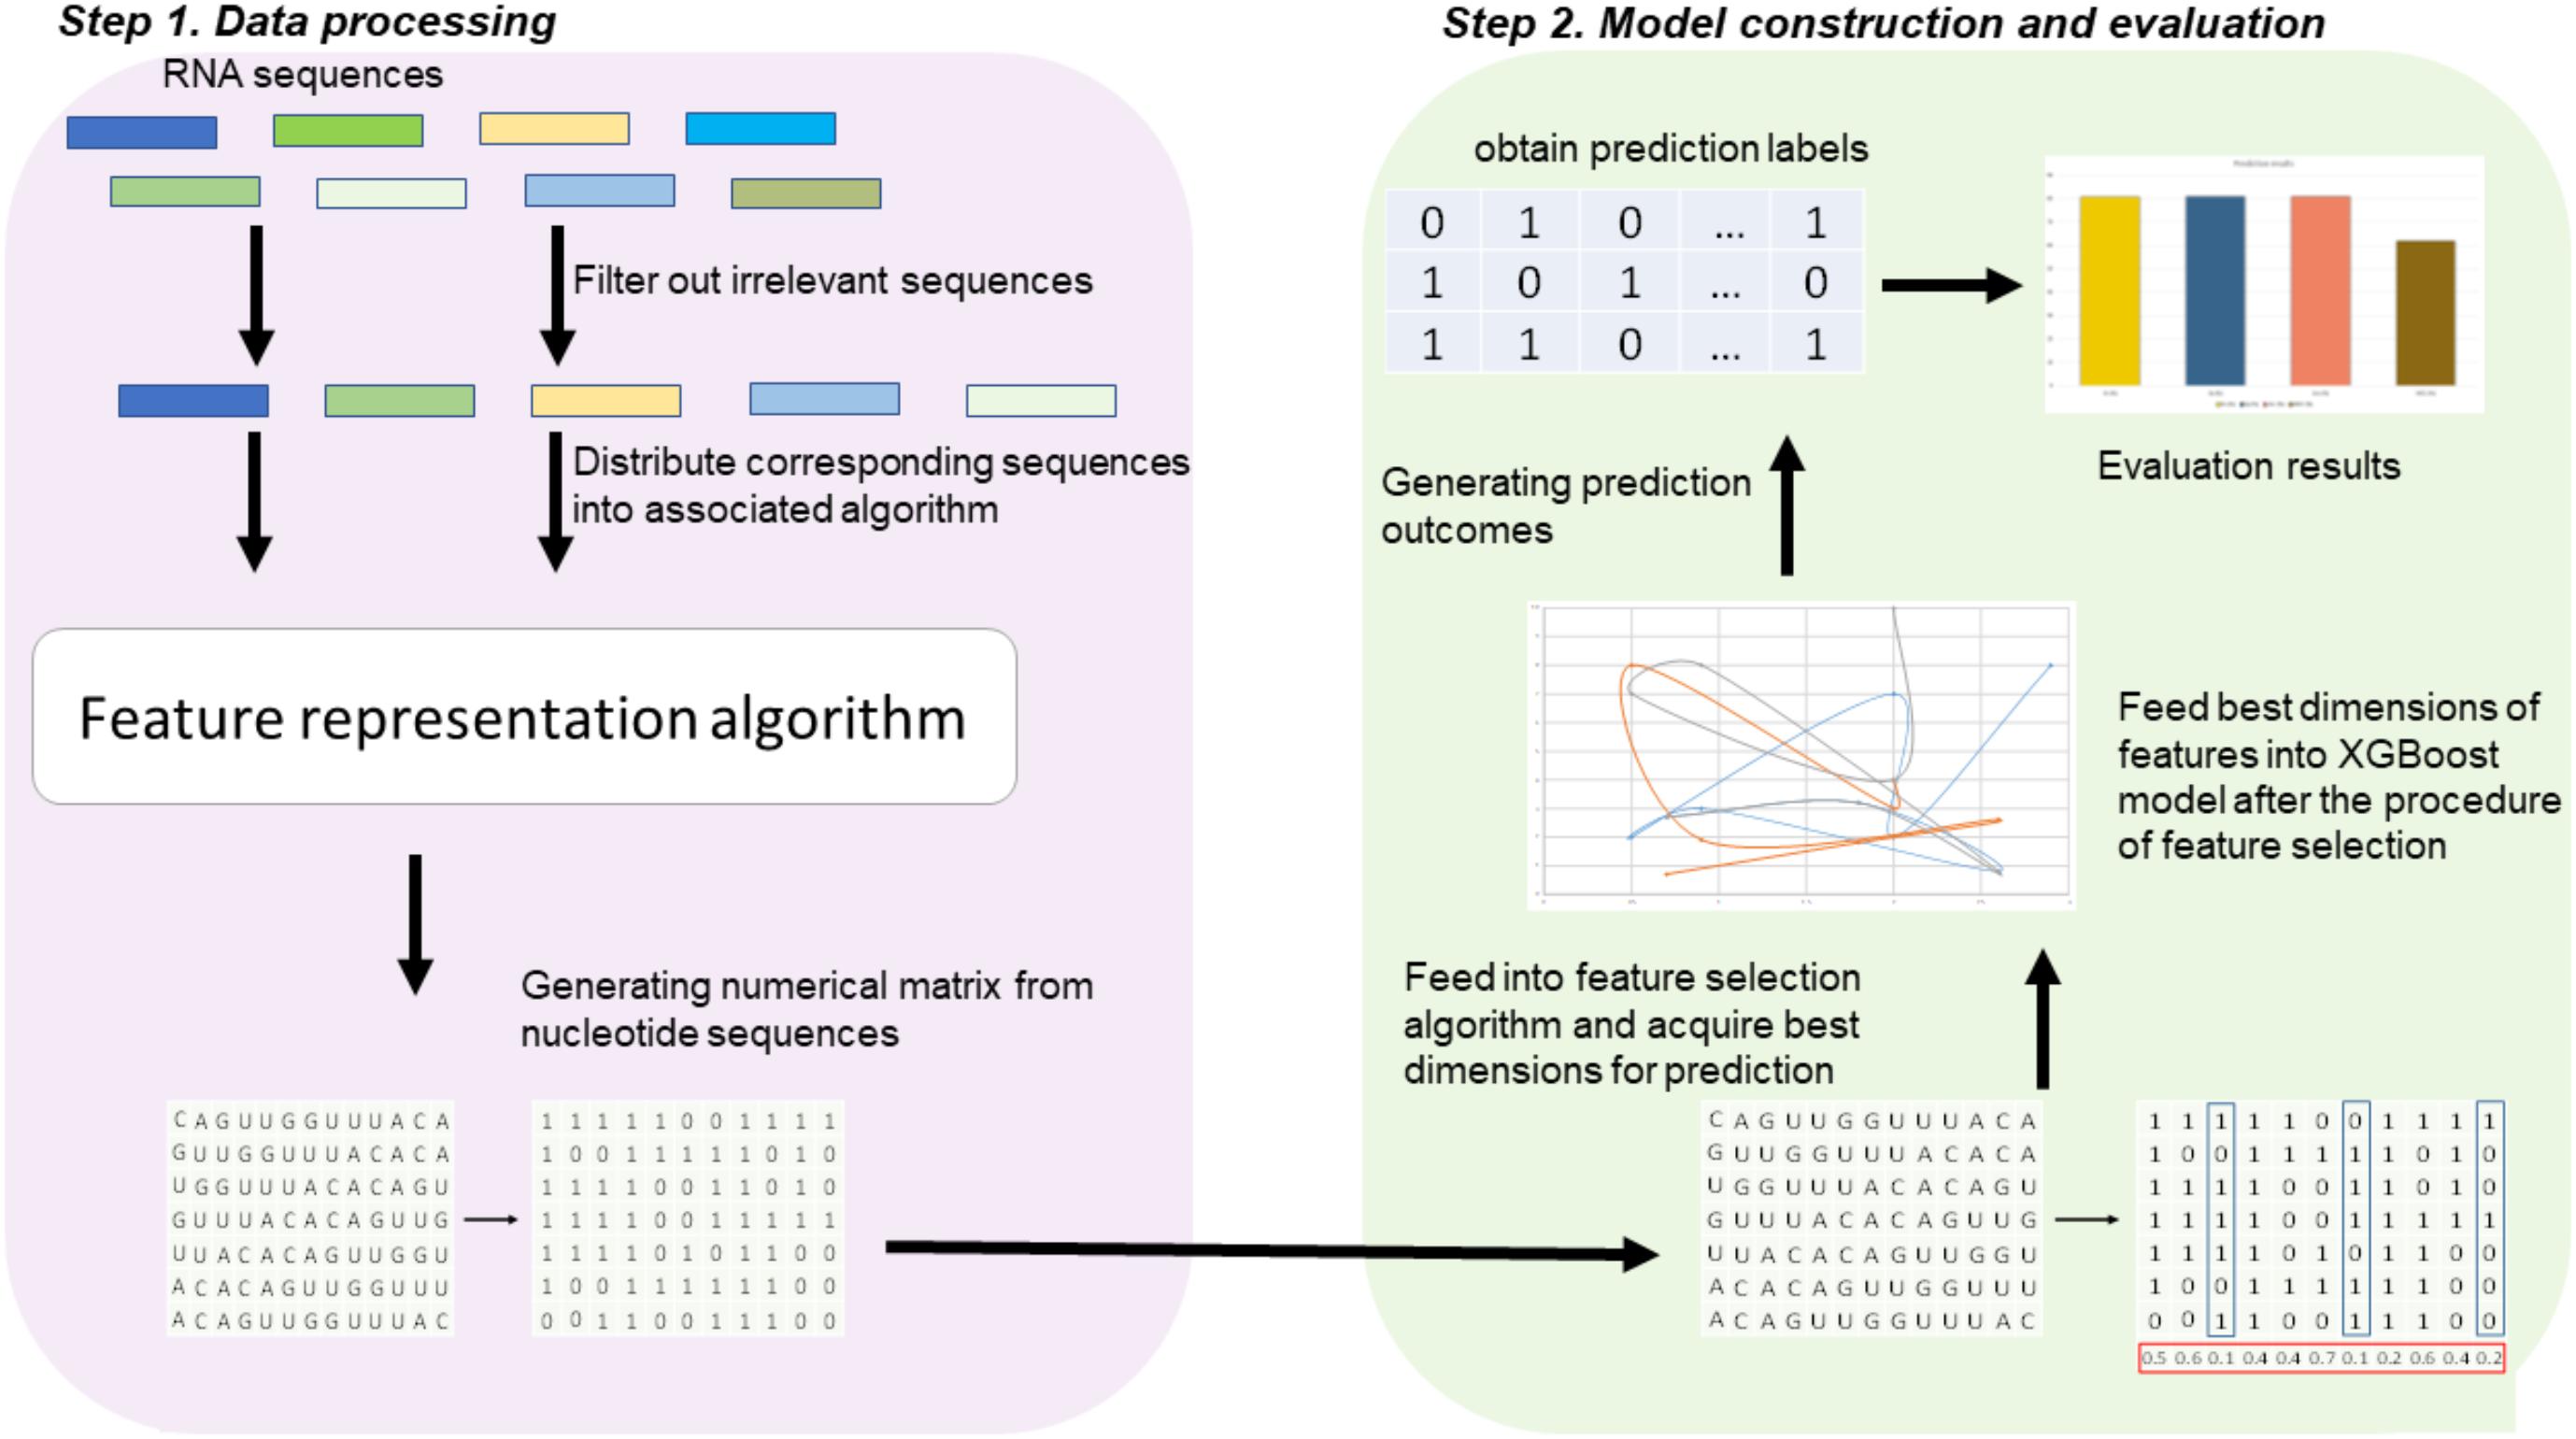
FIGURE 1. Framework of algorithms proposed in this study. There are two main steps. In the first step, the input RNA sequences are filtered by removing those irrelevant sequences. Then, the remaining sequences are fed into the proposed feature extraction algorithm for feature representation. In the second step, the resulting feature representations are optimized by feature selection, and then, the optimal feature representations are predicted by a XGBoost model.
Feature Representation
In this work, we present a new feature representation algorithm that combines two feature descriptors. One is named “Dinucleotide binary encoding” and the other is “Local position-specific dinucleotide frequency”, which are described as follows,
Dinucleotide Binary Encoding
The feature descriptor encapsulates the positional information of the dinucleotide at each position in the sequence. Obviously, there are a total of 16 possible dinucleotides. In this descriptor, each dinucleotide can be encoded into a 4-dimensional 0/1 vector. For example, AA is encoded as (0,0,0,0); AT is encoded as (0,0,0,1); AC is encoded as (0,0,1,0); and so forth, GG is encoded as (1,1,1,1). Therefore, using the dinucleotide binary encoding, we yielded a 160 (=40∗4)-dimensional 0/1 vector for the given sequence.
Local Position-Specific Dinucleotide Frequency
For a given sequence, the feature vector of this descriptor can be denoted as (f2, f3, …, fl), where fi is calculated as follows,
where l is the length of the given sequence, |Ni| is the length of the ith prefix string {X1X2…Xi} in the sequence, and C (Xi-1Xi) is the occurrence number of the dinucleotide Xi-1Xi in position i of the ith prefix string.
Feature Selection
Feature selection is an important process to improve the classification performance (Mrozek et al., 2009; Mrozek et al., 2014; Zeng et al., 2016; Zou et al., 2016a,b; Liu, 2017). Here, we used the F-score algorithm together with the SFS strategy to search the most discriminative features (Peng et al., 2005). Figure 2 illustrates the procedure of the feature selection strategy, which is described as follows. Firstly, the F-score algorithm is utilized to rank all the features from the highest scores to the lowest scores, generating a ranked feature list. Secondly, we added the features one by one from the ranked list, and respectively trained the predictive models. Lastly, the feature subset corresponding to the highest accuracy of the predictive model is used as the optimal features. The results of feature selection were discussed in section of “Results and Discussion”.
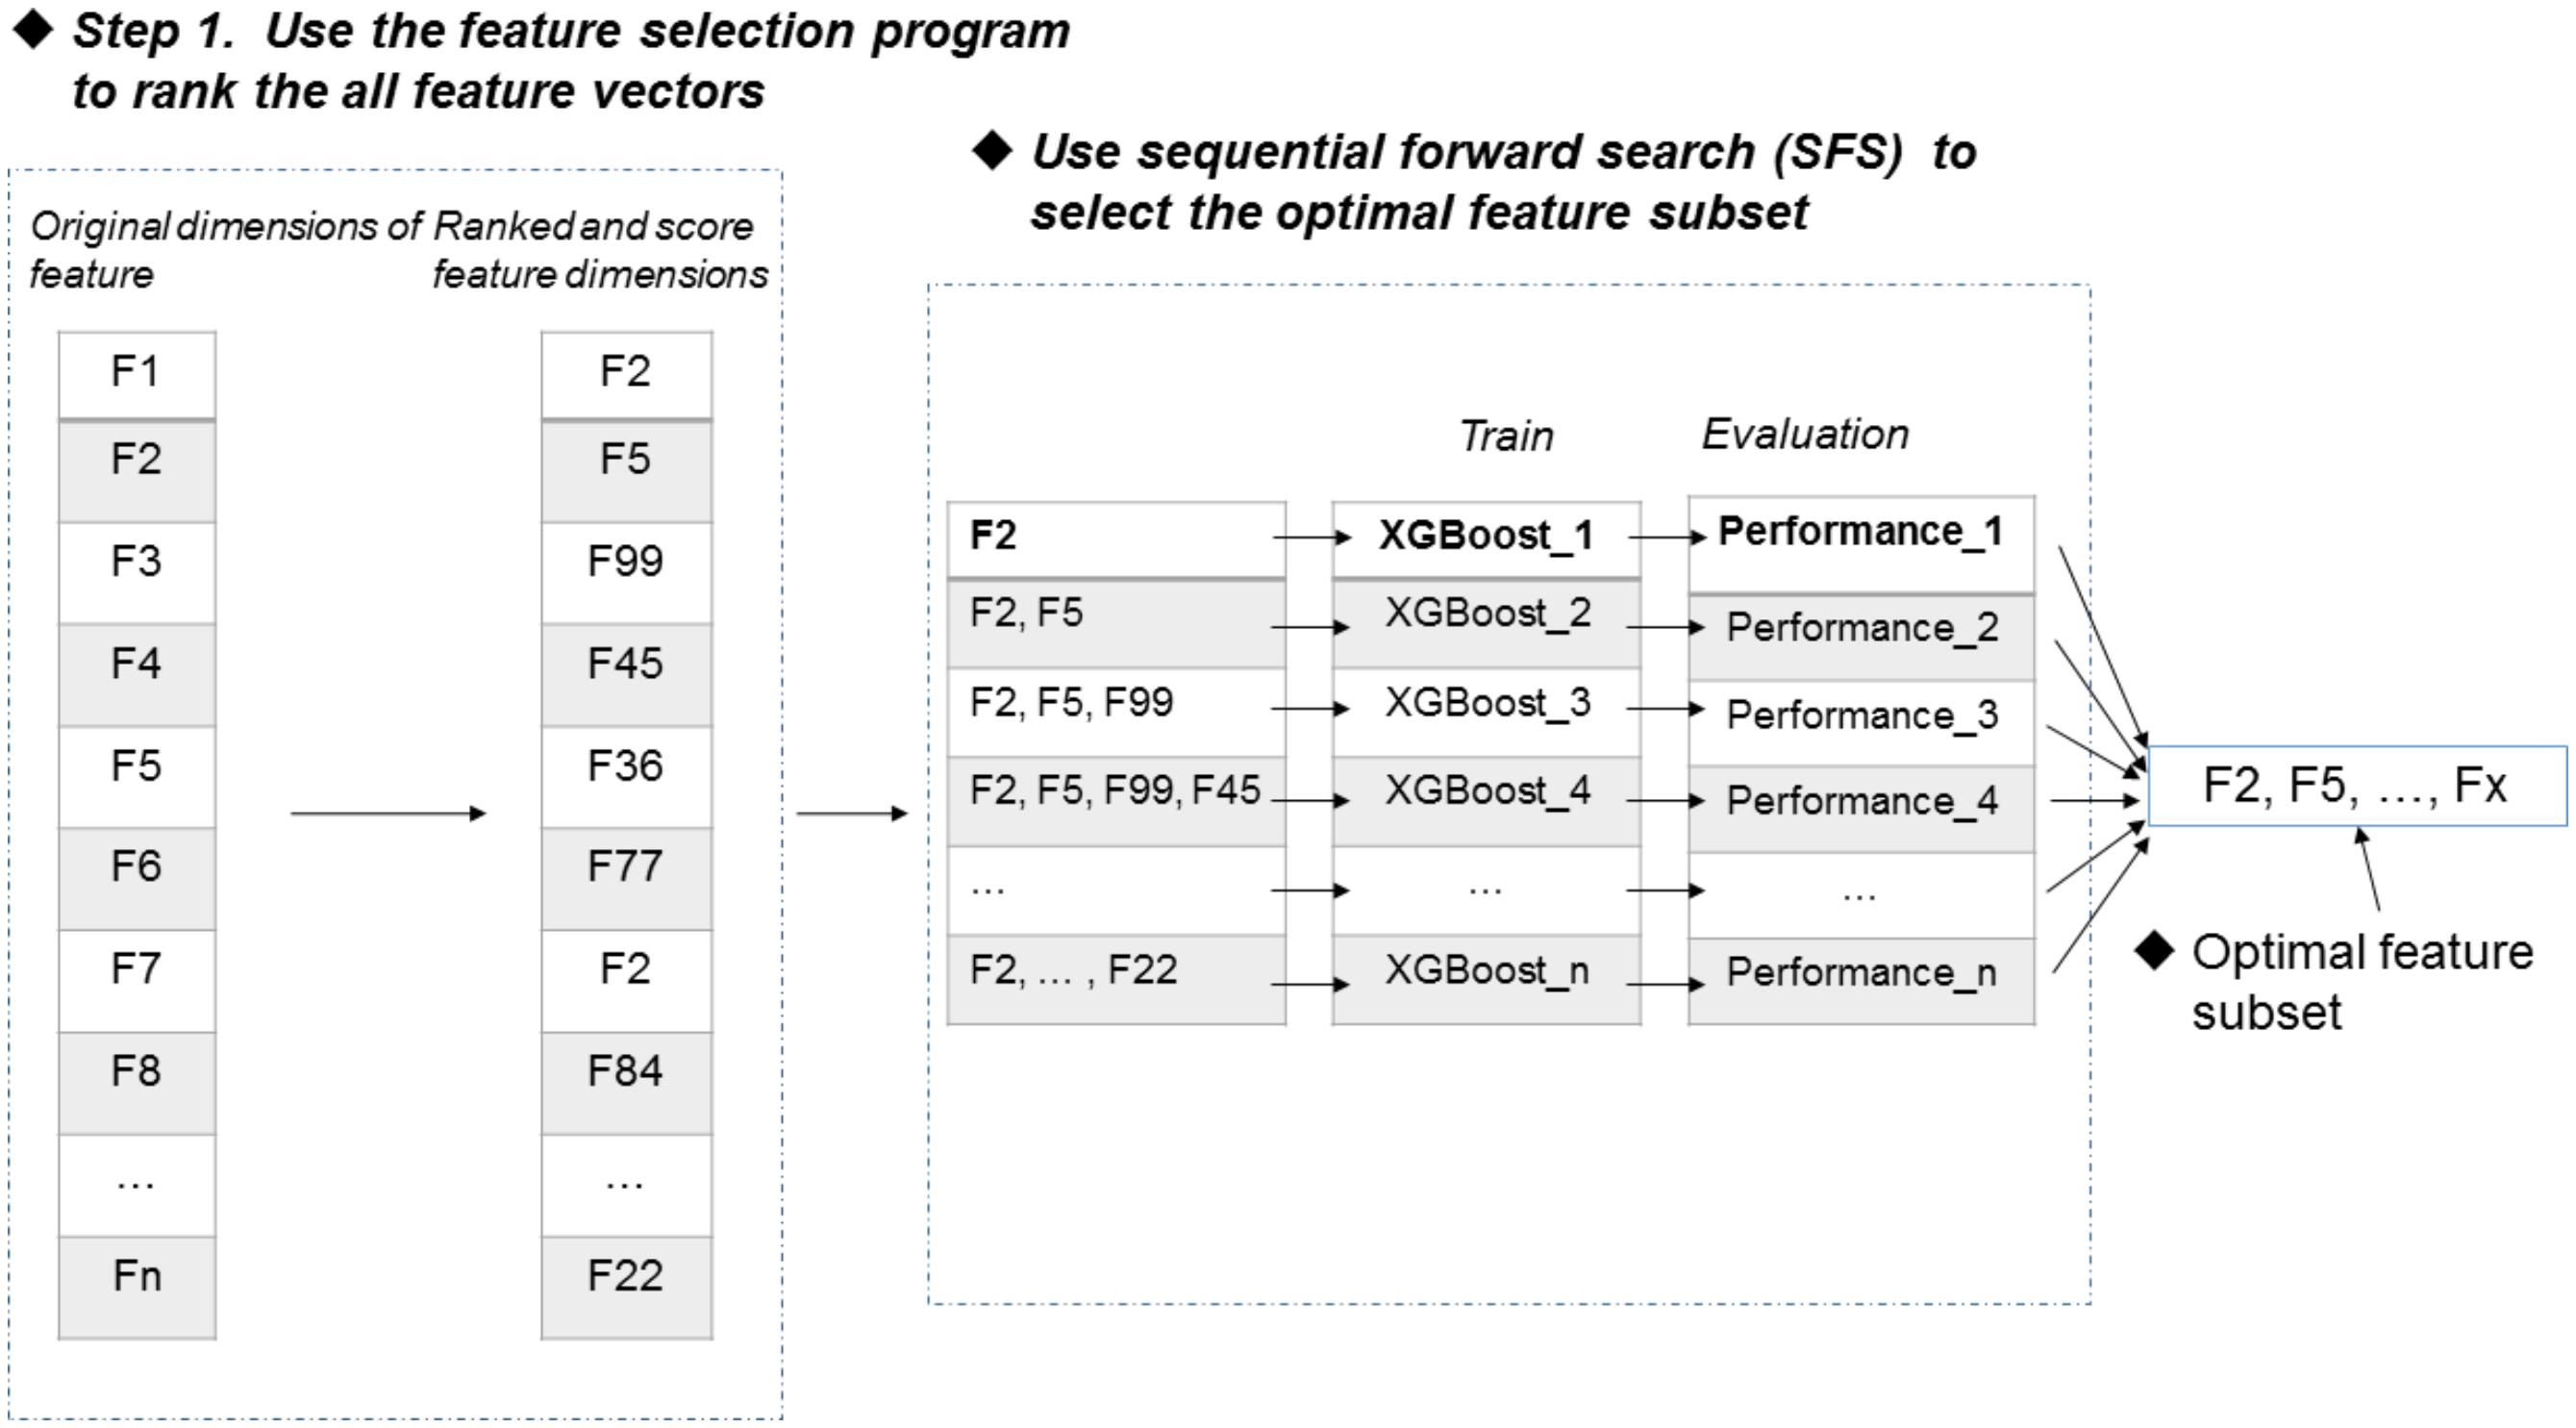
FIGURE 2. Procedure of feature selection.
XGBoost (eXtreme Gradient Boosting)
eXtreme Gradient Boosting, which was proposed by Chen and Guestrin (2016), has been shown to be a powerful classification algorithm. The general idea of XGBoost is to enumerate several candidates that may be the segmentation points according to the percentile method, and then to find the best segmentation point from the candidates for calculating the segmentation points. The main advantage of XGBoost is to combine multithreading, data compression, and fragmentation methods to improve the efficiency of the algorithm as much as possible. Moreover, the regularization terms added by XGBoost in the loss function can be used to control the complexity of the model and avoid overfitting. Parameters, such as subsamples, max depth, and estimators, are utilized to optimize evaluation performance via parallelization program namely “Grid Search”. For the implementation of XGBoost in our predictor, the range of max depth is set from 2 to 10; learning rate is ranged from 0.1 to 0.8; and estimators are ranged from 1 to 10.
Performance Evaluation
In this work, four commonly used performance metrics are used for performance evaluation, including Acc (accuracy), Sn (sensitivity), Sp (specificity), and MCC (Mathew’s correlation coefficient), respectively (Zeng et al., 2015; Lai et al., 2017; Zhang et al., 2017; Cheng et al., 2018; Su et al., 2018; Tang et al., 2018; Wei et al., 2018b; Yang et al., 2018). They are formulated as follows
where TP denotes true positive; TN denotes true negative; FP denotes false positive; and FN denotes false negative. Sn measures the predictive ability of a predictor for positive samples while Sp measures the predictive ability of a predictor for negative samples. Acc and MCC are two metrics measuring the overall performance of a predictor.
Besides, we used Receiver Operating Characteristic (ROC) curve to intuitively evaluate the overall performance (Liu et al., 2013, 2016b). It is plotted with true positive rate (TPR) against false positive rate (FPR) under different classification thresholds. The TPR is the same with sensitivity as described above, while FPR is calculated as 1-specificity. Area under ROC curve (AUC) is usually used as an evaluation metric (Liu et al., 2016a, 2017). The value of AUC ranges from 0.5 to 1. If the AUC is close to 1, it indicates that the predictor has excellent performance. If the AUC approaches to 0.5, the predictor does not perform well for prediction.
Additionally, we used 10-fold cross validation method and jackknife test to evaluate the predictive performance (Wei et al., 2017a; Zeng et al., 2017a,b; Liao et al., 2018; Zou et al., 2018). The two evaluation methods were chosen since existing methods in the literature used them for performance evaluation.
Results and Discussion
Comparison of XGBoost and Other Classifiers
To evaluate the effectiveness of the XGBoost classifier, we compared it with five commonly used machine learning algorithms, including Random Forest (RF) (Liu B. et al., 2015; Li et al., 2016; Wei et al., 2017b), Naïve Bayes (NB), Logistic Regression (LR), K-Nearest Neighbors (KNN)(Huang and Li, 2018), Support Vector Machine (SVM) (Song et al., 2010, 2012, 2018; Wang M. et al., 2014; Wei et al., 2017), and Gradient Boosting Decision Tree (GBDT) (Liao et al., 2018), respectively. For fair comparison, the machine learning algorithms were trained and evaluated with 10-fold cross validation on the benchmark datasets, respectively. The performance of different classifiers is illustrated in Figure 3. The detailed results are presented in Table 2.
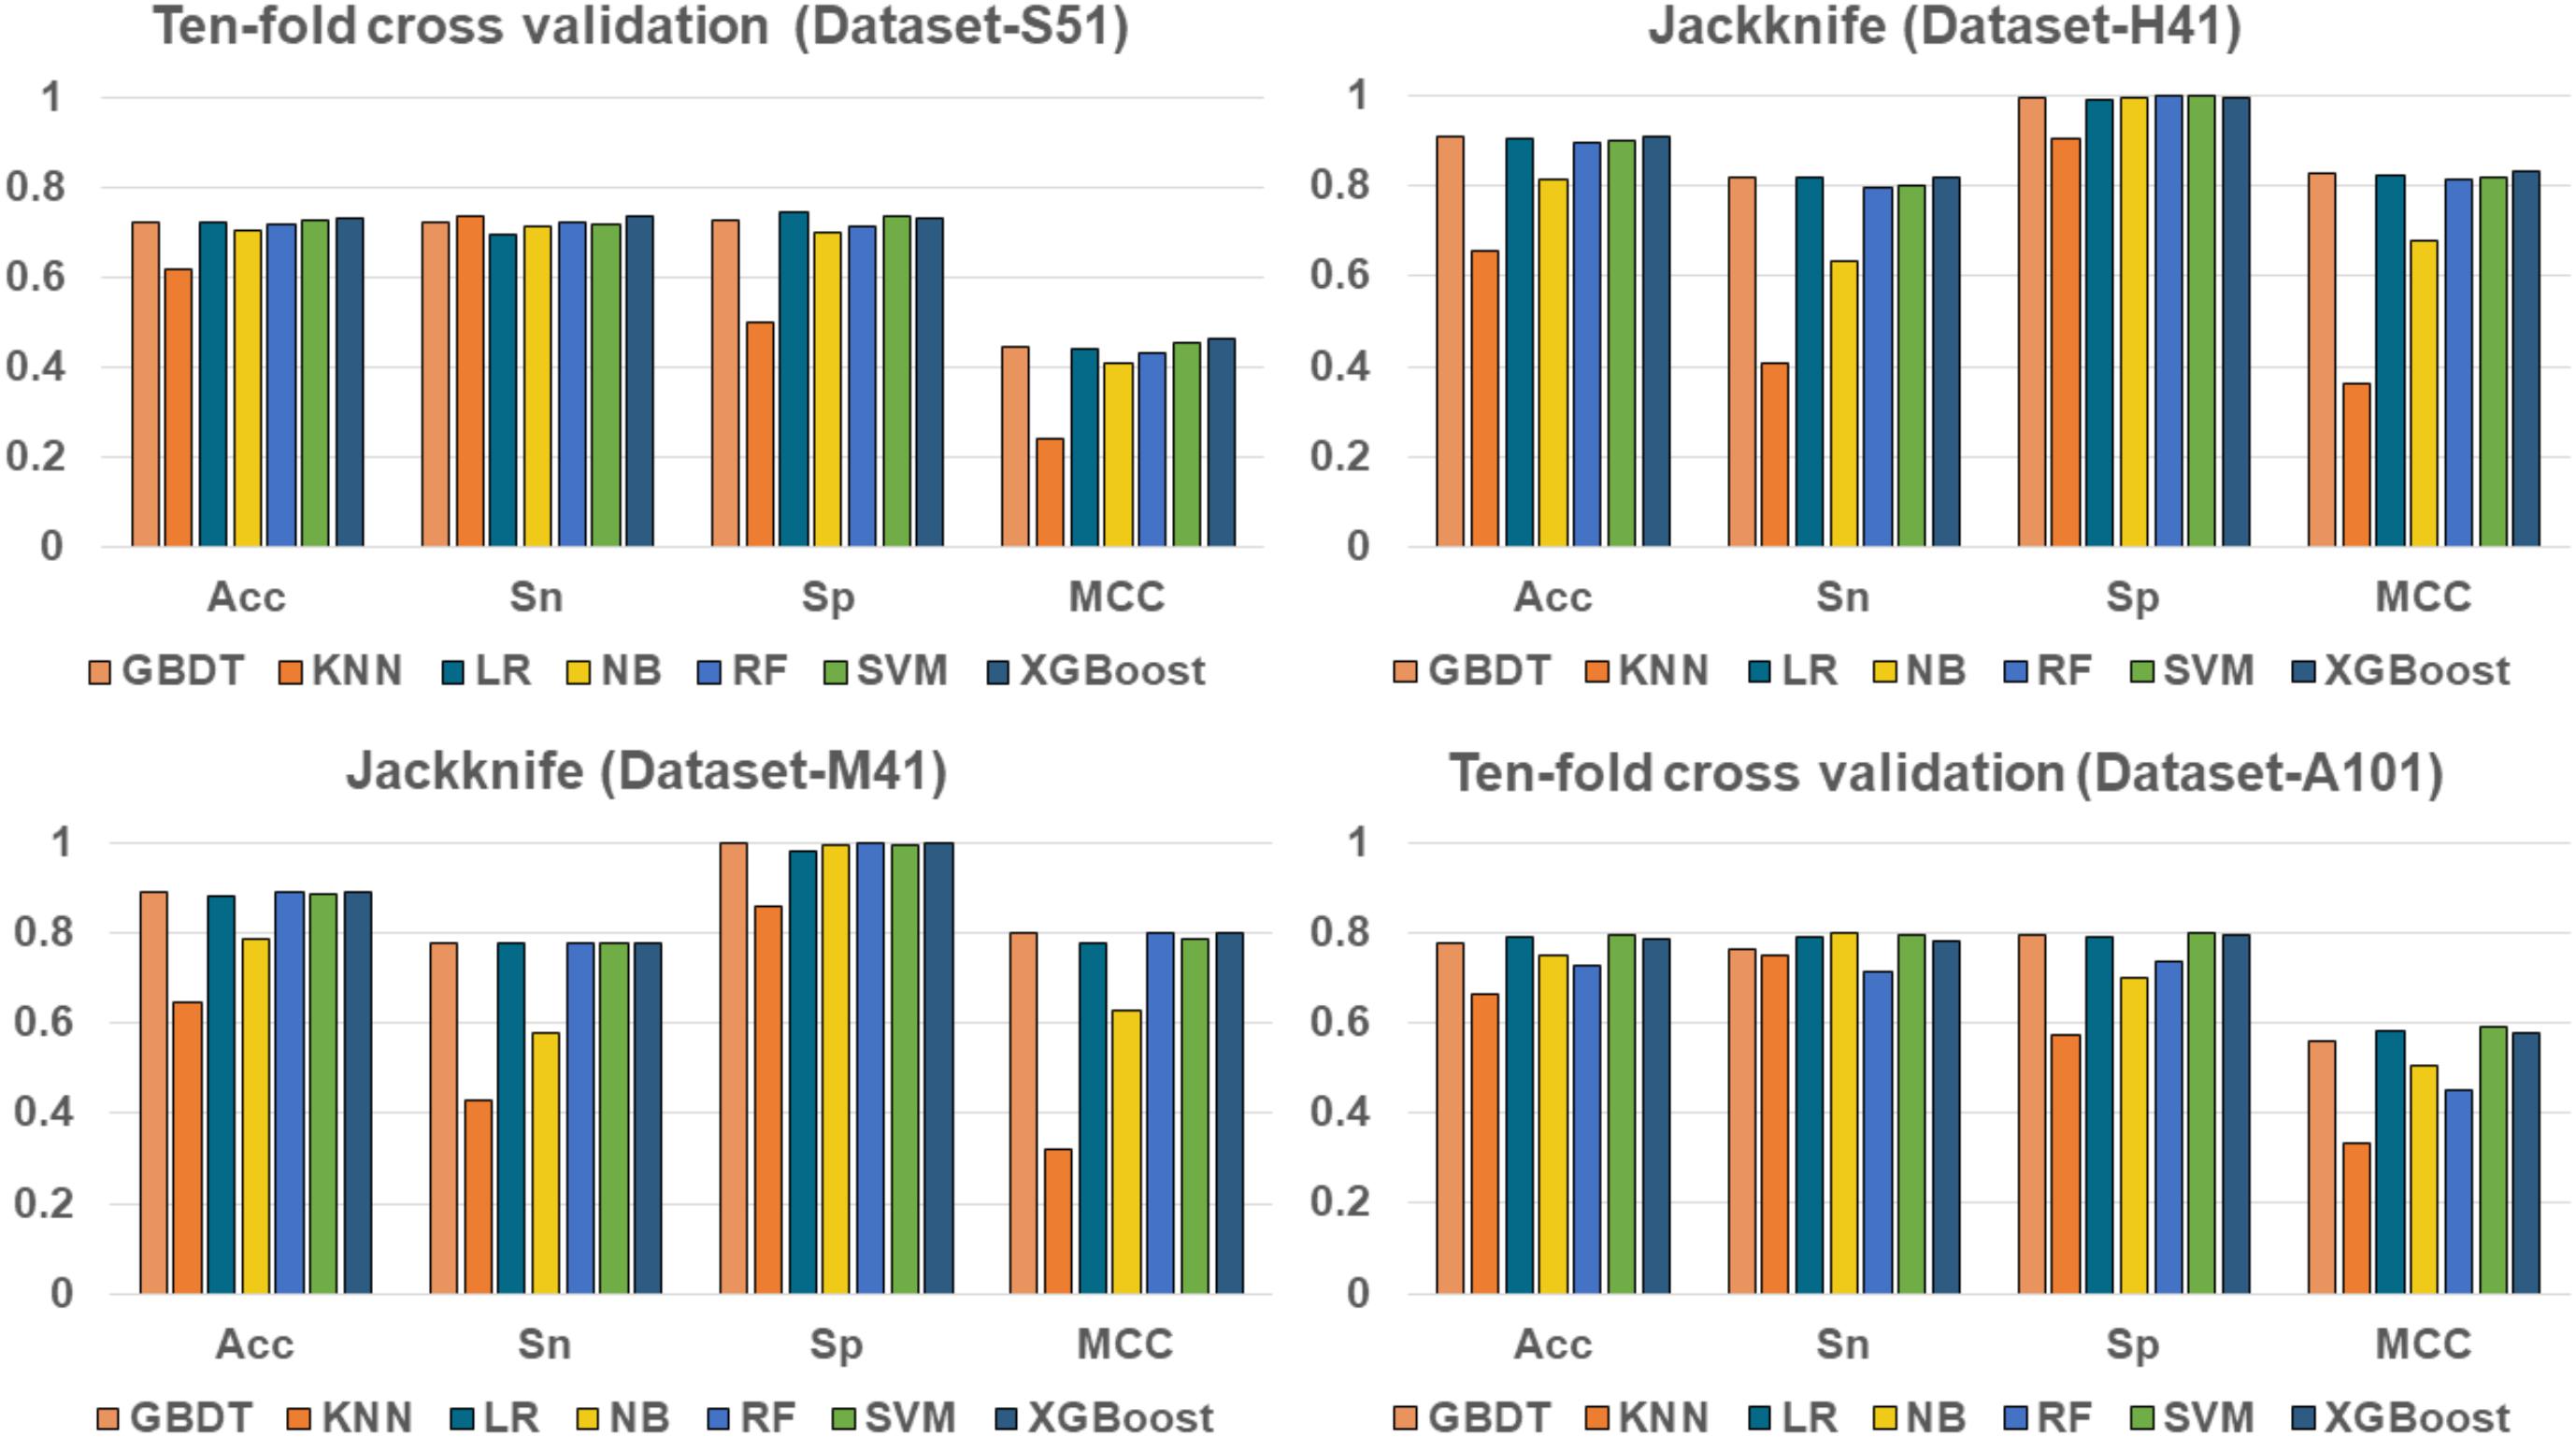
FIGURE 3. Performance of XGBoost and other classifiers on four benchmark datasets.
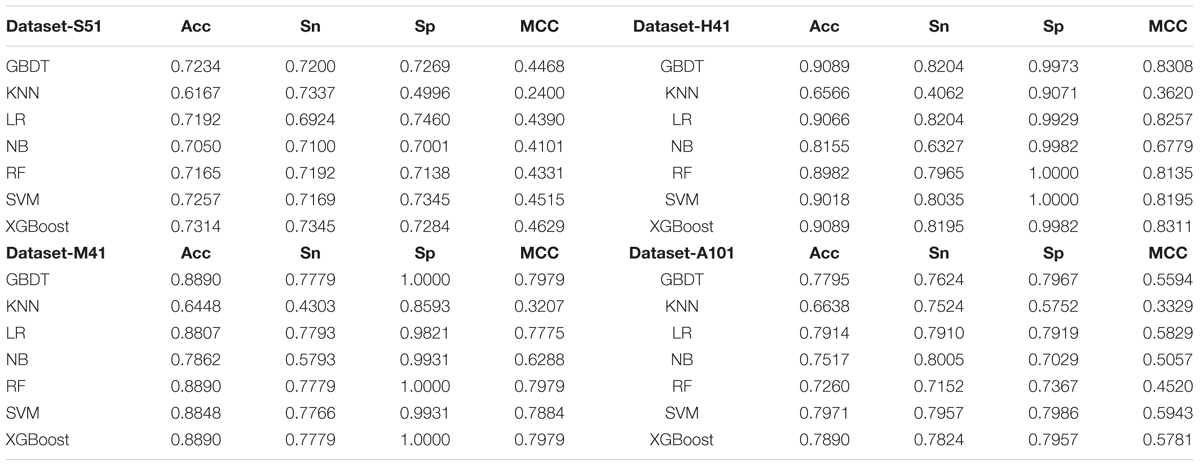
TABLE 2. Performances of XGBoost and other machine learning algorithms.
As shown in Table 2 and Figure 3, XGBoost outperforms the other classifiers on three out of the four datasets, with the exception of Dataset-A101, for which the SVM classifier is slightly better than the XGBoost, which is the second best among the compared classifiers. For those datasets that the XGBoost outperforms other classifiers, the XGBoost is able to achieve higher Acc and MCC. To be specific, our Acc and MCC are 0.7314 and 0.4629 in the Dataset-S51, 0.6 and 1.1% higher than that of the runner-up SVM. Similar results are observed in the Dataset-H41; XGBoost leads by 0.71 and 1.2% in terms of Acc and MCC, respectively. Moreover, in the Dataset-M41, the performances of our XGBoost are the same with the RF and GBDT in terms of Acc, Sn, Sp, and MCC, respectively. In summary, our results demonstrate that as compared to other commonly used classifiers, the XGBoost shows generally better and more robust performance to classify true m6A sites to non- m6A sites from different species.
Impact of Feature Selection
In this study, we employed the F-score with the SFS for feature selection. The results of feature selection are summarized in Table 3 and illustrated in Figure 4 as well. As seen from Table 3, before feature selection, the performances of the predictive model in the Dataset-S51 are 0.7314, 0.7345, 0.7284, and 0.4629 in terms of Acc, Sn, Sp, and MCC, respectively. After applying the feature selection, we observed that the performances in terms of all the metrics were improved. To be specific, the Acc and MCC were improved to 0.7425 and 0.4852, respectively. This indicates that the feature selection strategy to yield more informative features to distinguish true m6A sites from non-m6A sites. For the other datasets from different species, similar results were observed. We can see from Table 3 that almost all the performances were improved by using feature selection, demonstrating that feature selection is an effective way to enhance the predictive performance of the predictor. Moreover, Figure 4 illustrates the Acc of the features by varying the feature number when conducting feature selection. As seen in Figure 4, we pointed out the optimal feature number and their corresponding highest Acc for each dataset. The optimal feature number for the four datasets are 85, 57, 13, and 355, giving the highest Acc of 0.7425, 0.9102, 0.8924, and 0.8105, respectively.
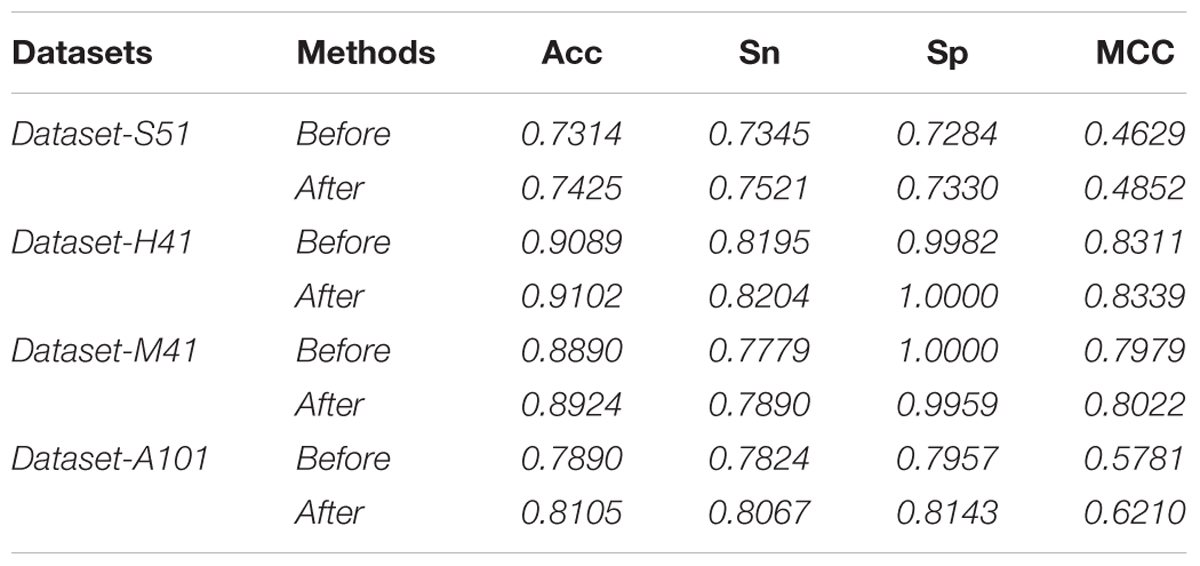
TABLE 3. Performance of features before and after feature selection.
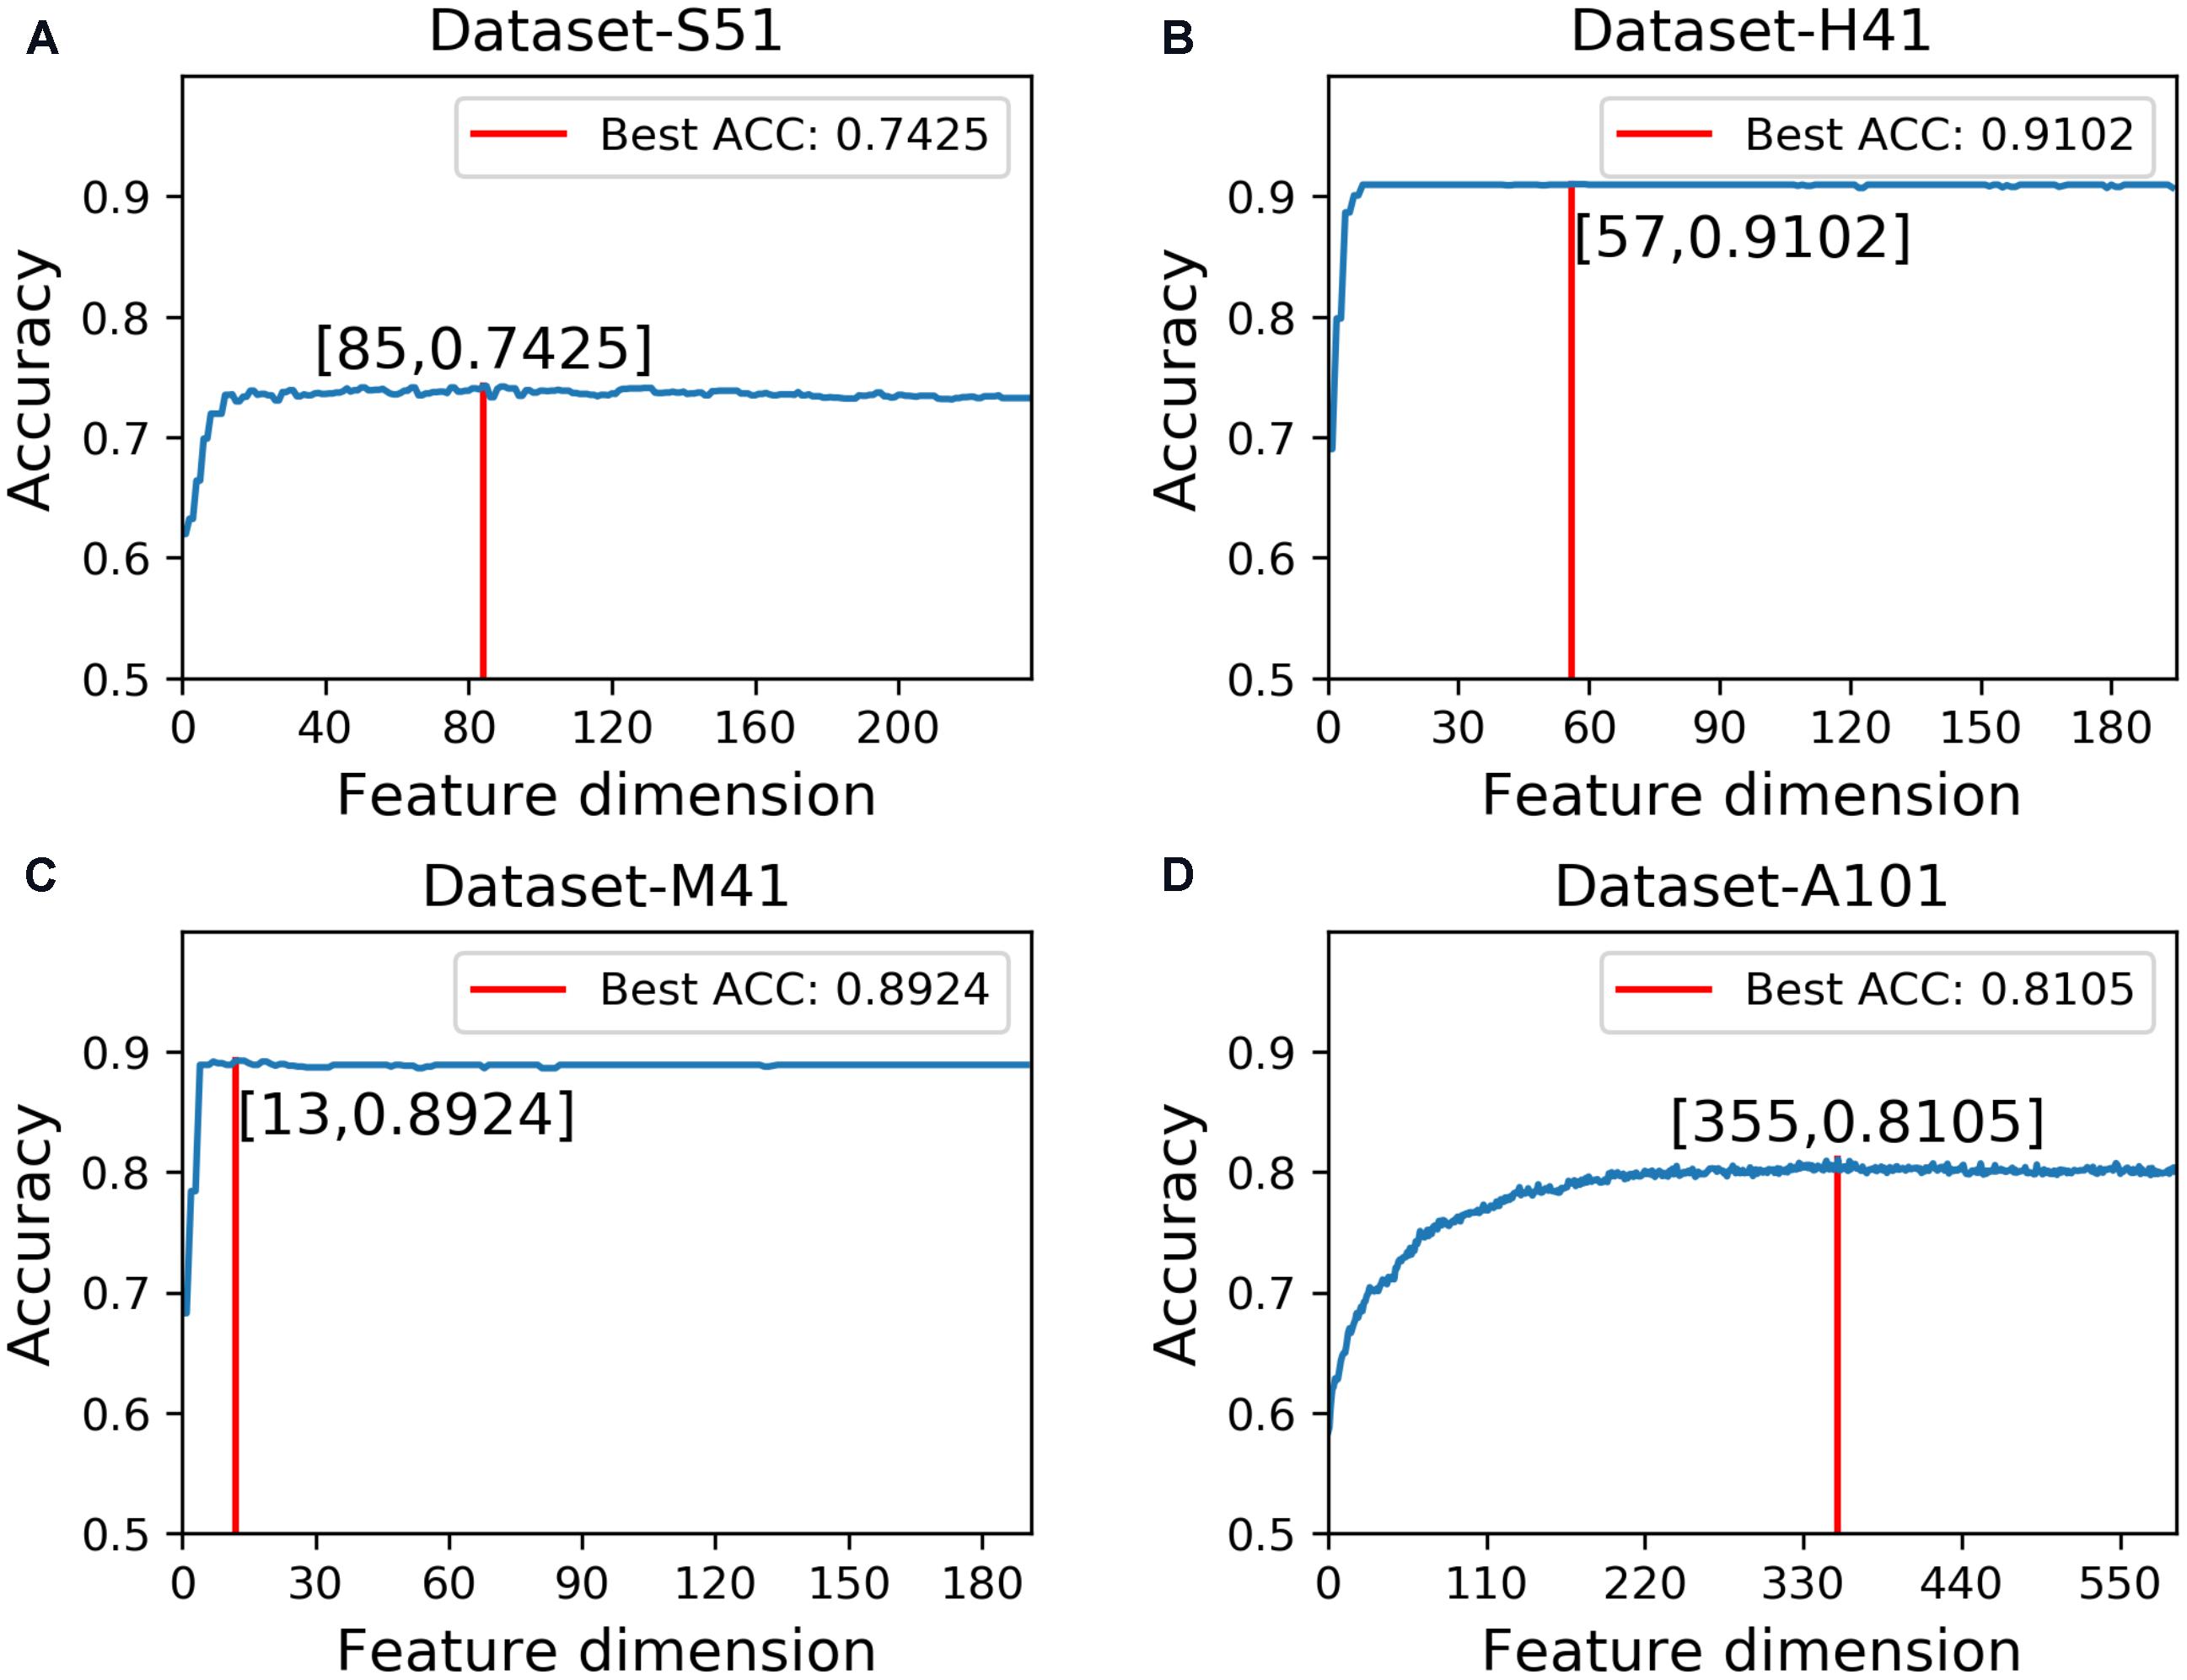
FIGURE 4. Results of feature selection via varying the feature number. (A) denotes the results of feature selection on Dataset-S51. (B) denotes the results of feature selection on Dataset-H41. (C) denotes the results of feature selection on Dataset-M41. (D) denotes the results of feature selection on Dataset-A101.
Comparison With Other Feature Representation Algorithms
To examine the performance of the proposed feature algorithm, we evaluated and compared it with existing feature representation algorithms, including RFH, PseDNC, PCP (physical and chemical properties), KNN (K-Nearest Neighbors), and AthMethPre, respectively. These algorithms were reported to have relatively strong power for the identification of m6A sites. Thus, they were chosen for comparison. The results of the above algorithms were presented in Table 4. As we can see from Table 4, the proposed features are competitive with the best-performing AthMethPre other feature representation methods and remarkably outperform the other existing features in all the four datasets. Note that for the Dataset-S51 and the Dataset-A101, our method performs slightly worse than the best-performing AthMethPre; while for the other two datasets, our method is slightly better. As well known, for the genome-wide identification, the running time for a predictor is important as well. Therefore, we further compared the feature number of AthMethPre and our feature representation method. We found that the feature number of the AthMethPre method for each dataset are 540, 500, 500, and 740, while ours are 85, 57, 13, and 355, respectively. As can be seen, our feature numbers for all the four datasets are averagely much fewer than the AthMethPre method. This indicates that the computation time by our predictive models costs less. In general, it can be concluded that our features are at least effective for the representatives of m6A sites in multiple species with different sequence lengths.
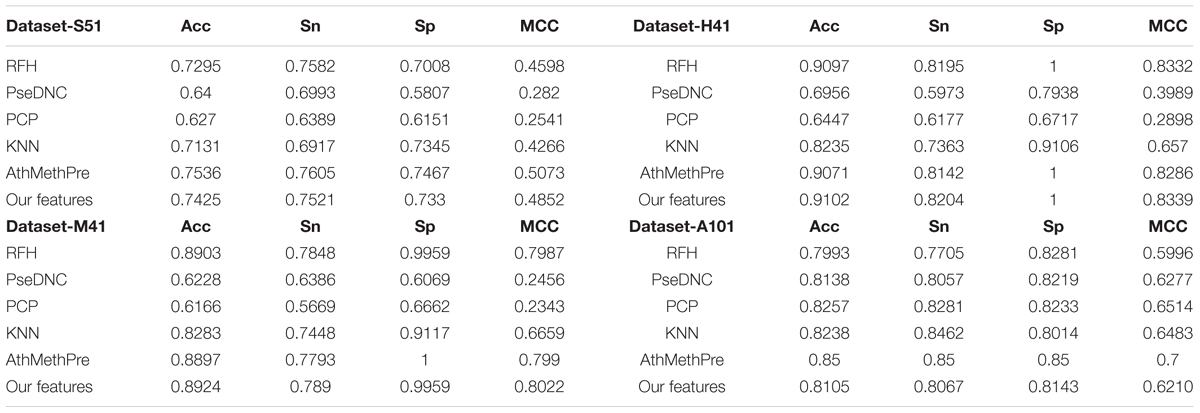
TABLE 4. Comparison with other feature representation algorithms.
Comparison With State-of-the-Art Predictors
To assess the effectiveness of our predictor, we compared it with existing predictors including pRNAm-PC (Liu Z. et al., 2016), MehtyRNA (Chen et al., 2017), and RFAthM6A (Wang and Yan, 2018), respectively. There were chosen since they were reported to have the best performance on the four benchmark datasets used in this work. The results were presented in Table 5.

TABLE 5. Results of the proposed predictor and the state-of-the-art predictors on benchmark datasets from different species.
As shown in Table 5, M6AMRFS outperforms pRNAm-PC on the Dataset-S51. The Acc, Sn, Sp, and MCC by our predictor are 0.7425, 0.7521, 0.7339, and 0.4852, respectively. The performances are higher than that of the second best pRNAm-PC on this dataset. To be specific, our overall performances are 0.0451 and 0.0852 higher in terms of Acc and MCC, respectively. As for the other datasets (Dataset-H41 and Dataset-M41), we observed similar results that our overall performance outperforms the existing predictors. Only on Dataset-A101, our predictor performs slightly worse than RFAthM6A. To be concluded, our results demonstrate that the proposed predictor is better than existing predictors or at least competitive with existing predictors on multiple benchmark datasets from different species. Importantly, our predictor exhibits robust performance for multiple species, demonstrating that our predictor is able of capturing the characteristics of m6A sites in different species. This also implies that the m6A sites from different species might share the common patterns.
Conclusion
In this study, we have developed a machine learning based predictor, namely M6AMRFS, for the identification of m6A sites in multiple species. We have conducted a series of comparative study, and our experimental results indicate that our predictor is at least competitive as compared to previously published predictors. Importantly, we found that our predictor is able to achieve robust performance in several species. To the best of our knowledge, it is the first predictor that can provide predictions in multiple species. For further analysis, we found that the robust performance contributes to the following two possible reasons. One reason is the XGBoost classifier we used for model training. We have compared XGBoost with other machine learning algorithms. XGBoost is shown to perform better than other classification algorithms. The other reason is that our feature selection strategy helps to adaptively select the optimal features for specific species. We anticipate that the tool and webserver we have established will be useful for facilitating to reveal the functional mechanisms of m6A sites.
Author Contributions
XQ and HC wrote the manuscript. HC developed the webserver and analyzed the results. XY analyzed the results. RS and LW designed the experiments. All authors read and approved the manuscript.
Funding
The work was supported by the National Natural Science Foundation of China (Nos. 61701340 and 61702361).
Conflict of Interest Statement
The authors declare that the research was conducted in the absence of any commercial or financial relationships that could be construed as a potential conflict of interest.
References
Alarcón, C. R., Lee, H., Goodarzi, H., Halberg, N., and Tavazoie, S. F. (2015). N 6-methyladenosine marks primary microRNAs for processing. Nature 519, 482–485. doi: 10.1038/nature14281
Chen, T., and Guestrin, C. (2016). “Xgboost: a scalable tree boosting system,” in Proceedings of the 22nd ACM Sigkdd International Conference on Knowledge Discovery and Data Mining, (New York, NY: ACM), 785–794. doi: 10.1145/2939672.2939785
Chen, T., Hao, Y.-J., Zhang, Y., Li, M.-M., Wang, M., Han, W., et al. (2015). m 6 A RNA methylation is regulated by microRNAs and promotes reprogramming to pluripotency. Cell Stem Cell 16, 289–301. doi: 10.1016/j.stem.2015.01.016
Chen, W., Feng, P., Ding, H., and Lin, H. (2016). Identifying N6-methyladenosine sites in the Arabidopsis thaliana transcriptome. Mol. Genet. Genomics 291, 2225–2229.
Chen, W., Feng, P., Ding, H., Lin, H., and Chou, K.-C. (2015a). iRNA-methyl: identifying N6-methyladenosine sites using pseudo nucleotide composition. Anal. Biochem. 490, 26–33. doi: 10.1016/j.ab.2015.08.021
Chen, W., Tang, H., and Lin, H. (2017). MethyRNA: a web server for identification of N6-methyladenosine sites. J. Biomol. Struct. Dyn. 35, 683–687. doi: 10.1080/07391102.2016.1157761
Chen, W., Tran, H., Liang, Z., Lin, H., and Zhang, L. (2015b). Identification and analysis of the N 6-methyladenosine in the Saccharomyces cerevisiae transcriptome. Sci. Rep. 5:13859. doi: 10.1038/srep13859
Cheng, J.-H., Yang, H., Liu, M.-L., Su, W., Feng, P.-M., Ding, H., et al. (2018). Prediction of bacteriophage proteins located in the host cell using hybrid features. Chemometr. Intell. Lab. Syst. 180, 64–69.
Dominissini, D., Moshitch-Moshkovitz, S., Schwartz, S., Salmon-Divon, M., Ungar, L., Osenberg, S., et al. (2012). Topology of the human and mouse m6A RNA methylomes revealed by m6A-seq. Nature 485, 201–206. doi: 10.1038/nature11112
Geula, S., Moshitch-Moshkovitz, S., Dominissini, D., Mansour, A. A., Kol, N., Salmon-Divon, M., et al. (2015). m6A mRNA methylation facilitates resolution of naïve pluripotency toward differentiation. Science 347, 1002–1006. doi: 10.1126/science.1261417
Huang, G. H., and Li, J. C. (2018). Feature extractions for computationally predicting protein post-translational modifications. Curr. Bioinform. 13, 387–395. doi: 10.2174/1574893612666170707094916
Jia, C. Z., Zhang, J. J., and Gu, W. Z. (2016). RNA-MethylPred: a high-accuracy predictor to identify N6-methyladenosine in RNA. Anal. Biochem. 510, 72–75. doi: 10.1016/j.ab.2016.06.012
Lai, H.-Y., Chen, X.-X., Chen, W., Tang, H., and Lin, H. (2017). Sequence-based predictive modeling to identify cancerlectins. Oncotarget 8, 28169–28175. doi: 10.18632/oncotarget.15963
Li, F., Li, C., Revote, J., Zhang, Y., Webb, G. I., Li, J., et al. (2016). GlycoMine struct: a new bioinformatics tool for highly accurate mapping of the human N-linked and O-linked glycoproteomes by incorporating structural features. Sci. Rep. 6:34595. doi: 10.1038/srep34595
Liao, Z. J., Wan, S. X., He, Y., and Zou, Q. (2018). Classification of small GTPases with hybrid protein features and advanced machine learning techniques. Curr. Bioinform. 13, 492–500. doi: 10.2174/1574893612666171121162552
Liu, B. (2017). BioSeq-Analysis: a platform for DNA, RNA and protein sequence analysis based on machine learning approaches. Brief. Bioinform. doi: 10.1093/bib/bbx165 [Epub ahead of print].
Liu, B., Liu, F., Wang, X., Chen, J., Fang, L., and Chou, K.-C. (2015). Pse-in-One: a web server for generating various modes of pseudo components of DNA, RNA, and protein sequences. Nucleic Acids Res. 43, W65–W71. doi: 10.1093/nar/gkv458
Liu, B., Long, R., and Chou, K.-C. (2016a). iDHS-EL: identifying DNase I hypersensitive sites by fusing three different modes of pseudo nucleotide composition into an ensemble learning framework. Bioinformatics 32, 2411–2418. doi: 10.1093/bioinformatics/btw186
Liu, B., Wang, S., Long, R., and Chou, K.-C. (2016b). iRSpot-EL: identify recombination spots with an ensemble learning approach. Bioinformatics 33, 35–41. doi: 10.1093/bioinformatics/btw539
Liu, B., Yang, F., Huang, D.-S., and Chou, K.-C. (2017). iPromoter-2L: a two-layer predictor for identifying promoters and their types by multi-window-based PseKNC. Bioinformatics 34, 33–40. doi: 10.1093/bioinformatics/btx579
Liu, B., Zhang, D., Xu, R., Xu, J., Wang, X., Chen, Q., et al. (2013). Combining evolutionary information extracted from frequency profiles with sequence-based kernels for protein remote homology detection. Bioinformatics 30, 472–479. doi: 10.1093/bioinformatics/btt709
Liu, N., Dai, Q., Zheng, G., He, C., Parisien, M., and Pan, T. (2015). N 6-methyladenosine-dependent RNA structural switches regulate RNA–protein interactions. Nature 518, 560–564. doi: 10.1038/nature14234
Liu, Z., Xiao, X., Yu, D. J., Jia, J., Qiu, W. R., and Chou, K. C. (2016). pRNAm-PC: predicting N(6)-methyladenosine sites in RNA sequences via physical-chemical properties. Anal. Biochem. 497, 60–67. doi: 10.1016/j.ab.2015.12.017
Maden, B. (1990). “The numerous modified nucleotides in eukaryotic ribosomal RNA,” in Progress in Nucleic Acid Research and Molecular Biology, Vol. 39, ed. K. Moldave (Amsterdam: Elsevier), 241–303.
Meyer, K. D., Saletore, Y., Zumbo, P., Elemento, O., Mason, C. E., and Jaffrey, S. R. (2012). Comprehensive analysis of mRNA methylation reveals enrichment in 3’ UTRs and near stop codons. Cell 149, 1635–1646. doi: 10.1016/j.cell.2012.05.003
Mrozek, D., Malysiak, B., and Kozielski, S. (2007). “An optimal alignment of proteins energy characteristics with crisp and fuzzy similarity awards,” in Proceedings of the 2007 IEEE International Fuzzy Systems Conference, (London: IEEE), 1–6. doi: 10.1109/FUZZY.2007.4295590
Mrozek, D., Małysiak-Mrozek, B., and Kłapciñski, A. (2014). Cloud4Psi: cloud computing for 3D protein structure similarity searching. Bioinformatics 30, 2822–2825. doi: 10.1093/bioinformatics/btu389
Mrozek, D., Malysiak-Mrozek, B., and Kozielski, S. (2009). “Alignment of protein structure energy patterns represented as sequences of Fuzzy Numbers,” in NAFIPS 2009 Annual Meeting of the North American Fuzzy Information Processing Society, (Cincinnati, OH: IEEE), 1–6. doi: 10.1109/NAFIPS.2009.5156391
Mrozek, D., Małysiak-Mrozek, B., and Siążnik, A. (2013). search GenBank: interactive orchestration and ad-hoc choreography of Web services in the exploration of the biomedical resources of the National Center For Biotechnology Information. BMC Bioinformatics 14:73. doi: 10.1186/1471-2105-14-73
Peng, H., Long, F., and Ding, C. (2005). Feature selection based on mutual information criteria of max-dependency, max-relevance, and min-redundancy. IEEE Trans. Pattern Anal. Mach. Intell. 27, 1226–1238. doi: 10.1109/TPAMI.2005.159
Roost, C., Lynch, S. R., Batista, P. J., Qu, K., Chang, H. Y., and Kool, E. T. (2015). Structure and thermodynamics of N6-methyladenosine in RNA: a spring-loaded base modification. J. Am. Chem. Soc. 137, 2107–2115. doi: 10.1021/ja513080v
Song, J., Tan, H., Perry, A. J., Akutsu, T., Webb, G. I., Whisstock, J. C., et al. (2012). PROSPER: an integrated feature-based tool for predicting protease substrate cleavage sites. PLoS One 7:e50300. doi: 10.1371/journal.pone.0050300
Song, J., Tan, H., Shen, H., Mahmood, K., Boyd, S. E., Webb, G. I., et al. (2010). Cascleave: towards more accurate prediction of caspase substrate cleavage sites. Bioinformatics 26, 752–760. doi: 10.1093/bioinformatics/btq043
Song, J., Wang, Y., Li, F., Akutsu, T., Rawlings, N. D., Webb, G. I., et al. (2018). iProt-Sub: a comprehensive package for accurately mapping and predicting protease-specific substrates and cleavage sites. Brief. Bioinform. doi: 10.1093/bib/bby028 [Epub ahead of print].
Su, Z.-D., Huang, Y., Zhang, Z.-Y., Zhao, Y.-W., Wang, D., Chen, W., et al. (2018). iLoc-lncRNA: predict the subcellular location of lncRNAs by incorporating octamer composition into general PseKNC. Bioinformatics doi: 10.1093/bioinformatics/bty508 [Epub ahead of print].
Tang, H., Zhao, Y.-W., Zou, P., Zhang, C.-M., Chen, R., Huang, P., et al. (2018). HBPred: a tool to identify growth hormone-binding proteins. Int. J. Biol. Sci. 14, 957–964. doi: 10.7150/ijbs.24174
Wang, M., Zhao, X. M., Tan, H., Akutsu, T., Whisstock, J. C., and Song, J. (2014). Cascleave 2.0, a new approach for predicting caspase and granzyme cleavage targets. Bioinformatics 30, 71–80. doi: 10.1093/bioinformatics/btt603
Wang, X., Lu, Z., Gomez, A., Hon, G. C., Yue, Y., Han, D., et al. (2014). N 6-methyladenosine-dependent regulation of messenger RNA stability. Nature 505, 117–120. doi: 10.1038/nature12730
Wang, X., and Yan, R. (2018). RFAthM6A: a new tool for predicting m6A sites in Arabidopsis thaliana. Plant Mol. Biol. 96, 327–337. doi: 10.1007/s11103-018-0698-9
Wei, L., Chen, H., and Su, R. (2018a). M6APred-EL: a sequence-based predictor for identifying N6-methyladenosine sites using ensemble learning. Mol. Ther. Nucleic Acids 12, 635–644. doi: 10.1016/j.omtn.2018.07.004
Wei, L., Ding, Y., Su, R., Tang, J., and Zou, Q. (2018b). Prediction of human protein subcellular localization using deep learning. J. Parallel Distrib. Comput. 117, 212–217. doi: 10.2174/1566523218666180913110949
Wei, L., Luan, S., Nagai, L. A. E., Su, R., and Zou, Q. (2018c). Exploring sequence-based features for the improved prediction of DNA N4-methylcytosine sites in multiple species. Bioinformatics. doi: 10.1093/bioinformatics/bty824
Wei, L., Su, R., Wang, B., Li, X., and Zou, Q. (2018d). Integration of deep feature representations and handcrafted features to improve the prediction of N 6-methyladenosine sites. Neurocomputing. doi: 10.1016/j.neucom.2018.04.082
Wei, L., Zhou, C., Chen, H., Song, J., and Su, R. (2018e). ACPred-FL: a sequence-based predictor based on effective feature representation to improve the prediction of anti-cancer peptides. Bioinformatics doi: 10.1093/bioinformatics/bty451 [Epub ahead of print].
Wei, L., Tang, J., and Zou, Q. (2017). Local-DPP: an improved DNA-binding protein prediction method by exploring local evolutionary information. Inform. Sci. 384, 135–144. doi: 10.1016/j.ins.2016.06.026
Wei, L., Xing, P., Shi, G., Ji, Z., and Zou, Q. (2017a). Fast prediction of methylation sites using sequence-based feature selection technique. IEEE/ACM Trans. Comput. Biol. Bioinform. doi: 10.1109/TCBB.2017.2670558 [Epub ahead of print].
Wei, L., Xing, P., Su, R., Shi, G., Ma, Z., and Zou, Q. (2017b). CPPred-RF: a sequence-based predictor for identifying cell-penetrating peptides and their uptake efficiency. J. Proteome Res. 16, 2044–2053. doi: 10.1021/acs.jproteome.7b00019
Xiang, S., Liu, K., Yan, Z., Zhang, Y., and Sun, Z. (2016a). RNAMethPre: a web server for the prediction and query of mRNA m6A sites. PLoS One 11:e0162707. doi: 10.1371/journal.pone.0162707
Xiang, S., Yan, Z., Liu, K., Zhang, Y., and Sun, Z. (2016b). AthMethPre: a web server for the prediction and query of mRNA m 6 A sites in Arabidopsis thaliana. Mol. Biosyst. 12, 3333–3337.
Yang, H., Qiu, W.-R., Liu, G., Guo, F.-B., Chen, W., Chou, K.-C., et al. (2018). iRSpot-Pse6NC: identifying recombination spots in Saccharomyces cerevisiae by incorporating hexamer composition into general PseKNC. Int. J. Biol. Sci. 14, 883–891. doi: 10.7150/ijbs.24616
Zeng, J., Li, D., Wu, Y., Zou, Q., and Liu, X. (2016). An Empirical study of features fusion techniques for protein-protein interaction prediction. Curr. Bioinform. 11, 4–12. doi: 10.2174/1574893611666151119221435
Zeng, X., Liao, Y., Liu, Y., and Zou, Q. (2017a). “Prediction and validation of disease genes using HeteSim Scores,” in Proceedings of the IEEE/ACM Transactions on Computational Biology and Bioinformatics (TCBB), Vol. 14, (Piscataway, NJ: IEEE), 687–695. doi: 10.1109/TCBB.2016.2520947
Zeng, X., Lin, W., Guo, M., and Zou, Q. (2017b). A comprehensive overview and evaluation of circular RNA detection tools. PLoS Comput. Biol. 13:e1005420. doi: 10.1371/journal.pcbi.1005420
Zeng, X., Zhang, X., and Zou, Q. (2015). Integrative approaches for predicting microRNA function and prioritizing disease-related microRNA using biological interaction networks. Brief. Bioinform. 17, 193–203. doi: 10.1093/bib/bbv033
Zhang, X., Zou, Q., and Rodriguez-Paton, A. (2017). “Meta-path methods for prioritizing candidate disease miRNAs,” in Proceedings of the IEEE/ACM Transactions on Computational Biology and Bioinformatics, (Piscataway, NJ: IEEE).
Zhou, Y., Zeng, P., Li, Y. H., Zhang, Z., and Cui, Q. (2016). SRAMP: prediction of mammalian N6-methyladenosine (m6A) sites based on sequence-derived features. Nucleic Acids Res. 44:e91. doi: 10.1093/nar/gkw104
Zou, Q., Lin, G., Jiang, X., Liu, X., and Zeng, X. (2018). Sequence clustering in bioinformatics: an empirical study. Brief. Bioinform. doi: 10.1093/bib/bby090
Zou, Q., Wan, S., Ju, Y., Tang, J., and Zeng, X. (2016a). Pretata: predicting TATA binding proteins with novel features and dimensionality reduction strategy. BMC Syst. Biol. 10:114. doi: 10.1186/s12918-016-0353-5
Keywords: N6-methyladenosine site, eXtreme Gradient Boosting, machine learning, feature representation, RNA methylation, feature selection
Citation: Qiang X, Chen H, Ye X, Su R and Wei L (2018) M6AMRFS: Robust Prediction of N6-Methyladenosine Sites With Sequence-Based Features in Multiple Species. Front. Genet. 9:495. doi: 10.3389/fgene.2018.00495
Received: 18 July 2018; Accepted: 04 October 2018;
Published: 25 October 2018.
Edited by:
Arun Kumar Sangaiah, VIT University, IndiaReviewed by:
Chao Pang, Columbia University Medical Center, United StatesJianghan Qu, University of Southern California, United States
Copyright © 2018 Qiang, Chen, Ye, Su and Wei. This is an open-access article distributed under the terms of the Creative Commons Attribution License (CC BY). The use, distribution or reproduction in other forums is permitted, provided the original author(s) and the copyright owner(s) are credited and that the original publication in this journal is cited, in accordance with accepted academic practice. No use, distribution or reproduction is permitted which does not comply with these terms.
*Correspondence: Ran Su, cmFuLnN1QHRqdS5lZHUuY24= Leyi Wei, d2VpbGV5aUB0anUuZWR1LmNu