 Xiang Ding
 Hesheng Luo
- Department of Gastroenterology, Renmin Hospital, Wuhan University, Wuhan, China
Objective: Colorectal cancer (CRC) is considered the most prevalent malignant tumor that contributes to high cancer-related mortality. However, the signaling pathways involved in CRC and CRC-driven genes are largely unknown. We sought to discover a novel biomarker in CRC.
Materials and Methods: All clinical CRC samples (n = 20) were from Renmin Hospital of Wuhan University. We first selected MAD2L1 by integrated bioinformatics analysis of a GSE dataset. Next, the expression of MAD2L1 in tissues and cell lines was verified by quantitative real-time PCR. The effects of MAD2L1 on cell growth, proliferation, the cell cycle, and apoptosis were examined by in vitro assays.
Results: We identified 683 shared DEGs (420 upregulated and 263 downregulated), and the top twenty genes (CDK1, CCNA2, TOP2A, PLK1, MAD2L1, AURKA, BUB1B, UBE2C, TPX2, RRM2, KIF11, NCAPG, MELK, NUSAP1, MCM4, RFC4, PTTG1, CHEK1, CEP55, DTL) were selected by integrated analysis. These hub genes were significantly overexpressed in CRC samples and were positively correlated. Our data revealed that the expression of MAD2L1 in CRC tissues is higher than that in normal tissues. MAD2L1 knockdown significantly suppressed CRC cell growth by impairing cell cycle progression and inducing cell apoptosis.
Conclusion: MAD2L1, as a novel oncogenic gene, plays a role in regulating cancer cell growth and apoptosis and could be used as a new biomarker for diagnosis and therapy in CRC.
Introduction
Colorectal cancer (CRC) is currently a major public health problem in medicine today. CRC is one of the most frequently occurring malignancies worldwide, with more than 777,000 new cases expected in 2015 and almost 350,000 deaths in developed countries (Ferlay et al., 2015). The risk of developing colorectal cancer depends on different variables that can be classified into lifestyle or behavioral factors and genetically determinant factors. Similar to other cancers, CRC is considered a polyphase disease in which gene distortions, cellular contexts, and environmental influences concur with tumor initiation, progression, and metastasis (Aran et al., 2016). Increasing evidence shows that multiple genes and cellular pathways are involved in the occurrence and development of CRC. Until now, a lack of knowledge about the exact molecular mechanisms underlying CRC progression has limited the ability to treat advanced disease. On the other hand, so far, the main clinical screening methods for CRC involve endoscopic screening, especially colonoscopy. Colonoscopy has shortcomings such as poor patient compliance, the influence of family history, inconvenience, and high cost and risk. Therefore, it is of great significance to understand the molecular mechanisms of CRC proliferation, apoptosis and invasion in order to develop more effective diagnostic and therapeutic strategies.
The recently adopted high-throughput gene microarray analysis of tumors and samples from patients and healthy people allows us to share and explore global molecular tumors at different levels of the landscape from somatic mutations and copy number changes to genome-level gene expression at the transcriptome level, as well as epigenetic changes (Liu et al., 2017; Sun et al., 2017; Chen et al., 2017). In this study, we downloaded the GSE117606 dataset from the Gene Expression Omnibus (GEO, http://www.ncbi.nlm.nih.gov/geo) database using R software for the comprehensive identification of differentially expressed genes (DEGs). Then, we established a protein–protein interaction (PPI) network of DEGs to screen out the first 20 hub genes with a high degree of connectivity. In addition, we also analyzed Gene Ontology involving the biological processes (BPs), molecular functions (MFs), and cellular components (CCs) of the DEGs as well as their KEGG pathways. The potential correlation and expression levels were analyzed via Gene Expression Profiling Interactive Analysis (GEPIA) (http://gepia.cancer-pku.cn/index.html).
Our data showed that the expression of MAD2L1 is significantly higher in CRC tissues than in normal tissues. The cell cycle progression could be slowed, and apoptosis could be induced by knocking down MAD2L1, which directly leads to the inhibition of the growth of CRC cells. In conclusion, MAD2L1 can be used as a new diagnostic indicator and guide the combined treatment of CRC.
Materials and Methods
Microarray Data
We downloaded the gene expression profile of GSE117606 from the GEO database, a free public database. The GSE117606 dataset has a total of 208 samples, containing 74 CRC samples and 65 normal colon tissues and was based on the Agilent GPL25373 platform (HT_HG-U133_Plus_PM) Affymetrix HT HG-U133+ PM Array Plate (CDF: HTHGU133PlusPM_Hs_ENTREZG_20) by Joke Reumers et al. We also downloaded the Series Matrix File of GSE117606 from the GEO database.
Data Preprocessing
The expression values of all probes in each sample were reduced to a single value by determining the mean expression value via the aggregate function method (Li, 1991). Missing data were assigned using the k-nearest neighbor method (Altman, 1992). Quantile normalization for complete data was performed using the preprocessCore package in Bioconductor (Bolstad et al., 2003). When many probes were mapped to a gene, the median of the data was defined as the level of expression of that gene. However, when many genes were located by a probe, the probe was considered to lack specificity and was removed from the analysis.
Identification of DEGs
We utilized the “limma” R package (Ritchie et al., 2015) to identify the DEGs between CRC samples and normal ovarian samples. Adjusted P < 0.05 and |log fold change (FC)| > 1 were chosen as the cutoff criteria. The adjusted P-value (adj. P) was applied to help correct false positives. The heat map and volcano plot were drawn with the “gplots” package in R 3.5.3 (Galili et al., 2018).
A total of 683 DEGs were found, including 420 upregulated genes and 263 downregulated genes, and we selected the top 20 genes with a high degree of connectivity as hub genes.
Gene Ontology and KEGG Pathway Analysis of DEGs
Gene Ontology (GO) analysis can be used to annotate genes and their products with cellular components (CCs), molecular functions (MFs), biological pathways (BPs), and other functions (Gaudet et al., 2017). The Kyoto Encyclopedia of Genes and Genomes (KEGG) is a collection of databases that address genomic and biological pathways related to diseases and drugs. KEGG is essentially a resource for the comprehensive understanding of biological systems and some high-level genomic functional information (Kanehisa, 2002). Database for Annotation, Visualization, and Integrated Discovery (DAVID, http://david.ncifcrf.gov) (version 6.8) is an online biological information database that integrates a large amount of biological data and related analysis tools, providing systematic and comprehensive biological function annotation information for high-throughput gene expression (Huang et al., 2007). P < 0.05 was used as the cut-off criterion for statistically significant differences. To visualize the key molecular functions, biological processes, cellular components, and KEGG pathways of the DEGs, the DAVID online database was used to perform biological analysis.
PPI Network and Module Analysis
The Search Tool for the Retrieval of Interacting Genes/Proteins (STRING) is an online tool that was designed to evaluate and integrate protein–protein interaction (PPI) information, such as physical and functional associations. To date, a total of 9,643,763 proteins from 2,031 organisms have been covered in STRING version 11.0 (Szklarczyk et al., 2015). To evaluate the interrelationships among these DEGs, we first drew the network of DEGs in STRING and then visualized the PPI network by using Cytoscape software. Moreover, we set the maximum number of interacting bodies to 0 and used a confidence score of 0.7 as the cut-off criterion. Additionally, the Molecular Complex Detection (MCODE) app was also employed to select modules of the PPI network in Cytoscape according to node score cut-off = 0–2, degree cut-off = 2, max.depth = 100, and k−core = 2. With DAVID, the gene pathways of the three modules were analyzed. Additionally, 20 hub genes were mapped into STRING according to a confidence score ≥0.4 and a maximum number of interactors ≤5. We also used GO and KEGG pathway analysis to investigate their underlying information.
Comparison of the Hub Genes’ Expression Levels
GEPIA (http://gepia.cancer-pku.cn/index.html) is a newly developed interactive web server designed by Zefang Tang, Chenwei Li, and Boxi Kang of the Zhang Lab, Peking University, designed to analyze the RNA sequence expression data of 9,736 tumors and 8,587 normal samples from the TCGA and GTEx projects using a standard processing pipeline. GEPIA provides customizable capabilities, such as tumor/normal differential expression analysis, profiling by cancer type or pathological stages, patient survival analysis, similar gene testing, correlation analysis, and dimensional reduction analysis (Tang et al., 2017). In our study, we mainly used boxplots to visualize hub gene expression in CRC and normal colon tissues. Then, we analyzed the top 20 hub genes' correlation with a scatter plot. The Human Protein Atlas (HPA, https://www.proteinatlas.org/) is a Swedish-based program initiated in 2003 with the aim of mapping all human proteins in cells, tissues, and organs using the integration of various omics technologies, including antibody-based imaging, mass spectrometry-based proteomics, transcriptomics, and systems biology (Uhlen et al., 2017). We further verified the expression of MAD2L1 by obtaining immunohistochemical data based on the HPA in patients with or without CRC.
Gene Set Enrichment Analysis
Gene Set Enrichment Analysis (GSEA) is a computational method for exploring whether a given gene set is significantly enriched in a group of gene markers ranked by their relevance with a phenotype of interest. The curated KEGG pathway V5.2 data set was used to compare the impaired pathways in normal and colon cancer samples. In addition, the gene sets with fewer than 15 genes or more than 500 genes were excluded. The phenotype label was set as colon cancer versus control. The t-statistic mean of the genes was computed in each KEGG pathway using a permutation test with 1,000 replications. The upregulated pathways were defined by a normalized enrichment score (NES) > 0, and the downregulated pathways were defined by an NES <0. Pathways with an FDR P value ≤1 were considered significantly enriched.
Validation Based on CRC Clinical Samples
To further verify the data from GEO, we conducted quantitative real-time PCR (qRT-PCR) to quantify the expression level of MAD2L1 in clinical CRC patient samples (n = 20) from Renmin Hospital of Wuhan University (Wuhan, China). Written informed consent was obtained from all patients. This study was approved by the Institute Research Ethics Committee of Renmin Hospital of Wuhan University.
Cell Lines and Cell Transfection
All cell lines, including the normal cell line NCM460 and the CRC cell lines HT-29, HCT116, SW620, and SW480, were purchased from Bioyear Biotechnology. The cells were cultured in RPMI-1640 medium supplemented with 10% FBS (Thermo Fisher Scientific). All cells were maintained in a humidified incubator with 5% CO2 at 37°C. A total of 1 × 10⁴ cells/ml were plated approximately 24 h before transfection. Once the cells reached 40%–60% confluence in each well of a 96-well plate, the cells were transfected with 2.5 nM siRNA/NC (RiboBio, Guangzhou, China) using Lipofectamine 2000 (Thermo Fisher Scientific) at the indicated concentrations according to the manufacturer's instructions. Six hours later, the culture medium was replaced with fresh medium containing 10% FBS. The cells were harvested after 24 h of transfection for the following assays.
The siRNA sequences were as follows:
Si-h-MAD2L1: forward, 5'-GGGUCCAAAGUUGAGUGAGUCUUGAdTdT-3'; reverse, 5'-CGGACUCACCUUGCUUGUAACUACUdTdT-3'.
RNA Extraction, Reverse Transcription (RT)-PCR, and qRT-PCR
Total RNA was extracted from cells using TRIzol reagent (Invitrogen™). Reverse-transcribed complementary DNA was synthesized using the PrimeScript™RT Reagent Kit (Takara). The RT-PCR conditions were 37°C for 15 min, 85°C for 5 s, and held at 4°C. After the dilution (1:4) of cDNA with nuclease-free water, qRT-PCR was performed by a StepOne™ Real-Time PCR system and SYBR® Premix Ex Taq™. The mixes were predenatured at 95°C for 1 min, followed by 40 cycles of denaturation at 95°C for 15 s and 72°C for 45 s. The results were normalized to GAPDH expression. The relative expression level of MAD2L1 was calculated by the 2−ΔΔCt method.
The primers used for qRT-PCR were as follows: GAPDH forward, 5'-CATCATCCCTGCCTCTACTGG-3'; and reverse, 5'-GTGGGTGTCGCTGTTGAAGTC-3'; MAD2L1 forward, 5'-GCAAAAGATGACAGTGCACCC-3'; and reverse, 5'-GTGGTCCCGACTCTTCCCAT -3'.
Colony Formation Assay
Twenty-four hours after SW620 cells were infected with siRNA, approximately 300 cells were seeded on each well of a six-well plate. The cells were allowed to incubate at 37°C for 14 days. Then, the cells were fixed, stained with crystal violet, and photographed. ImageJ software (1.48 u; National Institutes of Health) was used to count the number of clones per well.
Cell Cycle Analysis
Twenty-four hours after siRNA interference, SW620 cells were harvested, centrifuged, and resuspended in 1× PBS. The cells were fixed in 70% ethanol overnight. On the second day, after being washed with 1× PBS solution and centrifuged, the cells were resuspended in 1× PBS solution and incubated with RNaseA at 37°C for 30 min. Finally, the cells were stained with propidium iodide and analyzed by a FACSCalibur system (BD Biosciences).
Apoptosis Analysis
SW620 cells were transfected with siRNA for 24 h, harvested, and centrifuged. Then, the supernatant was removed and resuspended in 1× PBS solution. This procedure was repeated three times with 1 × 10⁶ cells per well, and then the cells were stained with an Annexin V/FITC and PI kit. After staining, the cells were analyzed with a FACSCalibur system (BD Biosciences).
Statistical Analysis
All experiments were performed at least three times, and each independent test was carried out in triplicate for each condition under the protocol and according to the manufacturer's instructions. All statistical analyses were performed using PASW Statistics 19.0 (IBM) or GraphPad Prism 6 software (GraphPad Software, Inc.).
Results
Identification of DEGs and Hub Genes
A total of 74 CRC samples and 65 normal samples were analyzed. The series from each chip was analyzed separately using R software, and finally, the DEGs, using adjusted P value < 0.05 and logFC ≥ 1 or logFC ≤ −1 as the cut-off criteria, were identified. A total of 683 DEGs were identified after analyzing GSE117606, 420 of which were upregulated genes, and 263 were downregulated (Figure 1B). Figure 1A shows the performance level of the DEGs with a fold change of 1. In addition, 20 hub genes were identified from high to low according to their degree of connectivity (Table 1).
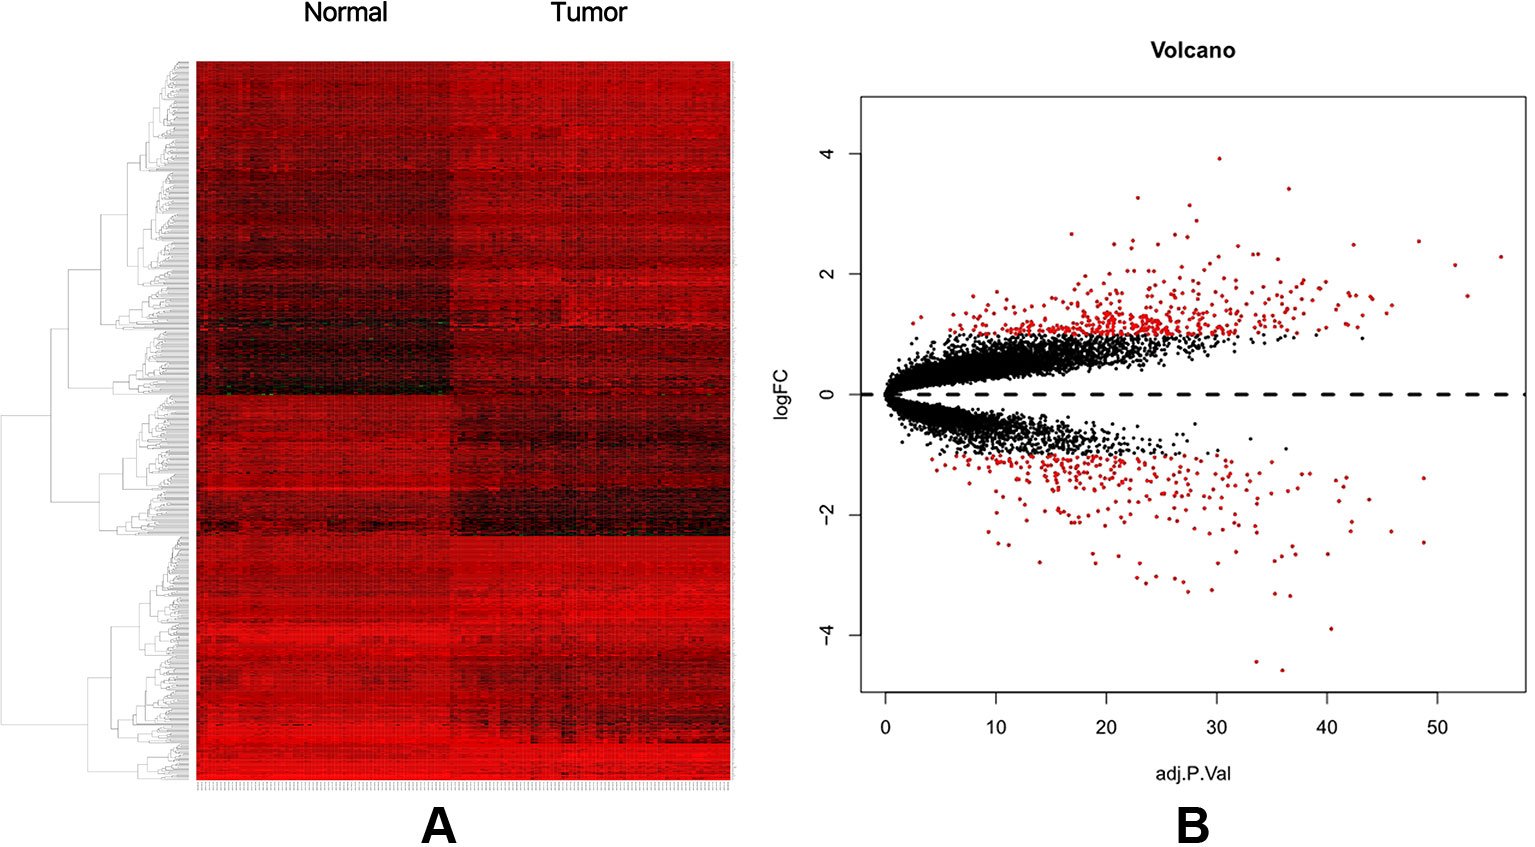
Figure 1 (A) Heat map of DEGs. (B) Volcano plot of genes detected in CRC. Red means upregulated and downregulated DEGs; black means no difference.
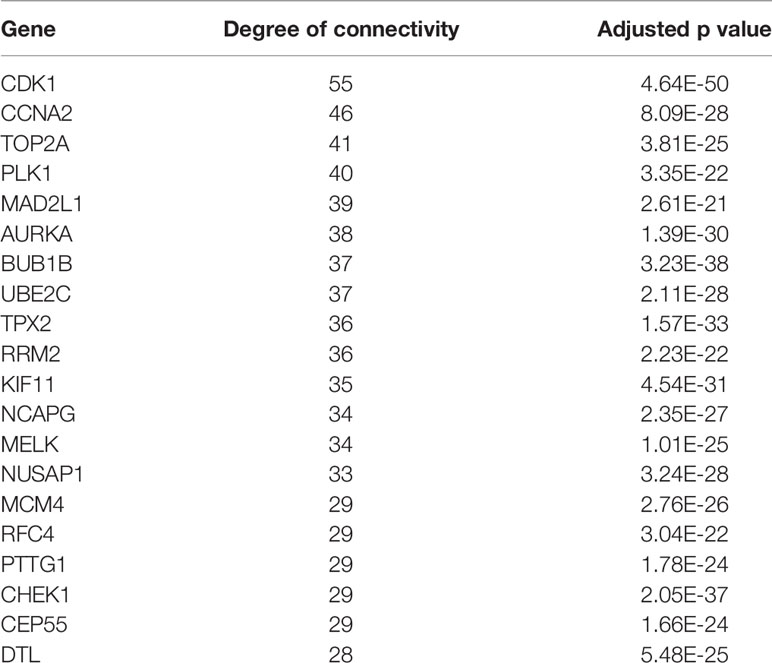
Table 1 Top 20 hub genes with higher degree of connectivity.
GO Function and KEGG Pathway Enrichment Analysis
To obtain a more comprehensive and in-depth understanding of the selected DEGs, we analyzed the GO function and KEGG pathway enrichment by DAVID. After importing all DEGs into DAVID, we discovered the functions of the upregulated DEGs and downregulated DEGs by GO analysis. More specifically, these DEGs were mainly enriched in biological processes (BPs) involving collagen catabolic process, extracellular matrix organization, collagen fibril organization, cell division, and G1/S transition of the mitotic cell cycle for the upregulated genes; and bicarbonate transport, muscle contraction, regulation of intracellular pH, chloride transmembrane transport, and one-carbon metabolic process for the downregulated genes. Regarding function (MF), the DEGs were involved in extracellular matrix structural constituent, extracellular matrix binding, platelet-derived growth factor binding, chemokine activity, and calcium ion binding for the upregulated genes; and chloride channel activity, carbonate dehydratase activity, NAD binding, hormone activity, and intracellular calcium activated chloride channel activity for the downregulated genes. In addition, GO cell component (CC) analysis revealed that the upregulated DEGs were principally enriched in the proteinaceous extracellular matrix, extracellular region, extracellular space, collagen trimer, and extracellular matrix, while the downregulated DEGs were mainly enriched in extracellular exosomes, extracellular space, integral components of the plasma membrane, brush border membrane, and apical plasma membrane (Table 2).
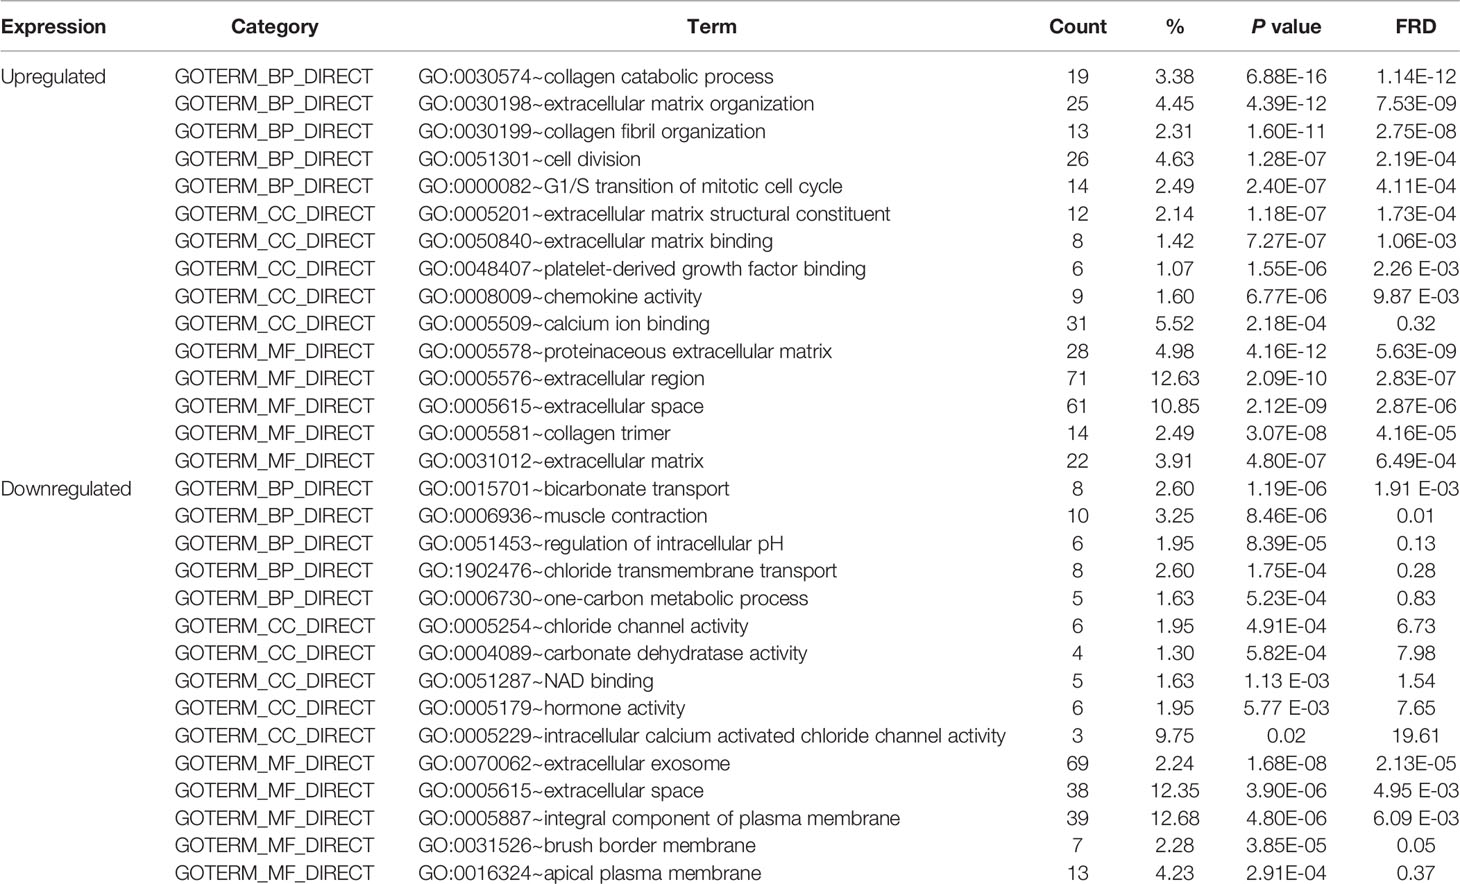
Table 2 Gene Ontology analysis of differentially expressed genes associated with colorectal cancer.
Table 3 shows the most significantly enriched KEGG pathways of the upregulated and downregulated DEGs. The upregulated DEGs were enriched in the cell cycle, ECM-receptor interaction, focal adhesion, protein digestion and absorption, and the PI3K-Akt signaling pathway, while the downregulated DEGs were enriched in mineral absorption, proximal tubule bicarbonate reclamation, retinol metabolism, pentose and glucuronate interconversions, and steroid hormone biosynthesis. Figures 2A–C present a GO and KEGG pathway enrichment plot of CRC.
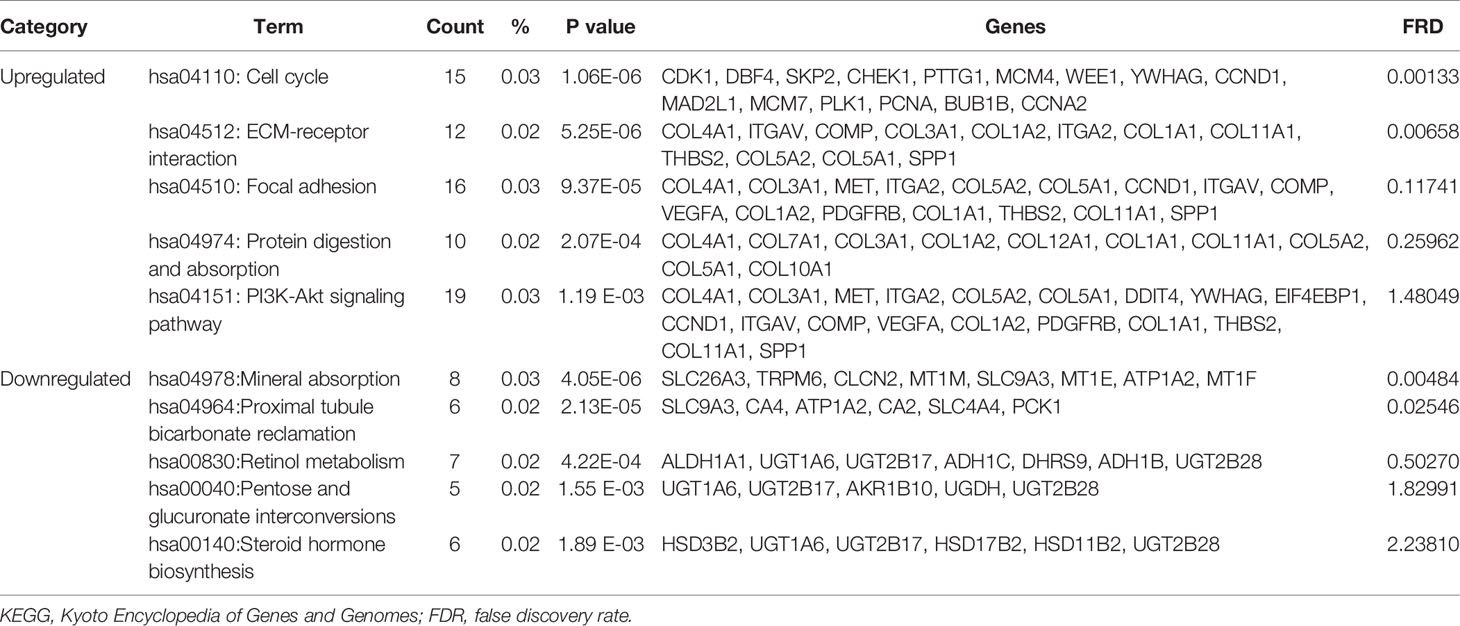
Table 3 KEGG pathway analysis of differentially expressed genes associated with colorectal cancer.
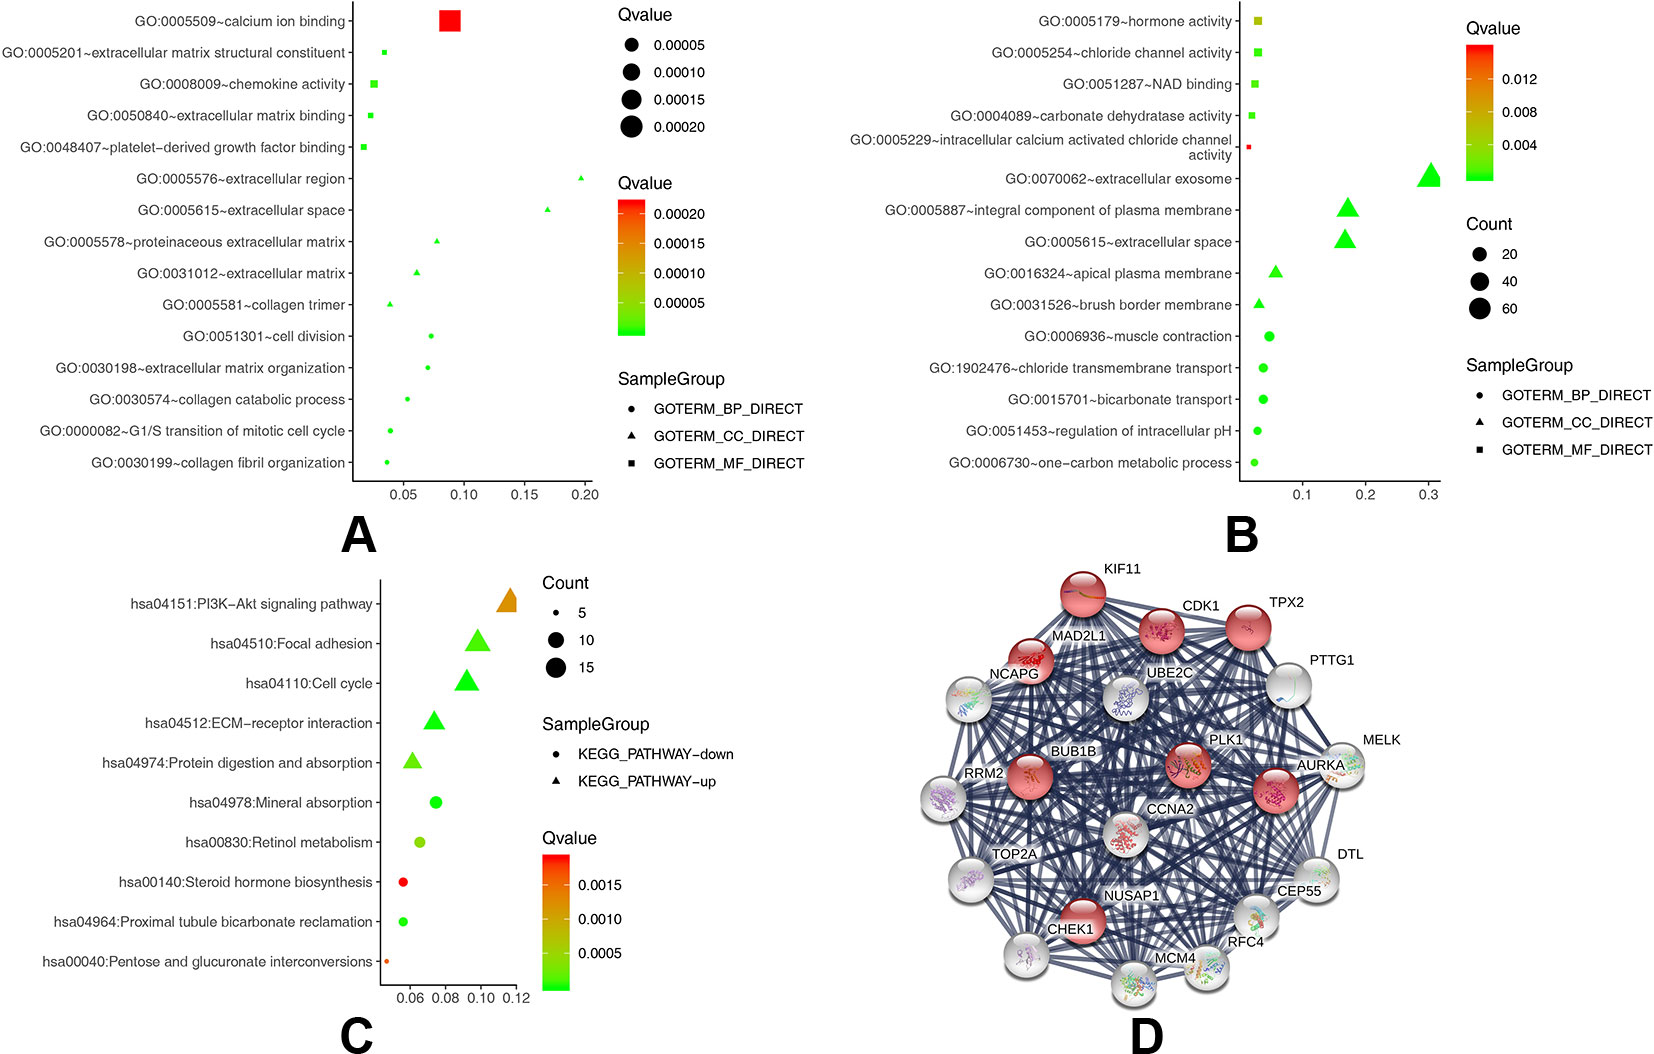
Figure 2 (A) GO analysis of upregulated DEGs. (B) GO analysis of downregulated DEGs. (C) KEGG pathway of DEGs. (D) The protein–protein interaction (PPI) network of the top 20 hub genes.
Hub Genes and Module Screening of the PPI Network
Based on querying STRING protein information from the public database, we constructed a PPI network of the top 20 hub genes according to the degree of connectivity (Figure 2D). The top 20 hub genes with a high degree of connectivity were as follows: CDK1, CCNA2, TOP2A, PLK1, MAD2L1, AURKA, BUB1B, UBE2C, TPX2, RRM2, KIF11, NCAPG, MELK, NUSAP1, MCM4, RFC4, PTTG1, CHEK1, CEP55, and DTL. Based on the GO function and KEGG pathway analysis, we found that CDK1, MAD2L1, PLK1, BUB1B, CHEK1, PTTG1, CCNA2, and MCM4 were enriched in the cell cycle. To detect the most important module in this PPI network, we used the MCODE plug-in. The top 3 modules were selected (Figure 3). KEGG pathway analysis revealed that the top 3 modules were mainly associated with the cell cycle, ribosome biogenesis in eukaryotes, and the chemokine signaling pathway (Table 4).
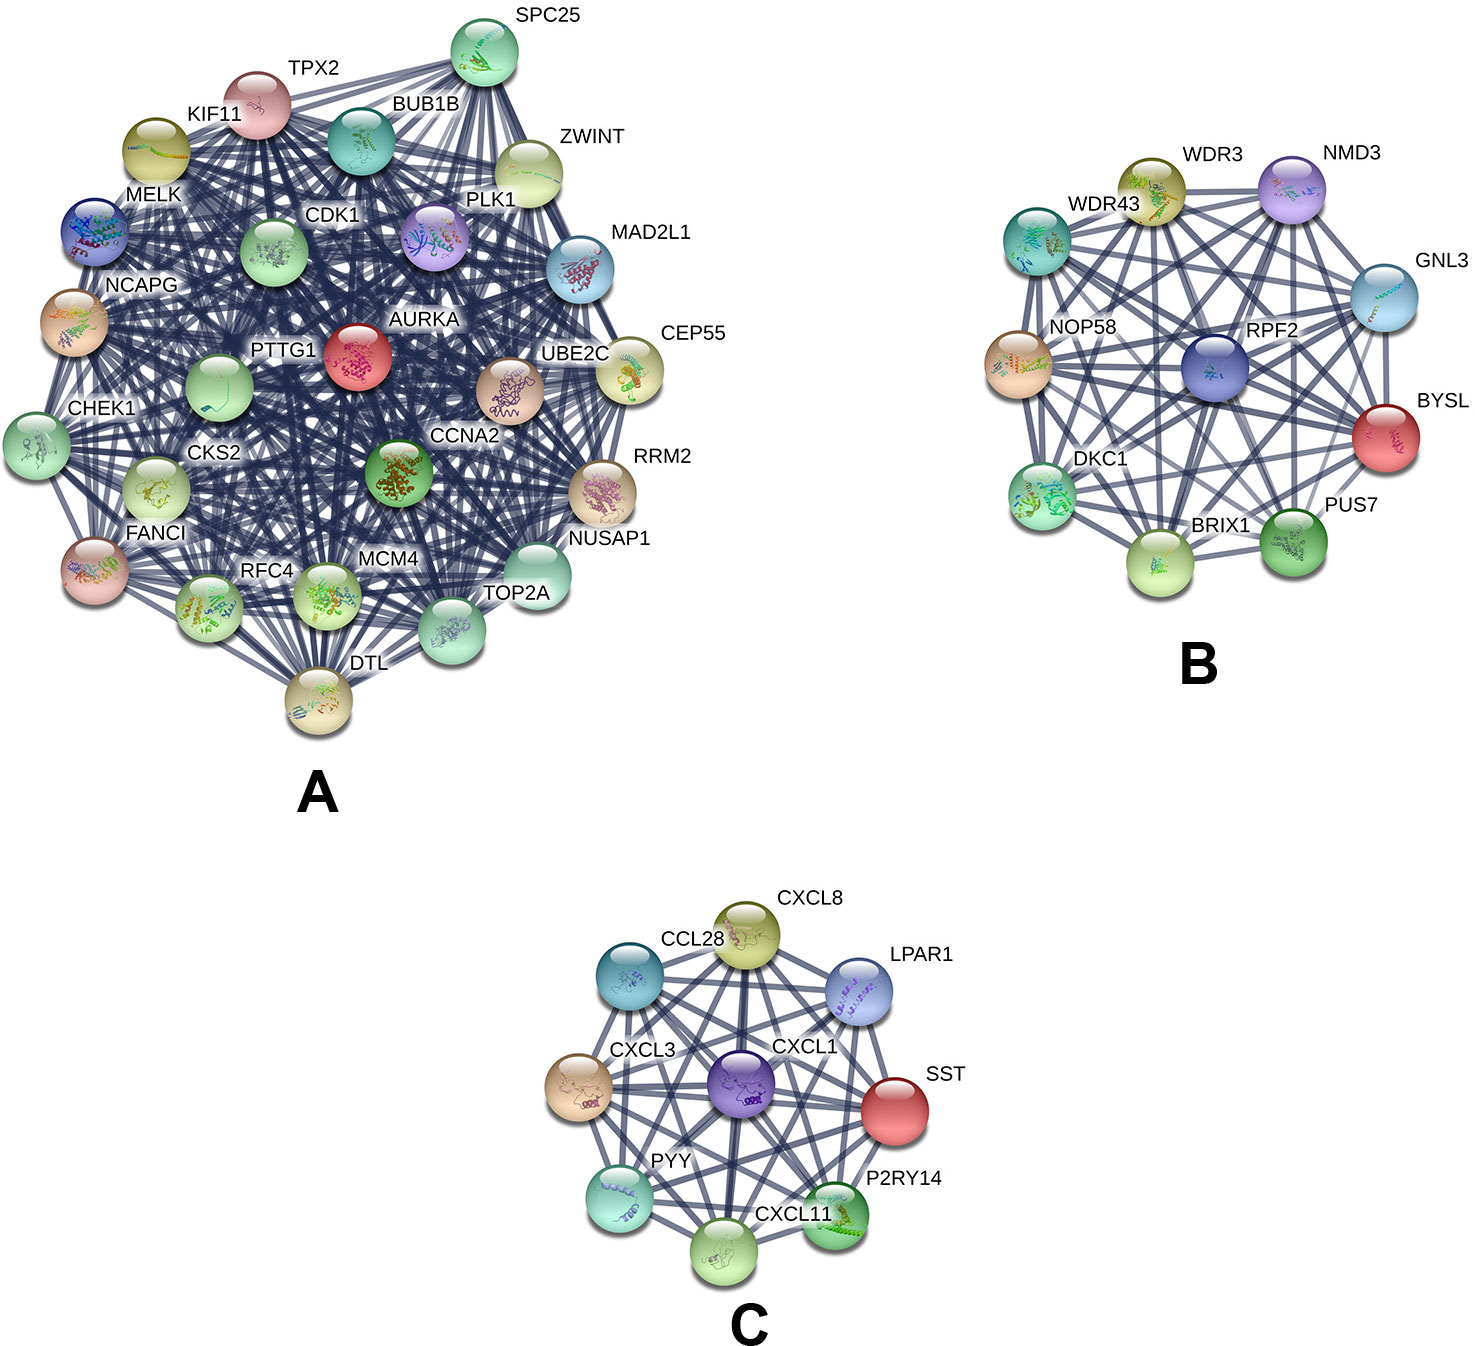
Figure 3 Top 3 modules from the protein–protein interaction network: (A) module 1, (B) module 2, (C) module 3.
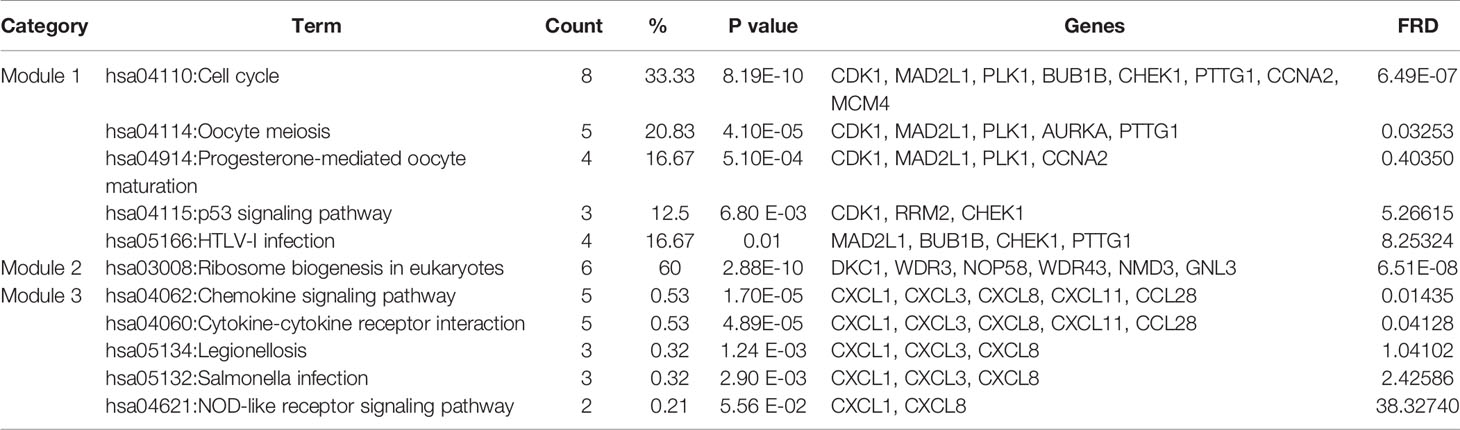
Table 4 The enriched pathways of top 3 modules.
The Expression Level and Correlation Analyses of the Twenty Hub Genes in GEPIA
GEPIA is an interactive online server for exploring large data sets from the TCGA and GTEx projects. To confirm the reliability of the twenty identified hub genes from the data sets, we used GEPIA to verify the correlation between them, and they were obviously positively correlated with each other in CRC (Figure 4A). GEPIA was also used to determine the expression levels of the top ten genes in CRC. Figure 4B shows that these genes were all significantly overexpressed in the colon cancer (COAD) samples compared to the normal samples.
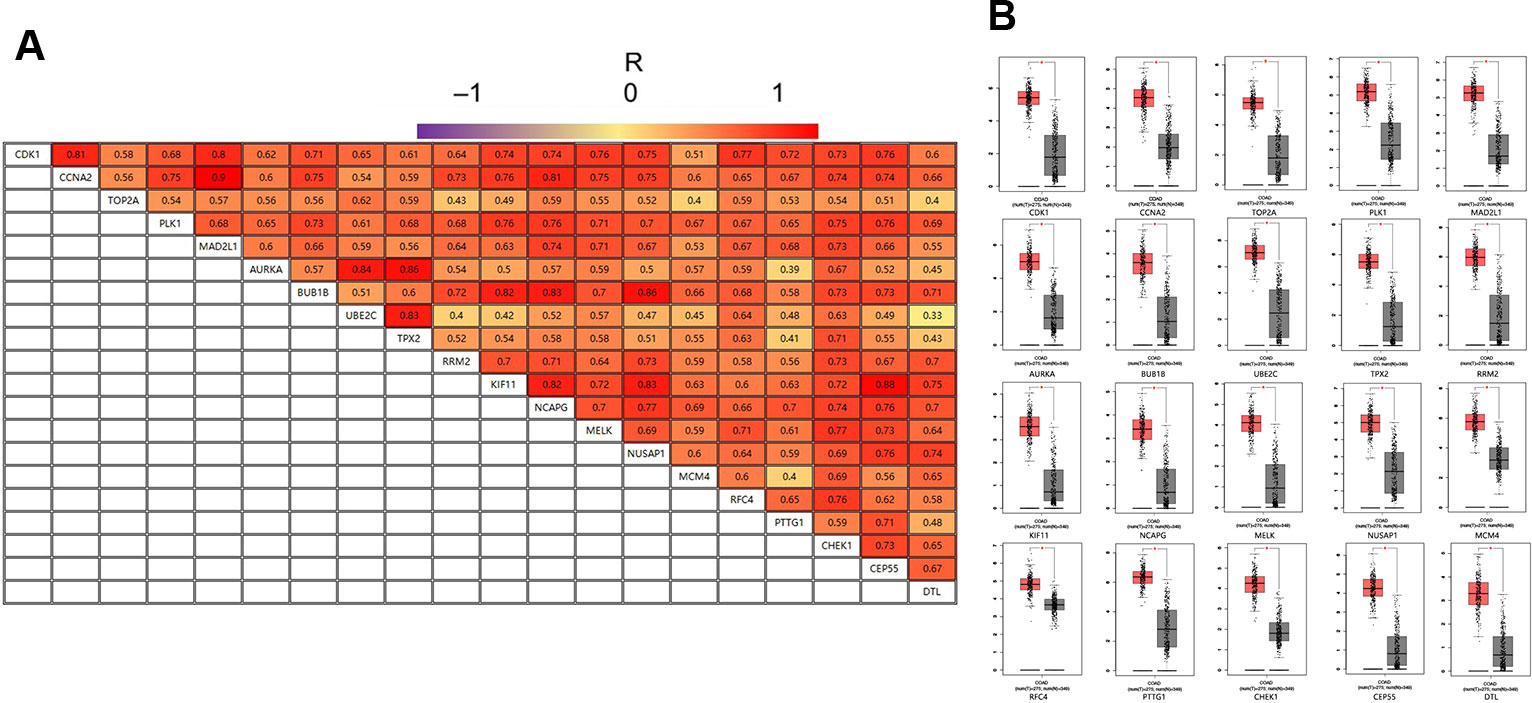
Figure 4 (A) The correlation analysis of the 20 hub genes. (B) Expression levels of the 20 hub genes in CRC compared to the normal samples. Notes: R is the Pearson correlation coefficient. Abbreviations: CRC, colorectal cancer.
Gene Set Enrichment Analysis
To gain further insight into the functions of the DEGs, GSEA was conducted to map the DEGs into the KEGG pathway database. Under the cut-off criteria of FDR <0.05, |enrichment score (ES)| > 0.6, and gene size ≥100, the top five pathways were “p53 signaling pathway,” “homologous recombination,” “cell cycle,” “nucleotide excision repair”, and “spliceosome” (Figure 5).
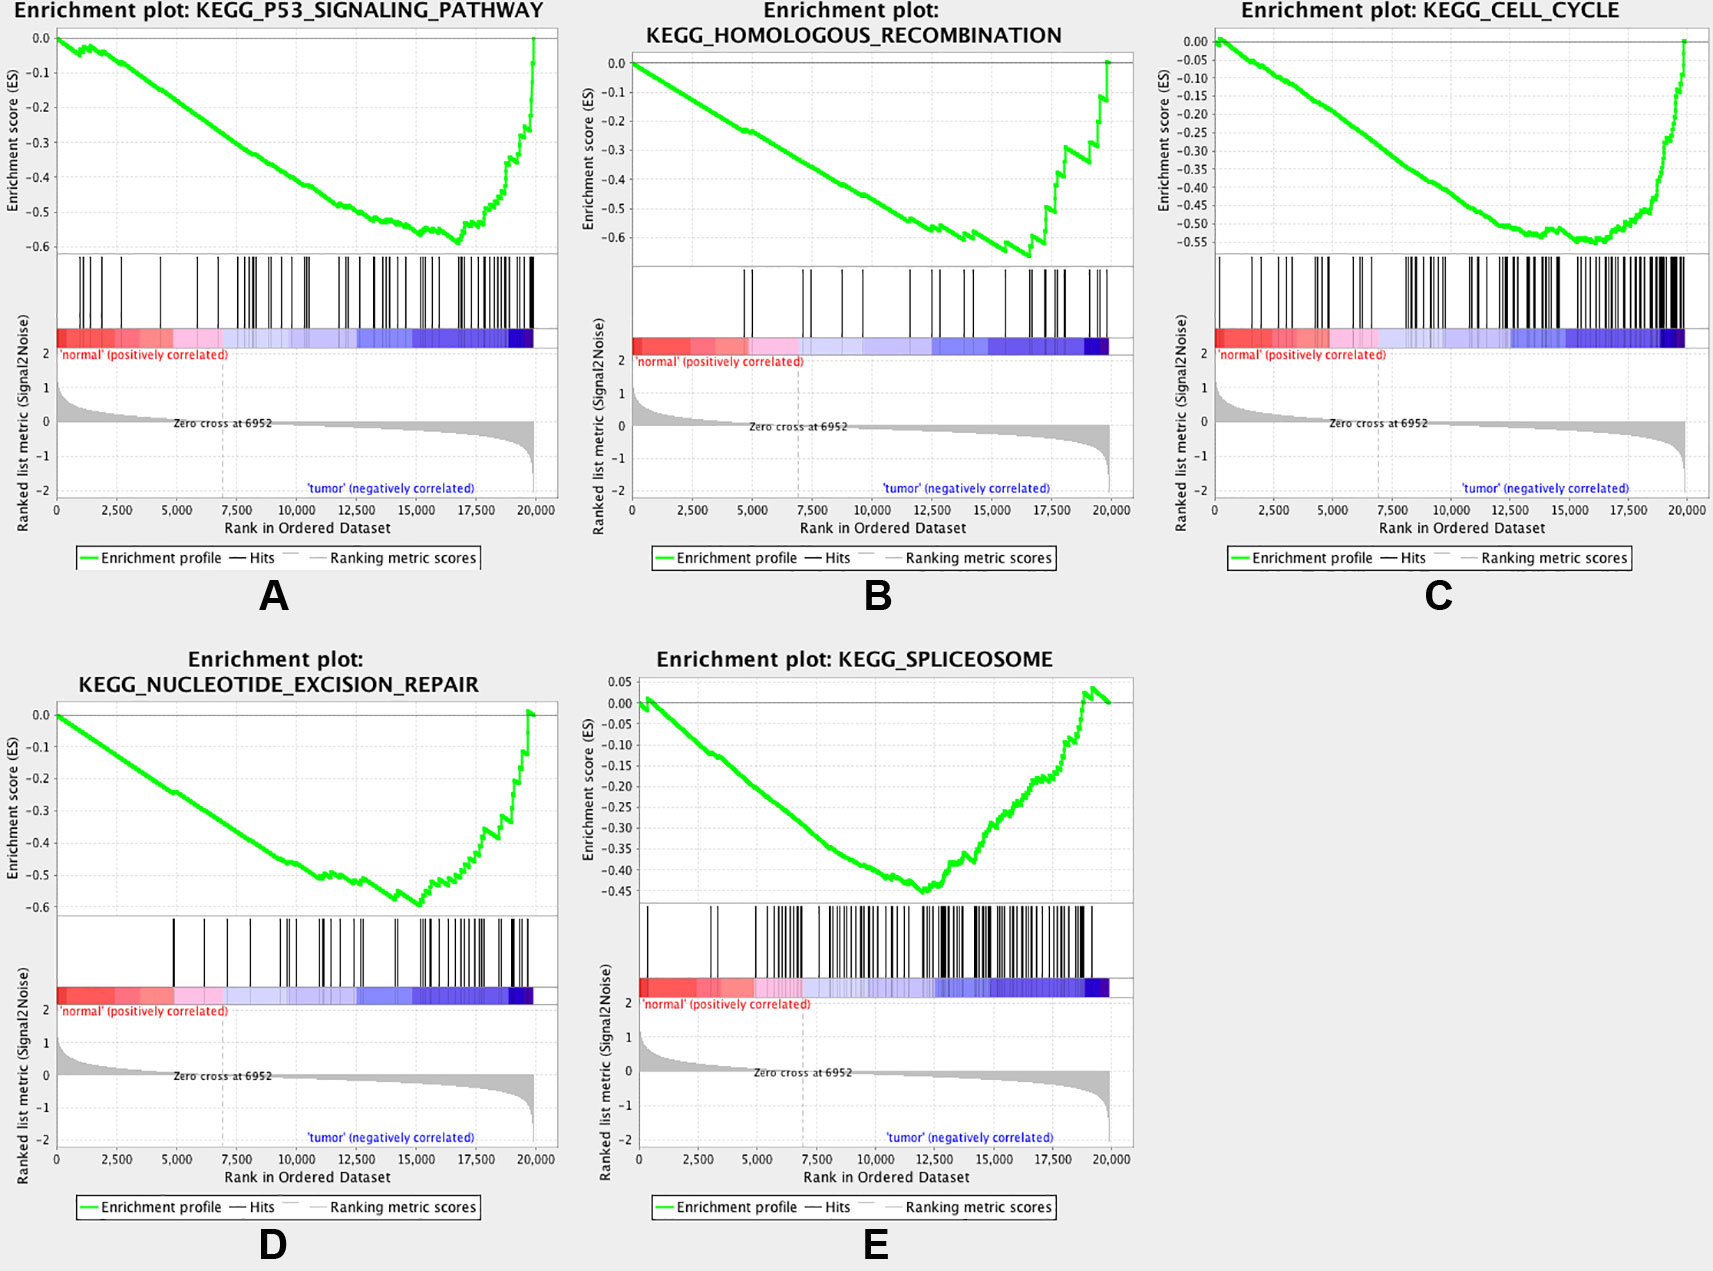
Figure 5 Gene set enrichment analysis (GSEA). Listed pictures are five representative functional gene sets enriched in CRC with MAD2L1 highly expressed.
Expression Patterns of MAD2L1 in CRC
To identify the expression level of MAD2L1 in CRC, we performed qRT-PCR to confirm the expression of MAD2L1 in 20 paired clinical samples, in which the mean expression level of MAD2L1 was notably higher in CRC tissues than in normal tissues (Figure 6A). Next, we measured the expression of MAD2L1 in various cell lines, including the normal cell line NCM460 and the CRC cell lines HT-29, HCT116, SW620, and SW480. The expression of MAD2L1 was higher in tumor cells than in normal cells (Figure 6B), which is similar to the results from the four datasets in GEO and the GEPIA results, suggesting that our results for these genes are reliable.
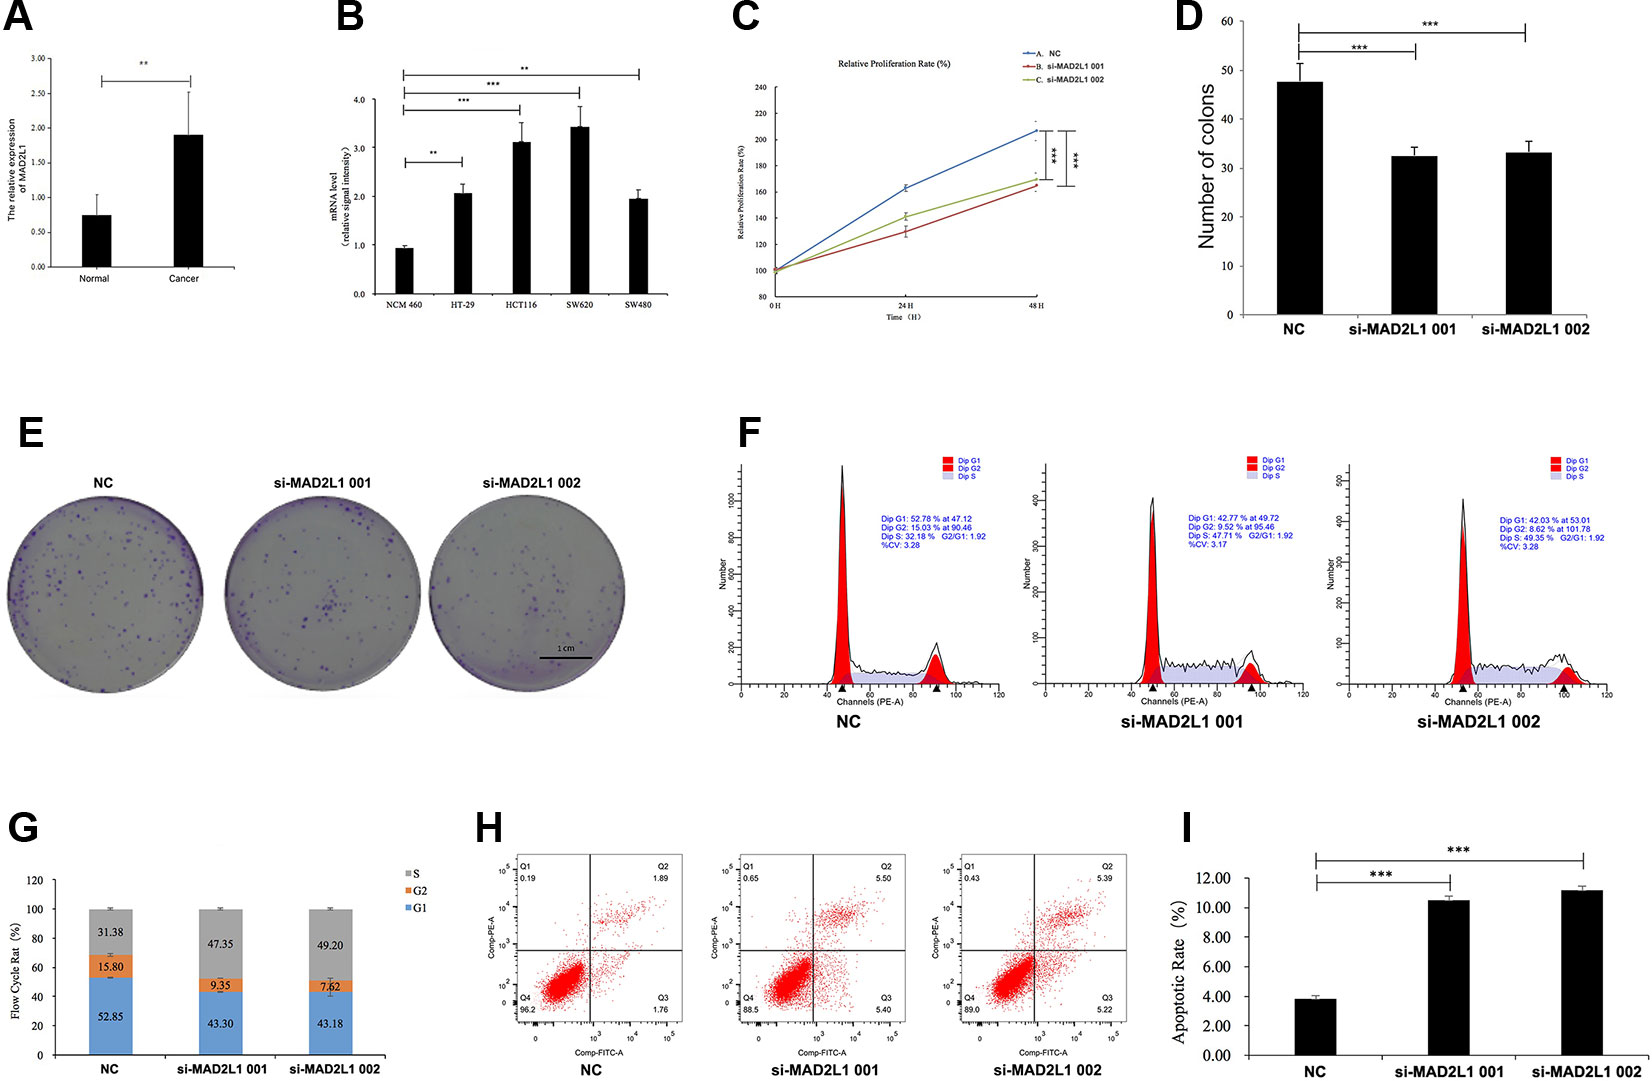
Figure 6 MAD2L1 knockdown suppressed colon cancer cell proliferation by impairing cell cycle progression and inducing apoptosis. Notes: (A) Expression level of MAD2L1 gene in 20 paired CRC tissues (n = 3; **P < 0.01; two-tailed t-test). (B) Expression level of MAD2L1 gene in colon normal cell line NCM460 and CRC cell line HT-29, HCT116, SW620 and SW480 (n = 3; **P < 0.01, ***P < 0.001; two-tailed t-test). (C) The cell proliferation rate was analyzed by CCK-8 assay. All value were mean ± SD (n = 3; ***P < 0.001; two-tailed t-test). (D), (E) Colony formation assays were performed (n = 3; ***P < 0.001; two-tailed t-test). (F, G) Distribution of cells in three cell cycle phases was examined by flow cytometry assay, and the graph shows quantification for each phase. (H) For measurement of apoptotic cells, cells were stained with both AV and PI and analyzed by an image flow assay. (I) Graph illustrating the quantification of apoptotic cells (n = 3; ***P < 0.001; two-tailed t-test). Abbreviations: AV, Annexin V FITC; CCK-8, cell counting kit-8, PI, propidium iodide; NC, negative control.
Knockdown of MAD2L1 Suppressed Cell Growth by Impairing Cell Cycle Progression and Inducing Cell Apoptosis
To determine whether MAD2L1 could be a therapeutic target in CRC, we inactivated MAD2L1 by using siRNAs in SW620 cells. We found that the MAD2L1 knockdown, compared to the control knockdown, significantly inhibited cell proliferation (Figure 6C) and reduced cell numbers of SW620 cells (Figures 6D, E), which indicated that MAD2L1 might promote cell proliferation. To examine how MAD2L1affects cell growth, the cell cycle phase distribution and apoptosis were analyzed by flow cytometric analysis. Knockdown of MAD2L1 resulted in a decrease in the percentage of cells in the G1 and G2 phases and an increase in the percentage of cells in the S phase (Figures 6F, G), which indicated that MAD2L1 knockdown prevented cell passage from the S phase into the G2 phase. Therefore, MAD2L1 was shown to promote S/G2 phase transition. The apoptosis assay results indicated that the apoptotic cells significantly increased in SW480 cells with si-MAD2L1 transfection (Figures 6H, I). These data indicate that MAD2L1 knockdown could impair cell cycle progression and induce cell apoptosis.
Discussion
Even with a gradual decline in the past few years, CRC remains the fourth leading cause of cancer-related death worldwide (Marmol et al., 2017). The occurrence and development of CRC is a dynamic process. At different stages of CRC, the expression levels of some molecules are different. (Moroishi et al., 2015) In this case, early screening and diagnosis are becoming increasingly difficult. Therefore, it is necessary to find accurate and meaningful CRC biomarkers. Our study systematically focused on expression profiles obtained from microarray studies of CRC. Our analysis included 74 CRC samples and 65 normal samples from the GSE117606 dataset of the GEO database. A total of 683 DEGs were identified, including 420 upregulated genes and 263 downregulated genes. To better explore these DEGs, we carried out GO function and KEGG pathway analysis of these DEGs.
GO analysis showed that the upregulated DEGs were particularly enriched in mitotic collagen catabolic process, extracellular matrix organization, proteinaceous extracellular matrix, extracellular region, extracellular matrix structural constituent, and extracellular matrix binding, while the downregulated DEGs were involved in bicarbonate transport, muscle contraction, extracellular exosome, extracellular space, chloride channel activity, and carbonate dehydratase activity. In addition, the KEGG pathways for the upregulated DEGs included the cell cycle, ECM-receptor interaction, and focal adhesion, while the pathways of the downregulated DEGs were mainly in mineral absorption, proximal tubule bicarbonate reclamation, and retinol metabolism.
A PPI is defined as the process by which two or more kinds of protein molecules form a protein complex by noncovalent bonding. PPI networks could provide a visible framework for a better understanding of the functional organization of the proteome (Liu et al., 2009). The enriched pathways of the top 3 modules showed that CRC was associated with the cell cycle-related pathway and the p53 signalling pathway.
Cell cycle-related genes that promote the proliferation of endothelial cells contribute to the progression of tumor growth and metastasis of CRC (Hong et al., 2009). CDK1 encodes a serine/threonine kinase that controls the eukaryotic cell cycle by regulating mitotic onset, as well as the centrosome cycle (Santamaria et al., 2007). CDK1 promotes cell proliferation via the phosphorylation and inhibition of the forkhead box O1 transcription factor (Liu et al., 2008). The alteration of CDK1 has been found in numerous cancer types, including breast cancer (Kim et al., 2008), esophageal adenocarcinoma (Hansel et al., 2005), hepatocellular carcinoma (Wu et al., 2019), pancreatic ductal adenocarcinoma (Piao et al., 2019), and oral squamous cell carcinoma (Chang et al., 2005). Iacopetta et al. revealed that p53 mutations that lose transactivation ability are more common in advanced CRC and associated with poor survival (Iacopetta et al., 2006). Slattery ML et al. suggested that the activation of p53 from cellular stress could target downstream genes that could in turn influence cell cycle arrest, apoptosis, and angiogenesis through mRNA:miRNA interactions (Slattery et al., 2018). In the p53 signaling pathway, the RRM2 gene was an oncogene that was overexpressed in colorectal cancer, with its elevated expression correlated with the invasion depth, poorly differentiated type, and tumor node metastasis stage (Lu et al., 2012).
Twenty DEGs with high connectivity were selected as hub genes for PPI network analysis. By analyzing the correlations and expression levels in GEPIA, we determined that the hub genes were obviously positively correlated and significantly overexpressed in CRC samples.
We searched the literature in PubMed for associations among the twenty hub genes in CRC. In Yanqi Gan et al.'s study, they revealed that expression of CCNA2 in CRC tissues is higher than that in normal tissues and that CCNA2 knockdown could significantly suppress CRC cell growth by impairing cell cycle progression and inducing cell apoptosis (Gan et al., 2018). TOP2A is a gene that involves copy number variations and chromosomal instability in many cancers (Simon et al., 2002; Bofin et al., 2003; Chen et al., 2015; Sonderstrup et al., 2015). In colorectal cancer, the protein expression level of TOP2A was related to aggressive tumor phenotypes and advanced tumor stages (Coss et al., 2009). In our research, we found that TOP2A expression was upregulated in colorectal cancer. The expression of PLK1 was correlated with tumor size, lymph node metastasis, depth of invasion, and TNM stage, consistent with the results from Takahashi et al. (Takahashi et al., 2003). Ding-pei Han et al.'s study revealed that PLK1 has additional functions and is involved in the proliferation, migration and invasion of colorectal cancer cells (Han et al., 2012). The spindle proteins AURKA, BUB1, and MAD2L1 are important components of the spindle assembly checkpoint (Xue et al., 2016), which has been frequently established as an important mechanism that drives aneuploidy and carcinogenesis in CRC (Chen et al., 1998; Burum-Auensen et al., 2007). Anke H, Sillars-Hardebol et al.'s study revealed TPX2 and AURKA as major players in this critical step in colorectal carcinogenesis (Sillars-Hardebol et al., 2012). RRM2 overexpression was significantly associated with invasion depth and differentiation, and clinical tissue specimens also showed that the expression levels of RRM2 may be associated with tumor stage, which was shown in Ai-Guo Lu et al.'s study (Lu et al., 2012). KIF11 is a mitotic kinesin and is required for the separation of duplicated centrosomes during spindle formation (Zhu et al., 2005). Imai T et al.'s results verified that knockdown of KIF11 by siRNA inhibits sphere formation, indicating that KIF11 is important in the activity of esophageal cancer and CRC (Imai et al., 2017). MELK was overexpressed and highly phosphorylated in colorectal adenocarcinomas, and its expression was significantly correlated with tumor stage and lymph node metastasis (Gong et al., 2018). NUSAP1 is a microtubule-binding protein that plays a vital role in the assembly of mitotic spindle (Song and Rape, 2010). NUSAP1 gene silencing induced cell apoptosis and inhibited cell proliferation, cell migration, cell invasion, and EMT in colorectal cancer by inhibiting DNMT1 gene expression (Han et al., 2018). Human replication factor C (RFC) is a multimeric protein consisting of five distinct subunits that are highly conserved through evolution (Yao and O'Donnell, 2012). Jun Xiang et al.'s results revealed that the overexpression of RFC4 commonly occurs in CRC and that a high expression level of RFC4 is associated with poor differentiation and late TNM stages in patients with CRC. Higher levels of RFC4 protein expression correlate with a worse overall survival in CRC (Xiang et al., 2014). Human pituitary tumor transforming gene-1 (PTTG1) is a novel oncogene. Ren Q et al.'s study preliminarily explored the effects of PTTG1 in colorectal cancer cell proliferation and metastasis and found that the downregulation of PTTG1 expression suppressed colorectal cancer cell proliferation, migration and invasion (Ren and Jin, 2017). Gali-Muhtasib H et al.'s study confirmed the in vivo existence of the CHEK1/p53 link in human colorectal cancer, showing that tumors lacking p53 had higher levels of CHEK1, which was accompanied by poorer apoptosis. CHEK1 overexpression was correlated with advanced tumor stages, proximal tumor localization, and worse prognosis (Gali-Muhtasib et al., 2008). Overexpression of CEP55 activates p21 and enhances the cell cycle transition. In contrast, the knockdown of CEP55 inhibits cell growth in gastric (Tao et al., 2014) and breast cancer (Wang et al., 2016). DTL is located at chromosomal region 1q32.1–32.2 and encodes a putative 730-amino-acid nuclear protein that contains six highly conserved WD40-repeat domains (Ueki et al., 2008). It has been reported that DTL plays an essential role in cell proliferation, cell cycle arrest and metastatic potential in hepatocellular carcinoma, breast cancer, gastric cancer and rhabdomyosarcoma (Pan et al., 2006; Ueki et al., 2008; Li et al., 2009; Missiaglia et al., 2009; Song et al., 2010). Baraniskin A et al.'s data identified miR-30a-5p as a tumor-suppressing miRNA in colon cancer cells, exerting its function via the modulation of DTL expression, which is frequently overexpressed in CRC (Baraniskin et al., 2012).
MAD2L1 is highly expressed in colon cancer according to biological information. Moreover, MAD2L1 has a high positive correlation, with a Pearson correlation coefficient of 0.88. Through bioinformatics analysis of GSE117606, we know that MAD2L1 is one of the 20 core genes, and that MAD2L1 plays a role in the occurrence and development of colon cancer by participating in the cell cycle pathway. In examining the expression level of MAD2L1, we found that MAD2L1 has a higher expression in the CRC clinical samples and cell lines. Afterward, by searching PubMed, we found that there were no relevant studies reporting that MAD2L1 is involved in the cell cycle pathway, so we chose MAD2L1 for the next cell experiments. We further confirmed that knockdown of MAD2L1 could significantly suppress CRC cell growth by impairing cell cycle progression and inducing cell apoptosis. MAD2L1 has the potential to be a new biomarker for diagnosis and therapy in CRC.
There is a limitation of this study that needs to be considered: the analysis of a single dataset from GEO will result in partial bias, and too few samples will not lead to new findings. However, the data set we selected contains a large number of samples, so this limitation can be compensated to a certain extent.
In summary, using the GSE117606 profile data set and multiple bioinformatics analyses, our present work identified twenty hub genes as DEGs. These DEGs are significantly enriched in several pathways that are mainly associated with the cell cycle, ECM-receptor interaction, and mineral absorption pathways in CRC, and they might play key roles in the development and progression of CRC. MAD2L1 shows higher expression levels in CRC, is involved in colon cancer cell growth and cell cycle progression, and could be used as a new biomarker since it has a significant meaning for clinical treatment.
Conclusion
In this study, using a GSE data set and multiple bioinformatics analyses, we identified twenty hub genes that were significantly enriched in the cell cycle, ECM–receptor interaction, and mineral absorption pathways in CRC. Moreover, the expression level of MAD2L1 was significantly increased in CRC, and knockdown of MAD2L1 suppressed colon cancer cell growth by impairing cell cycle and apoptosis progression. Our findings also establish that MAD2L1 could be a new biomarker for CRC diagnosis and guide combination therapy for CRC.
Data Availability Statement
Publicly available datasets were analyzed in this study. This data can be found at Gene Expression Omnibus: https://www.ncbi.nlm.nih.gov/geo/query/acc.cgi?acc=GSE117606).
Ethics Statement
The studies involving human participants were reviewed and approved by Ethics committee of Renmin Hospital of Wuhan University Renmin Hospital of Wuhan University. The patients/participants provided their written informed consent to participate in this study.
Author Contributions
XD is responsible for the design of experiments, bioinformatic analysis, collection of samples and specific experimental operations. HD is responsible for data collation and statistical analysis. HL is responsible for providing experimental funds and technical guidance.
Conflict of Interest
The authors declare that the research was conducted in the absence of any commercial or financial relationships that could be construed as a potential conflict of interest.
References
Altman, N. S. (1992). An introduction to kernel and nearest-neighbor nonparametric regression. Am. Stat. 46, 175–185. doi: 10.1080/00031305.1992.10475879
Aran, V., Victorino, A. P., Thuler, L. C., Ferreira, C. G. (2016). Colorectal cancer: epidemiology, disease mechanisms and interventions to reduce onset and mortality. Clin. Colorectal Cancer 15, 195–203. doi: 10.1016/j.clcc.2016.02.008
Baraniskin, A., Birkenkamp-Demtroder, K., Maghnouj, A., Zollner, H., Munding, J., Klein-Scory, S., et al. (2012). MiR-30a-5p suppresses tumor growth in colon carcinoma by targeting DTL. Carcinogenesis 33, 732–739. doi: 10.1093/carcin/bgs020
Bofin, A. M., Ytterhus, B., Hagmar, B. M. (2003). TOP2A and HER-2 gene amplification in fine needle aspirates from breast carcinomas. Cytopathology 14, 314–319. doi: 10.1046/j.0956-5507.2003.00088.x
Bolstad, B. M., Irizarry, R. A., Astrand, M., Speed, T. P. (2003). A comparison of normalization methods for high density oligonucleotide array data based on variance and bias. Bioinformatics 19, 185–193. doi: 10.1093/bioinformatics/19.2.185
Burum-Auensen, E., Deangelis, P. M., Schjolberg, A. R., Roislien, J., Andersen, S. N., Clausen, O. P., et al. (2007). Spindle proteins Aurora A and BUB1B, but not Mad2, are aberrantly expressed in dysplastic mucosa of patients with longstanding ulcerative colitis. J. Clin. Pathol. 60, 1403–1408. doi: 10.1136/jcp.2006.044305
Chang, J. T., Wang, H. M., Chang, K. W., Chen, W. H., Wen, M. C. (2005). Identification of differentially expressed genes in oral squamous cell carcinoma (OSCC): overexpression of NPM, CDK1 and NDRG1 and underexpression of CHES1. Int. J. Cancer 114, 942–949. doi: 10.1002/ijc.20663
Chen, R. H., Shevchenko, A., Mann, M., Murray, A. W. (1998). Spindle checkpoint protein Xmad1 recruits Xmad2 to unattached kinetochores. J. Cell Biol. 143, 283–295. doi: 10.1083/jcb.143.2.283
Chen, T., Sun, Y., Ji, P., Kopetz, S., Zhang, W. (2015). Topoisomerase IIalpha in chromosome instability and personalized cancer therapy. Oncogene 34, 4019–4031. doi: 10.1038/onc.2014.332
Chen, L., Yuan, L., Wang, Y., Wang, G., Zhu, Y., Cao, R., et al. (2017). Co-expression network analysis identified FCER1G in association with progression and prognosis in human clear cell renal cell carcinoma. Int. J. Biol. Sci. 13, 1361–1372. doi: 10.7150/ijbs.21657
Coss, A., Tosetto, M., Fox, E. J., Sapetto-Rebow, B., Gorman, S., Kennedy, B. N., et al. (2009). Increased topoisomerase IIalpha expression in colorectal cancer is associated with advanced disease and chemotherapeutic resistance via inhibition of apoptosis. Cancer Lett. 276, 228–238. doi: 10.1016/j.canlet.2008.11.018
Ferlay, J., Soerjomataram, I., Dikshit, R., Eser, S., Mathers, C., Rebelo, M., et al. (2015). Cancer incidence and mortality worldwide: sources, methods and major patterns in GLOBOCAN 2012. Int. J. Cancer 136, E359–E386. doi: 10.1002/ijc.29210
Galili, T., O'Callaghan, A., Sidi, J., Sievert, C. (2018). heatmaply: an R package for creating interactive cluster heatmaps for online publishing. Bioinformatics 34, 1600–1602. doi: 10.1093/bioinformatics/btx657
Gali-Muhtasib, H., Kuester, D., Mawrin, C., Bajbouj, K., Diestel, A., Ocker, M., et al. (2008). Thymoquinone triggers inactivation of the stress response pathway sensor CHEK1 and contributes to apoptosis in colorectal cancer cells. Cancer Res. 68, 5609–5618. doi: 10.1158/0008-5472.CAN-08-0884
Gan, Y., Li, Y., Li, T., Shu, G., Yin, G. (2018). CCNA2 acts as a novel biomarker in regulating the growth and apoptosis of colorectal cancer. Cancer Manag. Res. 10, 5113–5124. doi: 10.2147/CMAR.S176833
Gaudet, P., Skunca, N., Hu, J. C., Dessi (2017). Primer on the gene ontology. Methods Mol. Biol. 1446, 25–37. doi: 10.1007/978-1-4939-3743-1_3
Gong, X., Chen, Z., Han, Q., Chen, C., Jing, L., Liu, Y., et al. (2018). Sanguinarine triggers intrinsic apoptosis to suppress colorectal cancer growth through disassociation between STRAP and MELK. BMC Cancer 18, 578. doi: 10.1186/s12885-018-4463-x
Han, D. P., Zhu, Q. L., Cui, J. T., Wang, P. X., Qu, S., Cao, Q. F., et al. (2012). Polo-like kinase 1 is overexpressed in colorectal cancer and participates in the migration and invasion of colorectal cancer cells. Med. Sci. Monit. 18, BR237–BR246. doi: 10.12659/MSM.882900
Han, G., Wei, Z., Cui, H., Zhang, W., Wei, X., Lu, Z., et al. (2018). NUSAP1 gene silencing inhibits cell proliferation, migration and invasion through inhibiting DNMT1 gene expression in human colorectal cancer. Exp. Cell Res. 367, 216–221. doi: 10.1016/j.yexcr.2018.03.039
Hansel, D. E., Dhara, S., Huang, R. C., Ashfaq, R., Deasel, M., Shimada, Y., et al. (2005). CDC2/CDK1 expression in esophageal adenocarcinoma and precursor lesions serves as a diagnostic and cancer progression marker and potential novel drug target. Am. J. Surg. Pathol. 29, 390–399. doi: 10.1097/00000478-200503000-00014
Hong, B. S., Cho, J. H., Kim, H., Choi, E. J., Rho, S., Kim, J., et al. (2009). Colorectal cancer cell-derived microvesicles are enriched in cell cycle-related mRNAs that promote proliferation of endothelial cells. BMC Genomics 10, 556. doi: 10.1186/1471-2164-10-556
Huang, D. W., Sherman, B. T., Tan, Q., Collins, J. R., Alvord, W. G., Roayaei, J., et al. (2007). The DAVID Gene Functional Classification Tool: a novel biological module-centric algorithm to functionally analyze large gene lists. Genome Biol. 8, R183. doi: 10.1186/gb-2007-8-9-r183
Iacopetta, B., Russo, A., Bazan, V., Dardanoni, G., Gebbia, N., Soussi, T., et al. (2006). Functional categories of TP53 mutation in colorectal cancer: results of an International Collaborative Study. Ann. Oncol. 17, 842–847. doi: 10.1093/annonc/mdl035
Imai, T., Oue, N., Sentani, K., Sakamoto, N., Uraoka, N., Egi, H., et al. (2017). KIF11 is required for spheroid formation by oesophageal and colorectal cancer cells. Anticancer Res. 37, 47–55. doi: 10.21873/anticanres.11287
Kanehisa, M.(2002)The KEGG database, in: Novartis Found Symp. 247. pp. 91–101, discussion 101-3, 119-28, 244-52.
Kim, S. J., Nakayama, S., Miyoshi, Y., Taguchi, T., Tamaki, Y., Matsushima, T., et al. (2008). Determination of the specific activity of CDK1 and CDK2 as a novel prognostic indicator for early breast cancer. Ann. Oncol. 19, 68–72. doi: 10.1093/annonc/mdm358
Li, J., Ng, E. K., Ng, Y. P., Wong, C. Y., Yu, J., Jin, H., et al. (2009). Identification of retinoic acid-regulated nuclear matrix-associated protein as a novel regulator of gastric cancer. Br. J. Cancer 101, 691–698. doi: 10.1038/sj.bjc.6605202
Li, X. (1991). An aggregate function method for nonlinear programming. Sci. In China (A), 1467–1473.
Liu, P., Kao, T. P., Huang, H. (2008). CDK1 promotes cell proliferation and survival via phosphorylation and inhibition of FOXO1 transcription factor. Oncogene 27, 4733–4744. doi: 10.1038/onc.2008.104
Liu, G., Wong, L., Chua, H. N. (2009). Complex discovery from weighted PPI networks. Bioinformatics 25, 1891–1897. doi: 10.1093/bioinformatics/btp311
Liu, M., Xu, Z., Du, Z., Wu, B., Jin, T., Xu, K., et al. (2017). The identification of key genes and pathways in glioma by bioinformatics analysis. J. Immunol. Res. 2017, 1278081. doi: 10.1155/2017/1278081
Lu, A. G., Feng, H., Wang, P. X., Han, D. P., Chen, X. H., Zheng, M. H., et al. (2012). Emerging roles of the ribonucleotide reductase M2 in colorectal cancer and ultraviolet-induced DNA damage repair. World J. Gastroenterol. 18, 4704–4713. doi: 10.3748/wjg.v18.i34.4704
Marmol, I., Sanchez-de-Diego, C., Pradilla Dieste, A., Cerrada, E., Rodriguez Yoldi, M. J. (2017). Colorectal carcinoma: a general overview and future perspectives in colorectal cancer. Int. J. Mol. Sci. 18. doi: 10.3390/ijms18010197
Missiaglia, E., Selfe, J., Hamdi, M., Williamson, D., Schaaf, G., Fang, C., et al. (2009). Genomic imbalances in rhabdomyosarcoma cell lines affect expression of genes frequently altered in primary tumors: an approach to identify candidate genes involved in tumor development. Genes Chromosomes Cancer 48, 455–467. doi: 10.1002/gcc.20655
Moroishi, T., Hansen, C. G., Guan, K. L. (2015). The emerging roles of YAP and TAZ in cancer. Nat. Rev. Cancer 15, 73–79. doi: 10.1038/nrc3876
Pan, H. W., Chou, H. Y., Liu, S. H., Peng, S. Y., Liu, C. L., Hsu, H. C., et al. (2006). Role of L2DTL, cell cycle-regulated nuclear and centrosome protein, in aggressive hepatocellular carcinoma. Cell Cycle 5, 2676–2687. doi: 10.4161/cc.5.22.3500
Piao, J., Zhu, L., Sun, J., Li, N., Dong, B., Yang, Y., et al. (2019). High expression of CDK1 and BUB1 predicts poor prognosis of pancreatic ductal adenocarcinoma. Gene 701, 15–22. doi: 10.1016/j.gene.2019.02.081
Ren, Q., Jin, B. (2017). The clinical value and biological function of PTTG1 in colorectal cancer. BioMed. Pharmacother. 89, 108–115. doi: 10.1016/j.biopha.2017.01.115
Ritchie, M. E., Phipson, B., Wu, D., Hu, Y., Law, C. W., Shi, W., et al. (2015). limma powers differential expression analyses for RNA-sequencing and microarray studies. Nucleic Acids Res. 43, e47. doi: 10.1093/nar/gkv007
Santamaria, D., Barriere, C., Cerqueira, A., Hunt, S., Tardy, C., Newton, K., et al. (2007). Cdk1 is sufficient to drive the mammalian cell cycle. Nature 448, 811–815. doi: 10.1038/nature06046
Sillars-Hardebol, A. H., Carvalho, B., Tijssen, M., Belien, J. A., de Wit, M., Delis-van Diemen, P. M., et al. (2012). TPX2 and AURKA promote 20q amplicon-driven colorectal adenoma to carcinoma progression. Gut 61, 1568–1575. doi: 10.1136/gutjnl-2011-301153
Simon, R., Atefy, R., Wagner, U., Forster, T., Fijan, A., Bruderer, J., et al. (2002). HER-2 and TOP2A gene amplification in urinary bladder cancer. Verh. Dtsch. Ges. Pathol. 86, 176–183.
Slattery, M. L., Mullany, L. E., Wolff, R. K., Sakoda, L. C., Samowitz, W. S., Herrick, J. S., et al. (2018). The p53-signaling pathway and colorectal cancer: interactions between downstream p53 target genes and miRNAs. Genomics 111 (4), 762–771. doi: 10.1016/j.ygeno.2018.05.006
Sonderstrup, I. M., Nygard, S. B., Poulsen, T. S., Linnemann, D., Stenvang, J., Nielsen, H. J., et al. (2015). Topoisomerase-1 and -2A gene copy numbers are elevated in mismatch repair-proficient colorectal cancers. Mol. Oncol. 9, 1207–1217. doi: 10.1016/j.molonc.2015.02.009
Song, L., Rape, M., Lu, A. G., Feng, H., Wang, P. X., Han, D. P., Chen, X. H., et al (2010). Regulated degradation of spindle assembly factors by the anaphase-promoting complex. Mol. Cell 38, 369–382. doi: 10.1016/j.molcel.2010.02.038
Song, B., Wang, Y., Titmus, M. A., et al. (2010). Molecular mechanism of chemoresistance by miR-215 in osteosarcoma and colon cancer cells. Mol. Cancer 9, 96. doi: 10.1186/1476-4598-9-96
Sun, C., Yuan, Q., Wu, D., Meng, X., Wang, B. (2017). Identification of core genes and outcome in gastric cancer using bioinformatics analysis. Oncotarget 8, 70271–70280. doi: 10.18632/oncotarget.20082
Szklarczyk, D., Franceschini, A., Wyder, S., Forslund, K., Heller, D., Huerta-Cepas, J., et al. (2015). STRING v10: protein-protein interaction networks, integrated over the tree of life. Nucleic Acids Res. 43, D447–D452. doi: 10.1093/nar/gku1003
Takahashi, T., Sano, B., Nagata, T., Kato, H., Sugiyama, Y., Kunieda, K., et al. (2003). Polo-like kinase 1 (PLK1) is overexpressed in primary colorectal cancers. Cancer Sci. 94, 148–152. doi: 10.1111/j.1349-7006.2003.tb01411.x
Tang, Z., Li, C., Kang, B., Gao, G., Li, C., Zhang, Z., et al. (2017). GEPIA: a web server for cancer and normal gene expression profiling and interactive analyses. Nucleic Acids Res. 45, W98–W102. doi: 10.1093/nar/gkx247
Tao, J., Zhi, X., Tian, Y., Li, Z., Zhu, Y., Wang, W., et al. (2014). CEP55 contributes to human gastric carcinoma by regulating cell proliferation. Tumour Biol. 35, 4389–4399. doi: 10.1007/s13277-013-1578-1
Ueki, T., Nishidate, T., Park, J. H., Lin, M. L., Shimo, A., Hirata, K., et al. (2008). Involvement of elevated expression of multiple cell-cycle regulator, DTL/RAMP (denticleless/RA-regulated nuclear matrix associated protein), in the growth of breast cancer cells. Oncogene 27, 5672–5683. doi: 10.1038/onc.2008.186
Uhlen, M., Zhang, C., Lee, S., Sjostedt, E., Fagerberg, L., Bidkhori, G., et al. (2017). A pathology atlas of the human cancer transcriptome. Science 357. doi: 10.1126/science.aan2507
Wang, Y., Jin, T., Dai, X., Xu, J. (2016). Lentivirus-mediated knockdown of CEP55 suppresses cell proliferation of breast cancer cells. Biosci. Trends 10, 67–73. doi: 10.5582/bst.2016.01010
Wu, M., Liu, Z., Li, X., Zhang, A., Lin, D., Li, N., et al. (2019). Analysis of potential key genes in very early hepatocellular carcinoma. World J. Surg. Oncol. 17, 77. doi: 10.1186/s12957-019-1616-6
Xiang, J., Fang, L., Luo, Y., Yang, Z., Liao, Y., Cui, J., et al. (2014). Levels of human replication factor C4, a clamp loader, correlate with tumor progression and predict the prognosis for colorectal cancer. J. Transl. Med. 12, 320. doi: 10.1186/s12967-014-0320-0
Xue, X., Ramakrishnan, S. K., Weisz, K., Triner, D., Xie, L., Attili, D., et al. (2016). Iron uptake via DMT1 integrates cell cycle with JAK-stat3 signaling to promote colorectal tumorigenesis. Cell Metab. 24, 447–461. doi: 10.1016/j.cmet.2016.07.015
Yao, N. Y., O'Donnell, M. (2012). The RFC clamp loader: structure and function. Subcell Biochem. 62, 259–279. doi: 10.1007/978-94-007-4572-8_14
Keywords: MAD2L1, colorectal cancer, bioinformatics analysis, proliferation, cell cycle, apoptosis
Citation: Ding X, Duan H and Luo H (2020) Identification of Core Gene Expression Signature and Key Pathways in Colorectal Cancer. Front. Genet. 11:45. doi: 10.3389/fgene.2020.00045
Received: 17 October 2019; Accepted: 15 January 2020;
Published: 21 February 2020.
Edited by:
Xiangqian Guo, Henan University, ChinaReviewed by:
Xian Shen, Second Affiliated Hospital and Yuying Children's Hospital of Wenzhou Medical University, ChinaCarmelo Laudanna, Institute for Research in Biomedicine, Spain
Copyright © 2020 Ding, Duan and Luo. This is an open-access article distributed under the terms of the Creative Commons Attribution License (CC BY). The use, distribution or reproduction in other forums is permitted, provided the original author(s) and the copyright owner(s) are credited and that the original publication in this journal is cited, in accordance with accepted academic practice. No use, distribution or reproduction is permitted which does not comply with these terms.
*Correspondence: Hesheng Luo, eGhua0AxNjMuY29t