 Xiaolin Liu1,2†
 Wencai Yang2†
 Jing Wang1Mengxia Yang1
 Kai Wei1Xiaoyan Liu1Zhengkun Qiu3Tong van Giang1‡Xiaoxuan Wang1Yanmei Guo1Junming Li1
 Lei Liu1Jinshuai Shu1Yongchen Du1*
 Zejun Huang1*
- 1Key Laboratory of Biology and Genetic Improvement of Horticultural Crops of the Ministry of Agriculture, Institute of Vegetables and Flowers, Chinese Academy of Agricultural Sciences, Beijing, China
- 2Department of Vegetable Science, College of Horticulture, China Agricultural University, Beijing, China
- 3Key Laboratory of Horticultural Crop Biology and Germplasm Innovation in South China, Ministry of Agriculture, College of Horticulture, South China Agricultural University, Guangzhou, China
Plant height is an important agronomic trait in crops. Several genes underlying tomato (Solanum lycopersicum) plant height mutants have been cloned. However, few quantitative trait genes for plant height have been identified in tomato. In this study, seven quantitative trait loci (QTLs) controlling plant height were identified in tomato. Of which, qtph1.1 (QTL for tomato plant height 1.1), qtph3.1 and qtph12.1 were major QTLs and explained 15, 16, and 12% of phenotypic variation (R2), respectively. The qtph1.1 was further mapped to an 18.9-kb interval on chromosome 1. Based on the annotated tomato genome (version SL2.50, annotation ITAG2.40), Solyc01g098390 encoding GA receptor SlGID1a was the putative candidate gene. The SlGID1a gene underlying the qtph1.1 locus contained a single nucleotide polymorphism (SNP) that resulted in an amino acid alteration in protein sequence. The near-isogenic line containing the qtph1.1 locus (NIL-qtph1.1) exhibited shorter internode length and cell length than the wild type (NIL-WT). The dwarf phenotype of NIL-qtph1.1 could not be rescued by exogenous GA3 treatment. Transcriptome analysis and real-time quantitative reverse transcription PCR (qPCR) showed that several genes related to biosynthesis and signaling of GA and auxin were differentially expressed in stems between NIL-qtph1.1 and NIL-WT. These findings might pave the road for understanding the molecular regulation mechanism of tomato plant height.
Introduction
Plant height is an important agronomic trait in crops. It can affect crop architecture, crowding tolerance, water and fertilizer management, and mechanical harvesting, which in turn affect economic benefits and yield of crops. The success of the “green revolution” in the 1960s is mainly due to the introduction of high-yielding semi-dwarf varieties of wheat and rice combining with the application of agricultural mechanization, irrigation and agrochemical/fertilizer. Plant height is controlled by many genes, of which most are related to biosynthesis or signaling of plant hormones, such as auxin, brassinosteroids (BRs), gibberellins (GAs), and strigolactones (SLs) (Sakamoto and Matsuoka, 2004; Salas Fernandez et al., 2009; Liu et al., 2018).
Tomato (Solanum lycopersicum) is one of the most important vegetable crops worldwide. Processing tomatoes are cultivated in open fields and are adapted for farm machinery throughout nearly the whole process of production. However, fresh-market tomatoes are usually grown on stakes or with strings in open fields or in protected agricultural areas (greenhouse, shade-house, and tunnel), requiring intensive labor for harvesting, staking, and tying. The compact growth habit (CGH) tomato with a lower plant height is an ideal fresh-market tomato architecture for mechanical harvest and reduces manual dependence (Frasca et al., 2014; Lee et al., 2018).
Tomato plant height is mainly determined by the number and length of internodes. Several mutants related to plant height have been reported and some genes responsible for the phenotypes have been cloned in tomato. Mutants self-pruning (sp) (MacArthur, 1932), semideterminate (sdt) (Elkind et al., 1991), and suppressor of sp (ssp) (Park et al., 2014) affect the number of internodes, while mutants brachytic (br) (Lee et al., 2018), dwarf (d) (Bishop et al., 1996), Elongated Internode (EI) (Sun et al., 2019), gibberellin deficient-1 (gib-1), gib-2, gib-3 (Koornneef et al., 1990), procera (pro) (Jupe et al., 1988), short internode (si) (Kwon et al., 2020), and tomato internode elongated -1 (tie-1) (Schrager-Lavelle et al., 2019) affect internode length. The sp mutant shows determinate growth habit. Its sympodial units are terminated by inflorescences with average one to two vegetative nodes between inflorescences. While, indeterminate plants (wild type, WT) can continuously produce inflorescences that are separated by three vegetative nodes (MacArthur, 1932; Pnueli et al., 1998). Semideterminate plants exhibit sympodial units that are also terminated by inflorescences. However, they produce more inflorescences on the main stem than determinate plants, and their inflorescences are usually separated by two vegetative nodes (Elkind et al., 1991). SP gene is the ortholog of CENTRORADIALIS (CEN) from Antirrhinum and TERMINAL FLOWER 1 (TFL1) from Arabidopsis (Pnueli et al., 1998), which belongs to the CETS (CENTRORADIALIS/TERMINAL FLOWER 1/SELF-PRUNING) gene family (McGarry and Ayre, 2012). Several members of CETS gene family in tomato are also related to plant growth habits. For example, Solanum pennellii allele of SP5G or SP9D combined with sp results in semideterminate growth (Fridman et al., 2002; Carmel-Goren et al., 2003; Jones et al., 2007). However, CR-sp5g sp double mutant exhibits more compactness than sp mutant (Soyk et al., 2017). The phenotype of sp plants can also be restored by mutation in the genes that are not members of the CETS gene family. For example, double mutant ssp-610 sp or ssp-2129 sp exhibits usually two vegetative nodes between inflorescences. Mutants ssp-610 and ssp-2129 both contain mutations in SP-interacting G-BOX (SPGB) gene (Park et al., 2014). Regardless of the growth habits, internode length can also affect plant height. The d locus reduces internode length and makes plants shorter. The D gene encodes a P450 that is involved in brassinolide synthesis (Bishop et al., 1996, 1999; Marti et al., 2006). EI and tie-1 exhibit elongated internode. Both of them result from the loss function of the GA 2-beta-dioxygenase 7 (SlGA2ox7) gene, which converts bioactive GAs to inactive GAs (Schrager-Lavelle et al., 2019; Sun et al., 2019). The pro mutant displays higher plant height than the wild type (WT), which is similar to the phenotype of the WT treated with exogenous GA. The PRO gene encodes a SlDELLA protein that is a negative regulator in GA signaling (Bassel et al., 2008). A mild hypomorphic allele of the SlDELLA gene, the pro-2 mutant, is intermediate in plant height between the WT and pro mutant. The pro-2 mutant produces more fruit than the WT and pro mutant, but most fruits are smaller and seedless (Shinozaki et al., 2018). The si mutant displays shortened internodes and flower/fruit stems. It contains a mutation in a gene homolog to Arabidopsis ERECTA (ER) (Kwon et al., 2020). The br locus can reduce plant height and has been narrowed down to an interval of 763.1 kb on chromosome 1 (Lee et al., 2018), but the gene has not been cloned.
Several quantitative trait loci (QTLs) for plant height have also been identified. deVicente and Tanksley (1993) identified 9 QTLs controlling plant height by using a population developed from the cross between cultivated tomato Vendor TM2a and Solanum pennellii LA716. They are ht1, ht3, ht5a, ht5b, ht6, ht7, ht9, ht10, and ht11. Grandillo and Tanksley (1996) identified a major-effect QTL controlling plant height on chromosome 2. Paran et al. (1997) identified several loci controlling plant height on chromosomes 2, 3, 4, 6, and 7. Prudent et al. (2009) discovered several loci related to plant height on chromosomes 3, 4, 9, 11, and 12. Zhou et al. (2016) found three QTLs related to plant height: h4t2a, h4t3a, and h4t7a. However, the plant height QTL has not been fine mapped in tomato, which limits the understanding of molecular mechanisms of tomato plant height regulation.
In this study, seven QTLs controlling tomato plant height were identified. qtph1.1 (QTL for tomato plant height 1.1) was a major-effect QTL. It was further narrowed down to an interval of 18.9-kb on chromosome 1, and GA receptor gene SlGID1a was identified as the putative candidate gene. The SlGID1a gene underlying the qtph1.1 locus contained a single nucleotide polymorphism (SNP) that resulted in an amino acid alteration in the protein sequence, and the near-isogenic line containing the qtph1.1 locus (NIL-qtph1.1) reduced the effect of exogenous GA3 on plant height. Transcriptome analysis and real-time quantitative reverse transcription PCR (qPCR) showed that several genes, which are related to biosynthesis and signaling of GA and auxin, were differentially expressed between NIL-qtph1.1 and NIL-WT. These findings may facilitate understanding the genetic basis and the molecular regulation mechanism of tomato plant height.
Materials and Methods
Plant Materials
SG-7 is a fresh-market tomato inbred line developed by our group. Seeds of cherry tomato LA1218 [accession number, syn. TS-165 (Lin et al., 2014)] were obtained from the Tomato Genetics Resource Center (TGRC, Davis, CA, United States). Both SG-7 and TS-165 have an indeterminate growth habit. Two hundred ninety-nine F2 plants derived from a cross between SG-7 and TS-165 were grown in soil in a glass greenhouse under natural day-length conditions and managed routinely in Haidian District, Beijing, China, in the spring and summer of 2015. The recombinants, heterozygous plants and progeny test populations for fine-mapping of the qtph1.1 locus were grown in soil in a plastic greenhouse under natural day-length conditions and managed routinely in Shunyi District, Beijing, China, from 2016 to 2018. Plant height, defined as the height of the fourth truss in this study, was measured according to the method described in a previous study (Zhou et al., 2016). The near-isogenic lines NIL-WT (its SlGID1a gene was homologous for SG-7 allele) and NIL-qtph1.1 (its SlGID1a gene was homologous for TS-165 allele) for GA3 treatment experiment were grown in pots containing the mixed peat-vermiculite (1:1, v/v) substrate in a glass greenhouse under natural day-length conditions and standard water and fertilizer regimes in Haidian District, Beijing, China, during the winter of 2018. The pedigrees of the materials used in this study were displayed in Supplementary Figure S1.
Molecular Marker Development
Tomato lines SG-7 and TS-165 were re-sequenced on an Illumina Hiseq 2500 PE150 platform (Illumina, San Diego, CA, United States) with 11 × genome coverage. The paired-end reads were aligned to the tomato reference genome (version SL2.50) using BWA version 0.7.17 (BWA-MEM algorithm) (Li, 2013), and sorted and indexed using SAMtools version 1.6 (Li et al., 2009). The variants were called with the Genome Analysis ToolKit version 4.0.4.0 (McKenna et al., 2010). The insertion and deletion (InDel) markers were designed using the Primer-BLAST tool available through the National Center for Biotechnology Information (NCBI1). The cleaved amplified polymorphic sequence (CAPS) and derived CAPS (dCAPS) markers were designed using dCAPS Finder 2.0 (Neff et al., 2002). General information regarding the DNA markers used in this study was given in Supplementary Table S1.
QTL Mapping
The QTL-seq approach was applied to identify loci controlling tomato plant height (Takagi et al., 2013). From 299 individuals in the F2 population, two pools comprising 25 plants/pool were generated. Pools PHH and PHS consisted of pooled DNA from plants featuring the tallest and shortest plant height, respectively. The two pools were re-sequenced on an Illumina Hiseq 2500 PE150 platform (Illumina, San Diego, CA, United States) with 11 × genome coverage. Using the SNPs of line SG-7 as a reference, an SNP-index was calculated for each SNP for each pool. Sliding window analysis was applied to calculate the average SNP-index across the genome with a 1 Mb window size and 10 kb step increment (Illa-Berenguer et al., 2015). Δ(SNP-index) was calculated by the SNP-index (PHH) subtracted by the SNP-index (PHS). The threshold line for the | Δ(SNP-index)| plot was set at 0.3 (Takagi et al., 2013) to identify candidate QTLs for tomato plant height.
InDel markers in the region of the candidate QTLs were used to genotype the whole F2 population. One-way analysis of variance (ANOVA) was used to test the significant association between markers and plant height. The degree of dominance or gene action was calculated as the d/a ratio, where d = Aa - (AA + aa)/2 and a = (AA - aa)/2, where AA was the mean value for the homozygous SG-7 allele, aa was the mean value for the homozygous TS-165 allele, and Aa was the mean heterozygous value. The percentage of phenotypic variation explained by each QTL (R2) was estimated using multiple-regression analysis, using as explanatory variables the most significant markers for each QTL (Illa-Berenguer et al., 2015).
Recombinant Plant Selection and Progeny Test
Five recombinants (15N63-23, 15N63-49, 15N63-197, 15N63-277, 15N63-339), whose crossover sites were around the marker HP3809 on chromosome 1 and the intervals for qtph3.1 and qtph12.1 were homozygous, were selected from the F2 population to perform progeny tests in the spring of 2016. For the progeny test of each recombinant, 94 offspring seedlings were genotyped usually using two markers in the heterozygous region around the qtph1.1 locus of their parent. A set of homozygous plants carrying the SG-7 allele (score 1) or the TS-165 allele (score 3) were selected to grow in the greenhouse and evaluate the plant height. At the same time, several recombinants and heterozygous plants (if no recombinants were found) detected from these offspring seedlings were selected to grow in the greenhouse and selfed for next generation progeny test. This strategy was used from F3 generation to F7 generation. Furthermore, lots of offspring seedlings were only used to get more recombinants. For fine-mapping of the qtph1.1 locus, a total of 4,192 seedlings were genotyped from F3 generation to F7 generation. The pedigrees of the recombinants, heterozygous plants, and progeny test populations used in this study were exhibited in Supplementary Figure S1.
Sequence Polymorphism Analysis
The genomic DNA fragments of the qtph1.1 locus in SG-7 and TS-165 were obtained by overlapping PCR amplification using 2 × Taq PCR mix (Cat. No. M7122, Promega, Fitchburg, WI, United States) and sequencing the PCR products using specific primers (Supplementary Table S1). The amplified fragments were sequenced at the Beijing Genomics Institute (Beijing, China). The SlGID1a cDNAs of SG-7 and TS-165 were obtained by reverse-transcription PCR (RT-PCR) using Phusion High-Fidelity DNA polymerase (Cat. No. M0530L, New England Biolabs, Ipswich, MA, United States) with specific primers (Supplementary Table S1). The amplified fragments were cloned using the pEASY-Blunt Zero Cloning Kit (Cat. No. CB501-2, TransGen Biotech, Beijing, China). The cDNA clones were sequenced at the Beijing Genomics Institute (Beijing, China). Nucleotide sequence polymorphisms were identified by using BLASTn in the NCBI and multiple protein sequences were aligned by using Clustal X version 2.0 (Larkin et al., 2007) with default settings.
Exogenous GA3 Treatment
The seeds of NIL-WT and NIL-qtph1.1 were germinated on the filter paper moistened with deionized water in culture plates and were sown in plastic pots (one seed per pot) containing the mixed peat-vermiculite (1:1, v/v) substrate in a glasshouse under natural day-length conditions and standard water and fertilizer regimes in Haidian District, Beijing, China, in the winter of 2018. One hundred twenty pots were placed in the greenhouse evenly and made sure that they would not significantly impede each other’s growth. The positions of all the pots were changed every other day to reduce the influence of environmental factors on plant growth. After 4 weeks, the tomato plants were measured to determine the height and were then treated by spraying to runoff with 50 μM GA3 (Cat. No. G7645; Sigma, St Louis, MO, United States). The GA3 treatment was performed once every 2 days for a total of 10 times. The GA3 stock solution consisted of 50 mM GA3 and 70% ethanol used as the solvent. One milliliter GA3 stock solution was added into water to make the GA3 working solution with a final concentration of 50 μM GA3. For the control solution, 1 mL 70% ethanol was added to 999 mL water to achieve the equivalent amount of ethanol with working solution (Tomlinson et al., 2018). The tomato plants were divided into four groups: NIL-WT-GA3, NIL-qtph1.1-GA3, NIL-WT-Control, and NIL-qtph1.1-Control. Each group had 30 plants. During the GA3 treatment, we changed the positions of all plants in each group every 2 days, and changed the positions of four different groups every 4 days. After the third GA3 treatment, the sixth internodes of 15 plants per group were collected for RNA extraction. Two days after the last GA3 treatment on the remaining plants, the plant architecture parameters were measured and all of the plants were photographed using a camera (Canon EOS 70D, Canon Inc., Japan).
Measurement of Plant Architecture Parameters
To compare the differences in plant morphology among the four groups, plant height (here it means the distance from the base of the plant to the top of the main stem) and internode length were measured. The plant height was measured during the period of GA3 treatment every 2 days, and the length of internodes was measured when the GA3 treatment was finished. For numbering of internodes, from the cotyledon to the first true leaf was designated as the first internode. A total of 12 internodes length were measured in this study. For all indexes of the tomato plants, at least 14 plants of each group were recorded.
Histological Analysis of Stem Cells
The longitudinal sections of the eighth internodes were obtained using a free-hand method. The internodes were cut by a razor blade into approximately 1-mm-thick sections. The sections were put on glass slides and stained with 0.1% toluidine blue (w/v, dissolved in 1 × PBS solution, pH: 7.2-7.4; Cat. No. 89640; Sigma, St Louis, MO, United States). The stained sections were observed under a stereomicroscope (Carl Zeiss MicroImaging GmbH, Göttingen, Germany) and photographed. For each group, five sections from five different seedings were selected for further measuring the cell length. At least two hundred and forty-two cell’s lengths were measured from each section using Image version 1.52a (Collins, 2018).
RNA Extraction
The sixth internodes were collected from plants of four groups after the third GA3 treatment. Each group comprised three biological replications, and each replication contained samples from five plants. A total of 12 samples were immediately frozen in liquid nitrogen and then stored at −80°C until RNA extraction. Total RNA was isolated using the Quick RNA Isolation Kit (Cat. No. BC1803, Huayueyang Biotech Co., Ltd., Beijing, China) according to the manufacturer’s instructions.
RNA-Seq and Analysis of the Differentially Expressed Genes (DEGs)
Twelve libraries were constructed using the TruSeq RNA Library Prep Kit (Illumina Inc.) and sequenced on an Illumina platform by Beijing Nuohe Zhiyuan Company. DEGs were analyzed using edgeR (version 3.8.6) with the exact test method described by Lamarre et al. (2018). The versions of tomato reference genome and annotation database were SL2.50 and ITAG release 2.40 respectively. The criterion for DEGs was a false discovery rate (FDR) <0.05. The RNA-seq data have been deposited in the Genome Sequence Archive in BIG Data Center (Beijing Institute of Genomics, Chinese Academy of Sciences) under the accession number PRJCA002406.
cDNA Synthesis and qPCR Analysis
cDNA was synthesized from 2 μg total RNA using GoScriptTM Reverse Transcriptase (Cat. No. A5003; Promega, Madison, WI, United States). The qPCR reactions were conducted using the GoScriptTM qPCR Master Mix (Cat. No. A6002; Promega, Madison, WI, United States) and the LightCycler 480 Detection System (Roche Diagnostics GmbH, Mannheim, Germany). The primers for qPCR were provided in Supplementary Table S1. qPCR and data analysis were performed using methods previously described (Cao et al., 2017). The tomato housekeeping gene SlCAC (Solyc08g006960) was used as an internal control (Exposito-Rodriguez et al., 2008). All qPCR analyses were conducted with three biological replications and three technical replications. The 2–ΔCT method was used to calculate relative gene expression (Livak and Schmittgen, 2001) and the differences between the four groups were tested using the Tukey’s honestly significant difference test (P < 0.05).
Results
Plant Height Variation in the Segregating Population
The tomato line SG-7 was tall and TS-165 was short (Figure 1A). The plant heights of SG-7, TS-165 and F1 plants were 144.8, 54.0, and 82.6 cm, respectively. The internode length of SG-7, TS-165 and F1 plants were 7.2, 3.1, and 4.9 cm, respectively. In the F2 population, the correlation coefficient between plant height and average internode length was 0.96, suggesting that the difference of plant height in the two tomato lines was mostly determined by internode length. The frequency distribution of plant height in the F2 population showed continuous variation with the range of 48.0–158.0 cm (Figure 1B), suggesting that plant height in the two tomato lines was quantitatively inherited.
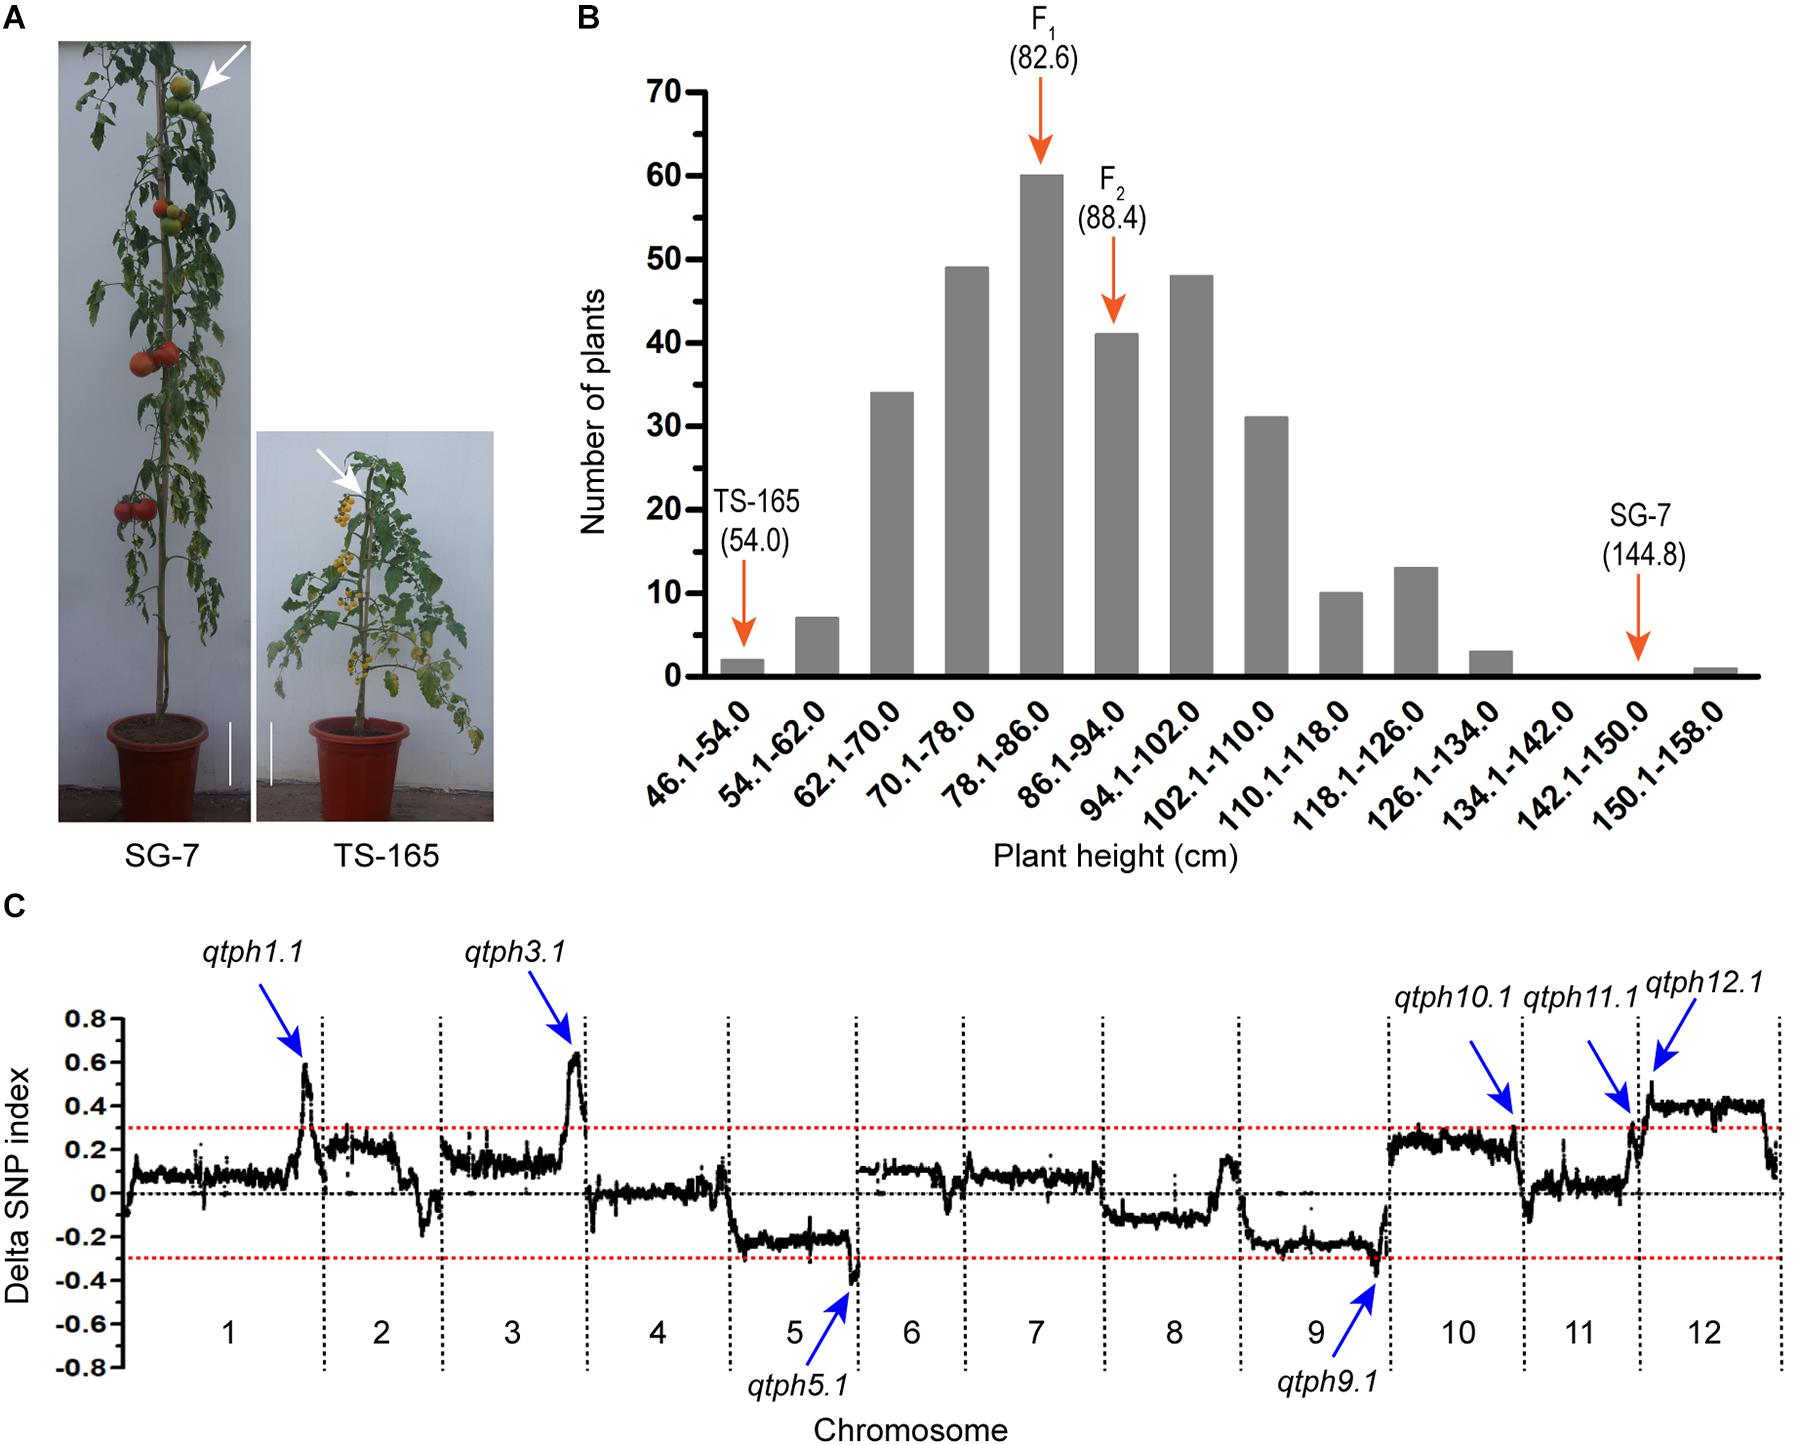
Figure 1. Identification of tomato plant height QTLs. (A) Plant height phenotype of tomato lines SG-7 and TS-165. Scale bars indicate 10 cm and white arrows point to the fourth truss. (B) Plant height distribution in the F2 population derived from the cross between SG-7 and TS-165. (C) Average values of the ΔSNP-index calculated by a sliding window from QTL-seq analysis.
QTL Analysis of Tomato Plant Height
Based on the plant height data, two extreme pools from the F2 population were prepared and subjected to QTL-seq. Pool PHH consisted of 25 tallest plants with plant height at the range of 111.0–158.0 cm, while pool PHS consisted of 25 shortest plants with plant height at the range of 48.0–66.0 cm. The two pools and two parental lines were re-sequenced, and a total of 1,285,779 SNPs were identified between the two parental lines. A graph of Δ(SNP-index) was generated by subtracting the SNP-index value of the pool PHS from the pool PHH (Figure 1C). Seven candidate intervals controlling tomato plant height were identified. They were located on chromosomes 1, 3, 5, 9, 10, 11, and 12 and were accordingly named QTL for tomato plant height 1.1 (qtph1.1), qtph3.1, qtph5.1, qtph9.1, qtph10.1, qtph11.1, and qtph12.1 (Figure 1C).
To confirm the QTLs for tomato plant height detected by QTL-seq, markers (Supplementary Table S1) within the seven candidate intervals controlling tomato plant height were used to genotype 299 F2 plants. One-way analysis of variance showed that the markers within the seven intervals were significantly associated with plant height (Supplementary Table S2). Among the seven QTLs, qtph5.1 and qtph9.1 contained the alleles for shorter plant height from SG-7, while the others from TS-165. qtph1.1, qtph3.1, and qtph12.1 were major-effect QTLs (R2 ≥ 0.1). Phenotypic variation (R2) explained by these three QTLs were 15, 16, and 12%, respectively (Supplementary Table S2).
Fine-Mapping of the qtph1.1 Locus
Five recombinants, whose crossover sites were around the marker HP3809 on chromosome 1 and the intervals for the loci qtph3.1 and qtph12.1 were homozygous, were selected from the F2 population to perform progeny tests in the spring of 2016. The progeny test showed that the qtph1.1 locus was located between markers HP3809 and HP3825, a 2.3 Mb region on chromosome 1 (Figure 2A, Supplementary Figure S1 and Supplementary Table S3). In the autumn of 2016, spring and autumn of 2017, the qtph1.1 locus was narrowed down to the regions between markers W1J2 and W1J26 (Figure 2B; Supplementary Figure S1 and Supplementary Table S3), between markers W1J4 and W1J26 (Figure 2C; Supplementary Figure S1 and Supplementary Table S3), and between markers W1J11 and W1P9 (Figure 2D; Supplementary Figure S1 and Table S3), respectively. Finally, the qtph1.1 locus was fine-mapped to the 18.9-kb interval between markers W1J13 and W1P9 in the spring of 2018 (Figure 2E; Supplementary Figure S1 and Supplementary Table S3).
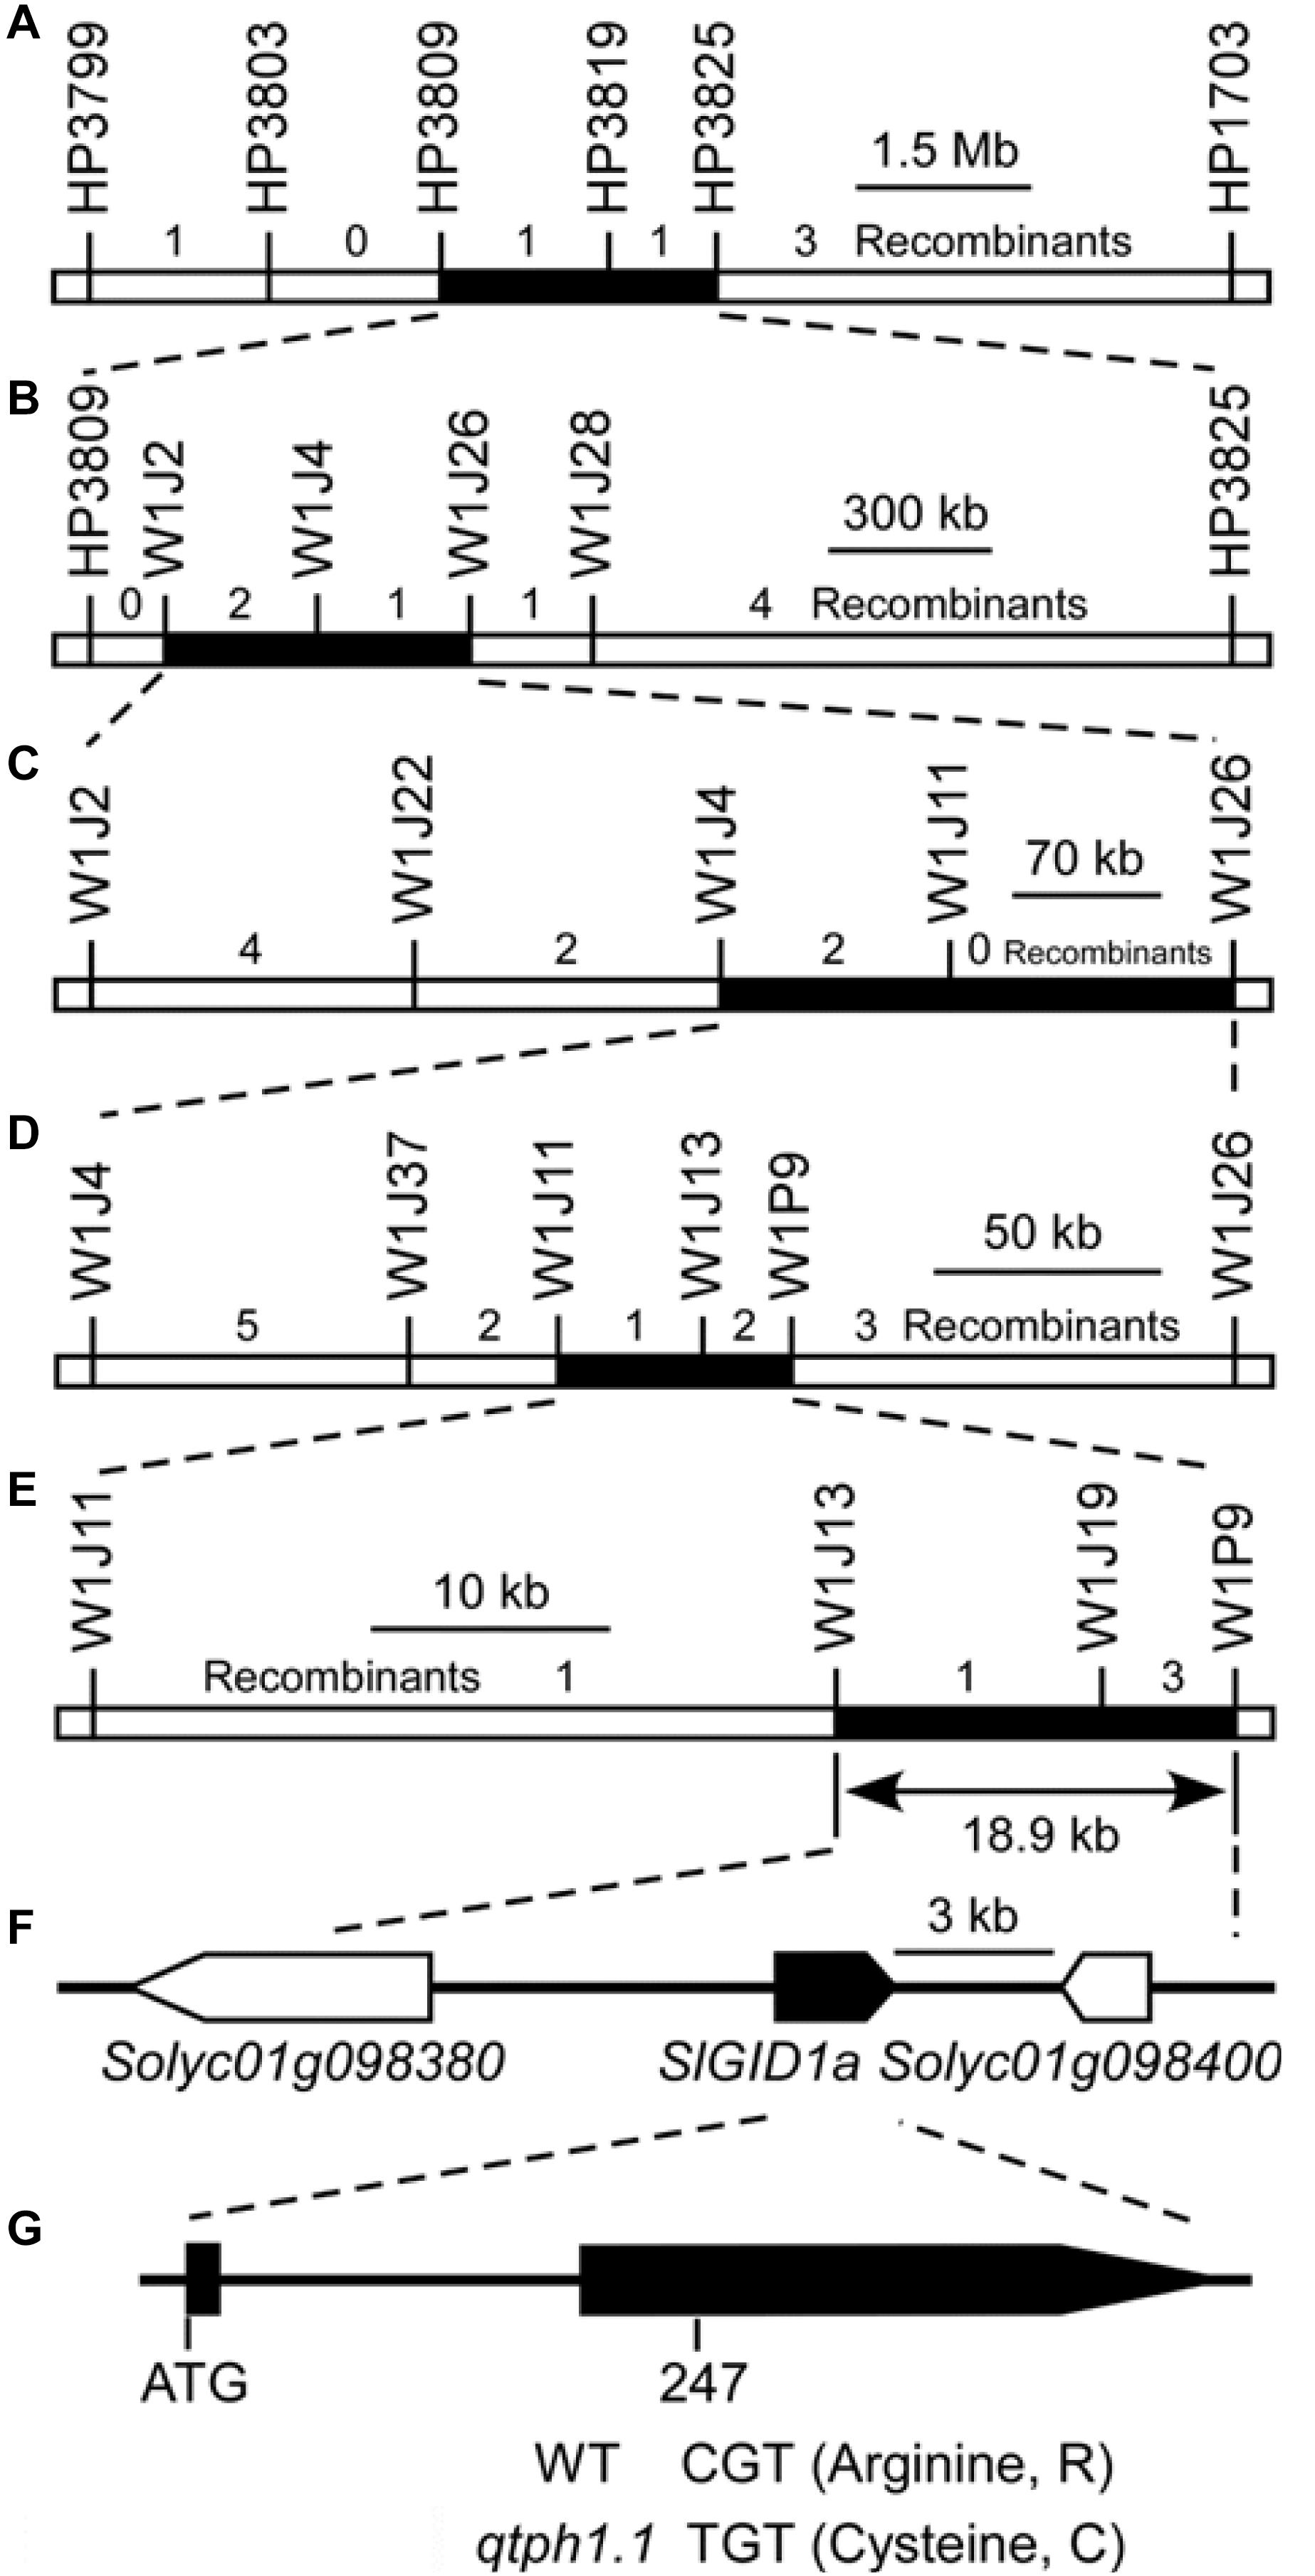
Figure 2. Fine mapping of the qtph1.1 locus. (A–E) The results of five cycles of recombinant progeny tests. (F) The annotated genes of ITAG release 2.40. Arrows indicate the direction of transcription, and the solid arrow presents the putative candidate gene for qTPH1.1. (G) The exon-intron structure of the coding region of SlGID1a and the sequence polymorphism between qtph1.1 (from TS-165) and the wild type (WT, from SG-7). The 247th nucleotide of the coding sequence of SlGID1a was C in SG-7 and T in TS-165, which led to the 83rd amino acid residue in the predicted protein sequence being Arginine (R) in SG-7 and Cysteine (C) in TS-165.
Candidate Gene Analysis of qTPH1.1
Three putative genes were in the 18.9-kb region corresponding to the qtph1.1 locus by searching the tomato genome annotation database (ITAG release 2.40) in SGN2 (Figure 2F and Supplementary Table S4). Of which, Solyc01g098390 encoded Gibberellin receptor GIBBERELLIN INSENSITIVE DWARF1 A (SlGID1a). The 247th nucleotide of the coding sequence of SlGID1a was C in tomato line SG-7 and T in TS-165 (Figure 2G and Supplementary Figure S2), which led to the 83rd amino acid residue in the predicted protein sequence being Arginine (R) in SG-7 and Cysteine (C) in TS-165 (Figure 2G and Supplementary Figure S3). The allele of SlGID1a in TS-165 was named SlGID1aR83C (Supplementary Figure S3). It has been known that the GID1 gene plays an important role in gibberellin signaling in plants (Hirano et al., 2008). Loss-of-function mutation of the SlGID1a gene resulted in typical GA-insensitive dwarfism (Illouz-Eliaz et al., 2019). The amino acid residue R was fixed in all 169 GID1s (Yoshida et al., 2018), indicated that it was important structurally and functionally. Therefore, SlGID1a was the putative candidate gene for qTPH1.1.
Response to GA3 Treatment
Given that the GA receptor SlGID1a was the putative candidate gene for qTPH1.1, the sensitivity of the qtph1.1 locus to exogenous GA3 was investigated. Near isogenic lines NIL-WT and NIL-qtph1.1 plants were sprayed with 50 μM GA3 or ethanol solution as the control. Thereby, these plants were divided into four groups: NIL-WT-GA3, NIL-qtph1.1-GA3, NIL-WT-Control, and NIL-qtph1.1-Control. The NIL-WT-Control plants were significantly taller than the NIL-qtph1.1-Control plants, and the NIL-WT-GA3 plants were also significantly taller than the NIL-qtph1.1-GA3 plants during the GA3 treatment experiment. The NIL-qtph1.1-GA3 plants were a slightly taller than the NIL-qtph1.1-Control plants, but the difference was not statistically significant during the whole treatment period (Figures 3A,B). However, the NIL-WT-GA3 plants were significantly taller than the NIL-WT-Control plants since the third treatment (Figures 3A,B). These results suggested that the NIL-qtph1.1 plants were insensitive to exogenous GA3 stimulation.
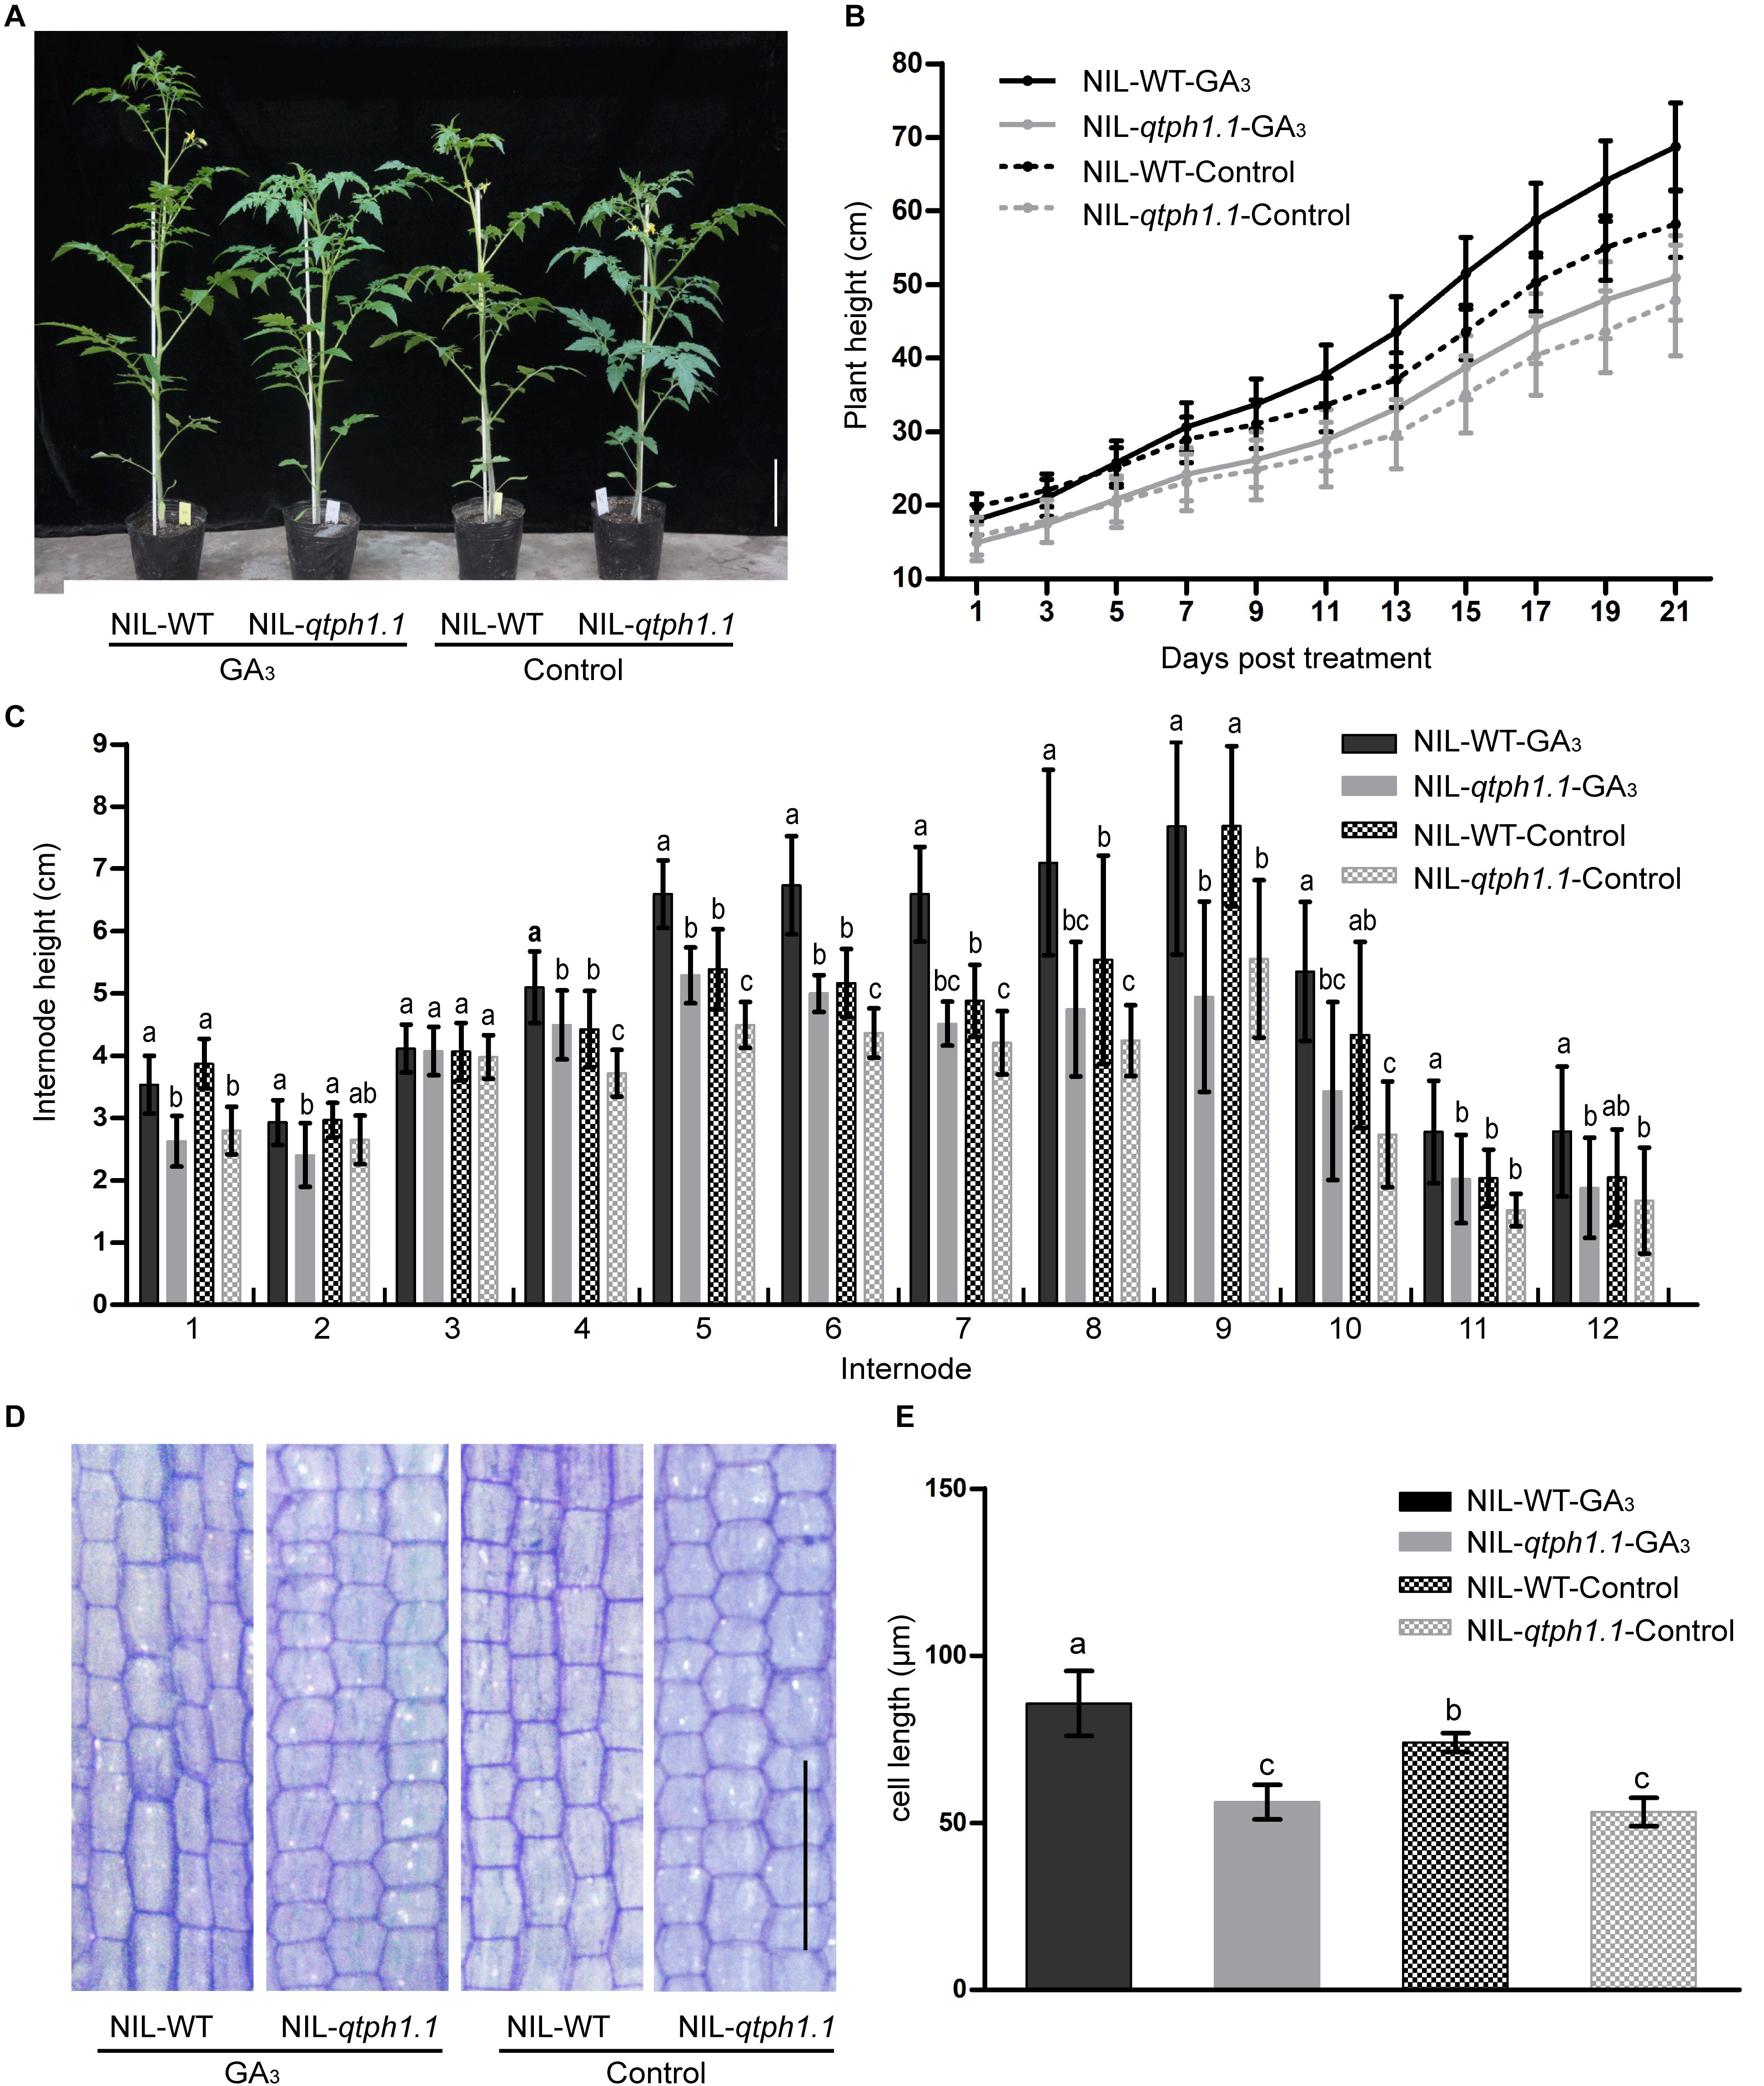
Figure 3. Response of the NIL-qtph1.1 plants to GA3 treatment. (A) Plant height phenotype of NIL-WT and NIL-qtph1.1 plants after GA3 treatment. Scale bar indicates 10 cm. (B) Plant height of NIL-WT and NIL-qtph1.1 plants during GA3 treatment (n > 14). (C) Internode length of NIL-WT and NIL-qtph1.1 plants after GA3 treatment (n > 14). (D) Histological analysis of the longitudinal section of the 8th internode of NIL-WT and NIL-qtph1.1 plants after GA3 treatment. Scale bar indicates 200 μm. (E) Cell length of the longitudinal section of the 8th internode of NIL-WT and NIL-qtph1.1 plants after GA3 treatment. Each group consists of five replications and each replication includes at least two hundred and forty-two cells. Values represent the mean ± standard deviation (SD). Different letters above the columns indicate statistically significant differences among groups (Tukey’s honestly significant difference test, P < 0.05).
Analysis of Internode Length and Cell Length
The length of each internode of the above mentioned plants was measured after treatment. Except for the 3rd and 12th internodes, the length of internodes of the NIL-qtph1.1 plants was significantly shorter than that of the NIL-WT plants (Figure 3C), irrespective of the control or treatment with GA3. Histological analysis of the longitude section of the 8th internode also showed that the cell length of the NIL-qtph1.1 plants was significantly shorter than that of the NIL-WT plants (Figures 3D,E) in both control and under GA3 treatment. Application of GA3 to the NIL-WT plants significantly increased internode cell length. However, the cellular effect of GA3 on the NIL-qtph1.1 plants was not significant (Figures 3D,E). These results suggested that short cell length was the important reason underlying the reduced internode length, which resulted in lower plant height of the NIL-qtph1.1 plants.
Comparative RNA-Seq Analysis of the qtph1.1 NILs
To dissect the molecular mechanisms underlying these phenotypic differences between the NIL-WT and NIL-qtph1.1 plants, especially the expression pattern of GA or other hormone related genes, the total transcriptome of young stems of these two lines treated with GA3 or ethanol (control) was analyzed using RNA-seq. Each line and each treatment comprised three biological replications, and a total of 12 cDNA libraries were constructed. Approximately 6.0 Gb clean data were generated for each replication. A total of 1,393 significant DEGs were discovered, comprised 753 up-regulated and 640 down-regulated DEGs in the NIL-qtph1.1-GA3 plants compared to the NIL-WT-GA3 plants. A total of 97 significant DEGs were discovered, comprised 52 up-regulated and 45 down-regulated DEGs in the NIL-qtph1.1-Control plants compared to the NIL-WT-Control plants. There were 63 overlapping DEGs between NIL-qtph1.1 and NIL-WT after two treatments, of which 42 were up-regulated and 21 were down-regulated in NIL-qtph1.1. The detailed information of all significant DEGs was listed in Supplementary Tables S5, S6. Among the 1,393 significant DEGs between the NIL-qtph1.1-GA3 plants and the NIL-WT-GA3 plants, 12 genes were related to GA biosynthesis and signaling, and 23 genes were related to auxin biosynthesis, transport, and signaling (Table 1).
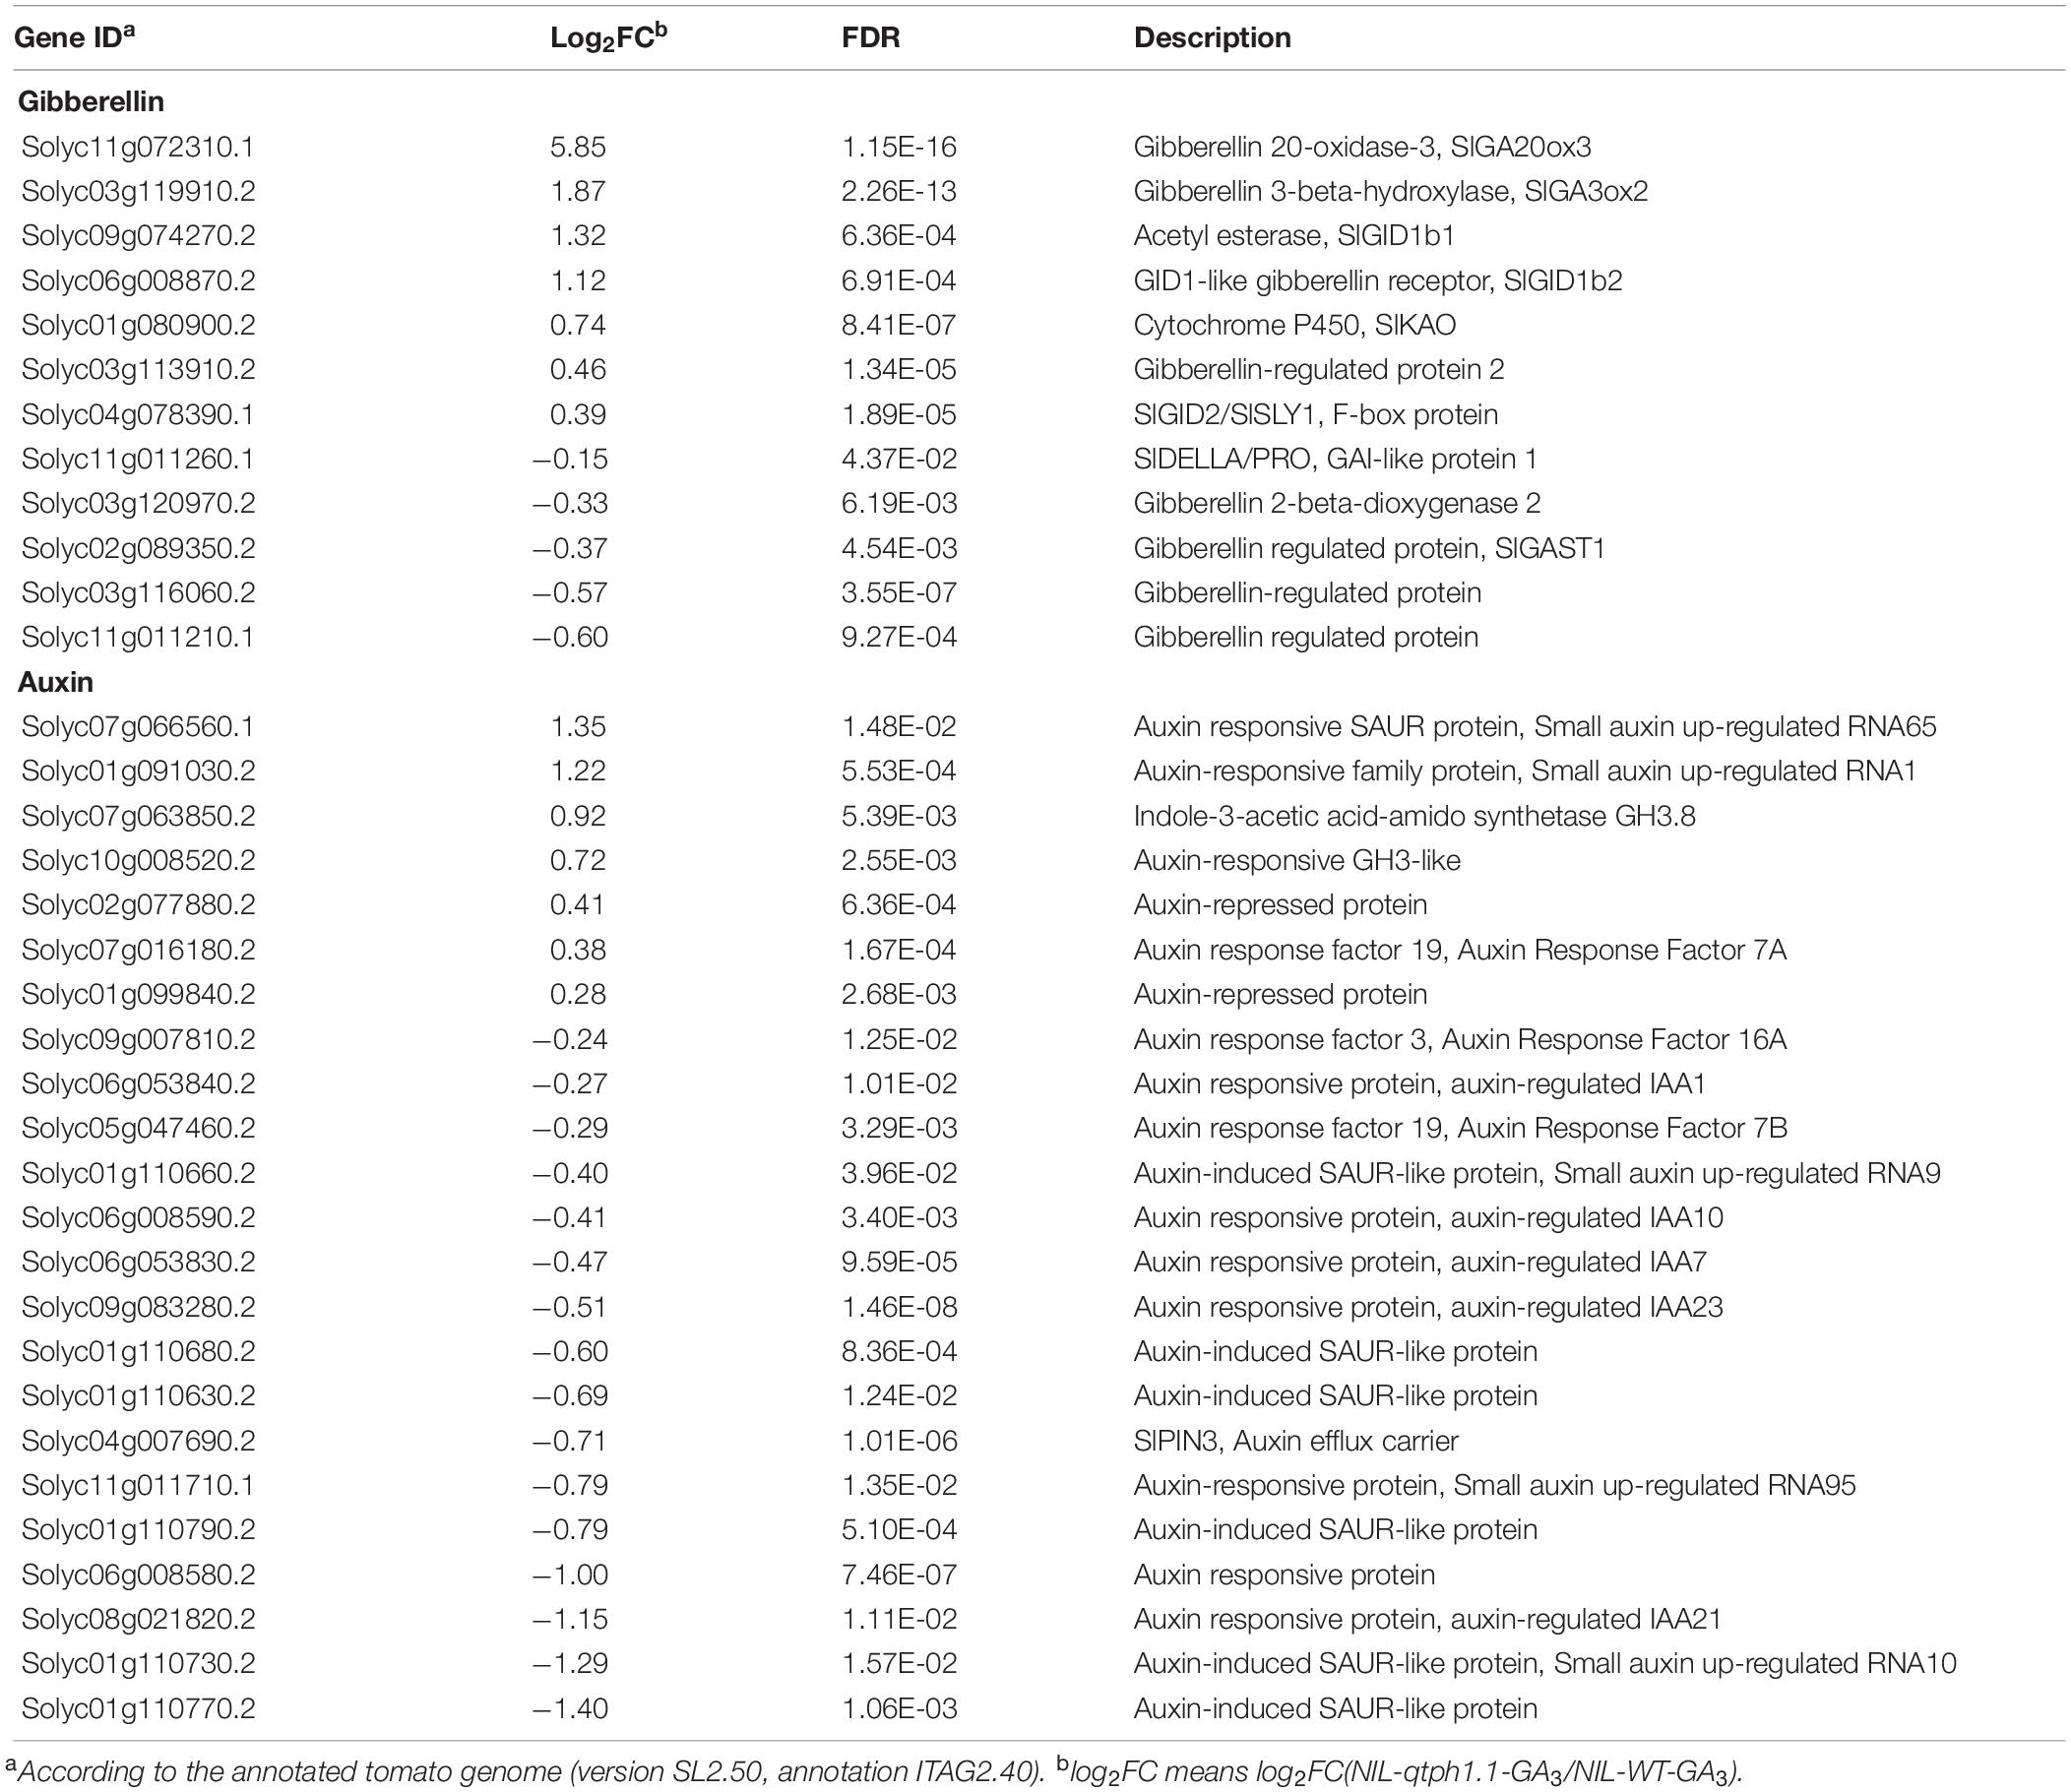
Table 1. Differentially expressed genes related to GA and auxin biosynthesis and signaling in NIL-WT and NIL-qtph1.1 after GA3 treatment.
qPCR Verification of the DEGs Related to GA and Auxin Biosynthesis and Signaling
To validate the DEGs identified by RNA-seq, the transcription expression of several genes related to GA and auxin biosynthesis and signaling was verified by qPCR (Table 1). SlGID1a, the putative candidate gene of qTPH1.1, was highly expressed in the NIL-qtph1.1 plants compared to the NIL-WT plants (Figure 4A). The expression of the two other GA receptor genes, SlGID1b1 (Solyc09g074270) and SlGID1b2 (Solyc06g008870), was also up-regulated in the NIL-qtph1.1 plants (Figures 4B,C). The suppressor gene in GA signaling, SlDELLA (PRO, Solyc11g011260), did not show significantly different expression between the two lines (Figure 4D). The F-box gene SlGID2 (SlSLY1, Solyc04g078390) was only more highly expressed in the NIL-qtph1.1 plants when treated with GA3 (Figure 4E). Three GA biosynthesis genes, SlKAO (Solyc01g080900), SlGA20ox3 (Solyc11g072310), and SlGA3ox2 (Solyc03g119910), were up-regulated in the NIL-qtph1.1 plants (Figures 4F–H), whereas SlGA2ox2 (Solyc03g120970) was almost expressed equally between the two lines (Figure 4I). Among the four GA-regulated protein genes, SlGAST1 (Solyc02g089350) was almost expressed equally between lines (Figure 4J), Solyc03g113910 was up-regulated in the NIL-qtph1.1 plants (Figure 4K), but Solyc03g116060 and Solyc11g011210 were down-regulated in the NIL-qtph1.1 plants (Figures 4L,M).
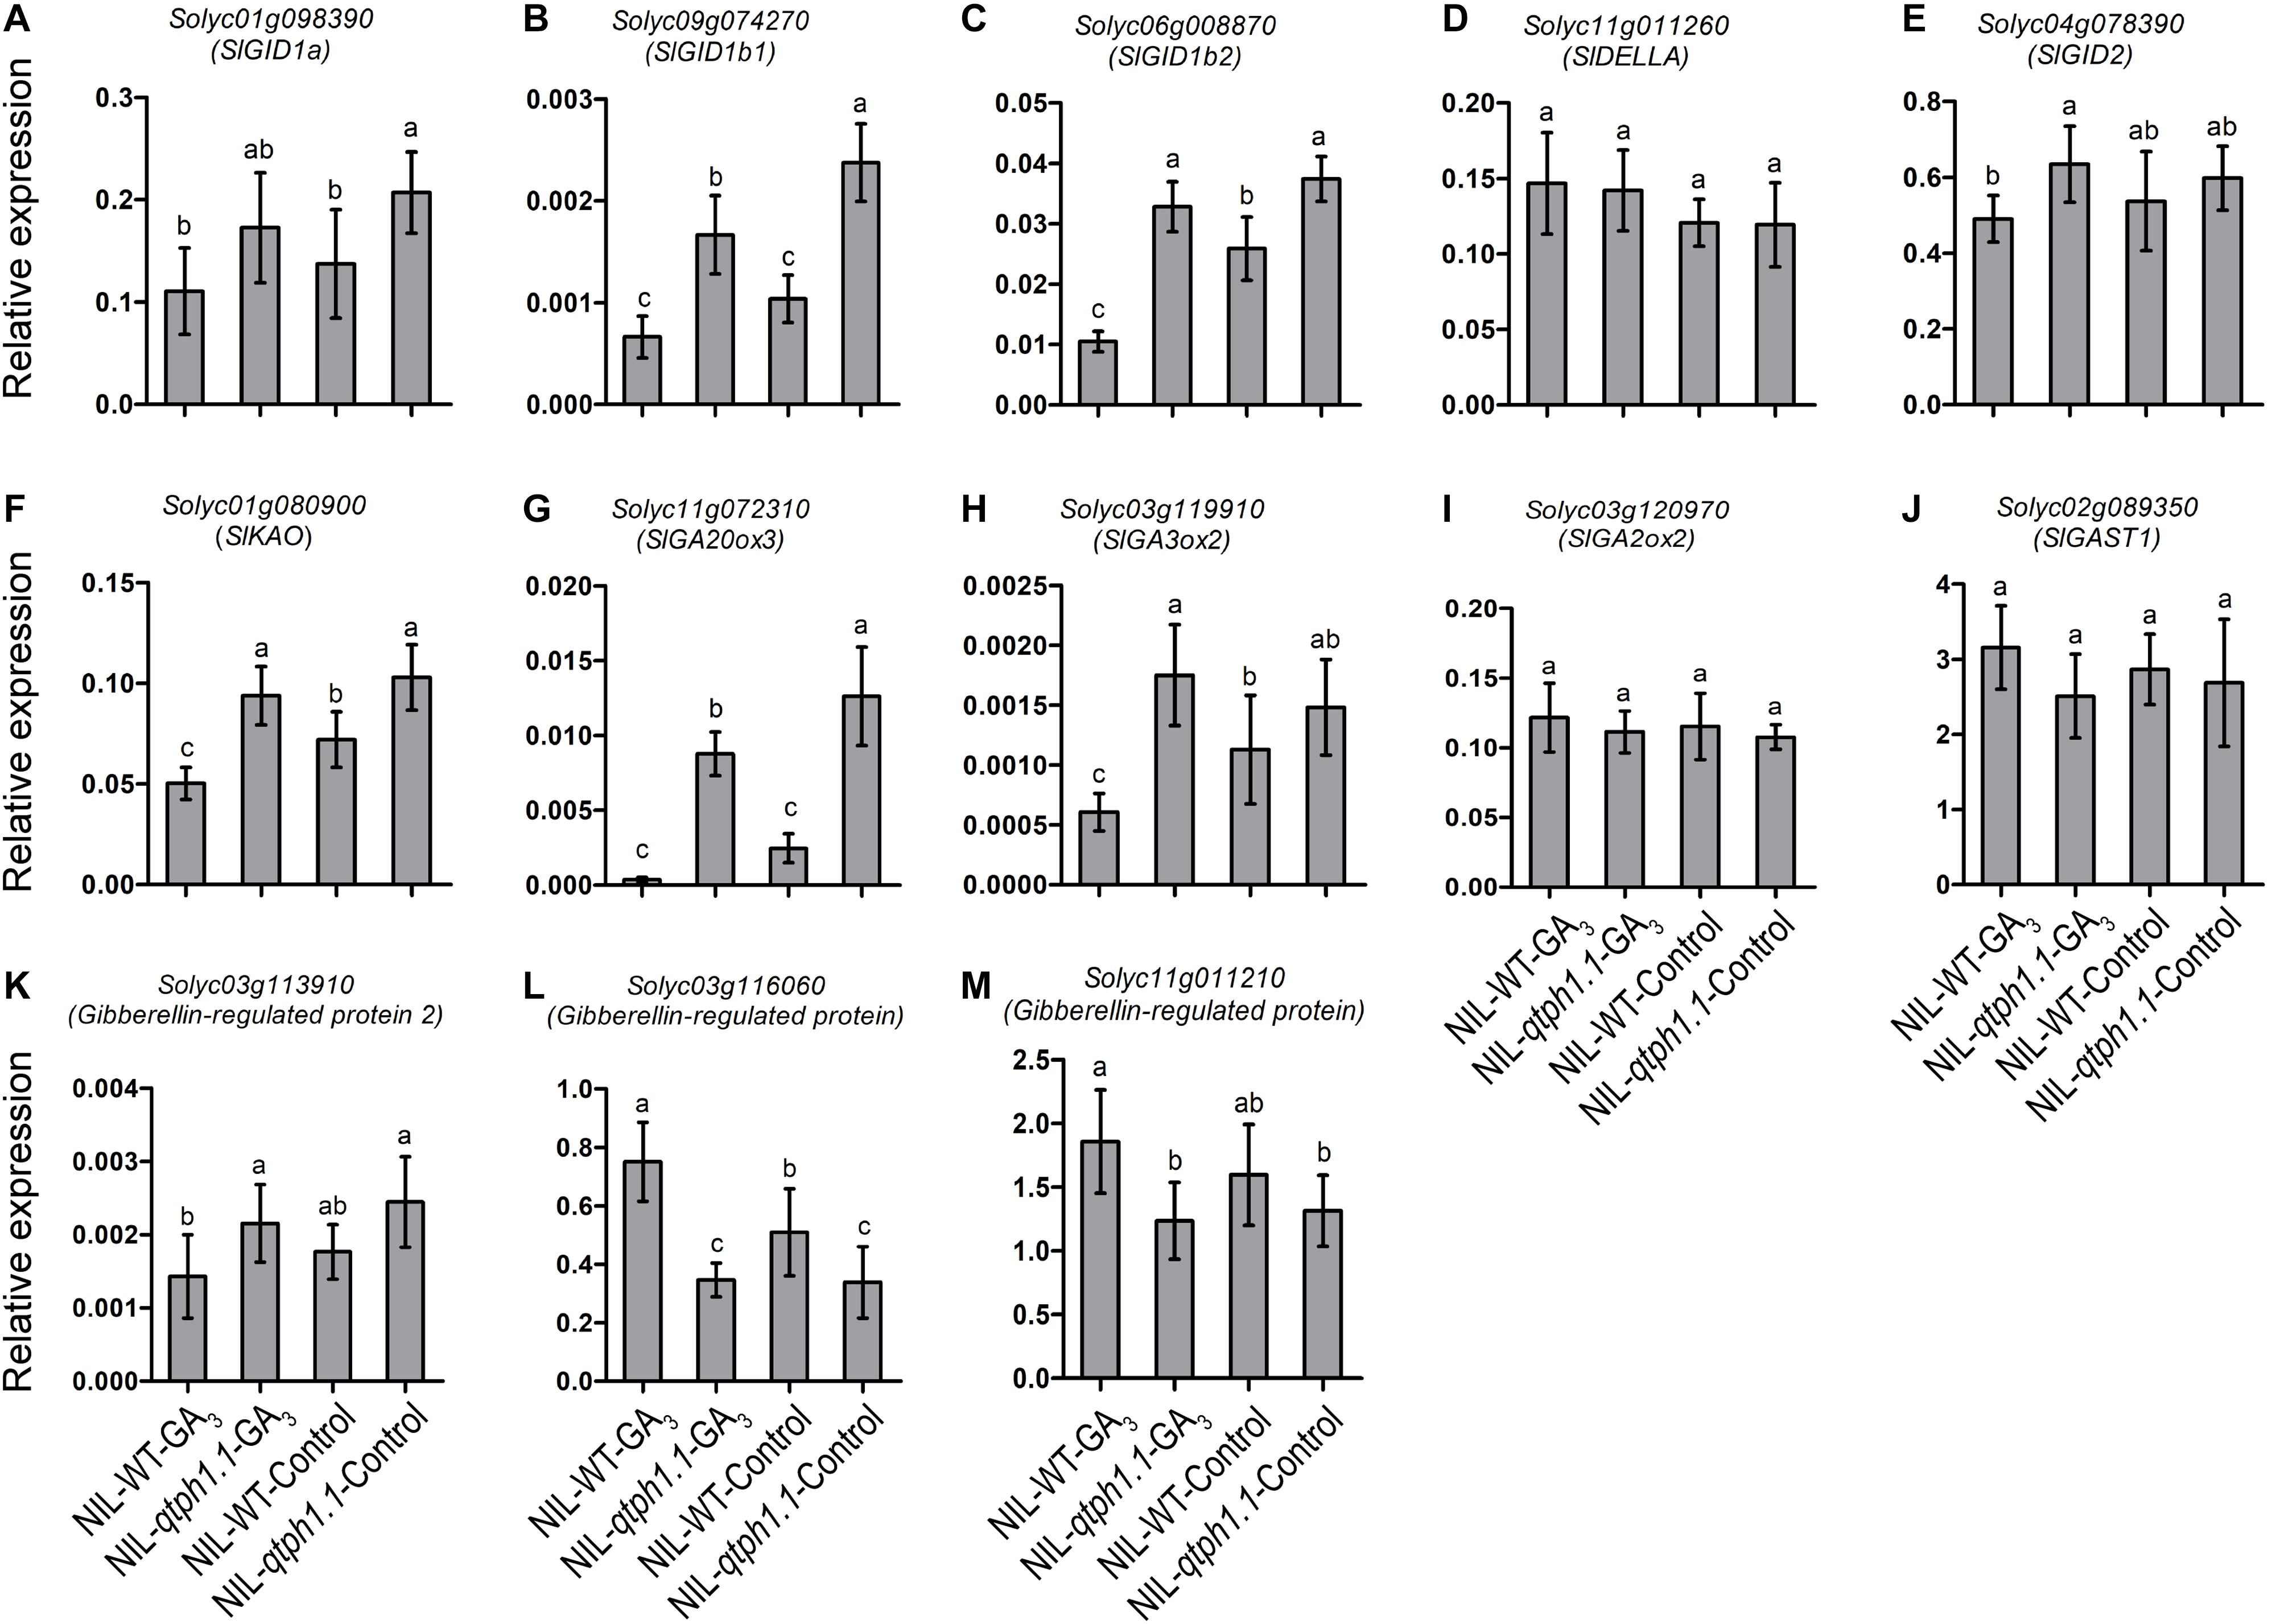
Figure 4. Relative expression of the genes related to GA biosynthesis and signaling in NIL-WT and NIL-qtph1.1. (A–C) The expression levels of three GA receptor genes, Solyc01g098390, Solyc09g074270 and Solyc06g008870. (D,E) The expression levels of two GA signaling genes, Solyc11g011260 and Solyc04g078390. (F–I) The expression levels of four GA biosynthesis genes, Solyc01g080900, Solyc11g072310, Solyc03g119910 and Solyc03g120970. (J–M) The expression levels of four GA-regulated protein genes, Solyc02g089350, Solyc03g113910, Solyc03g116060 and Solyc11g011210 in NIL-WT and NIL-qtph1.1 after treatment with GA3 and control solution. The SlCAC (Solyc08g006960) gene was used as a reference. Values represent the mean ± standard deviation (SD) based on the data of 3 biological replications and 3 technical replications. Different letters above the columns indicate statistically significant differences among groups (Tukey’s honestly significant difference test, P < 0.05).
Four genes related to auxin biosynthesis and signaling were verified to be up-regulated in the NIL-qtph1.1 plants, which included two genes that might prevent free IAA accumulation, Solyc07g063850 (GH3.8) and Solyc10g008520 (GH3-like) (Figures 5A,B), and two small auxin up-regulated (SAUR) genes, Solyc01g091030 (SAUR1) and Solyc07g066560 (SAUR65) (Figures 5C,D). Four genes related to auxin transportation and signaling were verified to be down-regulated in the NIL-qtph1.1 plants, which included auxin efflux carrier SlPIN3 (Solyc04g007690) (Figure 5E), auxin-induced SAUR-like protein gene Solyc01g110630 (Figure 5F), and two auxin responsive protein (Aux/IAA like) genes, Solyc06g008580 and Solyc08g021820 (Figures 5G,H).
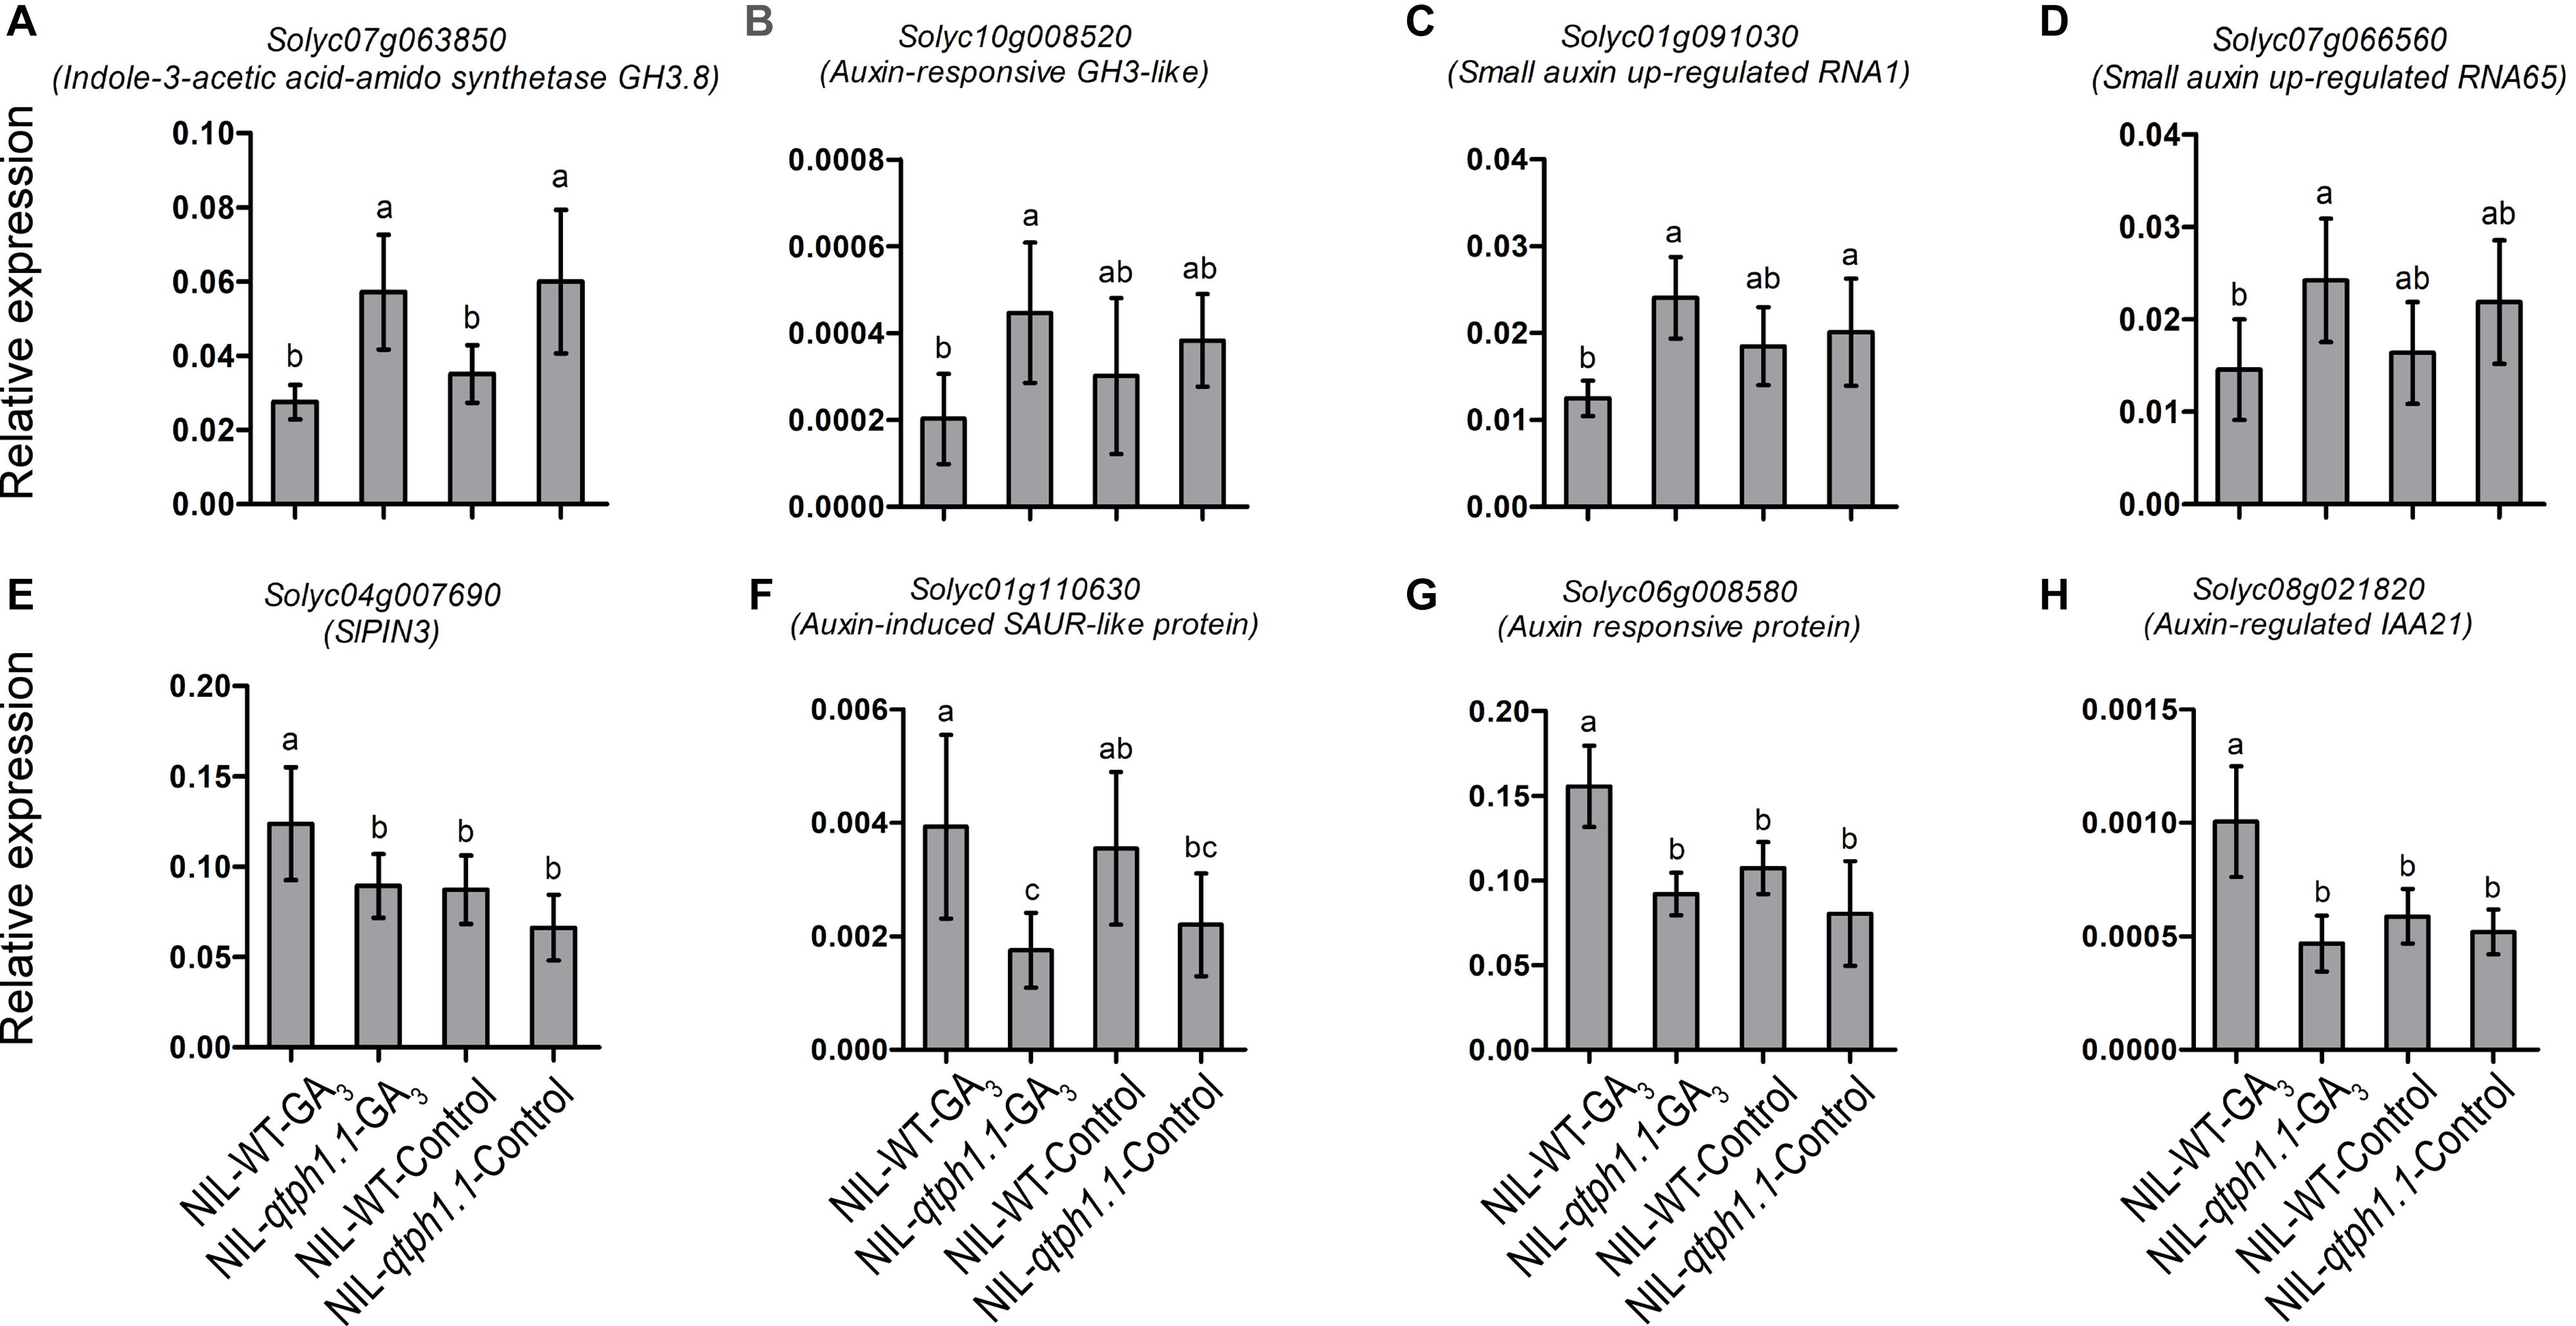
Figure 5. Relative expression of the genes related to auxin homeostasis, transporting and signaling in NIL-WT and NIL-qtph1.1. (A,B) The expression levels of two genes which prevent free IAA accumulation, Solyc07g063850 and Solyc10g008520. (C,D) The expression levels of two small auxin up-regulated genes, Solyc01g091030 and Solyc07g066560. (E,F) The expression levels of auxin efflux carrier Solyc04g007690 and auxin-induced SAUR-like protein gene Solyc01g110630. (G,H) The expression levels of two auxin responsive protein (Aux/IAA like) genes, Solyc06g008580 and Solyc08g021820 in NIL-WT and NIL-qtph1.1 after treatment with GA3 and control solution. The SlCAC (Solyc08g006960) gene was used as a reference. Values represent the mean ± standard deviation (SD) based on the data of 3 biological replications and 3 technical replications. Different letters above the columns indicate statistically significant differences among groups (Tukey’s honestly significant difference test, P < 0.05).
Discussion
Tomato plant height is an important trait related to plant architecture. Several tomato plant height mutants have been identified, and their genetic basis has been discovered. However, only br, d and sp have been used in breeding because they have no or less negative effects on fruit size and yield (Scott and Harbaugh, 1989; Lukyanenko, 1990; Panthee and Gardner, 2013; Frasca et al., 2014). The variation of plant height in natural tomato lines is relatively large. QTL mapping is helpful to the analysis of the genetic basis of tomato plant height and the improvement of this trait. Approximately 20 QTLs for tomato plant height have been identified (Weller, 1987; deVicente and Tanksley, 1993; Jansen and Stam, 1994; Grandillo and Tanksley, 1996; Paran et al., 1997; Prudent et al., 2009; Zhou et al., 2016), but none of them have been finely mapped. In this study, seven QTLs controlling tomato plant height were identified through QTL-seq and single marker analysis (Figure 1 and Supplementary Table S2). Among them, qtph1.1, qtph10.1, qtph11.1, and qtph12.1 seemed to be novel QTLs for tomato plant height. qtph1.1, qtph3.1, and qtph12.1 were major-effect QTLs, and phenotypic variation explained by them were 15, 16, and 12%, respectively (Supplementary Table S2). These results laid the foundation for fine mapping of tomato plant height QTLs.
A new putative candidate quantitative trait gene for tomato plant height was identified in this study. The qtph1.1 locus was further fine mapped to an 18.9-kb region that contained three putative genes (Figure 2 and Supplementary Table S3, Supplementary Table S4). Solyc01g098390 encoded Gibberellin receptor SlGID1a. The SlGID1a gene in the NIL-qtph1.1 plants contained an SNP, which resulted in conversion of the 83rd amino acid Arginine (R) to Cysteine (C; this allele was named SlGID1aR83C) (Supplementary Figure S3). The amino acid R is completely conservative in GID1s from plant species (Yoshida et al., 2018), suggesting it is important structurally and functionally. A previous study showed that the loss-of-function mutation of the SlGID1a gene by gene editing resulted in typical GA-insensitive dwarfism (Illouz-Eliaz et al., 2019). The NIL-qtph1.1 plants also showed lower plant height and insensitivity to exogenous GA3 stimulation compared to NIL-WT plants (Figure 3). Similar to a previous study (Illouz-Eliaz et al., 2019), several genes related to GA biosynthesis and signaling were up-regulated in NIL-qtph1.1 plants (Figure 4 and Table 1). These findings suggested that SlGID1a is the putative candidate gene of qTPH1.1.
SlGID1a might be a good target gene for the improvement of tomato plant height. GID1s play important roles in GA signaling (Sun, 2011), which usually causes significant changes in plant phenotype, especially plant height (Cantin et al., 2018; Cheng et al., 2019; Illouz-Eliaz et al., 2019). Several GID1 mutants have been utilized in agriculture. The recessive brachytic dwarfism trait (dw) in peach has little or no effect on fruit development. It contains a nonsense mutation in GID1c (Hollender et al., 2016). Two alleles of non-synonymous single nucleotide mutation, GID1cS178F and GID1cS191F, have also been found in dwarf peach (Cantin et al., 2018; Cheng et al., 2019). Three GID1 genes, SlGID1a, SlGID1b1, and SlGID1b2, are encoded in tomato genome. Among them, SlGID1a has the strongest effect on stem elongation (Illouz-Eliaz et al., 2019). In this study, a preliminarily phenotypic evaluation showed that the allele SlGID1aR83C in NIL-qtph1.1 plants had very little effect on flowering time and fruit weight (Supplementary Table S7), which suggested that it might has potential application in dwarf tomato breeding. To achieve the breeding goal, more field experiments need to be conducted to evaluate the effect of allele SlGID1aR83C in NIL-qtph1.1 plants on other important agronomic traits in the future. Furthermore, the SlGID1a gene may also be a good target for optimization of plant height using base editing system (Shimatani et al., 2017).
Plant height is usually controlled by phytohormones and their interaction (Wang et al., 2017). In this study, the SlGID1aR83C allele in NIL-qtph1.1 plants affected the expression of the genes not only related to GA biosynthesis and signaling (Table 1 and Figure 4) but also those related to auxin homeostasis, transporting and signaling (Table 1 and Figure 5). The homologs of these genes have been reported to control plant height. Overexpression of rice Indole-3-acetic acid-amido synthetase GH3.8 leads to lower free IAA accumulation and shorter plant height (Ding et al., 2008). Mutation of the transcription repressors in auxin signaling, BnaA3.IAA7 and BnaC05.iaa7, results in dwarf phenotypes (Li et al., 2019; Zhao et al., 2019). The small auxin up-regulated RNA (SAUR) genes in Arabidopsis play important roles in auxin-induced growth (Stortenbeker and Bemer, 2019). However, further study is required to determine whether these tomato genes related to auxin homeostasis, transporting and signaling also regulate plant height and the molecular mechanism of their transcriptional expression regulated by GA signaling.
Data Availability Statement
The datasets presented in this study can be found in online repositories. The names of the repository/repositories and accession number(s) can be found in the article/ Supplementary Material.
Author Contributions
XLL, JW, MY, KW, XYL, TG, XW, YG, JL, LL, and JS performed the experiments. ZQ helped analyze the data. WY, YD, and ZH conceived and supervised the study. XLL, WY, and ZH wrote the manuscript. All of the authors read and approved the final manuscript.
Funding
This work was supported by the National Key Research and Development Program of China (No. 2016YFD0100307), the National Natural Science Foundation of China (Nos. 31672154 and 31872949), the Central Public-interest Scientific Institution Basal Research Fund (No. Y2017PT52), and the Science and Technology Innovation Program of the Chinese Academy of Agricultural Sciences (No. CAAS-ASTIP-IVFCAAS).
Conflict of Interest
The authors declare that the research was conducted in the absence of any commercial or financial relationships that could be construed as a potential conflict of interest.
Supplementary Material
The Supplementary Material for this article can be found online at: https://www.frontiersin.org/articles/10.3389/fgene.2020.00881/full#supplementary-material
Footnotes
References
Bassel, G. W., Mullen, R. T., and Bewley, J. D. (2008). Procera is a putative DELLA mutant in tomato (Solanum lycopersicum): effects on the seed and vegetative plant. J. Exp. Bot. 59, 585–593. doi: 10.1093/jxb/erm354
Bishop, G. J., Harrison, K., and Jones, J. D. G. (1996). The tomato Dwarf gene lsolated by heterologous transposon tagging encodes the first member of a new cytochrome P450 family. Plant Cell 8, 959–969. doi: 10.1105/tpc.8.6.959
Bishop, G. J., Nomura, T., Yokota, T., Harrison, K., Noguchi, T., Fujioka, S., et al. (1999). The tomato DWARF enzyme catalyses C-6 oxidation in brassinosteroid biosynthesis. Proc. Natl. Acad. Sci. U.S.A. 96, 1761–1766. doi: 10.1073/pnas.96.4.1761
Cantin, C. M., Arus, P., and Eduardo, I. (2018). Identification of a new allele of the Dw gene causing brachytic dwarfing in peach. BMC Res. Notes 11:386. doi: 10.1186/s13104-018-3490-7
Cao, X., Qiu, Z., Wang, X., Van Giang, T., Liu, X., Wang, J., et al. (2017). A putative R3 MYB repressor is the Candidate gene underlying atroviolacium, a locus for anthocyanin pigmentation in tomato fruit. J. Exp. Bot. 68, 5745–5758. doi: 10.1093/jxb/erx382
Carmel-Goren, L., Liu, Y. S., Lifschitz, E., and Zamir, D. (2003). The SELF-PRUNING gene family in tomato. Plant Mol. Biol. 52, 1215–1222. doi: 10.1023/B:PLAN.0000004333.96451.11
Cheng, J., Zhang, M., Tan, B., Jiang, Y., Zheng, X., Ye, X., et al. (2019). A single nucleotide mutation in GID1c disrupts its interaction with DELLA1 and causes a GA-insensitive dwarf phenotype in peach. Plant Biotechnol. J. 17, 1723–1735. doi: 10.1111/pbi.13094
deVicente, M. C., and Tanksley, S. D. (1993). QTL analysis of transgressive segregation in an interspecific tomato cross. Genetics 134, 585–596.
Ding, X., Cao, Y., Huang, L., Zhao, J., Xu, C., Li, X., et al. (2008). Activation of the indole-3-acetic acid-amido synthetase GH3-8 suppresses expansin expression and promotes salicylate- and jasmonate-independent basal immunity in rice. Plant Cell 20, 228–240. doi: 10.1105/tpc.107.055657
Elkind, Y., Gurnick, A., and Kedar, N. (1991). Genetics of semideterminate growth habit in tomato. HortScience 26, 1074–1075. doi: 10.21273/HORTSCI.26.8.1074
Exposito-Rodriguez, M., Borges, A. A., Borges-Perez, A., and Perez, J. A. (2008). Selection of internal control genes for quantitative real-time RT-PCR studies during tomato development process. BMC Plant Biol. 8:131. doi: 10.1186/1471-2229-8-131
Frasca, A. C., Ozores-Hampton, M., Scott, J., and McAvoy, E. (2014). Effect of plant population and breeding lines on fresh-market, compact growth habit tomatoes growth, flowering pattern, yield, and postharvest quality. HortScience 49, 1529–1536. doi: 10.21273/HORTSCI.49.12.1529
Fridman, E., Liu, Y., Carmel-Goren, L., Gur, A., Shoresh, M., Pleban, T., et al. (2002). Two tightly linked QTLs modify tomato sugar content via different physiological pathways. Mol. Genet. Genomics 266, 821–826. doi: 10.1007/s00438-001-0599-4
Grandillo, S., and Tanksley, S. D. (1996). QTL analysis of horticultural traits differentiating the cultivated tomato from the closely related species Lycopersicon pimpinellifolium. Theor. Appl. Genet. 92, 935–951. doi: 10.1007/BF00224033
Hirano, K., Ueguchi-Tanaka, M., and Matsuoka, M. (2008). GID1-mediated gibberellin signaling in plants. Trends Plant Sci. 13, 192–199. doi: 10.1016/j.tplants.2008.02.005
Hollender, C. A., Hadiarto, T., Srinivasan, C., Scorza, R., and Dardick, C. (2016). A brachytic dwarfism trait (dw) in peach trees is caused by a nonsense mutation within the gibberellic acid receptor PpeGID1c. New Phytol. 210, 227–239. doi: 10.1111/nph.13772
Illa-Berenguer, E., Van Houten, J., Huang, Z., and van der Knaap, E. (2015). Rapid and reliable identification of tomato fruit weight and locule number loci by QTL-seq. Theor. Appl. Genet. 128, 1329–1342. doi: 10.1007/s00122-015-2509-x
Illouz-Eliaz, N., Ramon, U., Shohat, H., Blum, S., Livne, S., Mendelson, D., et al. (2019). Multiple gibberellin receptors contribute to phenotypic stability under changing environments. Plant Cell 31, 1506–1519. doi: 10.1105/tpc.19.00235
Jansen, R. C., and Stam, P. (1994). High resolution of quantitative traits into multiple loci via interval mapping. Genetics 136, 1447–1455.
Jones, C. M., Rick, C. M., Adams, D., Jernstedt, J., and Chetelat, R. T. (2007). Genealogy and fine mapping of obscuravenosa, a gene affecting the distribution of chloroplasts in leaf veins and evidence of selection during breeding of tomatoes (Lycopersicon esculentum. Solanaceae). Am. J. Bot. 94, 935–947. doi: 10.3732/ajb.94.6.935
Jupe, S. C., Causton, D. R., and Scott, I. M. (1988). Cellular basis of the effects of gibberellin and the pro gene on stem growth in tomato. Planta 174, 106–111. doi: 10.1007/BF00394881
Koornneef, M., Bosma, T. D., Hanhart, C. J., van der Veen, J. H., and Zeevaart, J. A. (1990). The isolation and characterization of gibberellin-deficient mutants in tomato. Theor. Appl. Genet. 80, 852–857. doi: 10.1007/BF00224204
Kwon, C. T., Heo, J., Lemmon, Z. H., Capus, Y., Hutton, S. F., Eck, J. V., et al. (2020). Rapid customization of Solanaceae fruit crops for urban agriculture. Nature Biotechnol. 38, 182–188. doi: 10.1038/s41587-019-0361-2
Lamarre, S., Frasse, P., Zouine, M., Labourdette, D., Sainderichin, E., Hu, G., et al. (2018). Optimization of an RNA-seq differential gene expression analysis depending on biological replicate number and library size. Front. Plant Sci. 9:108. doi: 10.3389/fpls.2018.00108
Larkin, M. A., Blackshields, G., Brown, N. P., Chenna, R., McGettigan, P. A., McWilliam, H., et al. (2007). Clustal W and Clustal X version 2.0. Bioinformatics 23, 2947–2948. doi: 10.1093/bioinformatics/btm404
Lee, T. G., Hutton, S. F., and Shekasteband, R. (2018). Fine mapping of the brachytic locus on the tomato genome. J. Amer. Soc. Hort. Sci. 143, 239–247. doi: 10.21273/JASHS04423-18
Li, H. (2013). Aligning sequence reads, clone sequences and assembly contigs with BWA-MEM. arXiv [preprint] Available online at: https://arxiv.org/abs/1303.3997 (accessed January 13, 2016).
Li, H., Handsaker, B., Wysoker, A., Fennell, T., Ruan, J., Homer, N., et al. (2009). The sequence Alignment/Map format and SAMtools. Bioinformatics 25, 2078–2079. doi: 10.1093/bioinformatics/btp352
Li, H., Li, J., Song, J., Zhao, B., Guo, C., Wang, B., et al. (2019). An auxin signaling gene BnaA3.IAA7 contributes to improved plant architecture and yield heterosis in rapeseed. New Phytol. 222, 837–851. doi: 10.1111/nph.15632
Lin, T., Zhu, G., Zhang, J., Xu, X., Yu, Q., Zheng, Z., et al. (2014). Genomic analyses provide insights into the history of tomato breeding. Nat. Genet. 46, 1220–1226. doi: 10.1038/ng.3117
Liu, F., Wang, P., Zhang, X., Li, X., Yan, X., Fu, D., et al. (2018). The genetic and molecular basis of crop height based on a rice model. Planta 247, 1–26. doi: 10.1007/s00425-017-2798-1
Livak, K. J., and Schmittgen, T. D. (2001). Analysis of relative gene expression data using real-time quantitative PCR and the 2–ΔΔCT method. Methods 25, 402–408. doi: 10.1006/meth.2001.1262
Lukyanenko, A. N. (1990). “Breeding tomato for mechanized harvesting,” in Genetic Improvement of Tomato, ed. G. Kalloo (Berlin: Springer-Verlag), 213–230. doi: 10.1007/978-3-642-84275-7_17
MacArthur, J. W. (1932). Inherited characters in the tomato. I. The self pruning habit. J. Hered. 23, 395–396. doi: 10.1093/oxfordjournals.jhered.a103514
Marti, E., Gisbert, C., Bishop, G. J., Dixon, M. S., and Garcia-Martinez, J. L. (2006). Genetic and physiological characterization of tomato cv. Micro-Tom. J. Exp. Bot. 57, 2037–2047. doi: 10.1093/jxb/erj154
McGarry, R. C., and Ayre, B. G. (2012). Manipulating plant architecture with members of the CETS gene family. Plant Sci. 188-189, 71–81. doi: 10.1016/j.plantsci.2012.03.002
McKenna, A., Hanna, M., Banks, E., Sivachenko, A., Cibulskis, K., Kernytsky, A., et al. (2010). The genome analysis toolkit: a MapReduce framework for analyzing next-generation DNA sequencing data. Genome Res. 20, 1297–1303. doi: 10.1101/gr.107524.110
Neff, M. M., Turk, E., and Kalishman, M. (2002). Web-based primer design for single nucleotide polymorphism analysis. Trends Genet. 18, 613–615. doi: 10.1016/s0168-9525(02)02820-2
Panthee, D. R., and Gardner, R. G. (2013). ‘Mountain Vineyard’ hybrid grape tomato and its parents: NC 4 grape and NC 5 grape tomato breeding lines. HortScience 48, 1189–1191. doi: 10.21273/HORTSCI.48.9.1189
Paran, I., Goldman, I., and Zamir, D. (1997). QTL analysis of morphological traits in a tomato recombinant inbred line population. Genome 40, 242–248. doi: 10.1139/g97-034
Park, S. J., Jiang, K., Tal, L., Yichie, Y., Gar, O., Zamir, D., et al. (2014). Optimization of crop productivity in tomato using induced mutations in the florigen pathway. Nat. Genet. 46, 1337–1342. doi: 10.1038/ng.3131
Pnueli, L., Carmel-Goren, L., Hareven, D., Gutfinger, T., Alvarez, J., Ganal, M., et al. (1998). The SELF-PRUNING gene of tomato regulates vegetative to reproductive switching of sympodial meristems and is the ortholog of CEN and TFL1. Development 125, 1979–1989.
Prudent, M., Causse, M., Genard, M., Tripodi, P., Grandillo, S., and Bertin, N. (2009). Genetic and physiological analysis of tomato fruit weight and composition: influence of carbon availability on QTL detection. J. Exp. Bot. 60, 923–937. doi: 10.1093/jxb/ern338
Sakamoto, T., and Matsuoka, M. (2004). Generating high-yielding varieties by genetic manipulation of plant architecture. Curr. Opin. Biotechnol. 15, 144–147. doi: 10.1016/j.copbio.2004.02.003
Salas Fernandez, M. G., Becraft, P. W., Yin, Y., and Lubberstedt, T. (2009). From dwarves to giants? Plant height manipulation for biomass yield. Trends Plant Sci. 14, 454–461. doi: 10.1016/j.tplants.2009.06.005
Schrager-Lavelle, A., Gath, N. N., Devisetty, U. K., Carrera, E., Lopez-Diaz, I., Blazquez, M. A., et al. (2019). The role of a class III gibberellin 2-oxidase in tomato internode elongation. Plant J. 97, 603–615. doi: 10.1111/tpj.14145
Scott, J. W., and Harbaugh, B. K. (1989). Micro-Tom. A miniature dwarf tomato. Florida Agr. Expt. Sta. Circ. 370, 1–6.
Shimatani, Z., Kashojiya, S., Takayama, M., Terada, R., Arazoe, T., Ishii, H., et al. (2017). Targeted base editing in rice and tomato using a CRISPR-Cas9 cytidine deaminase fusion. Nat. Biotechnol. 35, 441–443. doi: 10.1038/nbt.3833
Shinozaki, Y., Ezura, K., Hu, J., Okabe, Y., Benard, C., Prodhomme, D., et al. (2018). Identification and functional study of a mild allele of SlDELLA gene conferring the potential for improved yield in tomato. Sci. Rep. 8:12043. doi: 10.1038/s41598-018-30502-w
Soyk, S., Müller, N. A., Park, S. J., Schmalenbach, I., Jiang, K., and Hayama, R. (2017). Variation in the flowering gene SELF PRUNING 5G promotes day-neutrality and early yield in tomato. Nat. Genet. 49, 162–168. doi: 10.1038/ng.3733
Stortenbeker, N., and Bemer, M. (2019). The SAUR gene family: the plant’s toolbox for adaptation of growth and development. J. Exp. Bot. 70, 17–27. doi: 10.1093/jxb/ery332
Sun, T. P. (2011). The molecular mechanism and evolution of the GA-GID1-DELLA signaling module in plants. Curr. Biol. 21, R338–R345. doi: 10.1016/j.cub.2011.02.036
Sun, X., Shu, J., Ali Mohamed, A. M., Deng, X., Zhi, X., Bai, J., et al. (2019). Identification and characterization of EI (Elongated Internode) gene in tomato (Solanum lycopersicum). Int. J. Mol. Sci. 20:2204. doi: 10.3390/ijms20092204
Takagi, H., Abe, A., Yoshida, K., Kosugi, S., Natsume, S., Mitsuoka, C., et al. (2013). QTL-seq: rapid mapping of quantitative trait loci in rice by whole genome resequencing of DNA from two bulked populations. Plant J. 74, 174–183. doi: 10.1111/tpj.12105
Tomlinson, L., Yang, Y., Emenecker, R., Smoker, M., Taylor, J., Perkins, S., et al. (2018). Using CRISPR/Cas9 genome editing in tomato to create a gibberellin-responsive dominant dwarf DELLA allele. Plant Biotechnol. J. 17, 1–9. doi: 10.1111/pbi.12952
Wang, Y., Zhao, J., Lu, W., and Deng, D. (2017). Gibberellin in plant height control: old player, new story. Plant Cell Rep. 36, 391–398. doi: 10.1007/s00299-017-2104-5
Weller, J. I. (1987). Mapping and analysis of quantitative trait loci in Lycopersicon (tomato) with the aid of genetic markers using approximate maximum likelihood methods. Heredity 59, 413–421. doi: 10.1038/hdy.1987.150
Yoshida, H., Tanimoto, E., Hirai, T., Miyanoiri, Y., Mitani, R., Kawamura, M., et al. (2018). Evolution and diversification of the plant gibberellin receptor GID1. Proc. Natl. Acad. Sci. U.S.A. 115, E7844–E7853. doi: 10.1073/pnas.1806040115
Zhao, B., Wang, B., Li, Z., Guo, T., Zhao, J., Guan, Z., et al. (2019). Identification and characterization of a new dwarf locus DS-4 encoding an Aux/IAA7 protein in Brassica napus. Theor. Appl. Genet. 132, 1435–1449. doi: 10.1007/s00122-019-03290-8
Zhou, H., Wang, X., Huang, Z., Gao, J., Guo, Y., Du, Y., et al. (2016). Identification of quantitative trait loci for fruit weight, soluble solids content, and plant morphology using an introgression line population of Solanum pennellii in a fresh market tomato inbred line. Hortic. Plant J. 2, 26–34. doi: 10.1016/j.hpj.2016.02.007
Keywords: tomato (Solanum lycopersicum), plant height, quantitative trait locus, fine mapping, SlGID1a, transcriptome analysis
Citation: Liu X, Yang W, Wang J, Yang M, Wei K, Liu X, Qiu Z, Giang T, Wang X, Guo Y, Li J, Liu L, Shu J, Du Y and Huang Z (2020) SlGID1a Is a Putative Candidate Gene for qtph1.1, a Major-Effect Quantitative Trait Locus Controlling Tomato Plant Height. Front. Genet. 11:881. doi: 10.3389/fgene.2020.00881
Received: 10 April 2020; Accepted: 17 July 2020;
Published: 07 August 2020.
Edited by:
Christian Meyer, INRA UMR 1318 Institut Jean Pierre Bourgin, FranceReviewed by:
Catalina Iulia Pislariu, Texas Woman’s University, United StatesDev Paudel, University of Florida, United States
Copyright © 2020 Liu, Yang, Wang, Yang, Wei, Liu, Qiu, Giang, Wang, Guo, Li, Liu, Shu, Du and Huang. This is an open-access article distributed under the terms of the Creative Commons Attribution License (CC BY). The use, distribution or reproduction in other forums is permitted, provided the original author(s) and the copyright owner(s) are credited and that the original publication in this journal is cited, in accordance with accepted academic practice. No use, distribution or reproduction is permitted which does not comply with these terms.
*Correspondence: Yongchen Du, ZHV5b25nY2hlbkBjYWFzLmNu; Zejun Huang, aHVhbmd6ZWp1bkBjYWFzLmNu
†These authors have contributed equally to this work
‡Present address: Tong van Giang, Department of Crop Science, Faculty of Agriculture, Forestry and Fishery, Hong Duc University, Thanh Hóa, Vietnam