 Sangrea Shim1,2*
 Pil Joon Seo1,2,3*
- 1Department of Chemistry, Seoul National University, Seoul, South Korea
- 2Plant Genomics and Breeding Institute, Seoul National University, Seoul, South Korea
- 3Research Institute of Basic Sciences, Seoul National University, Seoul, South Korea
EAT-UpTF (Enrichment Analysis Tool for Upstream Transcription Factors of a group of plant genes) is an open-source Python script that analyzes the enrichment of upstream transcription factors (TFs) in a group of genes-of-interest (GOIs). EAT-UpTF utilizes genome-wide lists of TF-target genes generated by DNA affinity purification followed by sequencing (DAP-seq) or chromatin immunoprecipitation followed by sequencing (ChIP-seq). Unlike previous methods based on the two-step prediction of cis-motifs and DNA-element-binding TFs, our EAT-UpTF analysis enabled a one-step identification of enriched upstream TFs in a set of GOIs using lists of empirically determined TF-target genes. The tool is designed particularly for plant researches, due to the lack of analytic tools for upstream TF enrichment, and available at https://github.com/sangreashim/EAT-UpTF and http://chromatindynamics.snu.ac.kr:8080/EatupTF.
Introduction
The rapid development of high-throughput technologies such as RNA sequencing (RNA-seq), DNA affinity purification followed by sequencing (DAP-seq), and chromatin immunoprecipitation followed by sequencing (ChIP-seq) has led to an explosion in the availability of sequence data. The high-throughput analyses produce lists of genes that are under a particular regulation. When such lists are generated, researchers usually try to understand the biological implications of groups of genes-of-interest (GOIs). To this end, routine follow-up studies typically include gene ontology (GO) enrichment analyses (Maere et al., 2005; Huang et al., 2009) and Kyoto Encyclopedia of Genes and Genomes (KEGG) mapping (Kanehisa and Goto, 2000). In addition, transcription factor (TF) prediction analyses (Kreft et al., 2017; Kulkarni et al., 2018) can be performed to identify consensus upstream regulators of a subset of GOIs, giving a biological insight into the integrated role of the genes under specific conditions. Furthermore, comprehensive identification of TF binding sites and cognate TFs can be used to characterize regulatory networks containing GOIs.
Several bioinformatics tools have been developed to predict upstream TFs. The cis-element sequences that are commonly conserved in sets of input query genes can be identified using ab initio motif enrichment algorithms such as MEME (Bailey et al., 2009). The identified consensus sequences can be further analyzed to compare enrichment of TF candidates to the consensus binding motifs provided by databases of experimentally validated TF binding sites, such as JASPAR (Khan et al., 2018) and TRANSFAC (Matys et al., 2003). Recently, accumulating data have enabled that position weight matrix (PWM)-based enrichment methods solely cover a wide range of upstream TF prediction. This theoretical basis has been implemented in various upstream TF prediction tools, such as TFEA.ChIP, oPOSSUM, and PlantRegMap (Ho Sui et al., 2005; Puente-Santamaria et al., 2019; Tian et al., 2020). However, this approach occasionally produces a considerable number of false positives due to short and degenerate nature of TF-binding sites (Kreft et al., 2017). In addition, this method is complicated by the fact that TFs can sometimes bind to gene sequences that differ from their consensus binding sites, and that several TFs undergo protein–protein interactions that enable them to recognize additional DNA sequence motifs. Overall, it is clear that a simplified and realistic prediction of TFs controlling a group of GOIs is necessary to generate a confident conclusion.
In this regard, several bioinformatics tools implementing TF enrichment analysis have been developed using ChIP-seq datasets (Zambelli et al., 2012; Auerbach et al., 2013; Zheng et al., 2019). However, these tools are applicable mainly to animal systems, and no codes have been released to analyze enriched upstream TFs for other species. Based on explosive accumulation of plant DAP-seq and ChIP-seq data, there are growing needs to integrate the NGS data and use them to retrieve upstream TFs in plant researches. Notably, O’Malley and colleagues adapted the innovative DAP-seq method and have successfully produced a genome-wide collection of target genes for 349 TFs in Arabidopsis thaliana (O’Malley et al., 2016). In this study, we have developed the “Enrichment Analysis Tool for Upstream Transcription Factors of a group of plant genes” (EAT-UpTF) tool to provide upstream TF enrichment analysis (Shim and Seo, 2020). As a proof of concept, we combined it with the Arabidopsis DAP-seq database to analyze the enrichment of upstream TFs in a group of Arabidopsis GOIs. We found that EAT-UpTF was able to robustly evaluate the over-representation of experimentally validated upstream TFs binding to a group of GOIs without the prediction of cis-motifs.
Methods
High-throughput sequencing analyses typically produce sets of GOIs that require further analyses to evaluate their biological implication and underlying regulatory mechanisms. EAT-UpTF is linked to a DAP-seq database (Plant Cistrome database1) that provides a list of TF-target genes (locus IDs). When a set of GOIs is input in the form of locus IDs, EAT-UpTF identifies the TF targets and compares their relative enrichment in the list of GOIs with that in the total genomic genes. As a result, target genes of certain TFs, which are enriched (over-represented) in the set of GOIs can be identified as a major upstream regulators of the gene group (Figure 1). To examine the statistical significance of over-representation, the SciPy module (Oliphant, 2007) is used to perform hypergeometric and binomial tests, which differ in that the binomial test considers replacement whereas the hypergeometric test does not. These two tests are used to compare the occurrence of x genes (a subset of TF-target genes) among n genes (GOIs) with that of X genes (total TF-target genes) among N genes (total reference genes). Comparisons with relatively large differences (x/n – X/N) can then be considered to identify upstream TFs that may play a particular role in regulating at least a subset of GOIs.
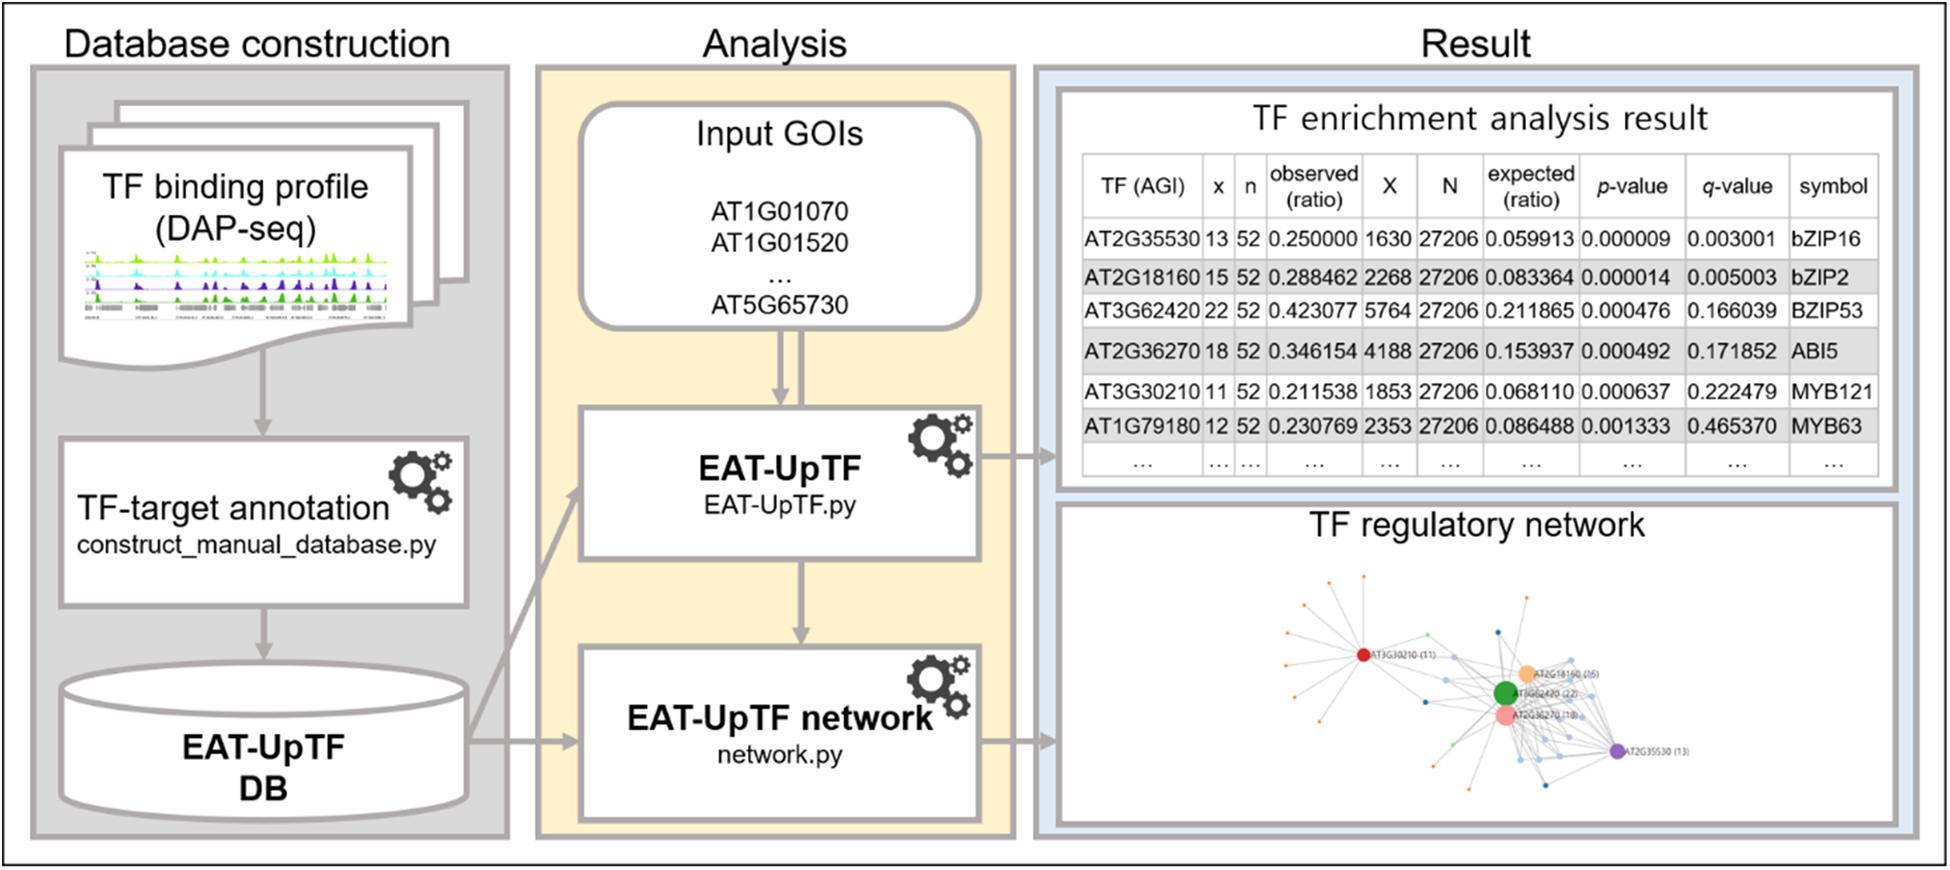
Figure 1. Workflow of EAT-UpTF. Manual database can be constructed based on binding profiles of multiple TFs generated by DAP-seq and ChIP-seq using manual database construction module (construct_manual_database.py). When a set of genes of interest (GOIs) is input along with database, EAT-UpTF performs enrichment analysis and shows the overrepresented upstream TFs for the GOIs. Network construction module (network.py) also visualizes regulatory networks of TFs and their target genes.
For the initial validation of EAT-UpTF, we used the DAP-seq Arabidopsis database, which lists the target genes of a vast majority of Arabidopsis TFs (∼349). Since EAT-UpTF performs enrichment analyses for hundreds of TFs simultaneously, a post hoc test should be applied to counteract the type I errors (false positives) originating from multiple testing. A number of post hoc analyses can be used to compensate for the increase in the false positive rate caused by multiple tests. The most widely used method is the family-wise error rate (FWER) correction, named after Carlo Emilio Bonferroni. The Bonferroni correction tests individual hypotheses at a significance level of a/m, where a is the desirable alpha level and m is the number of tests performed (Bonferroni et al., 1936; Dunn, 1961). This correction method is considered conservative when a large number of tests are conducted, but was likely appropriate in our analysis because the multiple hypothesis tests were limited to several hundreds of TFs. Another post hoc analysis option is the false discovery rate (FDR) correction described by Benjamini and Hochberg (1995). The Benjamini-Hochberg FDR correction tests hypotheses at a significance level of ka/m, where a is the desirable alpha level, m is the number of tests performed, and k is the rank of the p-value of the hypothesis. These two most popular post hoc analyses have been implemented in the current version of EAT-UpTF using the Statsmodels module of Python (Seabold and Perktold, 2010).
Results and Discussion
To validate the relevance of EAT-UpTF, we input a gene set bound by the LATE ELONGATED HYPOCOTYL (LHY) TF in Arabidopsis, which was identified via a ChIP-seq analysis (Adams et al., 2018). EAT-UpTF identified LHY as being an over-represented upstream TF in the test set. Specifically, 71.6% of the input genes were retrieved to be bound by LHY (Table 1) and LHY was identified as one of the top five enriched TFs in the test set (Table 1). The mismatch between the EAT-UpTF output and the ChIP-seq data might be related to the fact that DAP-seq is generally more stringent than ChIP-seq. Typically, DAP-seq produces a rigorous gene set and usually identifies a smaller number of TF-target genes than ChIP-seq. Indeed, all of the LHY-target genes identified by DAP-seq were included in the list of LHY-target genes identified by ChIP-seq analysis.
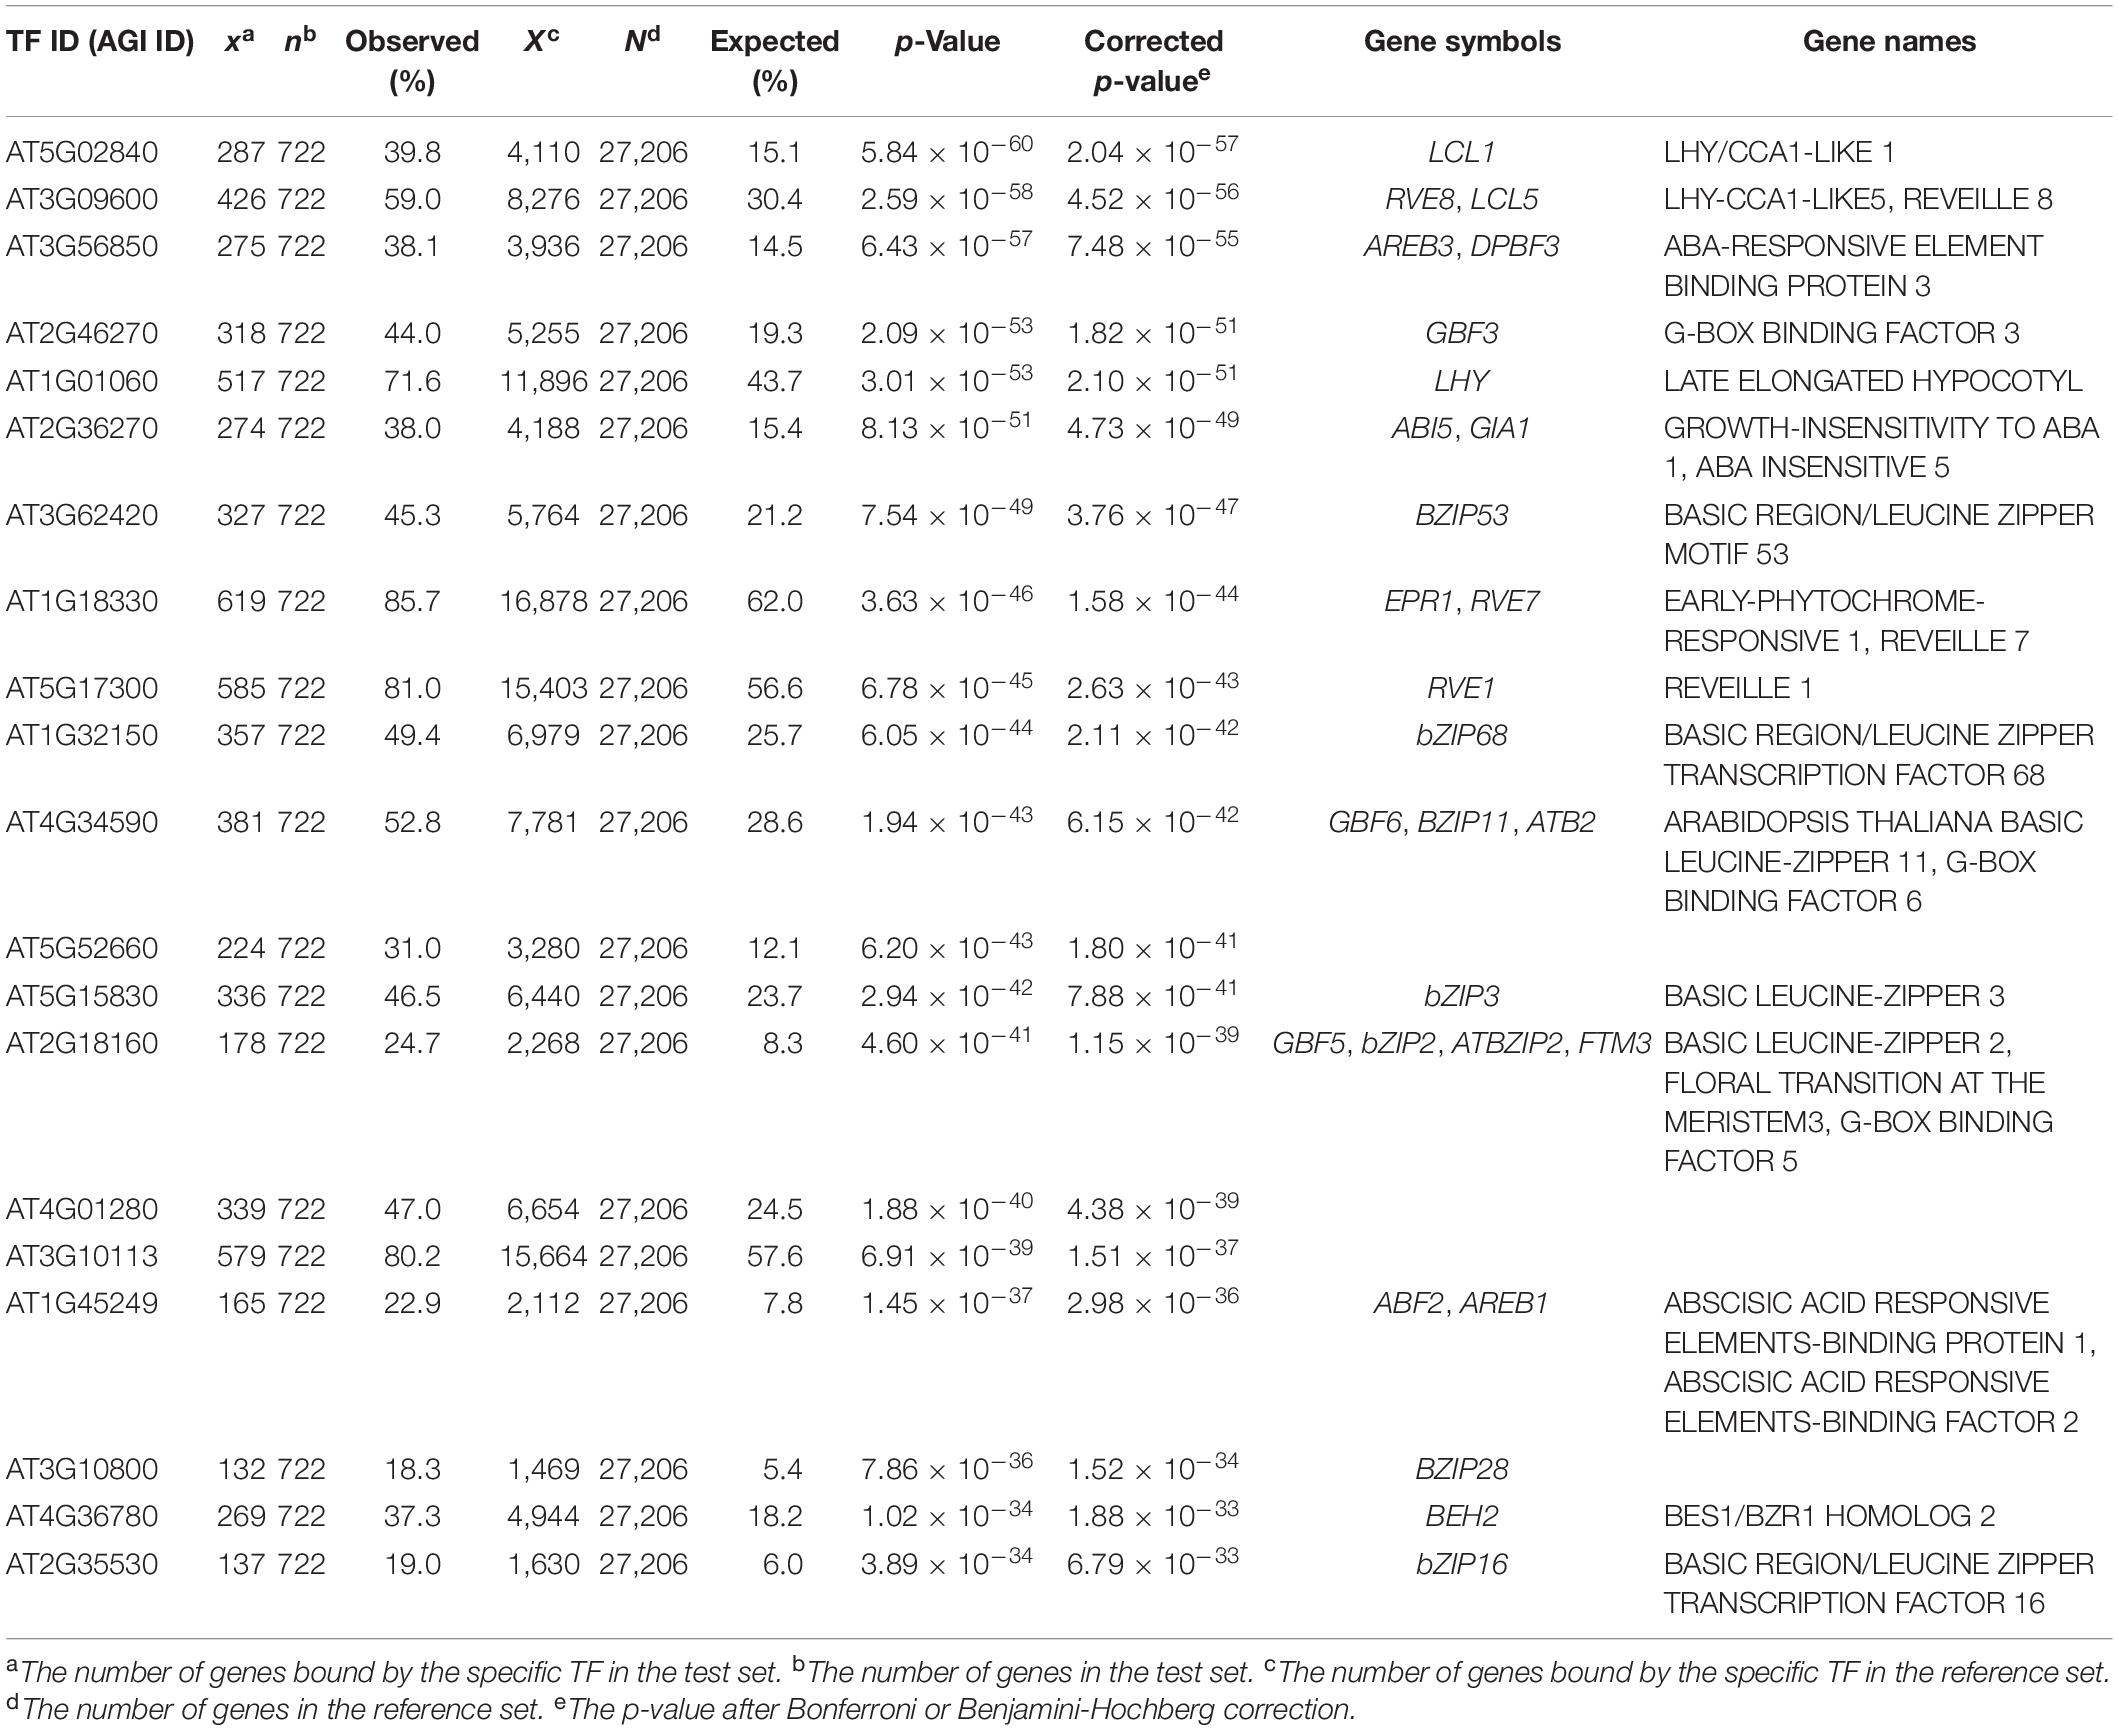
Table 1. Summary statistics of the upstream transcription factor (TF) enrichment analysis for the Arabidopsis gene set bound by LHY (Adams et al., 2018).
We also compared EAT-UpTF analysis to a conventional motif enrichment analysis for a similar purpose. DREME, a motif enrichment algorithm of MEME suite (Bailey et al., 2009), identified 33 conserved sequence motifs that can be bound by 157 TFs (Supplementary Table 1). While the LHY transcription factor was predicted, which could bind to two motifs, AAATATCK and GATATTTW (Supplementary Table 1), a vast number of additional cis-elements, which are not related to LHY, were also suggested. These results indicate that a motif enrichment analysis possibly produces a considerable number of false positives, but EAT-UpTF enables to suggest realistic upstream TFs.
To ensure whether the EAT-UpTF analysis is relevant with less stringent data set, we input DEGs in ccal lhy double mutant relative to wild type identified by RNA-seq (Kamioka et al., 2016). Again, EAT-UpTF identified LHY as an over-represented upstream TF for the input gene set (Table 2). Since CCA1 and LHY are transcriptional repressors (Kamioka et al., 2016), a significant portion of up-regulated genes in cca1 lhy was supposed to be direct targets of CCA1 and LHY. Indeed, EAT-UpTF predicted LHY as a top ranked TF for up-regulated genes in cca1 lhy double mutant (Supplementary Table 2), whereas LHY was excluded but other bZIP TFs were identified to be bound to down-regulated genes in cca1 lhy (Supplementary Table 3).
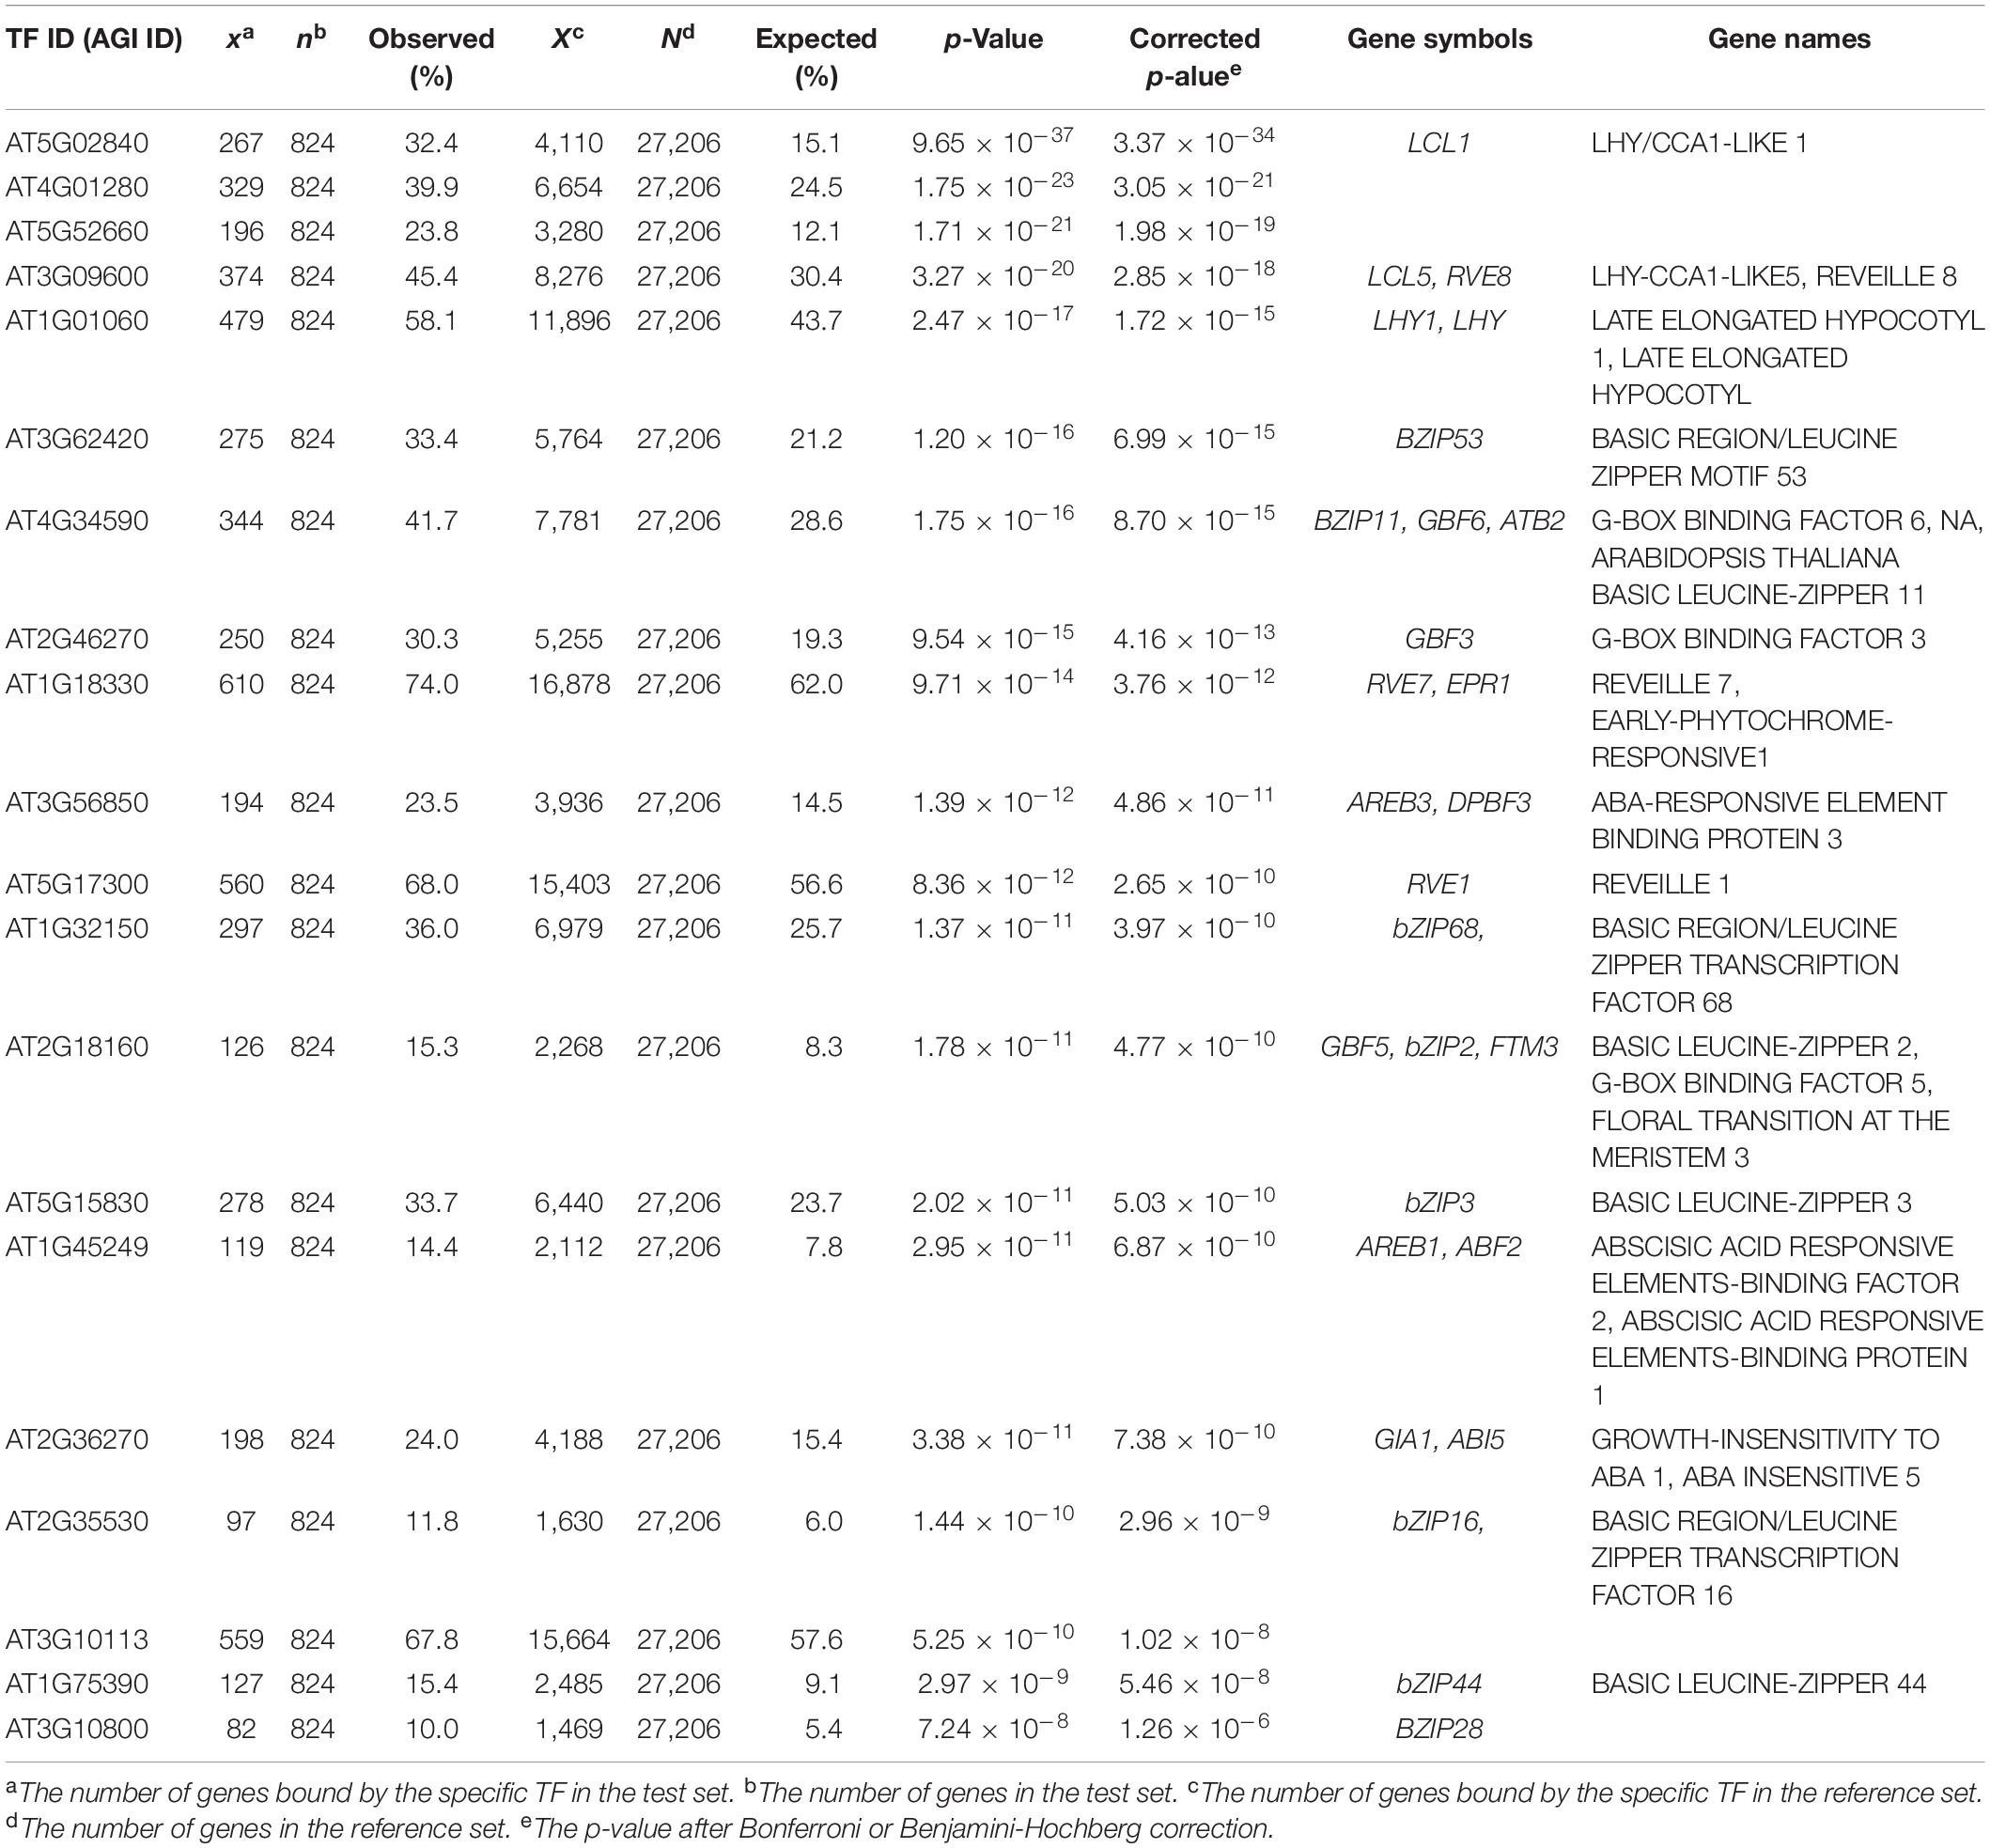
Table 2. Summary statistics of enriched upstream TFs for differentially expressed genes (DEGs) in cca1lhy double mutant (Kamioka et al., 2016).
In addition, we further examined the relevance of EAT-UpTF in upstream TF enrichment analysis using unoptimized datasets. Genes up-regulated and down-regulated in root tissues upon 1 μM IAA treatment for 6 h (Omelyanchuk et al., 2017) were used as input queries. As for the up-regulated genes, EAT-UpTF identified LATERAL ORGAN BOUNDARIES DOMAIN 19 (LBD19), LBD18 and LBD16 as upstream regulators, which are involved in auxin-dependent lateral root emergence (Feng et al., 2012) (Table 3). Meanwhile, BASIC REGION/LEUCINE ZIPPER MOTIF 53 (bZIP53) and bZIP11, which negatively regulate adventitious root formation and primary root growth in an auxin-dependent pathway (Weiste et al., 2017; Zhang et al., 2020), were retrieved as overrepresented upstream TFs for the IAA-repressed genes (Table 4). Overall, the EAT-UpTF analysis reliably identified upstream TFs for a group of GOIs. Although our study mainly focused on the enriched upstream TFs for input query genes, which provides essential interpretation of the GOIs in the context of biological pathways and networks, we cannot rule out that TFs regulating a subset of input genes are also sometimes important for estimating biological functions of GOIs, independently of statistical enrichment. Thus, EAT-UpTF can also be used for profiling all possible upstream TFs that potentially regulate GOIs.
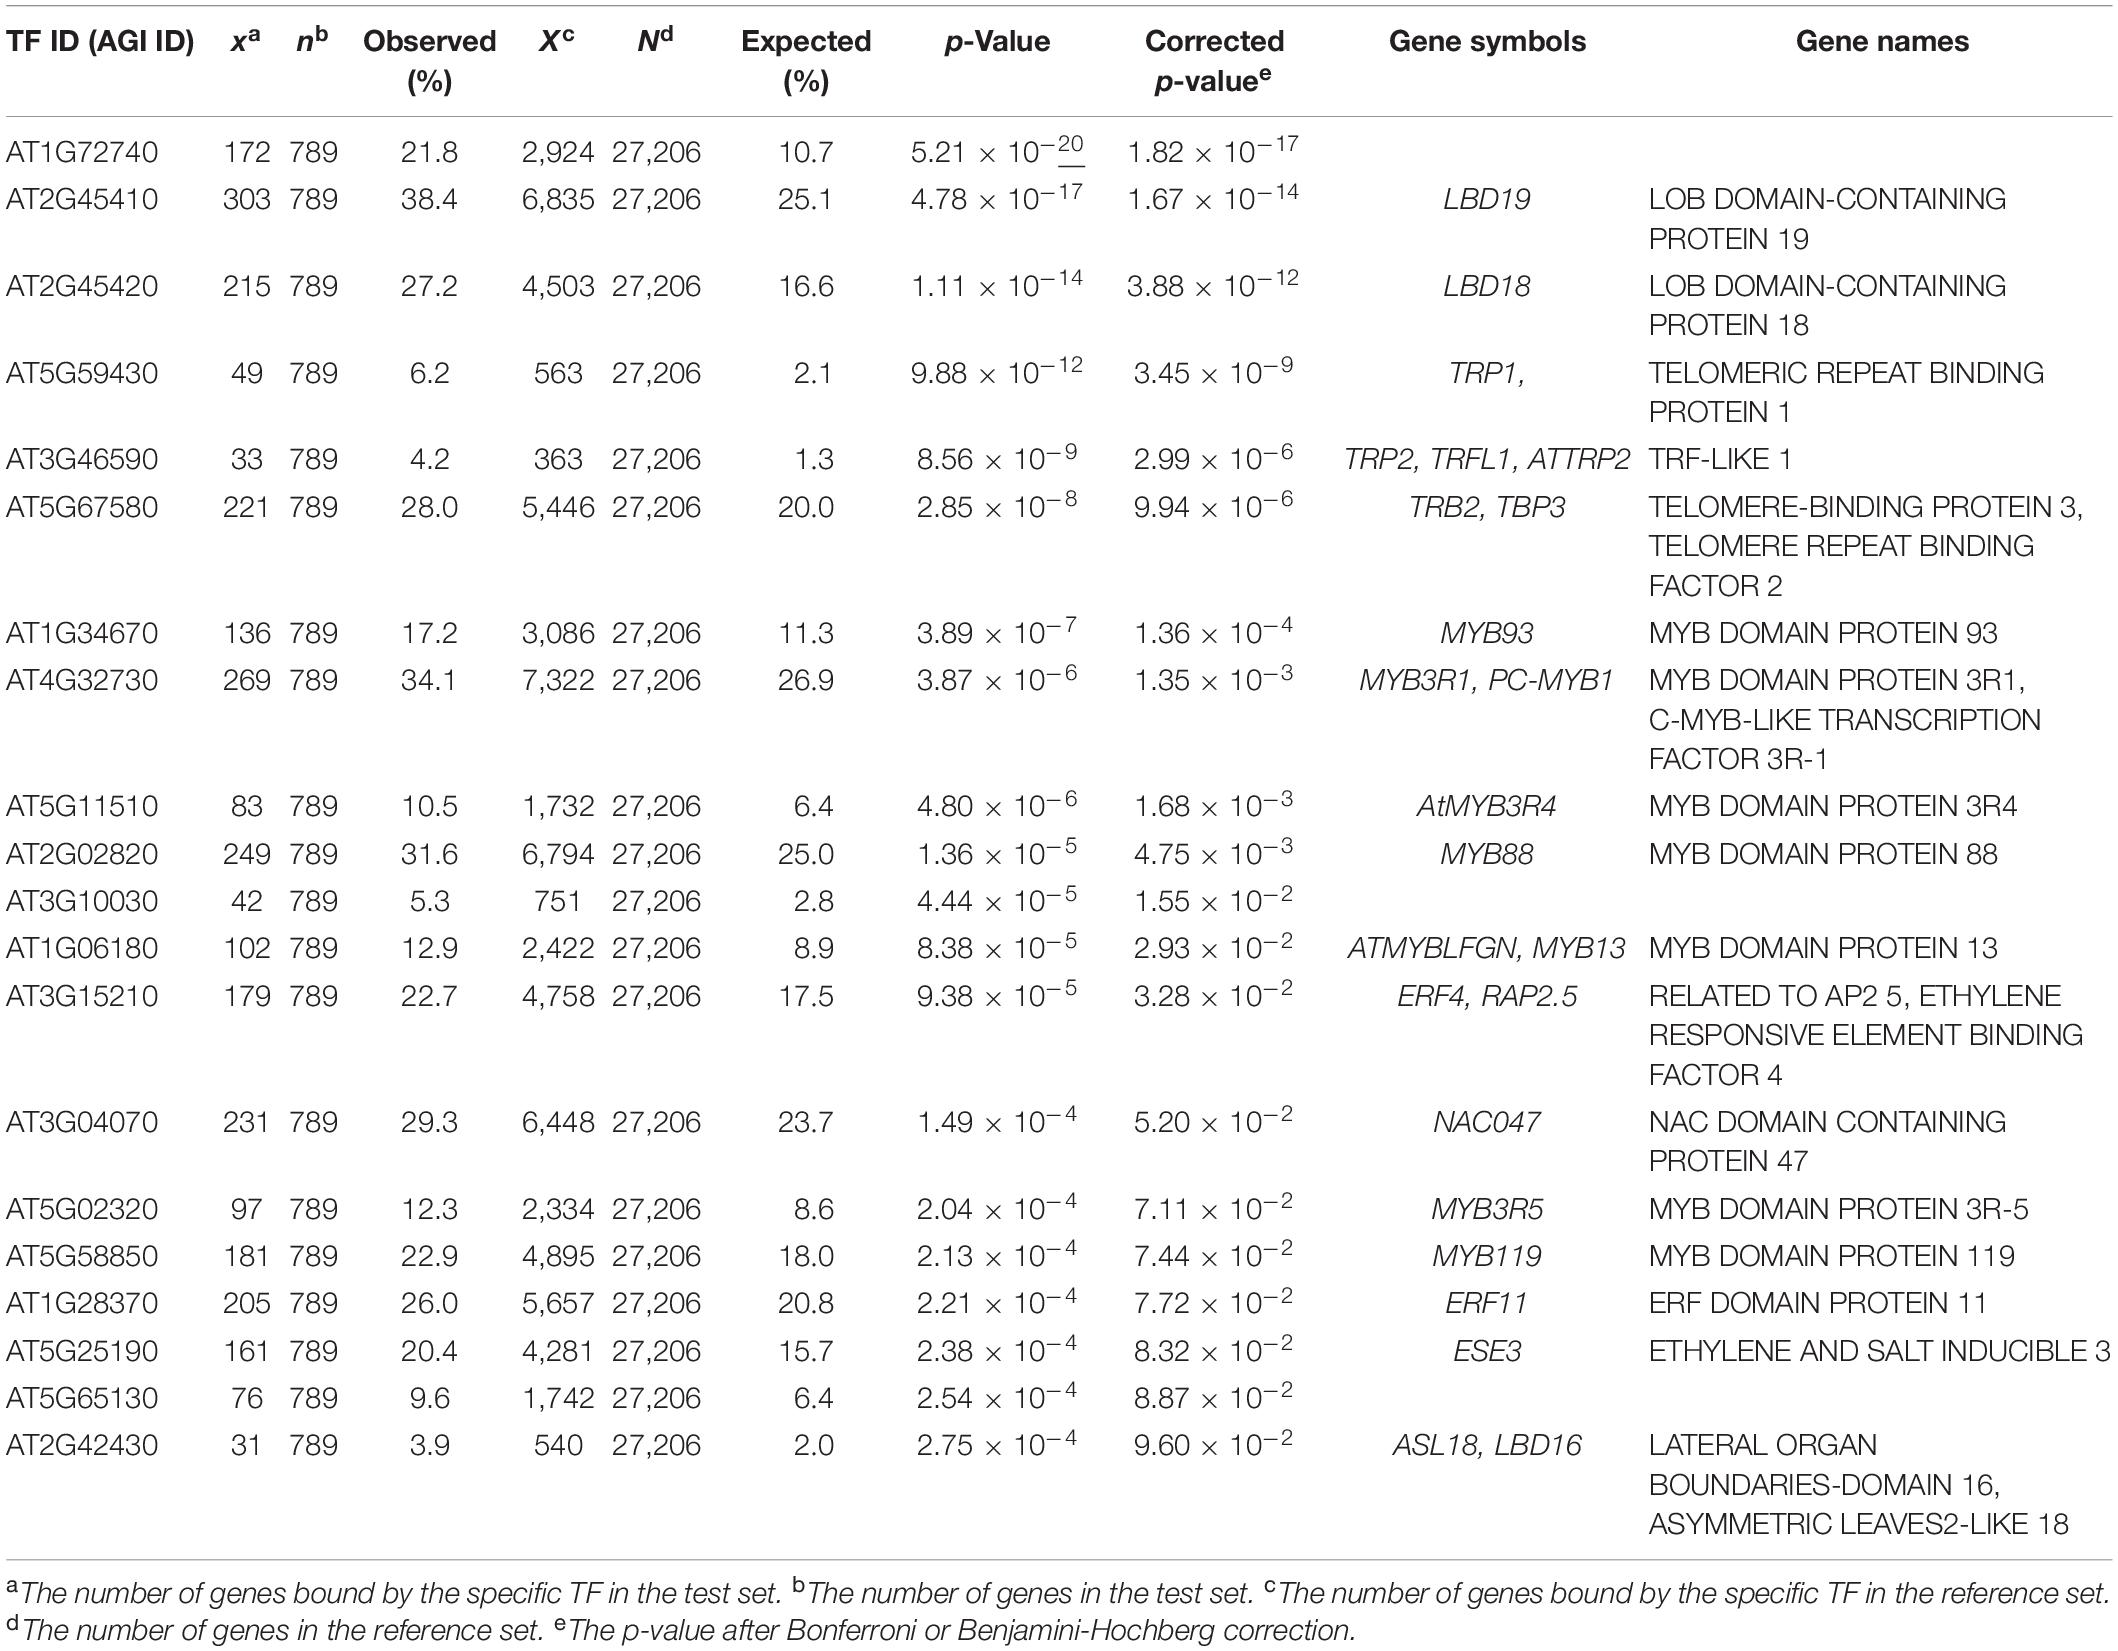
Table 3. Summary statistics of enriched upstream TFs for up-regulated genes in Arabidopsis roots upon 1 μM IAA treatment for 6 h (Omelyanchuk et al., 2017).
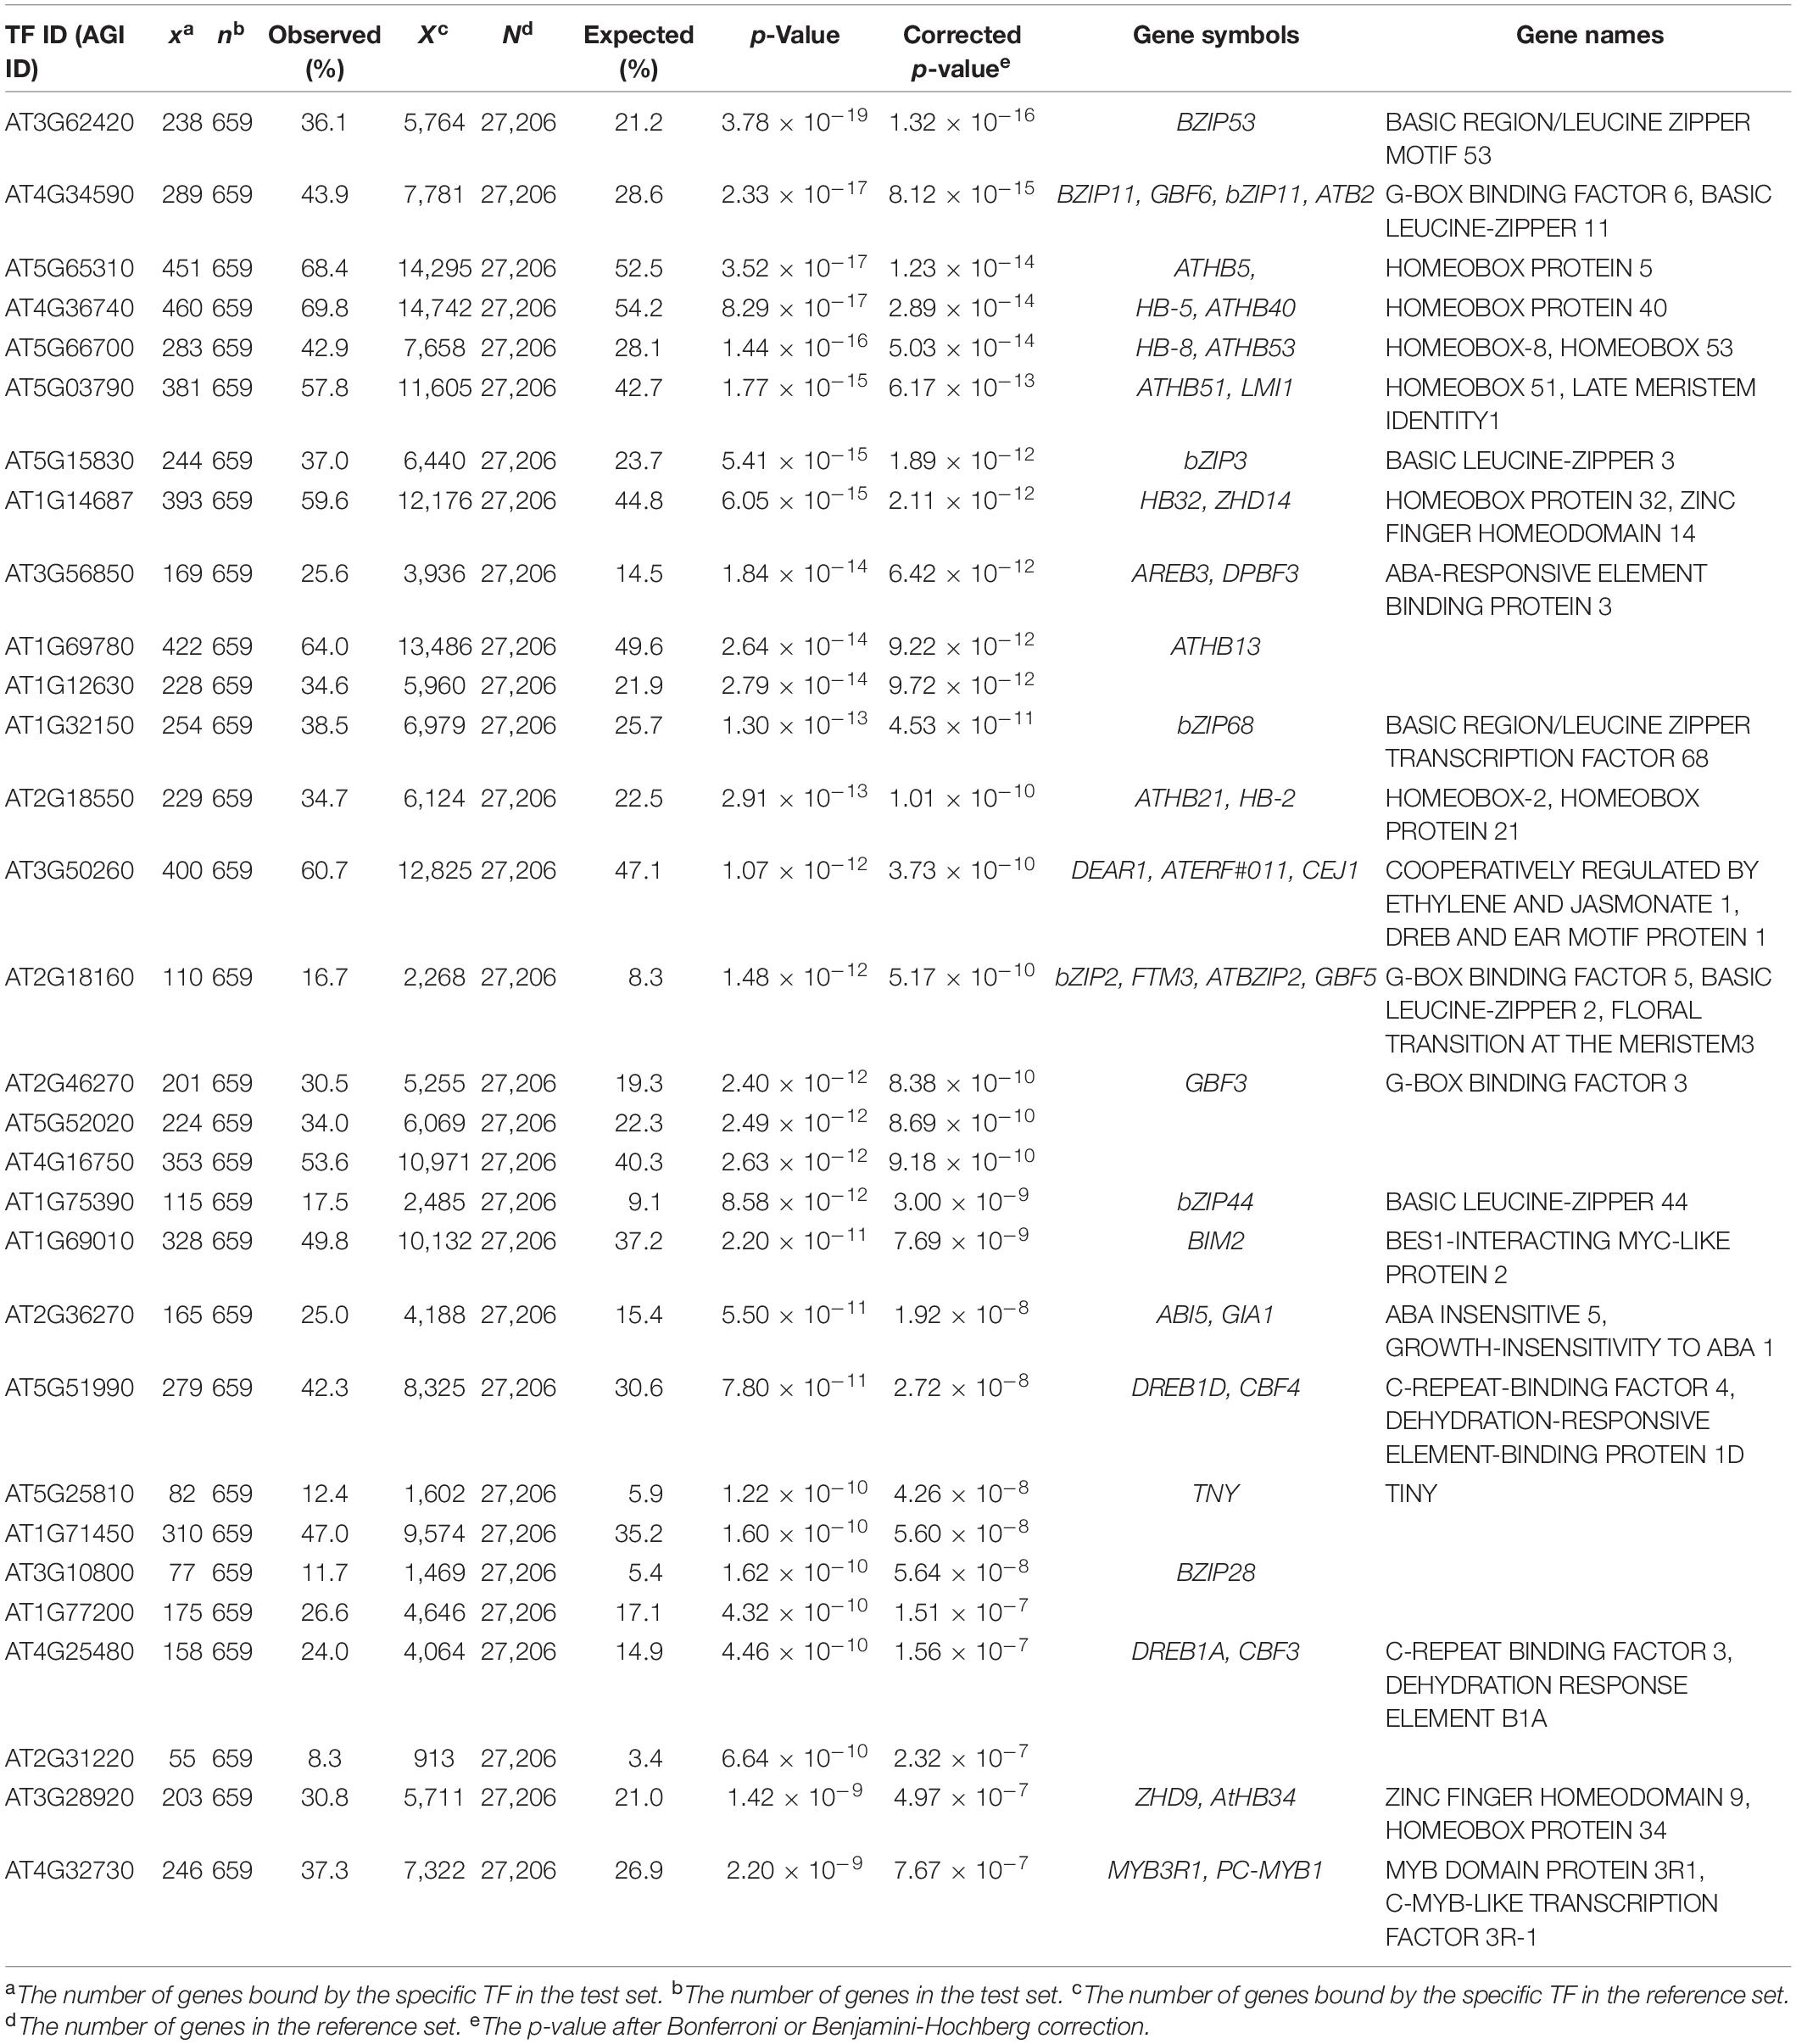
Table 4. Summary statistics of enriched upstream TFs for down-regulated genes in Arabidopsis roots upon 1μM IAA treatment for 6 h (Omelyanchuk et al., 2017).
The EAT-UpTF analysis requires the input of an experimentally validated genome-wide list of TF-target genes in the form of locus ID. As mentioned above, we used the DAP-seq Arabidopsis database for the initial validation of EAT-UpTF. However, the EAT-UpTF analysis is not limited to the use of DAP-seq data and could also employ ChIP-seq data or any database that provides a list of TF-target genes. If only ‘bed’ files for DAP-seq and ChIP-seq are available, they can be converted to the EAT-upTF input format (Figure 1; see EAT-upTF homepage). In this regard, the EAT-UpTF analysis could be expanded to any plant species for which DAP-seq, ChIP-seq, or other appropriate sequencing data are available. In the future, a large-scale database integrating DAP-seq and ChIP-seq results would aid the identification of bona fide upstream TFs for groups of GOIs. EAT-UpTF is an open platform that can be improved by integrating updated TF databases. In addition, to ensure convenience for users, TF regulatory networks of GOIs identified by EAT-UpTF can also be visualized in Cytoscape (Figure 2). Compared to the previous webtools, such as TF2Network (Kulkarni et al., 2018) and AthaMap (Steffens et al., 2004), which conduct cis-element-based construction of TF regulatory networks, EAT-UpTF involves simple and rapid processing of data without cis-element identification, and thereby promptly visualizes gene regulatory networks showing TF-target gene interactions. While processing our study, a remarkable webtool ‘Plant Regulomics’2 has been released (Ran et al., 2020), which might implement a similar logic and code of EAT-UpTF, supporting the relevance of this analysis.
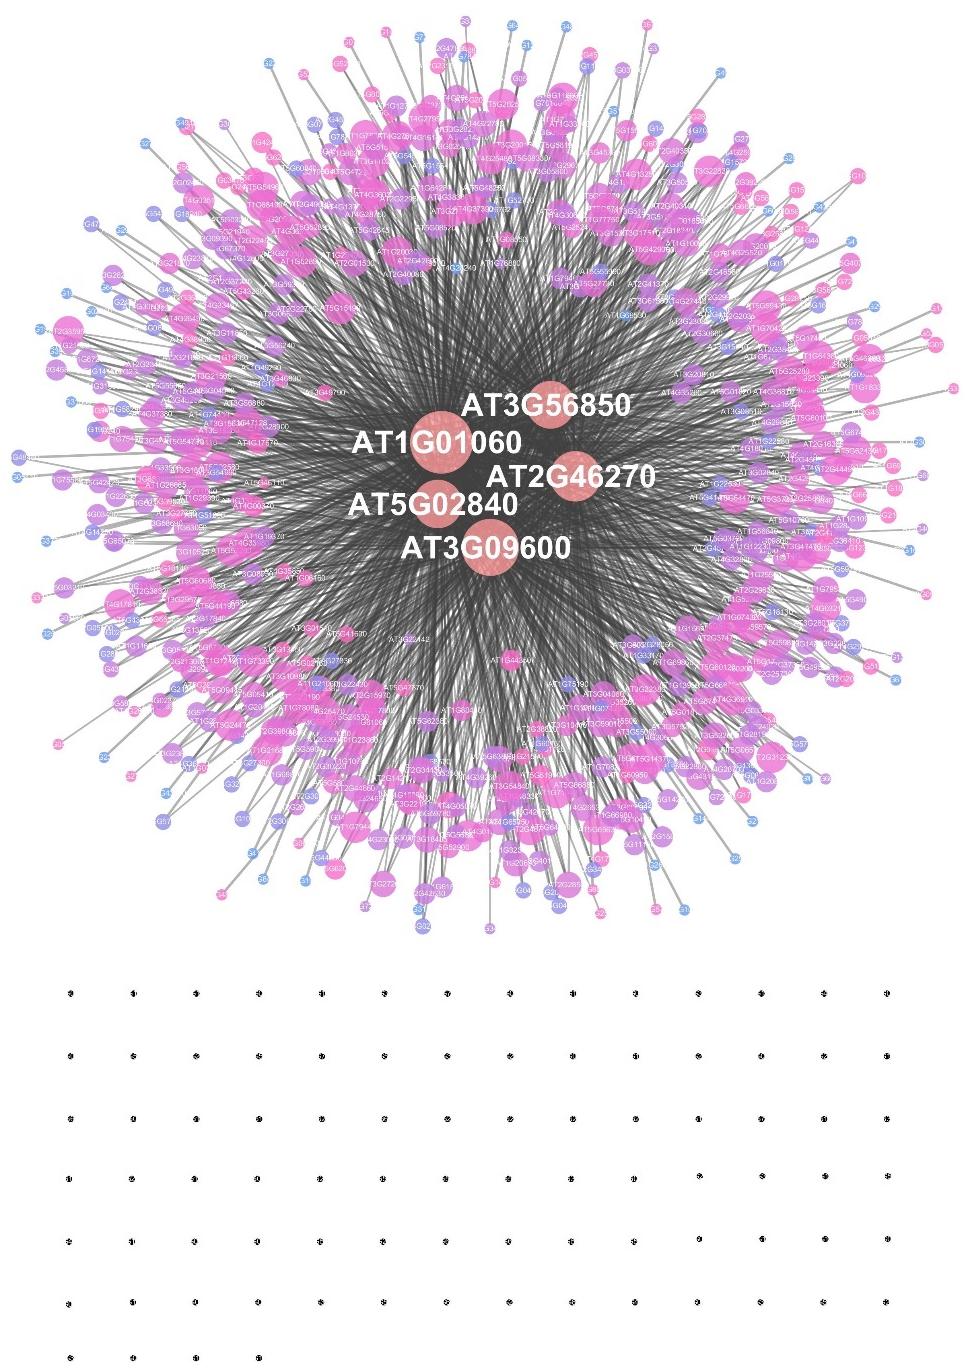
Figure 2. An example of a transcription factor regulatory network constructed by EAT-UpTF. A set of target genes of the LHY transcription factor (Adams et al., 2018) was used as a test input. The area of a node represents the edge count and the color intensity indicates the strength of the neighborhood connectivity. Black dots represent single nodes.
Conclusion
In summary, EAT-UpTF is a tool for analyzing the over-representation of upstream TFs based on the relative enrichment of TF-target genes in a group of GOIs in plants. EAT-UpTF can be used to identify upstream TFs for a group of genes without limitations on species and conservation of cis-motifs. With a regular update or manual construction of databases of TF-target genes in plant species, EAT-UpTF will become a powerful tool for TF regulatory network studies in plants. For user convenience, EAT-UpTF web service is also available at http://chromatindynamics.snu.ac.kr:8080/EatupTF.
Data Availability Statement
EAT-UpTF is available at https://github.com/sangreashim/EAT-UpTF; operating system(s): Linux, programming languages: Python3; other requirements: Python3 packages (SciPy, Statsmodels, Argparse). The EAT-UpTF home page provides detailed user manuals. EAT-UpTF is freely available. There are no restrictions on non-academics use.
Author Contributions
SS and PS: conceptualization and funding acquisition. SS: data curation and implementation and writing – original draft. PS: writing – review and editing. Both authors contributed to the article and approved the submitted version.
Funding
This work was supported by the National Research Foundation of Korea (NRF-2019R1I1A1A01061376 to SS, NRF-2019R1A2C2006915 to PS) and the Rural Development Administration (PJ01319304 to PS).
Conflict of Interest
The authors declare that the research was conducted in the absence of any commercial or financial relationships that could be construed as a potential conflict of interest.
Acknowledgments
This manuscript has been released as a pre-print at bioRXiv (doi: https://doi.org/10.1101/2020.03.22.001537) (SS and PS).
Supplementary Material
The Supplementary Material for this article can be found online at: https://www.frontiersin.org/articles/10.3389/fgene.2020.566569/full#supplementary-material
Footnotes
References
Adams, S., Grundy, J., Veflingstad, S. R., Dyer, N. P., Hannah, M. A., Ott, S., et al. (2018). Circadian control of abscisic acid biosynthesis and signalling pathways revealed by genome-wide analysis of LHY binding targets. New Phytol. 220, 893–907. doi: 10.1111/nph.15415
Auerbach, R. K., Chen, B., and Butte, A. J. (2013). Relating genes to function: identifying enriched transcription factors using the ENCODE ChIP-Seq significance tool. Bioinformatics 29, 1922–1924. doi: 10.1093/bioinformatics/btt316
Bailey, T. L., Boden, M., Buske, F. A., Frith, M., Grant, C. E., Clementi, L., et al. (2009). MEME Suite: tools for motif discovery and searching. Nucleic Acids Res. 37, W202–W208. doi: 10.1093/nar/gkp335
Benjamini, Y., and Hochberg, Y. (1995). Controlling the false discovery rate: a practical and powerful approach to multiple testing. J. R. Statist. Soc. Ser. B 57, 289–300. doi: 10.1111/j.2517-6161.1995.tb02031.x
Bonferroni, C. E., Bonferroni, C. E., Bonferroni, C., Bonferroni, C. E., and Bonferroni, C. E. (1936). Teoria Statistica Delle Classi e Calcolo Delle Probabilita’. Available online at: https://www.scienceopen.com/document?vid=06182bb9-afa9-4e09-9d1b-fe199febbe81 (accessed March 9, 2020).
Dunn, O. J. (1961). Multiple comparisons among means. J. Am. Statist. Assoc. 56, 52–64. doi: 10.1080/01621459.1961.10482090
Feng, Z., Zhu, J., Du, X., and Cui, X. (2012). Effects of three auxin-inducible LBD members on lateral root formation in Arabidopsis thaliana. Planta 236, 1227–1237. doi: 10.1007/s00425-012-1673-3
Ho Sui, S. J., Mortimer, J. R., Arenillas, D. J., Brumm, J., Walsh, C. J., Kennedy, B. P., et al. (2005). oPOSSUM: identification of over-represented transcription factor binding sites in co-expressed genes. Nucleic Acids Res. 33, 3154–3164. doi: 10.1093/nar/gki624
Huang, D. W., Sherman, B. T., and Lempicki, R. A. (2009). Systematic and integrative analysis of large gene lists using DAVID bioinformatics resources. Nat. Protoc. 4, 44–57. doi: 10.1038/nprot.2008.211
Kamioka, M., Takao, S., Suzuki, T., Taki, K., Higashiyama, T., Kinoshita, T., et al. (2016). Direct repression of evening genes by CIRCADIAN CLOCK-ASSOCIATED1 in the Arabidopsis circadian clock[OPEN]. Plant Cell 28, 696–711. doi: 10.1105/tpc.15.00737
Kanehisa, M., and Goto, S. (2000). KEGG: kyoto encyclopedia of genes and genomes. Nucleic Acids Res. 28, 27–30.
Khan, A., Fornes, O., Stigliani, A., Gheorghe, M., Castro-Mondragon, J. A., van der Lee, R., et al. (2018). JASPAR 2018: update of the open-access database of transcription factor binding profiles and its web framework. Nucleic Acids Res. 46, D260–D266. doi: 10.1093/nar/gkx1126
Kreft, L, Soete, A., Hulpiau, P., Botzki, A., Saeys, Y., and De Bleser, P. (2017). ConTra v3: a tool to identify transcription factor binding sites across species, update 2017. Nucleic Acids Res. 45, W490–W494. doi: 10.1093/nar/gkx376
Kulkarni, S. R., Vaneechoutte, D., Van de Velde, J., and Vandepoele, K. (2018). TF2Network: predicting transcription factor regulators and gene regulatory networks in Arabidopsis using publicly available binding site information. Nucleic Acids Res. 46:e31. doi: 10.1093/nar/gkx1279
Maere, S., Heymans, K., and Kuiper, M. (2005). BiNGO: a Cytoscape plugin to assess overrepresentation of gene ontology categories in biological networks. Bioinformatics 21, 3448–3449. doi: 10.1093/bioinformatics/bti551
Matys, V., Fricke, E., Geffers, R., Gößling, E., Haubrock, M., Hehl, R., et al. (2003). TRANSFAC® : transcriptional regulation, from patterns to profiles. Nucleic Acids Res. 31, 374–378. doi: 10.1093/nar/gkg108
Oliphant, T. (2007). Python for scientific computing. Comput. Sci. Eng. 9, 10–20. doi: 10.1109/MCSE.2007.58
O’Malley, R. C., Huang, S. C., Song, L., Lewsey, M. G., Bartlett, A., Nery, J. R., et al. (2016). Cistrome and epicistrome features shape the regulatory DNA landscape. Cell 165, 1280–1292. doi: 10.1016/j.cell.2016.04.038
Omelyanchuk, N. A., Wiebe, D. S., Novikova, D. D., Levitsky, V. G., Klimova, N., Gorelova, V., et al. (2017). Auxin regulates functional gene groups in a fold-change-specific manner in Arabidopsis thaliana roots. Sci. Rep. 7:2489. doi: 10.1038/s41598-017-02476-2478
Puente-Santamaria, L., Wasserman, W. W., and del Peso, L. (2019). TFEA.ChIP: a tool kit for transcription factor binding site enrichment analysis capitalizing on ChIP-seq datasets. Bioinformatics 35, 5339–5340. doi: 10.1093/bioinformatics/btz573
Ran, X., Zhao, F., Wang, Y., Liu, J., Zhuang, Y., Ye, L., et al. (2020). Plant regulomics: a data-driven interface for retrieving upstream regulators from plant multi-omics data. Plant J. 101, 237–248. doi: 10.1111/tpj.14526
Seabold, S., and Perktold, J. (2010). “Statsmodels: econometric and statistical modeling with python,” in Proceedings of the 9th Python in Science Cone, New York, NY.
Shim, S., and Seo, P. J. (2020). EAT-UpTF: enrichment analysis tool for upstream transcription factors of a gene group. bioRxiv [Preprint], doi: 10.1101/2020/.03.22.001537
Steffens, N. O., Galuschka, C., Schindler, M., Bülow, L., and Hehl, R. (2004). AthaMap: an online resource for in silico transcription factor binding sites in the Arabidopsis thaliana genome. Nucleic Acids Res. 32, D368–D372. doi: 10.1093/nar/gkh017
Tian, F., Yang, D.-C., Meng, Y.-Q., Jin, J., and Gao, G. (2020). PlantRegMap: charting functional regulatory maps in plants. Nucleic Acids Res. 48, D1104–D1113. doi: 10.1093/nar/gkz1020
Weiste, C., Pedrotti, L., Selvanayagam, J., Muralidhara, P., Fröschel, C., Novák, O., et al. (2017). The Arabidopsis bZIP11 transcription factor links low-energy signalling to auxin-mediated control of primary root growth. PLoS Genet. 13:e006607. doi: 10.1371/journal.pgen.1006607
Zambelli, F., Prazzoli, G. M., Pesole, G., and Pavesi, G. (2012). Cscan: finding common regulators of a set of genes by using a collection of genome-wide ChIP-seq datasets. Nucleic Acids Res. 40, W510–W515. doi: 10.1093/nar/gks483
Zhang, Y., Yang, X., Cao, P., Xiao, Z., Zhan, C., Liu, M., et al. (2020). The bZIP53-IAA4 module inhibits adventitious root development in Populus. J. Exp. Bot. 71, 3485–3498. doi: 10.1093/jxb/eraa096
Keywords: transcription factor, cis-elements, plant, Arabidopsis, DAP-seq
Citation: Shim S and Seo PJ (2020) EAT-UpTF: Enrichment Analysis Tool for Upstream Transcription Factors of a Group of Plant Genes. Front. Genet. 11:566569. doi: 10.3389/fgene.2020.566569
Received: 02 June 2020; Accepted: 17 August 2020;
Published: 11 September 2020.
Edited by:
Nunzio D’Agostino, University of Naples Federico II, ItalyReviewed by:
Federico Zambelli, University of Milan, ItalyJose M. Franco-Zorrilla, National Center for Biotechnology (CNB), Spain
Yang Jae Kang, Gyeongsang National University, South Korea
Copyright © 2020 Shim and Seo. This is an open-access article distributed under the terms of the Creative Commons Attribution License (CC BY). The use, distribution or reproduction in other forums is permitted, provided the original author(s) and the copyright owner(s) are credited and that the original publication in this journal is cited, in accordance with accepted academic practice. No use, distribution or reproduction is permitted which does not comply with these terms.
*Correspondence: Sangrea Shim, c2FuZ3JlYXNoaW1AZ21haWwuY29t; Pil Joon Seo, cGpzZW8xQHNudS5hYy5rcg==