 Netsanet Z. Gebrehiwot1*
 Hassan Aliloo1
 Eva M. Strucken1
 Karen Marshall2
 Mohammad Al Kalaldeh1Ayao Missohou3
 John P. Gibson1*
- 1Centre for Genetic Analysis and Applications, School of Environmental and Rural Science, University of New England, Armidale, NSW, Australia
- 2International Livestock Research Institute and Centre for Tropical Livestock Genetics and Health, Nairobi, Kenya
- 3L‘École Inter-États des Sciences et Médecine Vétérinaires de Dakar (EISMV), Dakar, Senegal
Several studies have evaluated computational methods that infer the haplotypes from population genotype data in European cattle populations. However, little is known about how well they perform in African indigenous and crossbred populations. This study investigates: (1) global and local ancestry inference; (2) heterozygosity proportion estimation; and (3) genotype imputation in West African indigenous and crossbred cattle populations. Principal component analysis (PCA), ADMIXTURE, and LAMP-LD were used to analyse a medium-density single nucleotide polymorphism (SNP) dataset from Senegalese crossbred cattle. Reference SNP data of East and West African indigenous and crossbred cattle populations were used to investigate the accuracy of imputation from low to medium-density and from medium to high-density SNP datasets using Minimac v3. The first two principal components differentiated Bos indicus from European Bos taurus and African Bos taurus from other breeds. Irrespective of assuming two or three ancestral breeds for the Senegalese crossbreds, breed proportion estimates from ADMIXTURE and LAMP-LD showed a high correlation (r ≥ 0.981). The observed ancestral origin heterozygosity proportion in putative F1 crosses was close to the expected value of 1.0, and clearly differentiated F1 from all other crosses. The imputation accuracies (estimated as correlation) between imputed and the real data in crossbred animals ranged from 0.142 to 0.717 when imputing from low to medium-density, and from 0.478 to 0.899 for imputation from medium to high-density. The imputation accuracy was generally higher when the reference data came from the same geographical region as the target population, and when crossbred reference data was used to impute crossbred genotypes. The lowest imputation accuracies were observed for indigenous breed genotypes. This study shows that ancestral origin heterozygosity can be estimated with high accuracy and will be far superior to the use of observed individual heterozygosity for estimating heterosis in African crossbred populations. It was not possible to achieve high imputation accuracy in West African crossbred or indigenous populations based on reference data sets from East Africa, and population-specific genotyping with high-density SNP assays is required to improve imputation.
Introduction
Indigenous cattle in Africa are an important genetic resource for diverse human communities, providing products and by-products, such as food, wealth, and economic security (Okomo-Adhiambo, 2002). Genetic improvement programs using artificial selection within the local population are one method to improve productivity (Effa et al., 2009; Tegegne et al., 2010). Crossbreeding of locally adapted cattle with high-yielding European dairy breeds is an alternative strategy to improve productivity and improve the livelihoods of African smallholder farmers in a relatively short period (Wuletaw, 2004; Tegegne et al., 2010). Crossbreeding can increase dairy cattle production by creating new combinations of genotypes of different breeds to optimize the additive and heterotic genetic expression and achieve the desired balance of productivity and adaptation trait expression (Gregory and Cundiff, 1980; Simm, 1998).
The level of extra heterosis in crossbreds compared to purebreds is a function of the degree of heterozygosity for the origin of alleles from the ancestral populations, referred to as ancestral origin heterozygosity in this study. In a homogeneous crossbred population that results entirely from inter-se crossing, the level of ancestral origin heterozygosity is a function of the breed composition. In other crossbred populations, the level of ancestral origin heterozygosity depends on the breed composition of the parents of an individual (McAllister, 2002). For example, an F1 cross has an ancestral origin heterozygosity of 1.0, which is twice the ancestral origin heterozygosity and hence twice the expected heterosis of an F2 cross, even though they have identical breed composition. In order to estimate the level of heterosis in crossbred populations, one needs to have an estimate of the ancestral origin heterozygosity for each individual that is recorded and available for genomic evaluation. An estimate of breed composition and ancestral origin heterozygosity can be obtained from complete pedigree information, but pedigree information is unavailable in most smallholder crossbred dairy populations (Rege, 2001). An alternative is to genotype animals for large numbers of SNPs and use this information to estimate breed composition and heterozygosity.
Molecular genetic markers, most recently SNPs, can be used to estimate the genetic ancestry of individuals. Methods embedded in software such as ADMIXTURE (Alexander et al., 2009) or STRUCTURE (Pritchard et al., 2000; Falush et al., 2003) estimate global ancestry, i.e., the ancestral breed proportions averaged across the whole genome. These software programs do not provide estimates of ancestral origin heterozygosity. Methods such as Lanc-CSV (Brown and Pasaniuc, 2014), LAMP-LD (Pasaniuc et al., 2009; Baran et al., 2012), and MULTIMIX (Churchhouse and Marchini, 2013) provide estimates of local ancestry, i.e., the breed origin of haplotypes, and hence breed proportion at every point in the genome. This allows ancestral origin heterozygosity to be estimated at every point in the genome and hence also the average ancestral origin heterozygosity of an individual.
Local ancestry mapping, using the LAMP software (Sankararaman et al., 2008), was employed in African cattle populations by Flori et al. (2014) and Bahbahani et al. (2015) to examine whether their SNP-based signatures of selection showed a bias to either of the two assumed ancestral populations. The LAMP software was also used by Khayatzadeh et al. (2018) to assign ancestral origin of SNP genotypes in a European admixed cattle population, allowing SNP dominance effects and epistatic loss to be estimated. The African populations we study here evolved from one or two (African Bos taurus and African zebu, respectively) or three (crossbred dairy populations) principal ancestral populations. We used LAMP-LD, which performs better than LAMP when there are more than two ancestral populations (Baran et al., 2012) to estimate global and local ancestry in these populations.
Crossbreeding and selection are important synergic approaches to improve production in the long-term. In the absence of pedigree recording in most indigenous and crossbred dairy populations, high-density SNP genotypes can be used to generate a genomic relationship matrix (GRM), enabling genetic improvement to be rapidly implemented (VanRaden, 2008). However, genomic selection requires the routine genotyping of a large number of recorded individuals and selection candidates, which can be expensive. A strategy to increase genotypic information while reducing testing costs is to genotype a large number of individuals with a lower-density assay and impute to higher density genotypes (Khatkar et al., 2012; Wiggans et al., 2012; Berry et al., 2014).
Several software programs have been developed for SNP imputation. These are mainly based either on linkage disequilibrium (LD) information such as Beagle (Browning and Browning, 2007), IMPUTE2 (Howie et al., 2009), MaCH (Li et al., 2010), Minimac (Howie et al., 2012); or on a combination of LD and family or pedigree information such as Dagphase (Druet and Georges, 2010), FImpute (Sargolzaei et al., 2011), AlphaImpute (Hickey et al., 2012), and FindHap (VanRaden et al., 2011).
Recently, Aliloo et al. (2018) assessed the genotype imputation accuracy in 3,083 East African crossbred cattle genotyped with the Illumina 777k SNP assay, using FImpute v2.2 (Sargolzaei et al., 2014), Beagle v4.1 (Browning and Browning, 2016), and Minimac v3 (Das et al., 2016) and found that Minimac v3 and a reference set that combines crossbred and ancestral purebred animals generally gave the highest accuracy of imputations. But this study provided no information about whether data from East African crossbreds would be useful in the imputation of other crossbred populations in Africa or for indigenous populations. The accuracy of genotype imputation across populations is highly affected by the LD and persistence of the LD phase between populations, which has not been assessed for African indigenous or crossbred populations. Berry and Kearney (2011) have documented that the degree of relationship between validation and reference populations is one of the factors affecting imputation accuracy. Therefore, it is necessary to estimate the ancestral background of the indigenous and crossbred populations to make an informed decision about which animals and breeds to best use as reference populations.
The overall objective of the current study was to assess the ability to infer genotypes and genotype ancestry in African populations based on diverse and local information as enablers of a range of genetic improvement applications. The study investigates: (1) Inference of global and local ancestry in West African crossbreds to obtain substantially more information on their genetic history. ADMIXTURE and PC analyses were performed to estimate the global ancestry, while LAMP-LD was used for local ancestry inference with different approaches in West African crossbreds. We then compared the performance of global and local ancestry inference methods; (2) Estimation of ancestral origin and individual heterozygosity proportions in West African crossbreds. The ancestral origin heterozygosity proportion was calculated from the local ancestry inferences obtained from LAMP-LD, while the individual heterozygosity was calculated across all loci which are heterozygous; (3) Accuracy of genotype imputation in African indigenous and West African crossbred cattle populations when imputing from low and medium-density to high-density SNP panels, using East and West African reference populations separately or combined. This is the first imputation study considering African indigenous and West African crossbred populations.
Materials and Methods
Animals
SNP genotype data of 4,291 animals representing European Bos taurus dairy breeds, East and West African indigenous and crossbred dairy cattle sampled from different countries were used for this study (Table 1). These data were obtained from several public-domain databases, plus projects run by the International Livestock Research Institute (ILRI) and collaborators (Marshall et al., 2017, 2020; Ema et al., 2018), and the Genomics Reference Resource for African Cattle (GRRFAC) supported by the Centre for Tropical Livestock Genetics and Health (CTLGH), and the Dairy Genetics East Africa project (DGEA; Strucken et al. (2017). The breed classifications of the West African crossbred animals were based on farmers’ and enumerators’ assumptions as well as, where available, recorded sire and dam information. These crossbred animals were classified as undefined crossbreds or as crosses between the local breed Gobra with Holstein-Friesian, Montbéliarde, or Normande.
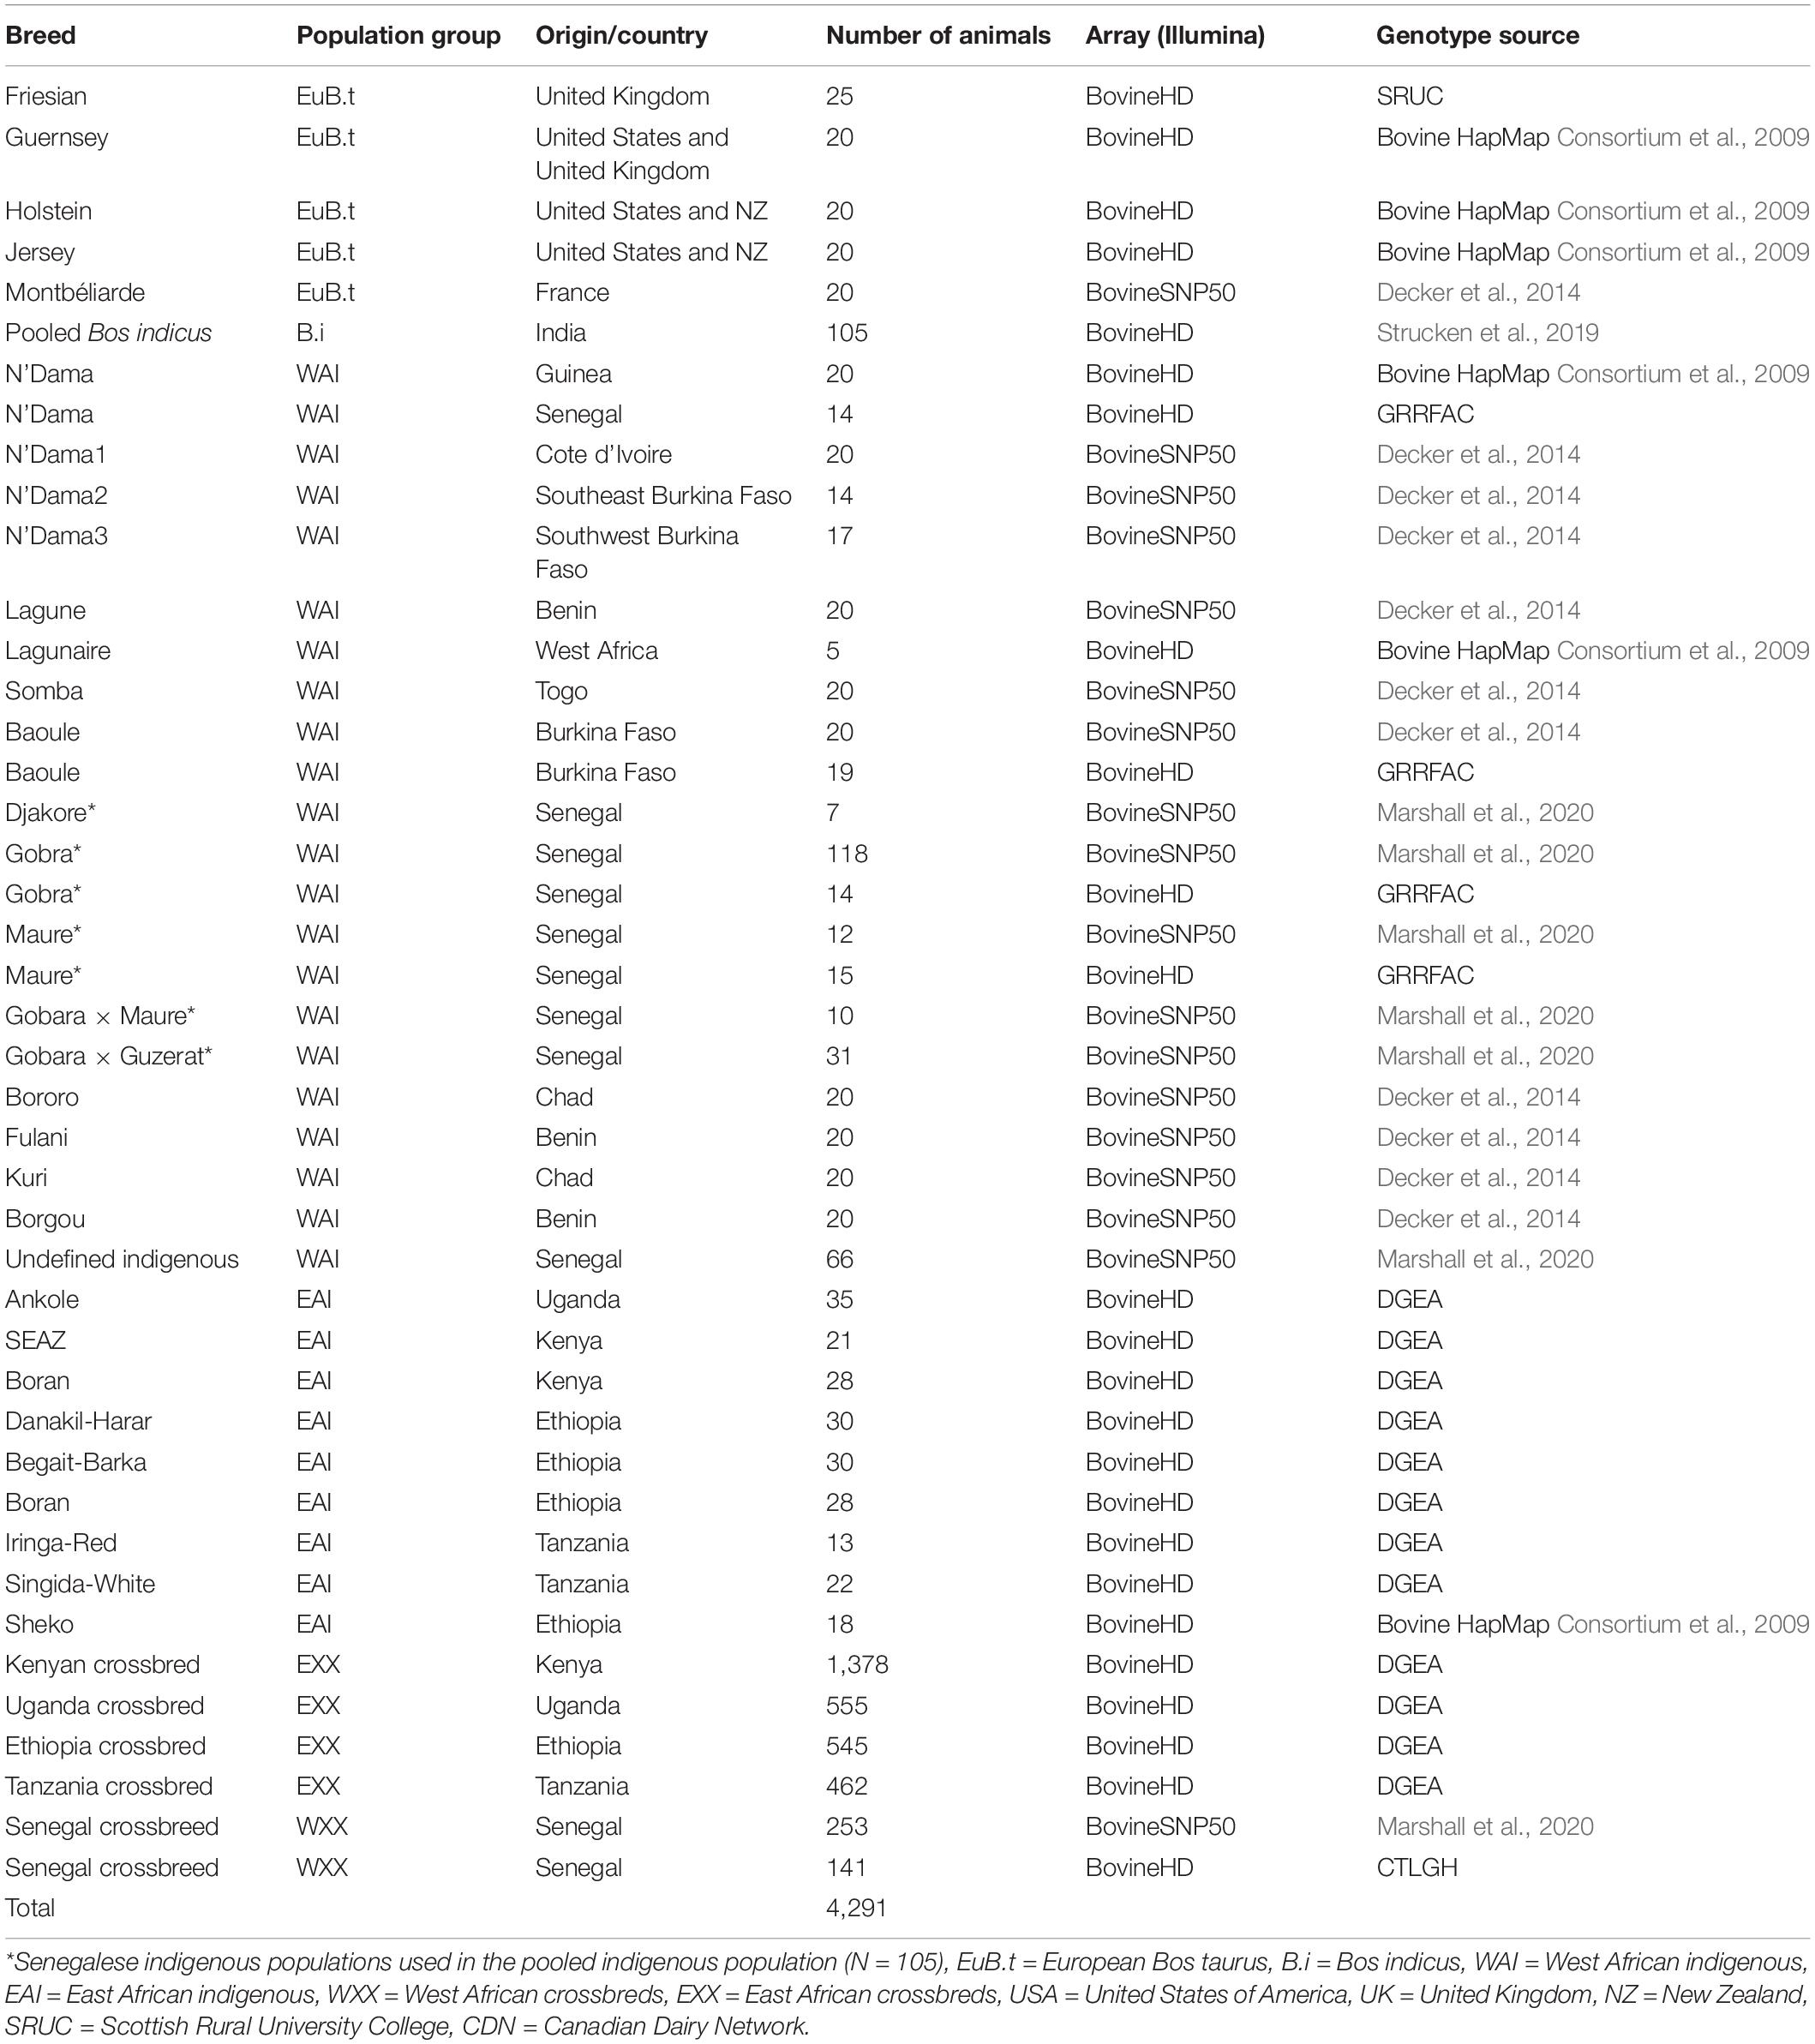
Table 1. Animal populations, numbers, and sources.
Genotyping and Quality Control
The samples were genotyped on either the Illumina BovineSNP50 BeadChip array (Illumina Inc., San Diego, CA, USA) comprising 54,609 SNPs or the Illumina BovineHD Beadchip (Illumina Inc., San Diego, CA, USA) containing 777,962 SNPs, as presented in Table 1. Data from the Bovine HapMap Consortium et al. (2009) and the 50k data from Decker et al. (2014) were obtained post quality control. Genotypes from the DGEA project and Scotland’s Rural College (SRUC) data were filtered using “SNPQC” an R pipeline (Gondro et al., 2014), retaining SNPs that had a median GC score >0.6 and a call rate >90%. The data from Senegal smallholder farms (Marshall et al., 2017, 2020; Ema et al., 2018) were processed for quality control using the GenABEL package (Aulchenko et al., 2007) in R Core Team (2018), retaining SNPs and animals with call rates >90%. Data from CTLGH and GRRFAC were quality controlled, including a median GC score >0.6 and a call rate >0.90%. In all datasets, only autosomal SNPs were included in this study.
The datasets were merged, keeping only common SNPs (37,632 SNPs) between the reference (detailed below) and West African crossbred populations for inference of global and local ancestry and estimates of heterozygosity proportions (dataset 1). For the genotype imputation, SNPs that had a minor allele frequency (MAF) lower than 0.01 were removed from medium and high-density datasets. FImpute V 2.2 (Sargolzaei et al., 2014) was used to impute the sporadically missing genotypes of individuals to have complete datasets for all animals at all loci. The number of SNPs retained was 28,649 from medium-density (dataset 2), and 621,309 SNPs from high-density panels (dataset 3) across 29 B. taurus autosomes based on UMD 3.1 genome assembley (Zimin et al., 2009).
Global Ancestry Inference of West African Crossbred Animals
The global ancestry inference is important to estimate the fraction of ancestry contributed by each ancestral population as averaged across the entire genome. In this study, the global ancestry inference was undertaken using Senegalese (West African) crossbred populations. The reference populations were African B. taurus breeds (N’Dama, N’Dama1, Lagune, Baoule, and Lagunaire, N = 87), European B. taurus dairy breeds (Guernsey, Holstein, Jersey, Friesian, and Montbéliarde, N = 105), and a pooled Bos indicus population (N = 105). The pooled Bos indicus sample included 12 Bos indicus breeds from India, selected from 525 indigenous samples such that within breed relationships were minimal (Aliloo et al., 2020). The pooled indigenous reference population was from Senegal (Gobra, Maure, Djakore, hybrid animals between Gobra and Maure, and Gobra and Guzerat, N = 105), and the number of indigenous animals were reduced to make similar population size with other reference groups (also used in heterozygosity estimation). The African B. taurus, Bos indicus, and indigenous reference animals are those with zero European B. taurus breed proportion as determined by prior ADMIXTURE and PC analyses (Gebrehiwot, 2020; Gebrehiwot et al., 2020).
A maximum likelihood model, as implemented in the software ADMIXTURE 1.23 (Alexander et al., 2009), was used to estimate the global ancestry proportions of crossbred animals. ADMIXTURE was used in two alternatives supervised analyses where the ancestral reference populations were a pooled sample of European B. taurus and a pooled sample of indigenous breeds from Senegal (two-way admixture) (1), and African B. taurus populations, Bos indicus, and European B. taurus dairy breeds (three-way admixture) (2). These reference populations were chosen based on the ancestral information of Senegalese crossbreds as detailed by Gebrehiwot et al. (2020) and Gebrehiwot (2020).
The principal component analysis (PCA) was performed to explore and visualize the genetic variation between West African indigenous and crossbred animals and the reference populations. The PCA was based on a GRM constructed from SNP data according to the first method of VanRaden (2008) and calculated as:
where the scaling parameter d was:
The centered genotype matrix (Z) was constructed by subtracting the P matrix from the genotype matrix M, where P = 2*(pi−0.5), and pi is the allele frequency at locus i.
Local Ancestry Estimation in West African Crossbred Animals
The genome of admixed individuals resembles a mosaic of chromosomal regions originating from different ancestral populations. Finding the regional ancestry at each genomic location provides more information than the usual estimation of global ancestry alone (Padhukasahasram, 2014). Here, LAMP-LD software (Pasaniuc et al., 2009; Baran et al., 2012) was used to estimate the locus-specific ancestry of West African crossbreds in two scenarios of ancestry mapping. The two scenarios were two-way and three-way admixtures, using the same ancestral populations as for the global ancestry inference (see above). To infer the local ancestry, the dataset was first phased using Eagle v2.3.5 (Loh et al., 2016). The local ancestries of admixed animals were obtained from LAMP-LD with a window size of 12 SNPs and 15 as the number of states. LAMP-LD infers the ancestry in each window based on a likelihood model to trace the origins of admixed populations based on the haplotype patterns in ancestral reference populations.
Estimation of Heterozygosity Proportion
Estimation of heterozygosity proportion in West African crossbred populations was undertaken using two approaches. Individual heterozygosity was calculated across all loci, scored as “1” if an individual was heterozygous at a locus and “0” for each homozygous locus; the mean across all loci was then recorded. The ancestral origin heterozygosity proportion was calculated from the local ancestry inferences obtained from LAMP-LD. Each haplotype of a given crossbred individual was scored as “1” if it was a heterozygous state of European B. taurus and indigenous ancestry (two-way), or African B. taurus or Bos indicus versus European B. taurus ancestry (three-way), and scored “0” otherwise. The sum of these scores was divided by the number of loci to obtain the average ancestral origin heterozygosity across the genome.
Upper and Lower Limits of Heterozygosity
In crosses between two populations, the ancestral origin heterozygosity has upper and lower bounds that depend on the breed proportions of the crossbred animal and the breed proportions of its parents. The expectations can be obtained as the expected frequency of heterozygotes at a single locus, if the two ancestral parents are fixed for opposite alleles at that locus. For example, the ancestral origin heterozygosity of the two parental populations is zero. That for an F1 is exactly 1, which is the upper bound of heterozygosity, while that of an F2, resulting from the mating of two F1 animals is expected to be 0.5, which is the lower bound of heterozygosity for animals with 50% ancestry from each parent. The upper bound of the expected heterozygosity applies to all crossbreds that have at least one parent being a purebred ancestor. The lower bound applies to all inter-se matings between crossbred parents that have identical ancestral breed composition. The expected ancestral heterozygosity of all other crosses between crossbred parents lies between the upper and lower bounds of ancestral origin heterozygosity for animals of that breed composition.
Analogous bounds can be obtained for individual heterozygosity when it is assumed that all the animals of a given ancestral pure breed have the same heterozygosity. In this case expected heterozygosity can be considered as a trait whose expectation is the sum of additive genetic and heterosis effects. If H1 and H2 are the heterozygosity of parent breeds 1 and 2, respectively, and pi is the breed proportion of parent breed 2 and ai is the expected ancestral origin heterozygosity of crossbred animal i, then the expected heterozygosity of that animal, Hi, is:
where x = HF1 – H1 if p < 0.5 and x = HF1 – H2 if p > 0.5, and HF1 is the average individual heterozygosity of F1 animals. The upper and lower bounds for ancestral and individual heterozygosity are used in the results to illustrate the utility of ancestral versus individual heterozygosity as a useful metric in the estimation of genetic parameters of performance in crossbred populations.
Genotype Imputation in West African Cattle Populations
Imputation was undertaken using a population-based algorithm, Minimac v3 (Das et al., 2016) with pre-phased data from Eagle v2.3.5 (Loh et al., 2016). Minimac v3 was chosen for genotype imputation because it provided the highest imputation accuracy in East Africa crossbred populations compared to FImpute and Beagle (Aliloo et al., 2018).
SNP Information for Imputation
The SNPs in common between the medium-density genotypes (dataset 2) and the commercially available Illumina BovineLD v2 SNP array (containing 7,931 SNPs) were retained to create the low-density dataset. There were 5,043, 28,649, and 621,309 SNPs in low-density, medium-density (dataset 2) and high-density (dataset 3) datasets, respectively.
Genotype Imputation Scenarios
Imputation was undertaken within and across geographical regions focussing mainly on West Africa using East African populations as a reference. As detailed in Table 2, a total of 36 imputation scenarios were considered to impute West African indigenous and crossbred populations, while four scenarios were used to impute East African indigenous and crossbred populations. Half of the imputation scenarios (18) were designed to investigate the imputation accuracies from low-density to medium-density SNP panels, and the other half was used for the imputation from medium-density to high-density SNP panels (Table 2). Based on the geographical regions where the reference populations were sampled from, the 36 imputation scenarios could be classified into three major groups based on the reference sets: using East African indigenous and crossbred individuals combined or separately (Scenario 1), using West African indigenous and crossbred individuals combined or separately (Scenario 2), and using a combination of East and West African indigenous and crossbred individuals (Scenario 3).
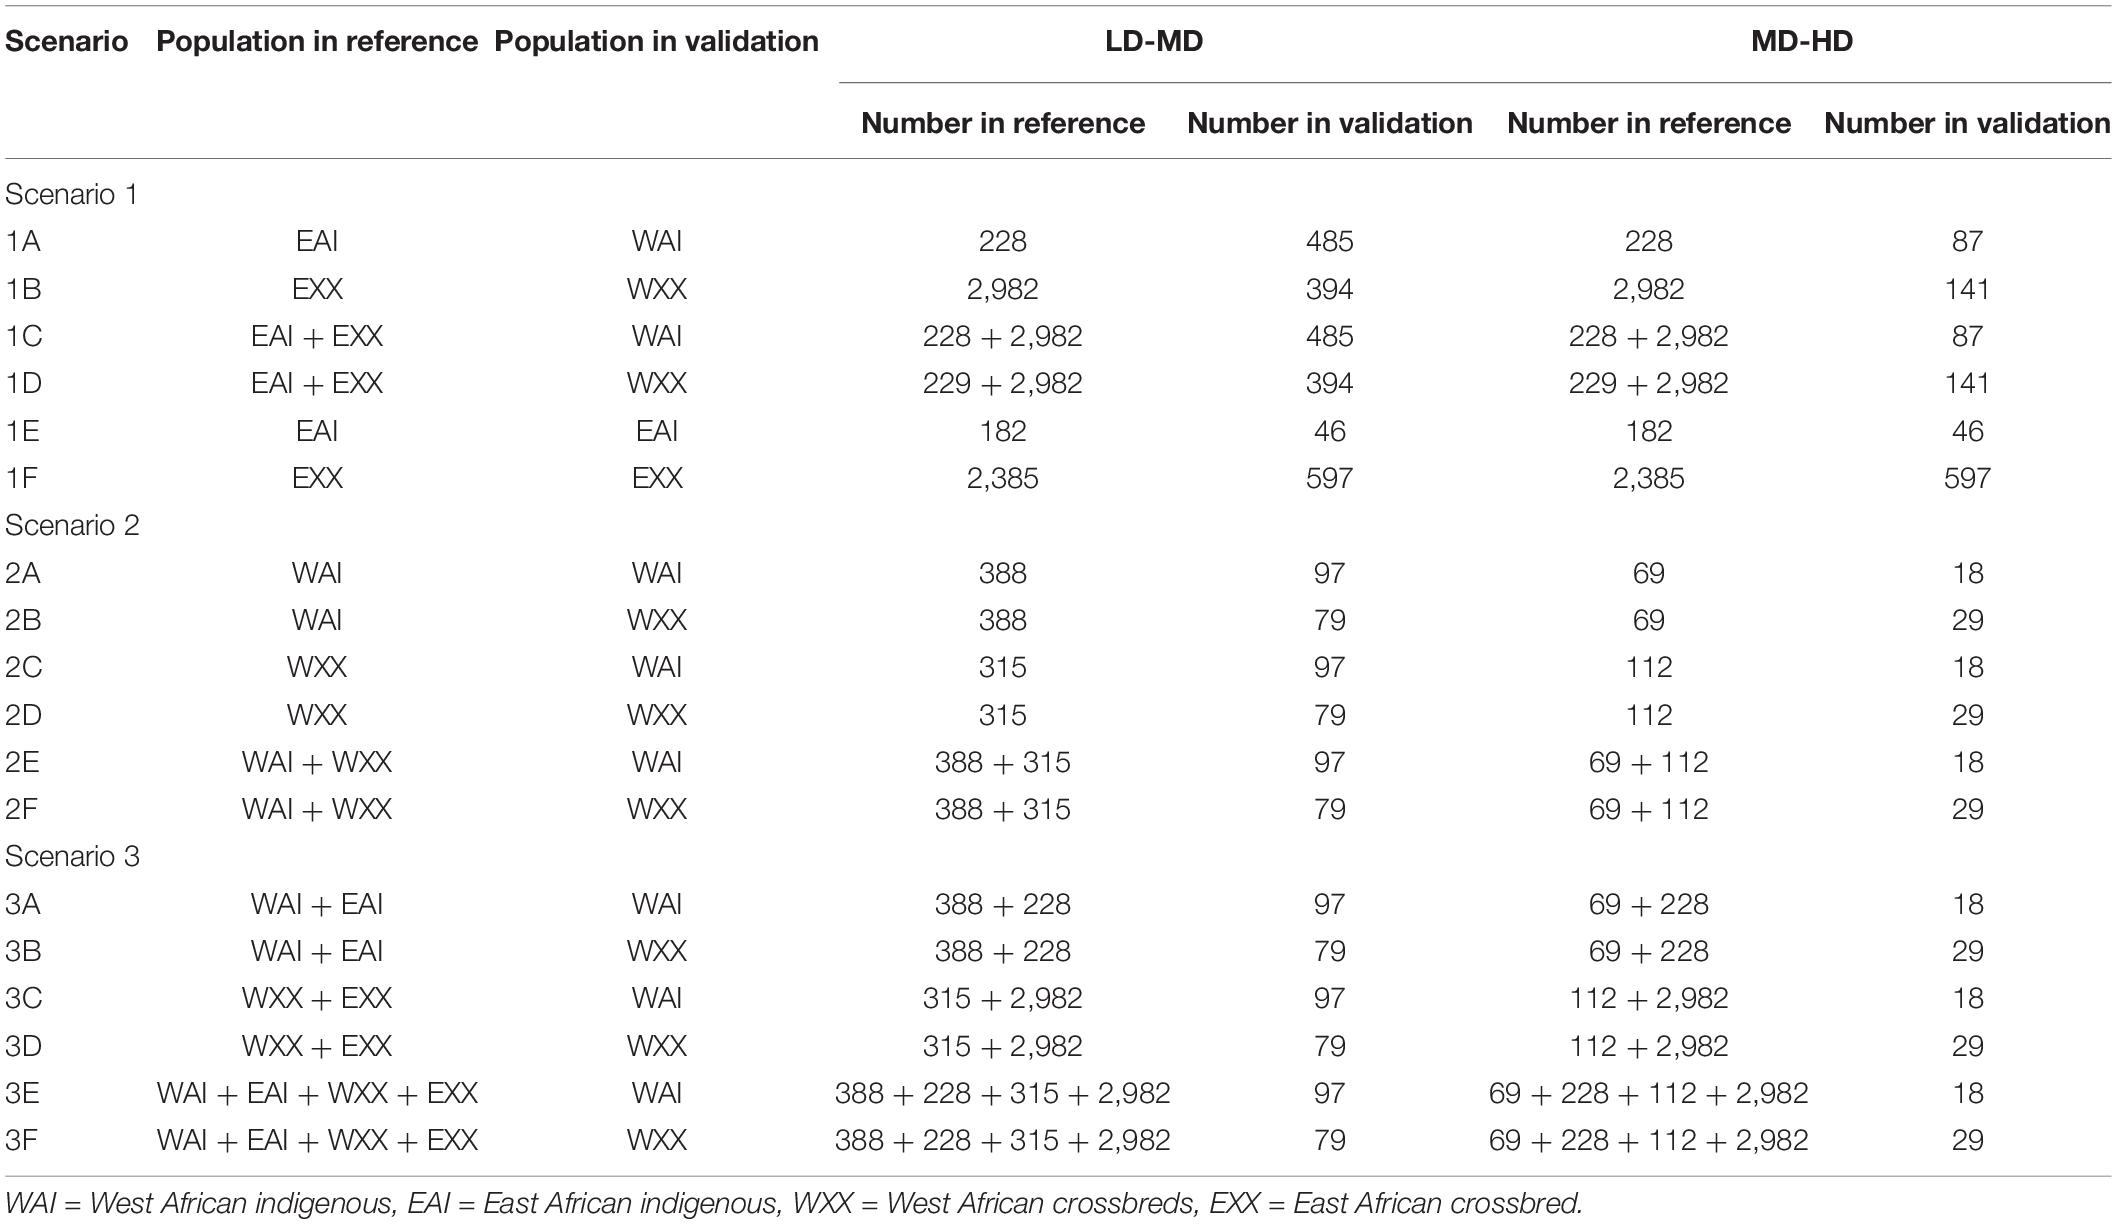
Table 2. Scenarios and the number of animals used in the reference and validation sets to assess imputation accuracy.
To assess the imputation accuracy, direct imputation was performed for Scenario 1 and five-fold cross-validation for Scenarios 2 and 3. The target individuals for Scenarios 2 and 3 were randomly divided into five groups, and each group was used as a validation set, while the four remaining groups were used as a reference population.
Imputation accuracy was determined with two different criteria: (1) the allelic correlation of imputed versus real genotypes, and (2) the concordance rate computed as the ratio between the number of correctly imputed alleles versus the total number of imputed alleles.
Results and Discussion
Global and Local Ancestry Inferences in West African Crossbreds
Estimates of global and local ancestry for the two-way admixture generated by ADMIXTURE and LAMP-LD, are shown in Figure 1. Each vertical bar represents an individual with the proportion of each ancestry depicted in a different color. The average European B. taurus and indigenous breed proportions estimated from ADMIXTURE (Figure 1A) were 0.481 (SD = 0.201) and 0.519 (SD = 0.201), respectively, and from LAMP-LD (Figure 1B) 0.491 (SD = 0.199), and 0.509 (SD = 0.199), respectively. The correlation between the breed proportion estimates obtained from the two algorithms was 0.995, showing that they have a strong association.
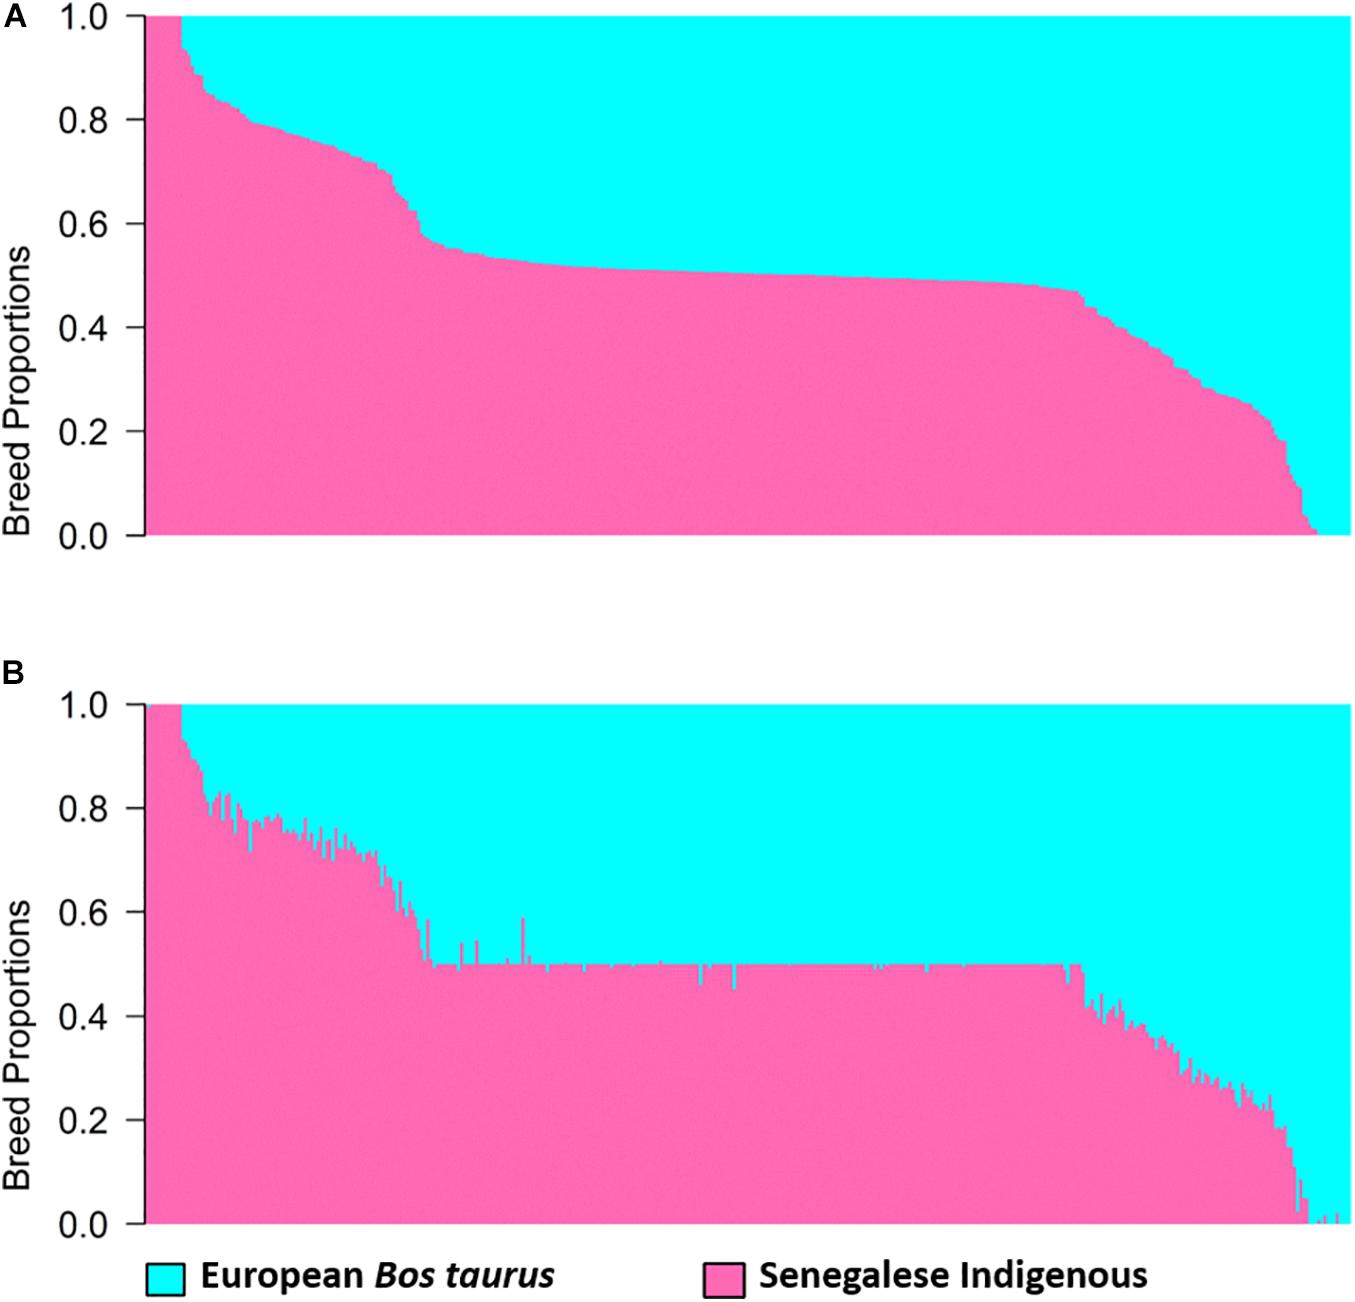
Figure 1. Estimates of breed proportion of West African crossbreds using two-way admixture from (A) ADMIXTURE and (B) LAMP-LD.
Estimates of global and local ancestry from the three-way admixture using ADMIXTURE and LAMP-LD are shown in Figure 2. The average European B. taurus, African B. taurus, and Bos indicus breed proportions from ADMIXTURE (Figure 2A) were 0.515 (SD = 0.199), 0.185 (SD = 0.091), and 0.300 (SD = 0.146), respectively. The average estimates of ancestral breed proportions from LAMP-LD (Figure 2B) were 0.501 (SD = 0.194), 0.181 (SD = 0.088) and 0.319 (SD = 0.143), respectively. The correlation between the estimates of the three breed proportions obtained from ADMIXTURE versus LAMP-LD were 0.994, 0.981, and 0.994, respectively. This correlation was consistent with previous results by Chen et al. (2014), who found that the LAMP-LD estimates showed a correlation of 0.989 with a supervised ADMIXTURE analysis in human populations. The estimates of average European breed proportion from ADMIXTURE and LAMP-LD for the three-way scenario were slightly higher (3.4 and 1%, respectively) than results for two-way admixture. Gebrehiwot et al. (2020) and Gebrehiwot (2020) found an average exotic dairy proportion of 0.503 (SD = 0.187) using twelve ancestral reference populations in a supervised ADMIXTURE analysis of West African crossbreds with overlapping data, which is consistent with the estimates here.
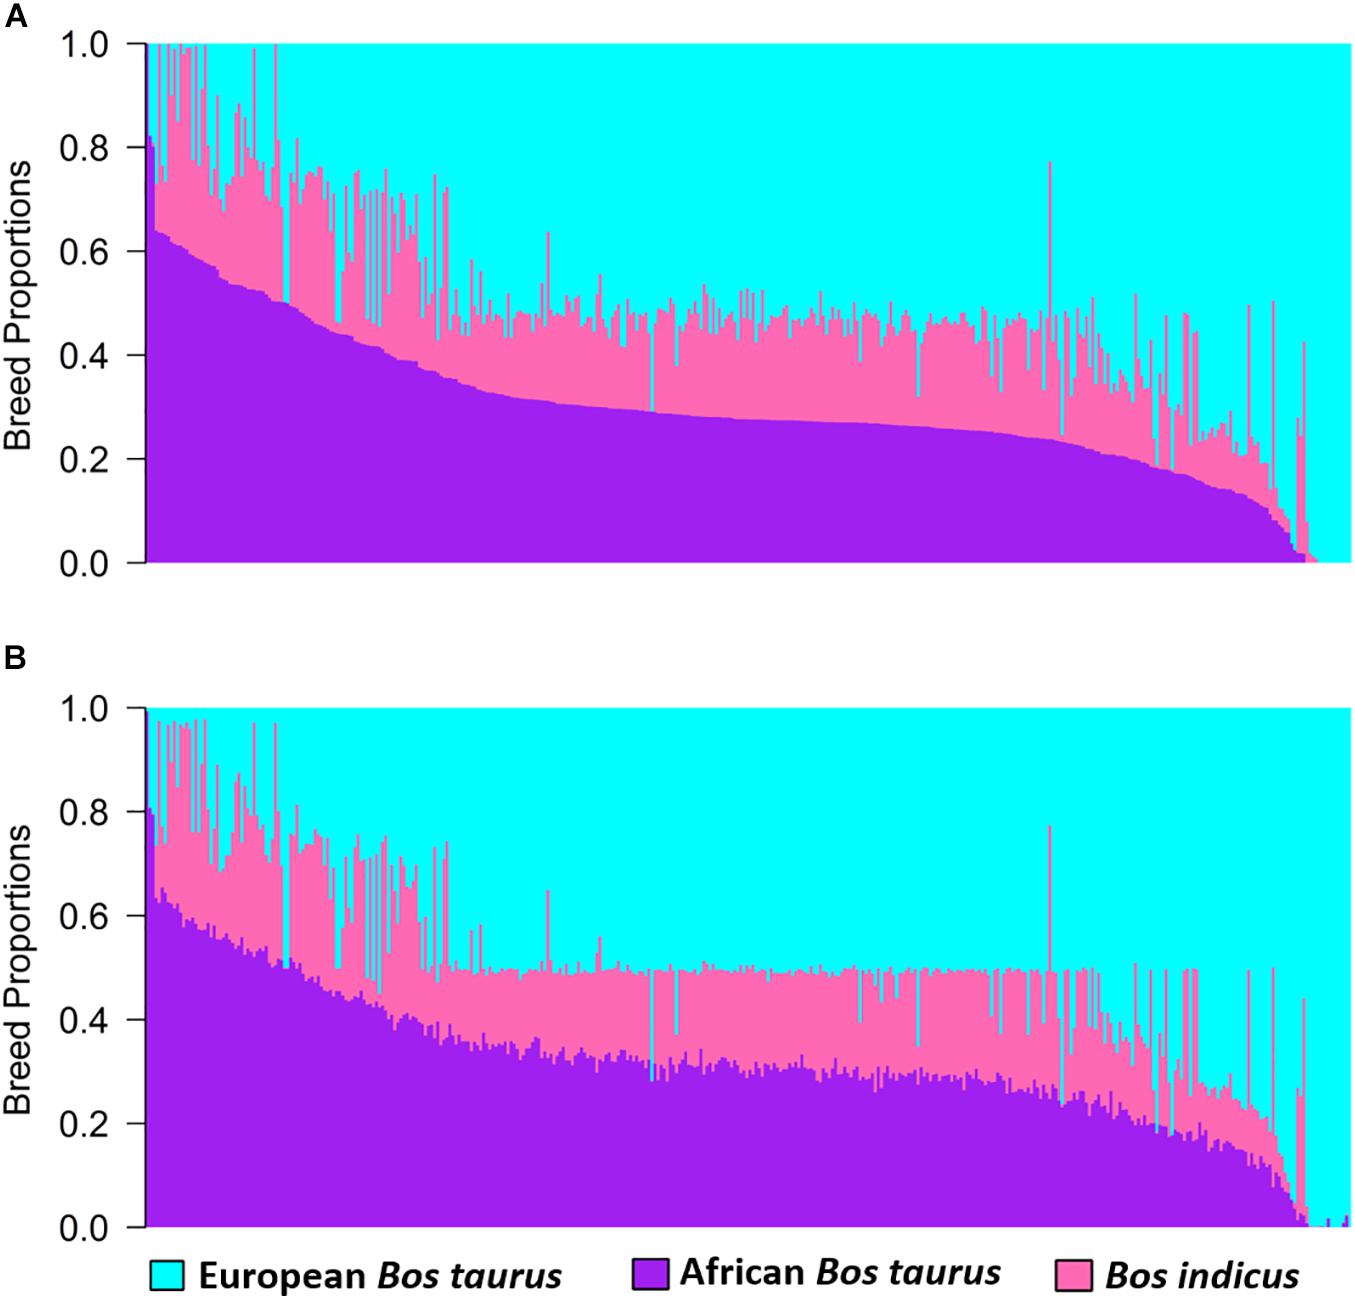
Figure 2. Estimates of breed proportion of West African crossbreds using three-way admixture from (A) ADMIXTURE and (B) LAMP-LD.
The PCA found that the first two PCs accounted for 77.24 and 13.48% of the total genetic variation in the GRM, differentiating Bos indicus from B. taurus and African B. taurus from other groups (Figure 3). This is consistent with the patterns found by several studies (Hanotte et al., 2002; Gautier et al., 2009; Kim et al., 2017; Verdugo et al., 2019; Gebrehiwot et al., 2020), analyzing various combinations of African indigenous and crossbred data along with the three reference groups. The Bos indicus reference populations clustered tightly together, showing that they are a pure Bos indicus population, while the African B. taurus populations clustered together with a few Baoule individuals appearing to be admixed with Bos indicus. The crosses between European dairy breeds and African indigenous breeds were distributed between the European and indigenous populations. A substantial number of Gobra × Holstein-Friesian, Gobra × Montbéliarde, Gobra × Normande, and undefined crossbreds clustered in an intermediate position between the indigenous and European breeds (Figure 3). The history of this crossbred population suggests that these animals are likely F1 crosses but PCA cannot differentiate an F1 from any other cross resulting in approximately 50% indigenous ancestry. Maure and Djakore clustered in an intermediate position between Bos indicus and African B. taurus ancestral populations, while Gobra, the Gobra × Maure cross, and the Gobra × Guzerat cross spread between these two ancestral populations, showing a wide genetic diversity among individuals.
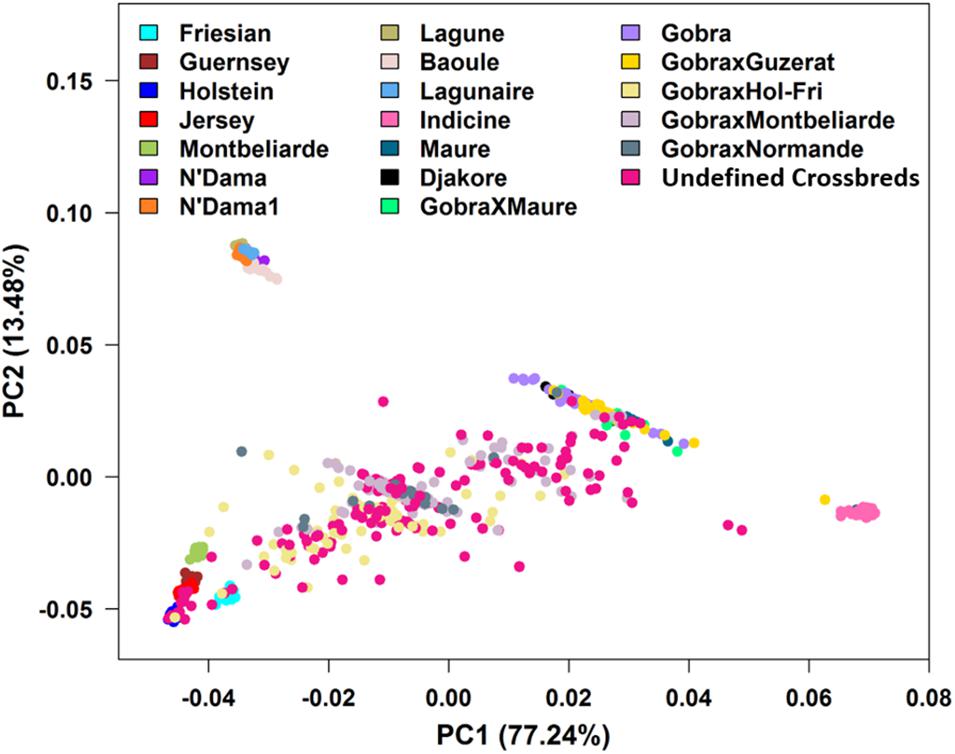
Figure 3. Plots of PC1 vs. PC2 for Bos indicus, African and European Bos taurus, West African indigenous and crossbred populations.
Estimation of Heterozygosity
Individual Heterozygosity in the Reference Populations
The average individual heterozygosity values for European B. taurus, African B. taurus, Indian Bos indicus, and indigenous reference populations as well as West African crossbred populations are presented in Table 3. Friesian and Jersey cattle populations showed the highest and lowest average heterozygosity of the European dairy breeds with 0.331 (SD = 0.013) and 0.261 (SD = 0.014), respectively. These results are consistent with previous estimates; for example, Mbole-Kariuki et al. (2014) found heterozygosities of 0.33 (SD = 0.01) and 0.25 (SD = 0.03) for Holstein-Friesians and Jersey, respectively.
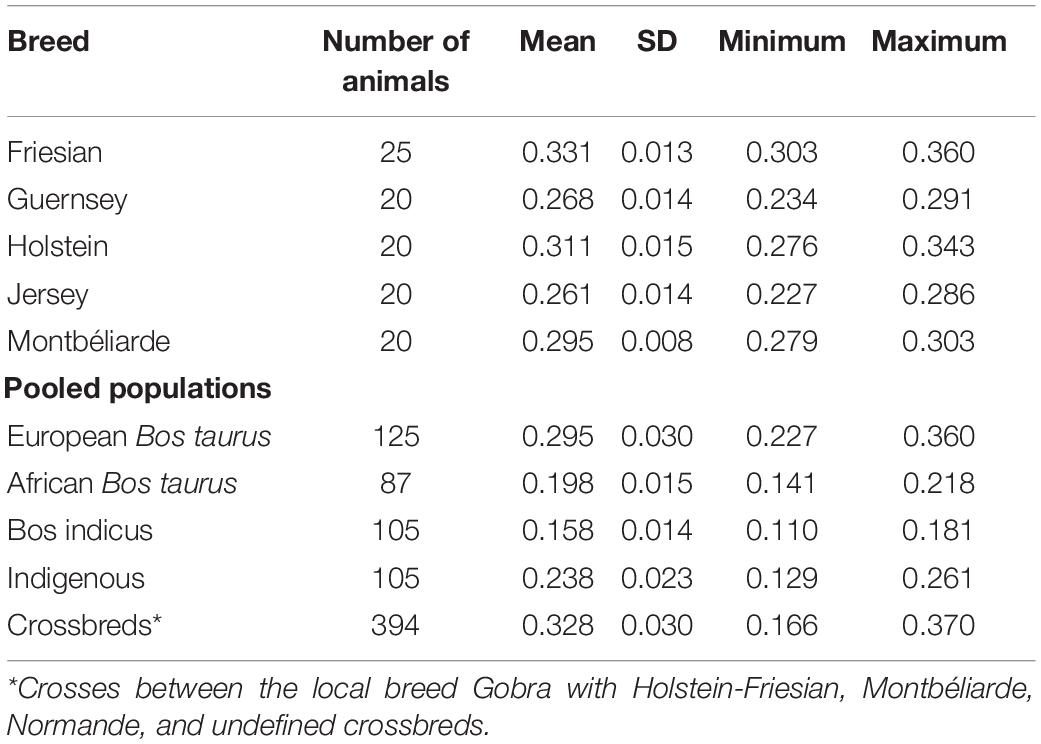
Table 3. Average heterozygosities of reference and West African crossbred populations.
As expected, the average heterozygosity proportion in crossbred animals was higher (0.3277, SD = 0.030) than in the pooled pure reference and indigenous populations (Table 3). However, the average heterozygosity proportion in crossbreds were lower than in Friesian, which is due to the outlier animal in the crossbred group that showed a low heterozygosity proportion (0.166). The mean heterozygosity of the crossbreds without the outlier is 0.328. This is still somewhat lower than the Friesian heterozygosity, however, the crossbreds have a larger SD (0.029 vs. 0.013) and the median for the crossbreds is slightly higher (0.339) than the mean, indicating somewhat a skewed distribution. Moreover, the maximum heterozygosity of the crossbreds is higher than any of the other populations. The pooled European B. taurus and African B. taurus populations had an average heterozygosity of 0.295 (SD = 0.030) and 0.198 (SD = 0.015), respectively. Bos indicus had a low average heterozygosity of 0.158 (SD = 0.014), which is even lower than in other studies (Kasarapu et al., 2017; Utsunomiya et al., 2019); however, most other studies did not use Bos indicus breeds from India but breeds that are known to have a complex breeding history including introgression of B. taurus breeds such as Brahman, Nelore, or Gyr. The low heterozygosity level in Bos indicus populations is likely due to ascertainment bias of the SNPs on the assay, which seems to be even more pronounced in Bos indicus breeds from India. The pooled indigenous animals had an average heterozygosity of 0.238 (SD = 0.023), consistent with the extra heterozygosity expected in admixtures between the African B. taurus and Bos indicus ancestral populations. Including heterozygosity proportion in the model for genetic evaluation increases the prediction accuracy of traits and it also has the potential to be used in mate selection in order to maximize heterozygosity in the offspring (De Cara et al., 2011; Iversen et al., 2019). A previous study by Mbole-Kariuki et al. (2014) using a medium-density (50k SNPs) dataset reported a lower average heterozygosity level for N’Dama 0.17 (SD = 0.08) than the pooled African B. taurus, and a higher average heterozygosity level for Sheko 0.26 (SD = 0.003) compared to the pooled indigenous animals in our study.
Ancestral Origin Heterozygosity in West African Crossbreds
The ancestral origin heterozygosity proportions estimated by LAMP-LD are plotted against the estimated European breed proportion from either ADMIXTURE or LAMP-LD for the two-way (Figure 4) and three-way admixture (Figure 5). Animals with low heterozygosity and low (<2% based on the two-way ancestry analysis) European breed proportion are interpreted to be pure indigenous, and animals with low heterozygosity, but high (>98%) European breed proportion are assumed to be pure European dairy breeds. Estimation of European breed proportion using LAMP-LD (Figures 4B, 5B) showed a clearer cluster than the result obtained from ADMIXTURE (Figures 4A, 5A). However, animals that showed up as pure indigenous in all other analyses were estimated by a three-way admixture with LAMP-LD to have a small proportion of European B. taurus ancestry. This appears to be due to the model allocating a proportion of the African B. taurus ancestry to be European B. taurus ancestry.
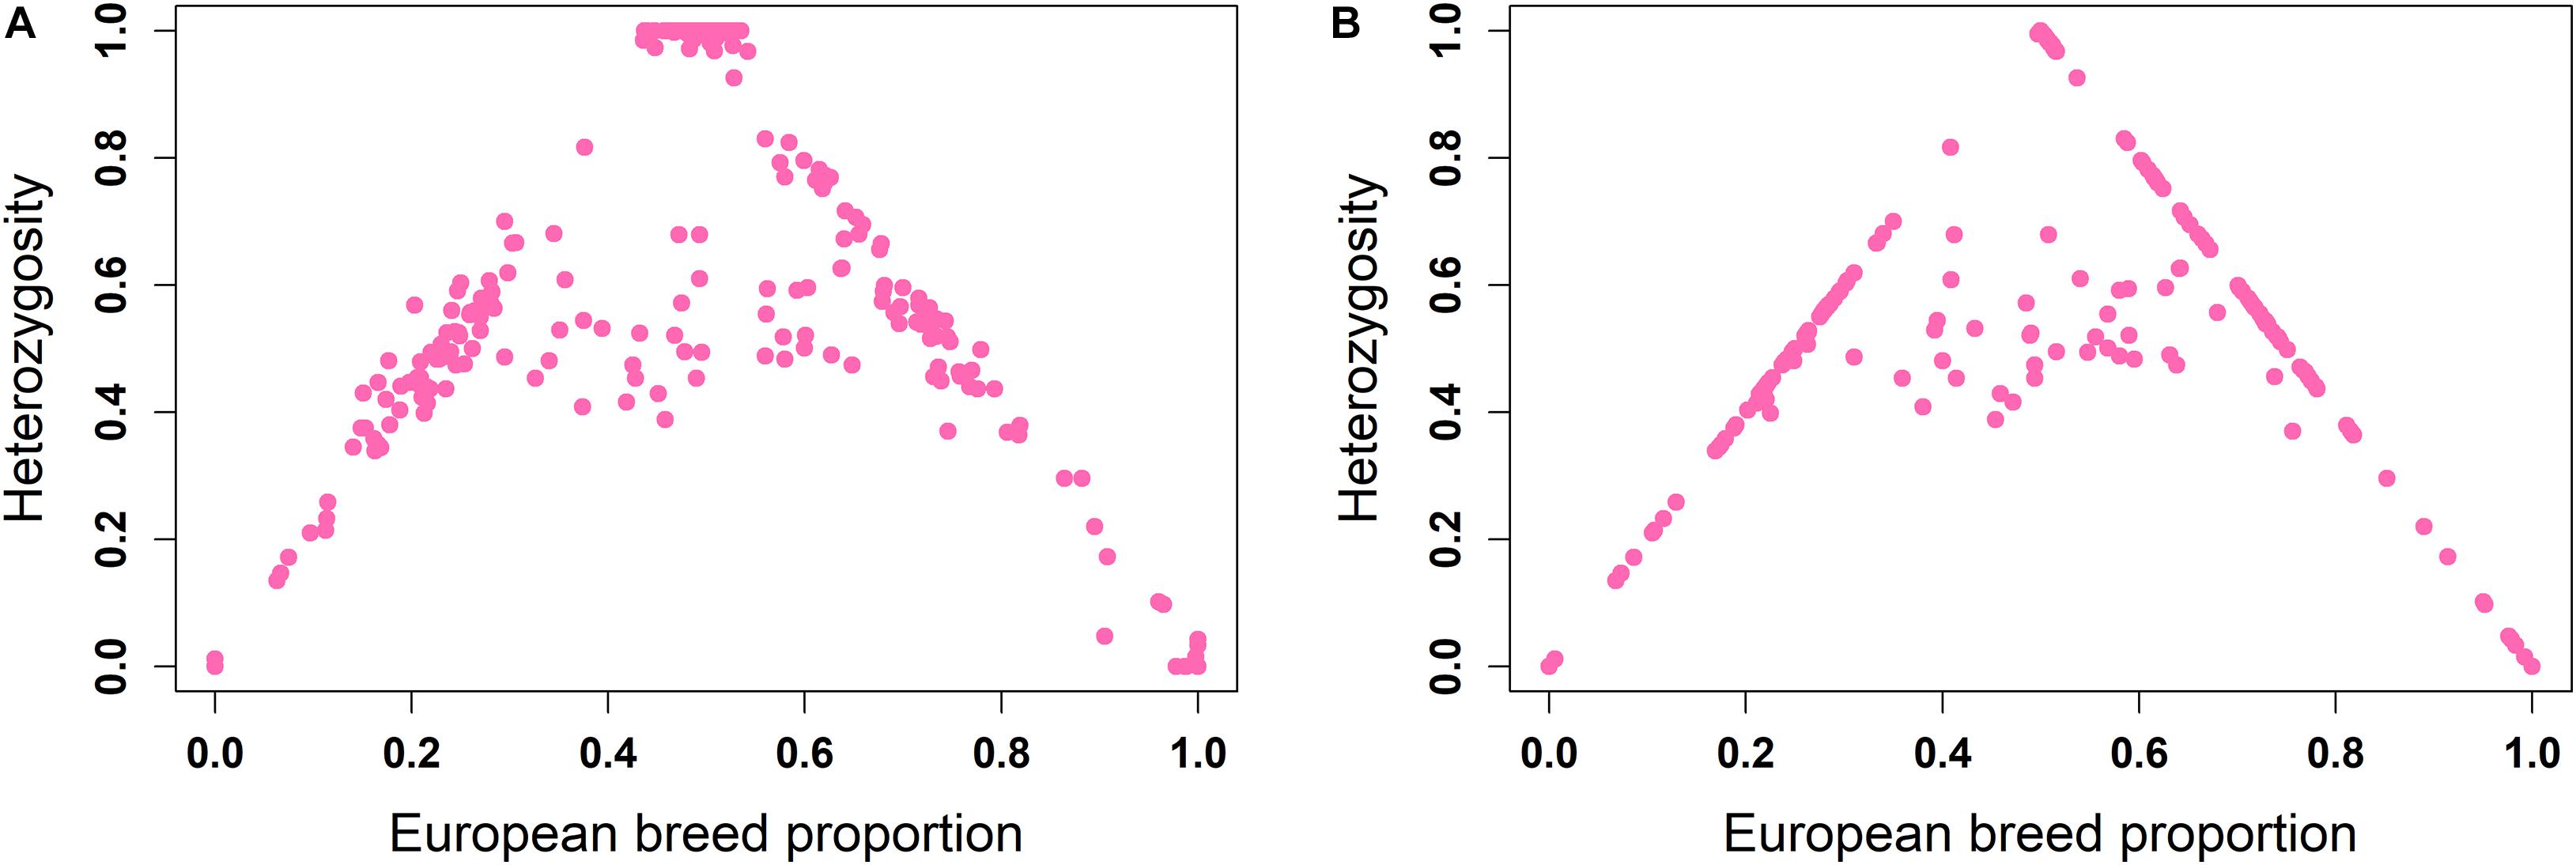
Figure 4. Ancestral origin heterozygosity in West African crossbreds plotted against European breed proportion estimated from a two-way admixture using (A) ADMIXTURE and (B) LAMP-LD.
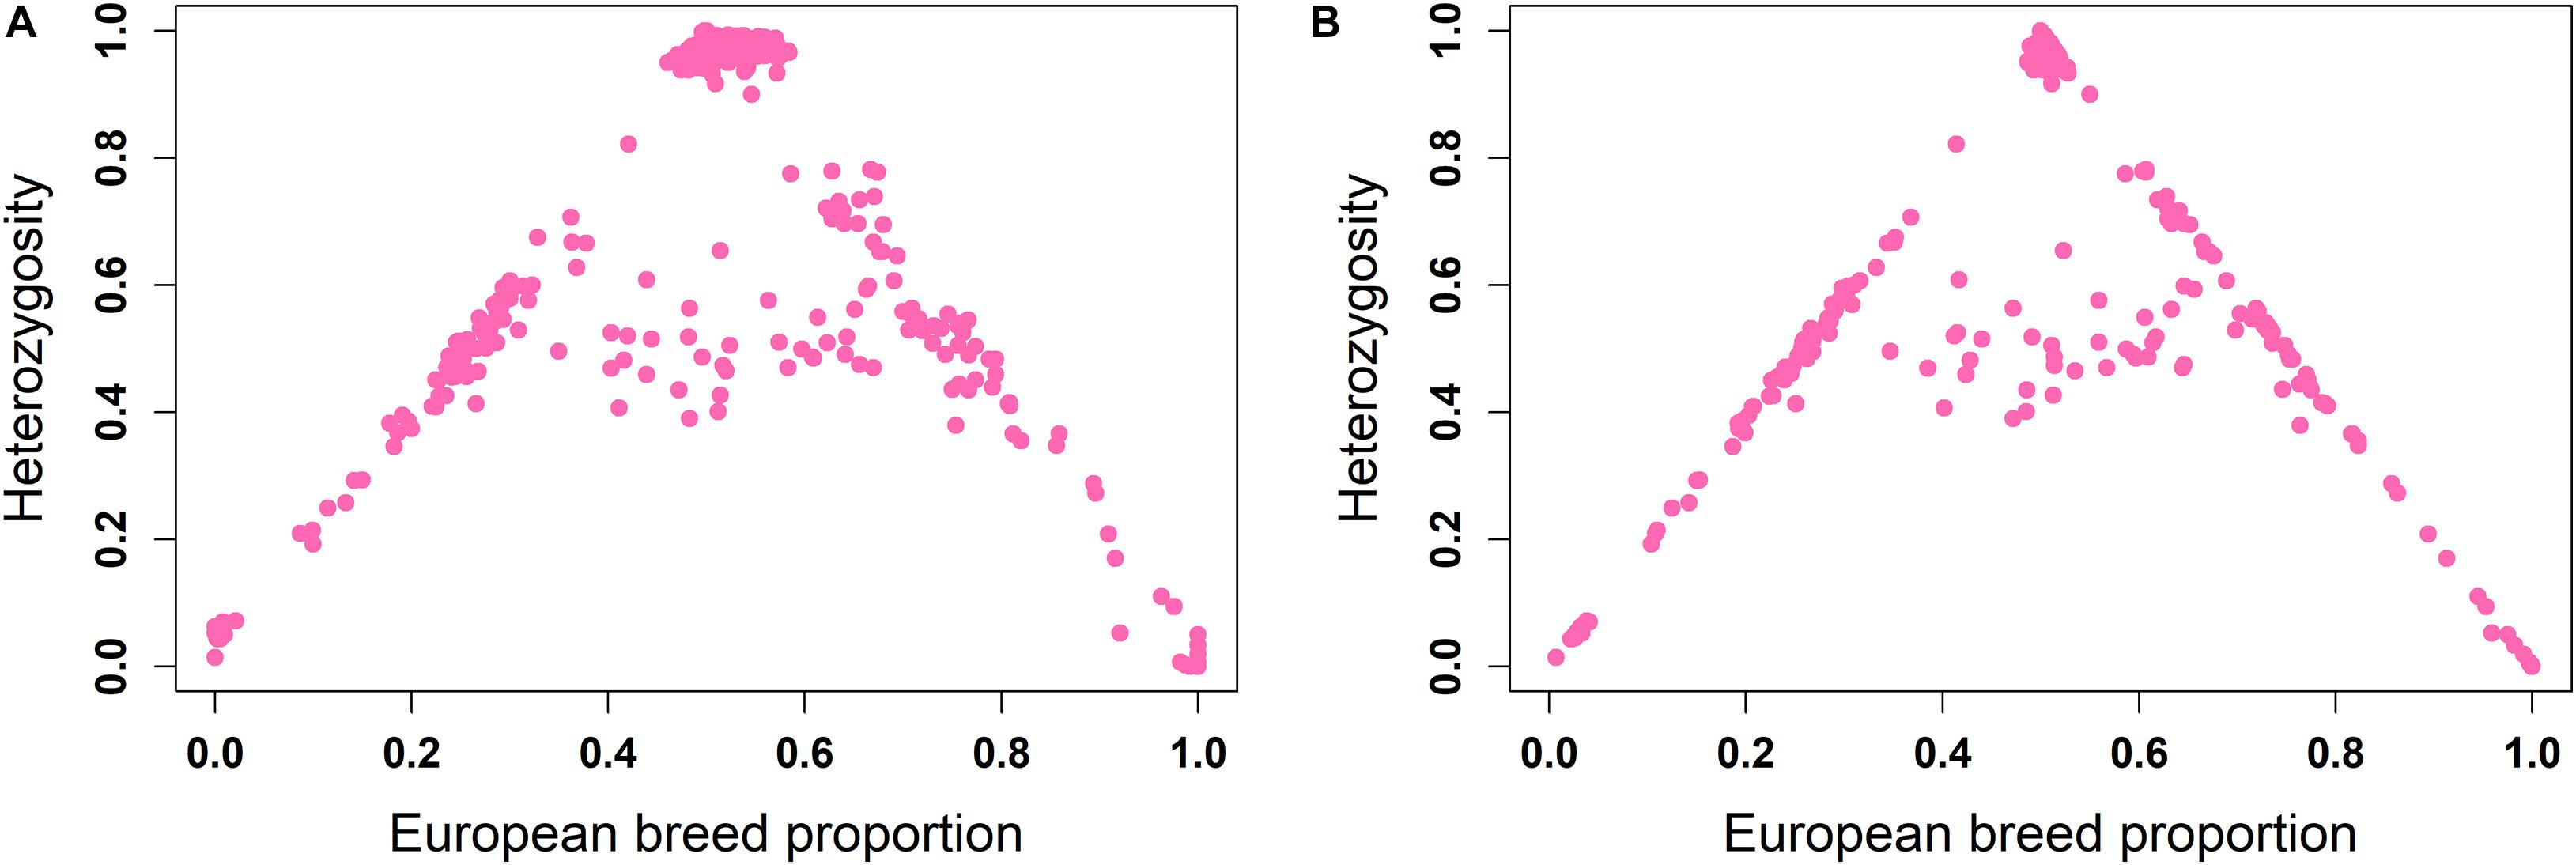
Figure 5. Ancestral origin heterozygosity in West African crossbreds plotted against European breed proportion estimated from a three-way admixture using (A) ADMIXTURE and (B) LAMP-LD.
Theoretically, all crossbreds must sit within the bounds set by the straight lines between F1 animals, with a European breed proportion of 0.5 and ancestral origin heterozygosity of 1.0, and the pure indigenous and European breeds that have European breed proportion of zero and 1.0, respectively, and an ancestral origin heterozygosity of zero. Animals that sit on the outer boundaries are crosses where at least one parent is purebred, whereas animals inside the boundaries result from a mating of two crossbred parents. Based on this assumption, Figure 4B fits the model almost exactly. The plots based on ADMIXTURE estimates of breed proportion (Figures 4A, 5A) fit the model least well because the method of estimating global ancestry by ADMIXTURE differs from that used by LAMP-LD, leading to inconsistencies between the estimate of breed composition (global ancestry).
Although it cannot be seen because of over-position of data points, in Figures 4B, 5B, a high proportion of crossbred animals with almost exactly 50% European breed proportion had ancestral origin heterozygosity of almost exactly 1.0 (Figure 4B) or very close to 1.0 (Figure 5B), which is the heterozygosity expected for F1 crosses. This is visible in Supplementary Figures 1A (two-way admixture) and 1B (three-way admixture), where the number of data points within a particular area of the plot is counted and presented by a color gradient to show how many animals occur at each position on the plot. Comparing Figures 4, 5, and Supplementary Figure 1 shows that the three-way ancestry model leads to more variable estimates of European breed proportion by both ADMIXTURE and LAMP-LD, and more variable estimates of ancestral heterozygosity by LAMP-LD. Most notably, the LAMP-LD estimates of ancestral heterozygosity for the putative F1 animals are all almost exactly equal to the expected value of 1.0 when using the two-way ancestry model, whereas the estimates from the three-way ancestry model, while mostly still close to 1.0, include estimates as low as 0.9.
Supplementary Figure 1 shows that there are clusters of animals on the outer boundaries around 25 and 75% European breed proportions, respectively. These are most likely backcrosses of F1 animals to pure indigenous or pure European animals, which are expected to have European breed proportions that vary around 25 and 75%, and heterozygosities that vary around 0.5 because of a random sampling of gametes from the parents. As most clearly seen in Figure 4B, the majority of animals sit on the boundary lines indicating that in this crossbred population, the majority of animals result from a mating involving at least one purebred parent rather than inter-se matings among crossbred animals. This is consistent with the fact that these crossbred dairy populations are relatively recently established and are expanding (K. Marshall, personal communication).
To further clarify the genetic structure of the crossbred animals clustered in the intermediate position of the PC plot in Figure 3, we color-coded the individuals based on ancestral origin heterozygosity (Figure 6). This confirms that the majority of animals in the two bands in the middle of the plot are F1 animals with an ancestral origin heterozygosity of 1.0. The majority of Gobra x Holstein-Friesian crosses were clustered in the first band (between PC1 = −0.025 to 0.000 and PC2 = −0.02 to −0.01), while the majority of Gobra × Montbéliarde and Gobra × Normande crosses were clustered in the other band. A substantial number of undefined crossbred animals were clustered in one or the other of the two bands with ancestral origin heterozygosities close to 1.0, showing that they are Gobra x Holstein-Friesian and Gobra x Montbéliarde F1 crosses.
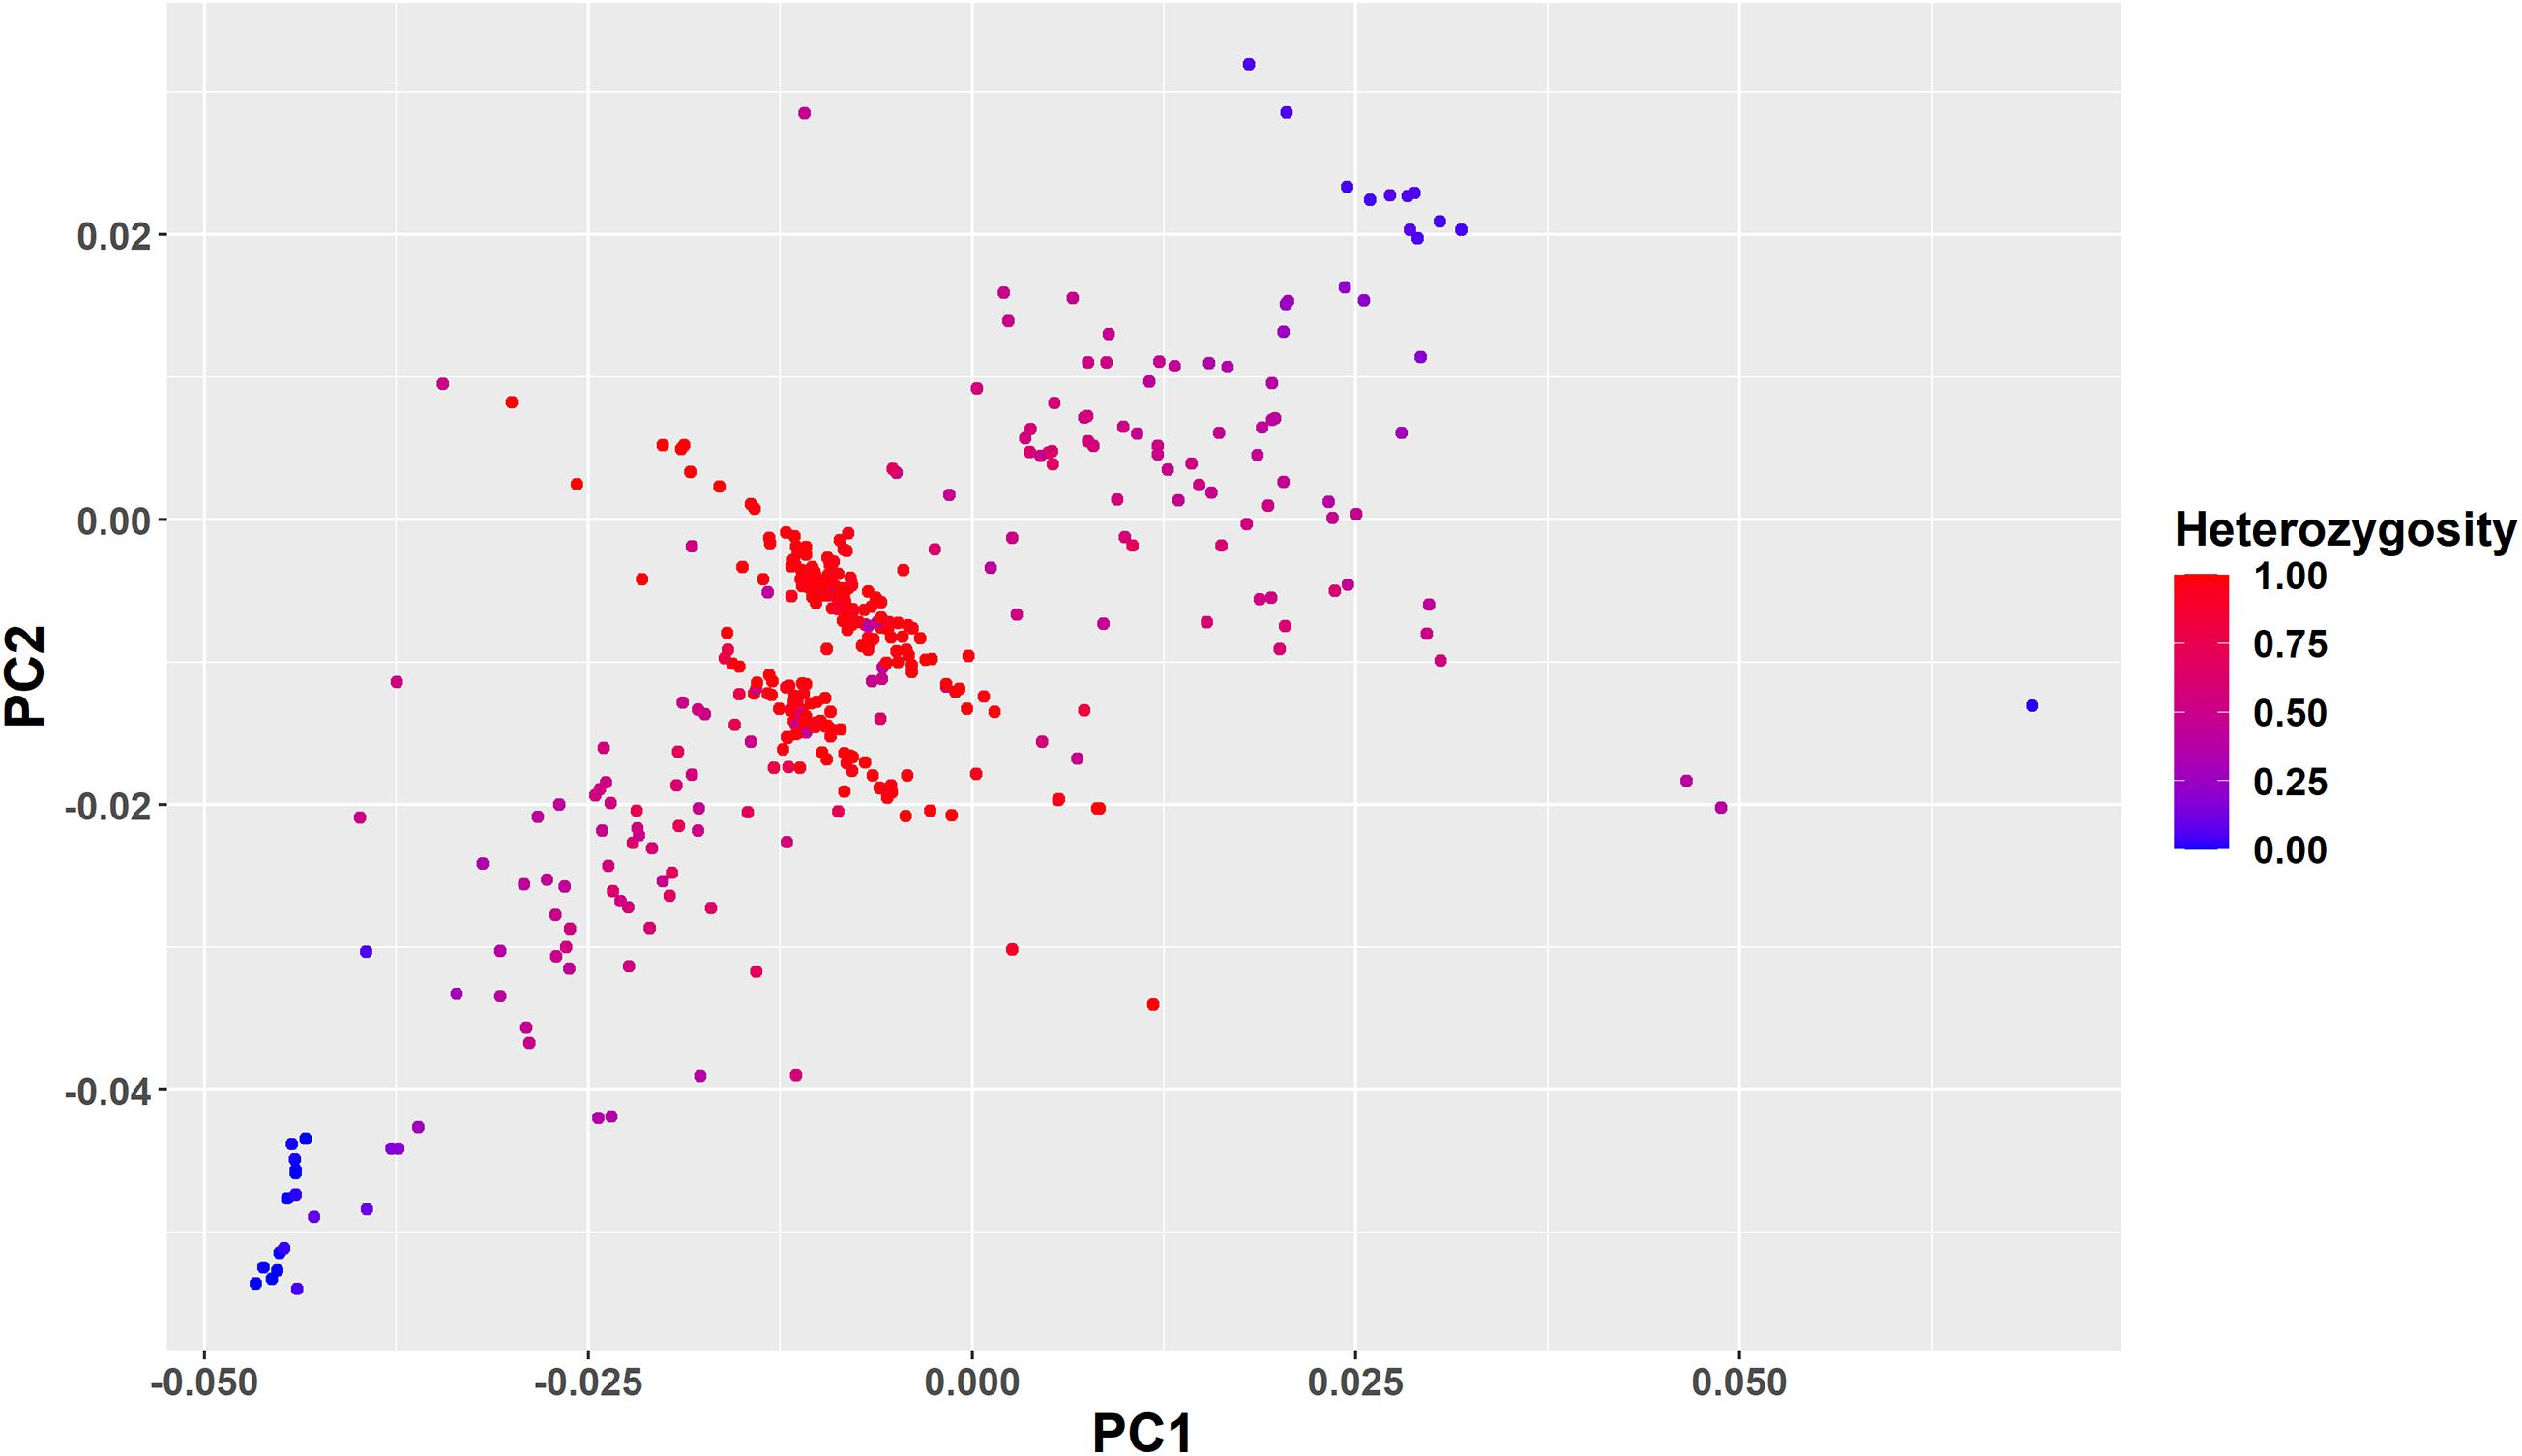
Figure 6. Plots of PC1 vs. PC2 for all West African crossbred animals showing their ancestral origin heterozygosity as color code from red (heterozygosity = 1) to blue (heterozygosity = 0).
Individual Heterozygosity in West African Crossbreds
The plot of individual heterozygosity against European breed proportion for the West African crossbred cattle obtained from ADMIXTURE and LAMP-LD using the three-way admixture is shown in Figures 7A, 8A, respectively. For completeness, Supplementary Figure 2 shows the individual heterozygosity against European breed proportion obtained from ADMIXTURE and LAMP-LD using two-way admixture. To avoid duplication, only the results of the three-way admixture are discussed here. The animals in red color in the Figures 7A, 8A have ≥90% of their European breed proportion being Holstein-Friesian, while the animals shown in blue color in Figures 7B, 8B are those having ≥90% of their European breed proportion being Montb liarde.
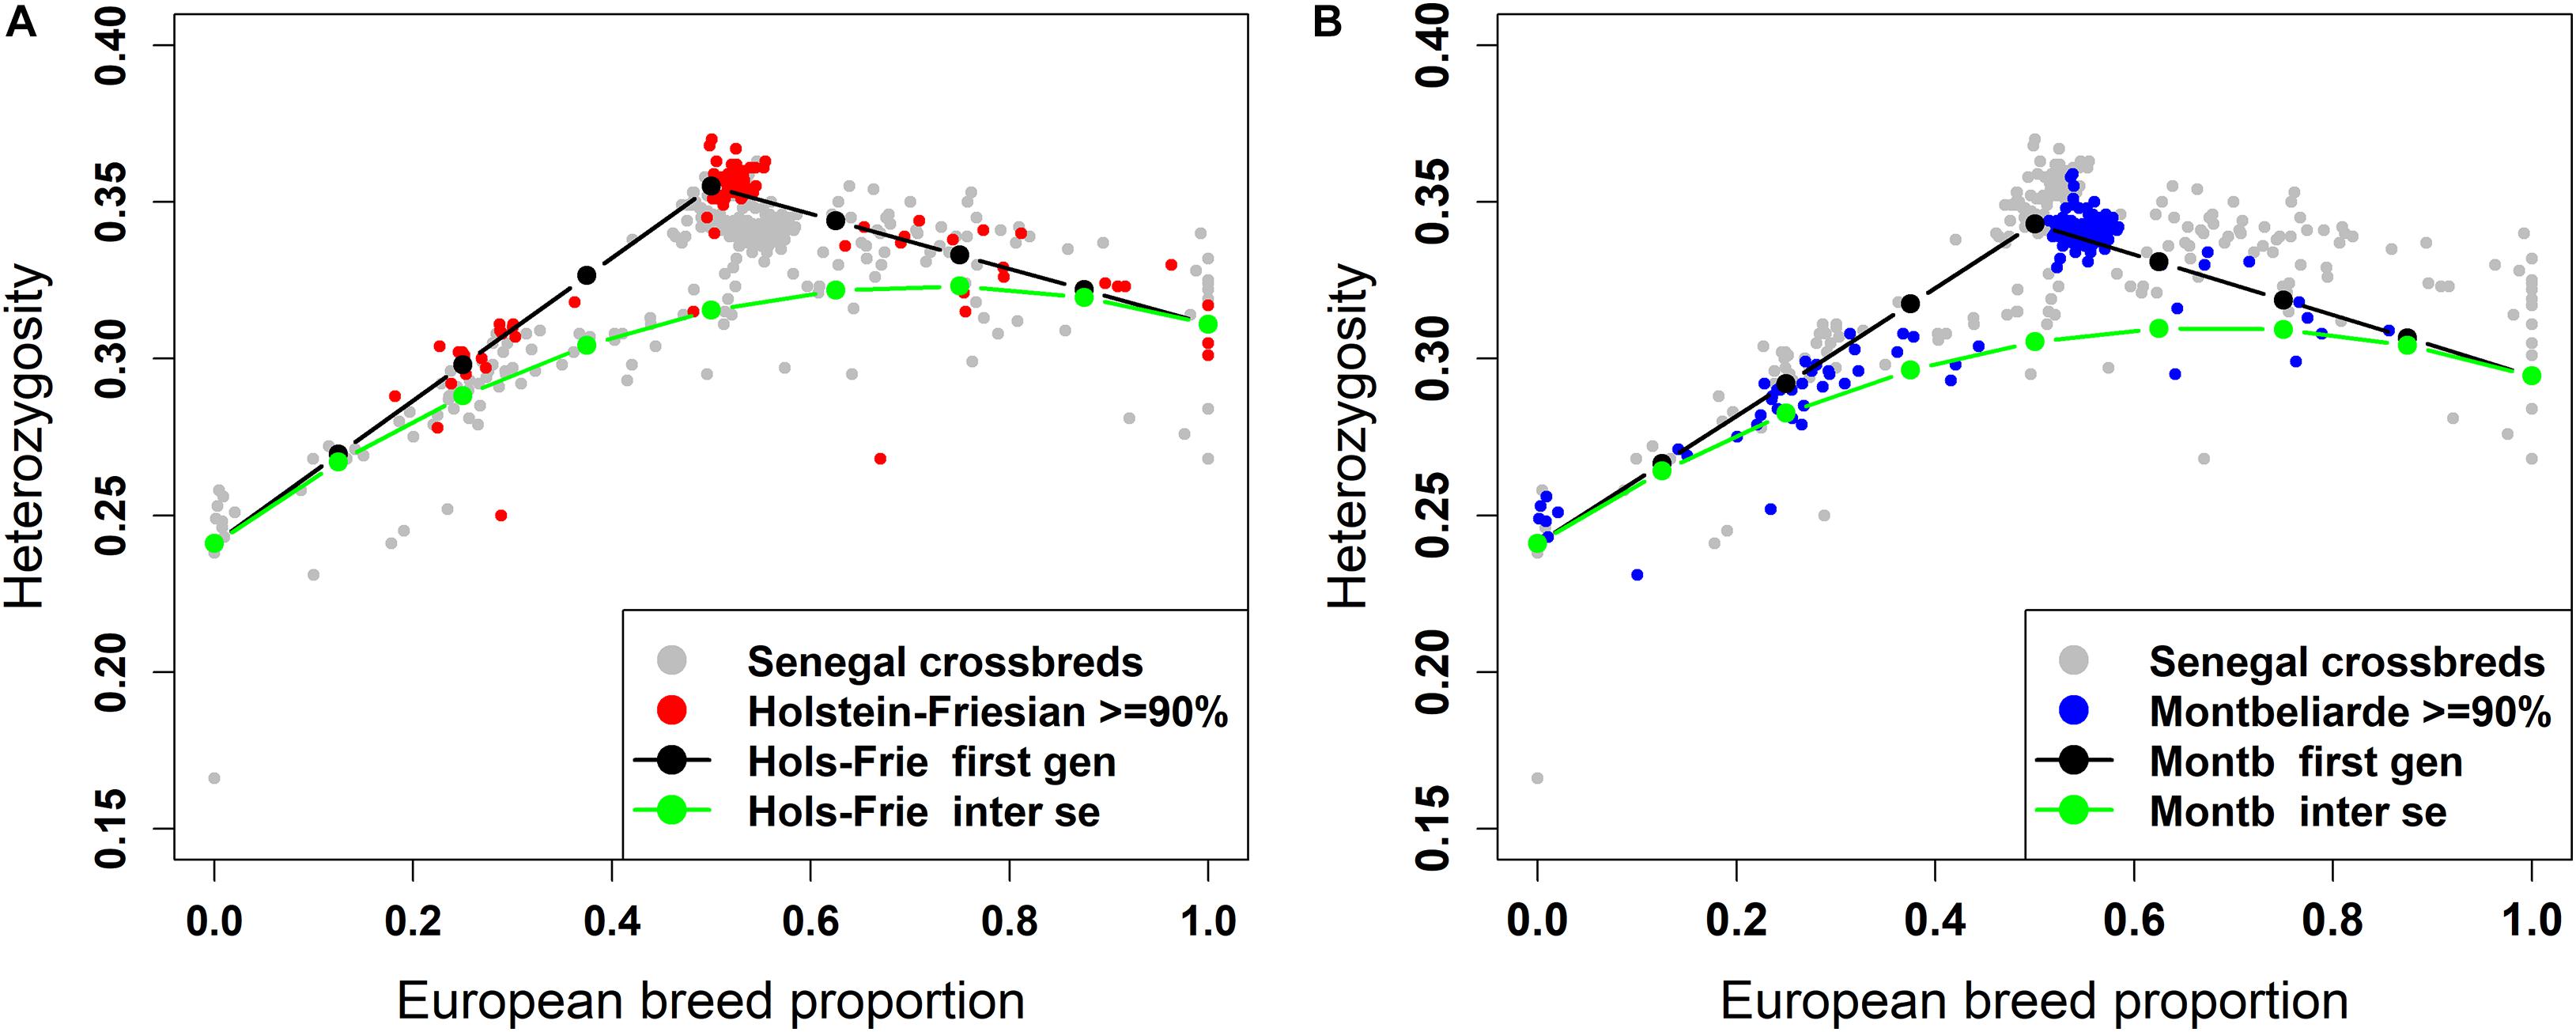
Figure 7. Individual heterozygosity in West African crossbreds plotted against European breed proportion estimated from a three-way admixture using ADMIXTURE. The black and green lines are upper and lower boundaries of expected heterozygosity for (A) Holstein-Friesian and (B) Montbéliarde crosses.
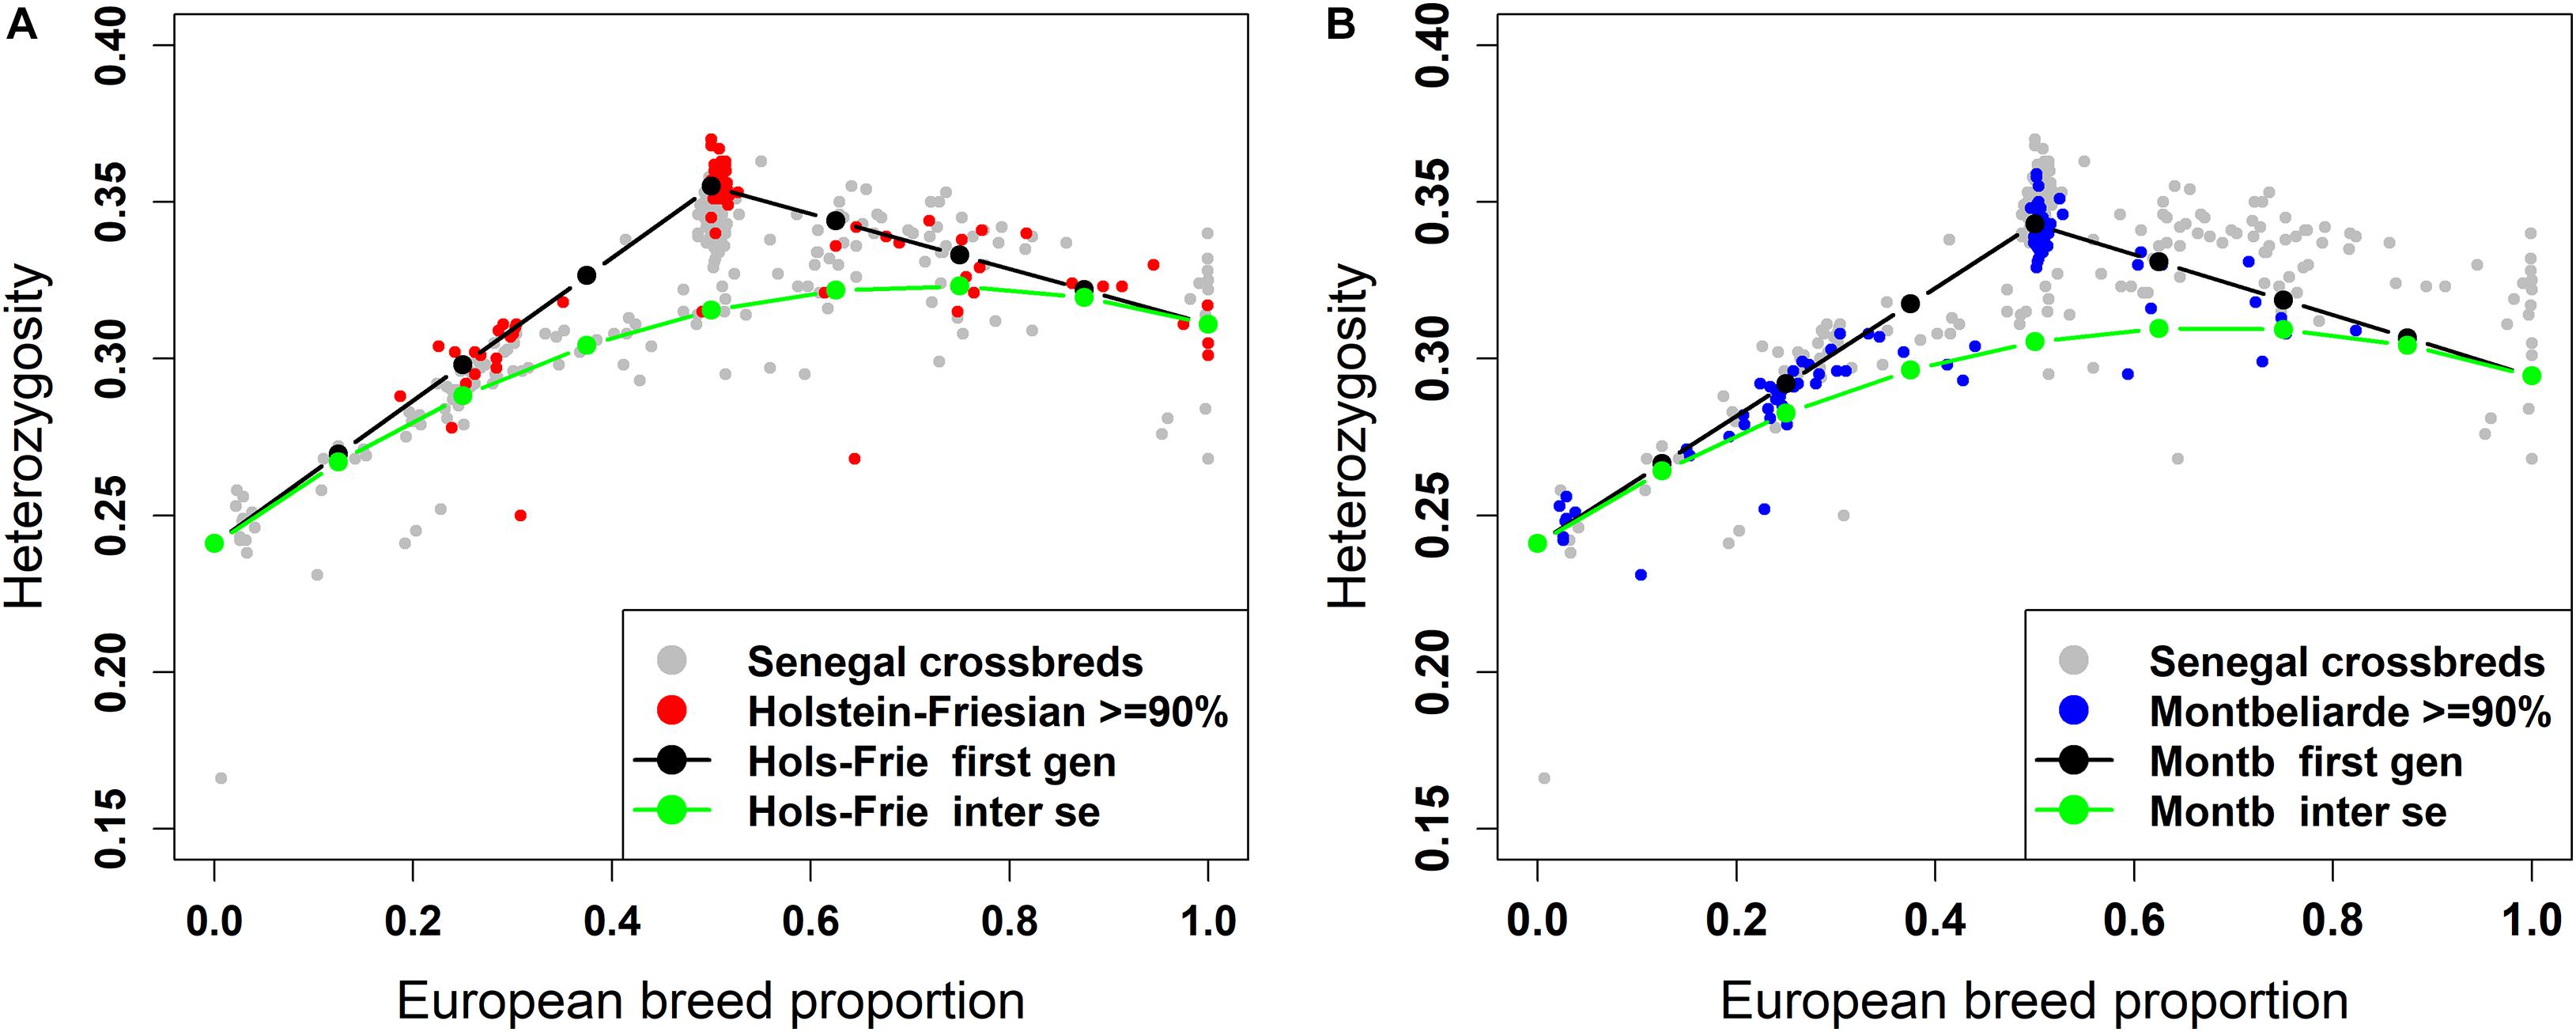
Figure 8. Individual heterozygosity in West African crossbreds plotted against European breed proportion estimated from a three-way admixture using LAMP-LD. The black and green lines are upper and lower boundaries of expected heterozygosity for (A) Holstein-Friesian and (B) Montbéliarde crosses.
Across all animals, the individual heterozygosity ranged from 0.166 to 0.37, and the European breed proportion ranged from 0 to 1. There are evident clusters of animals that have high heterozygosity proportions (>32%) and are close to 50% European breed proportion. Virtually all of these animals are those shown to be F1 crosses in the ancestral origin heterozygosity results.
The black lines are the expected heterozygosity proportions for the progeny of crosses involving an average Holstein-Friesian parent (Figures 7A, 8A) or an average Montbéliarde parent (Figures 7B, 8B). The green lines are the expected heterozygosity proportions for the progeny of inter-se matings between crossbred animals of identical breed composition. The black lines form a theoretical upper boundary of heterozygosity of crossbred animals, while the green lines are the theoretical lower boundary. Holstein, Friesian and Montbeliarde reference samples were used to obtain the average heterozygosity proportion of the pure Holstein-Friesian and Montbéliarde parental populations, respectively, and then used in obtaining the upper and lower boundaries of the expected heterozygosity. The average heterozygosity of indigenous animals was obtained as the average heterozygosity of animals with <2% European breed proportion based on a two-way ancestry analysis. The average heterozygosity of F1 Holstein-Friesian versus F1 Montbéliarde crossbreds was obtained by identifying F1 animals from the ancestral origin heterozygosity analyses, and matching these to animals whose European breed proportion was ≥90% Holstein Friesian or ≥90% Montbéliarde.
The average individual heterozygosity proportions for the parental indigenous, Holstein-Friesian, and Montbéliarde populations were 0.241 (ranged from 0.166 to 0.258), 0.311 (ranged from 0.276 to 0.343), and 0.295 (ranged from 0.279 to 0.303), respectively. The mean and range of indigenous animals include a single outlier with very low heterozygosity, which the PC plots and admixture analyses indicated was a pure Bos indicus animal; most likely one of the pure Guzerat animals known to have been imported into the sample area from Brazil. This outlier was assigned as crossbred in our data using farmers’ assessment of breed composition based on the external appearance of the animal, however, our genomic breed composition prediction methods showed the opposite. Previously, Weerasinghe (2014) tested the extent of farmers knowledge on the ability to identify the breed composition of the East African crossbreds and concluded that farmers have a poor understanding of the breed composition of their animals.
The Holstein-Friesian crosses showed a higher average heterozygosity proportion than the Montbéliarde crosses, and this leads to higher upper and lower boundaries of heterozygosity of Holstein-Friesian crossbreds. The fit to the data is clearly better in Figure 8 than Figure 7, due largely to LAMP-LD providing more accurate estimates of European breed proportion than ADMIXTURE. However, the fit to the data, in general, is very poor in both figures, with a high proportion of animals sitting outside the upper and lower boundaries of heterozygosity. This is due primarily to the large variation in heterozygosity among purebred ancestors. This variation can be expected among ancestors in any crossbred population. Thus, in marked contras to ancestral origin heterozygosity, individual heterozygosity will provide a very poor measure of heterozygosity caused by crossbreeding and hence very poor estimates of heterosis of performance when used in analyses of additive and heterosis effects in this, and by extrapolation other crossbred populations. An additional factor in the current population is the small proportion of crosses resulting from pure Guzerat or Guzerat x indigenous ancestors. These can be seen in Figures 7, 8 as animals appearing well below the green line. They are also evident in Figure 2 as animals with zero or well below expected African B. taurus ancestry, and in the PC plot (Figure 3) as animals well below the distribution of points for most crossbreds. A few animals that are scattered well below the expected lower boundaries, such as an animal with European breed proportion around 65% and Holstein-Friesian proportion ≥90%, might be a cross among close relatives resulting in high inbreeding.
Overall the results on ancestral origin versus individual heterozygosity show the clear superiority of ancestral mapping heterozygosity to infer ancestry of individual animals and as an estimate that can be used to obtain estimates of additive and heterosis effects in crossbred populations. The ancestral haplotype inference from LAMP-LD also produced estimates of European breed proportion that were more consistent with expectations than ADMIXTURE, which showed an upwards bias of estimates of European breed proportion for animals with very low European breed proportions when using a three-way analysis. Although not tested here, it is possible that this bias in estimates of European breed proportion could be corrected by rescaling the Admixture estimates. But deriving the rescaling method would require that either the true ancestral bred proportions were known, which will never be the case, or that better estimates are available such as those obtained from LAMP-LD. So, in most cases it seems preferable to simply use the LAMP-LD estimates directly.
Accuracy of Genotype Imputation in West African Cattle Populations
Genotype Imputation From Low-Density to Medium-Density
The concordance and correlation of imputation from low to medium density under various scenarios are shown in Figure 9. As expected, for all scenarios the concordance was higher and much less varying than the correlation. Several authors report both the correlation and concordance rate to compare the accuracy of imputation in cattle populations (Dassonneville et al., 2012; Berry et al., 2014; Aliloo et al., 2018). However, using the concordance rate as the best measure of imputation accuracy may be misleading because it was found to inflate accuracy for rare and low-frequency variants due to chance concordance or chance agreement (Hickey et al., 2012). To illustrate the effects of MAF on imputation accuracy, the value of correlation and concordance of imputed SNPs for the 2F_LD-MD scenario were plotted against the MAF (Supplementary Figure 3). A higher concordance value was achieved for SNPs with low MAF and the value declined as MAF increased, while the correlation value was not influenced by MAF. This is due to a high chance of correctly assigning rare alleles based on the allele frequencies of the population by transferring the major allele as the missing allele.
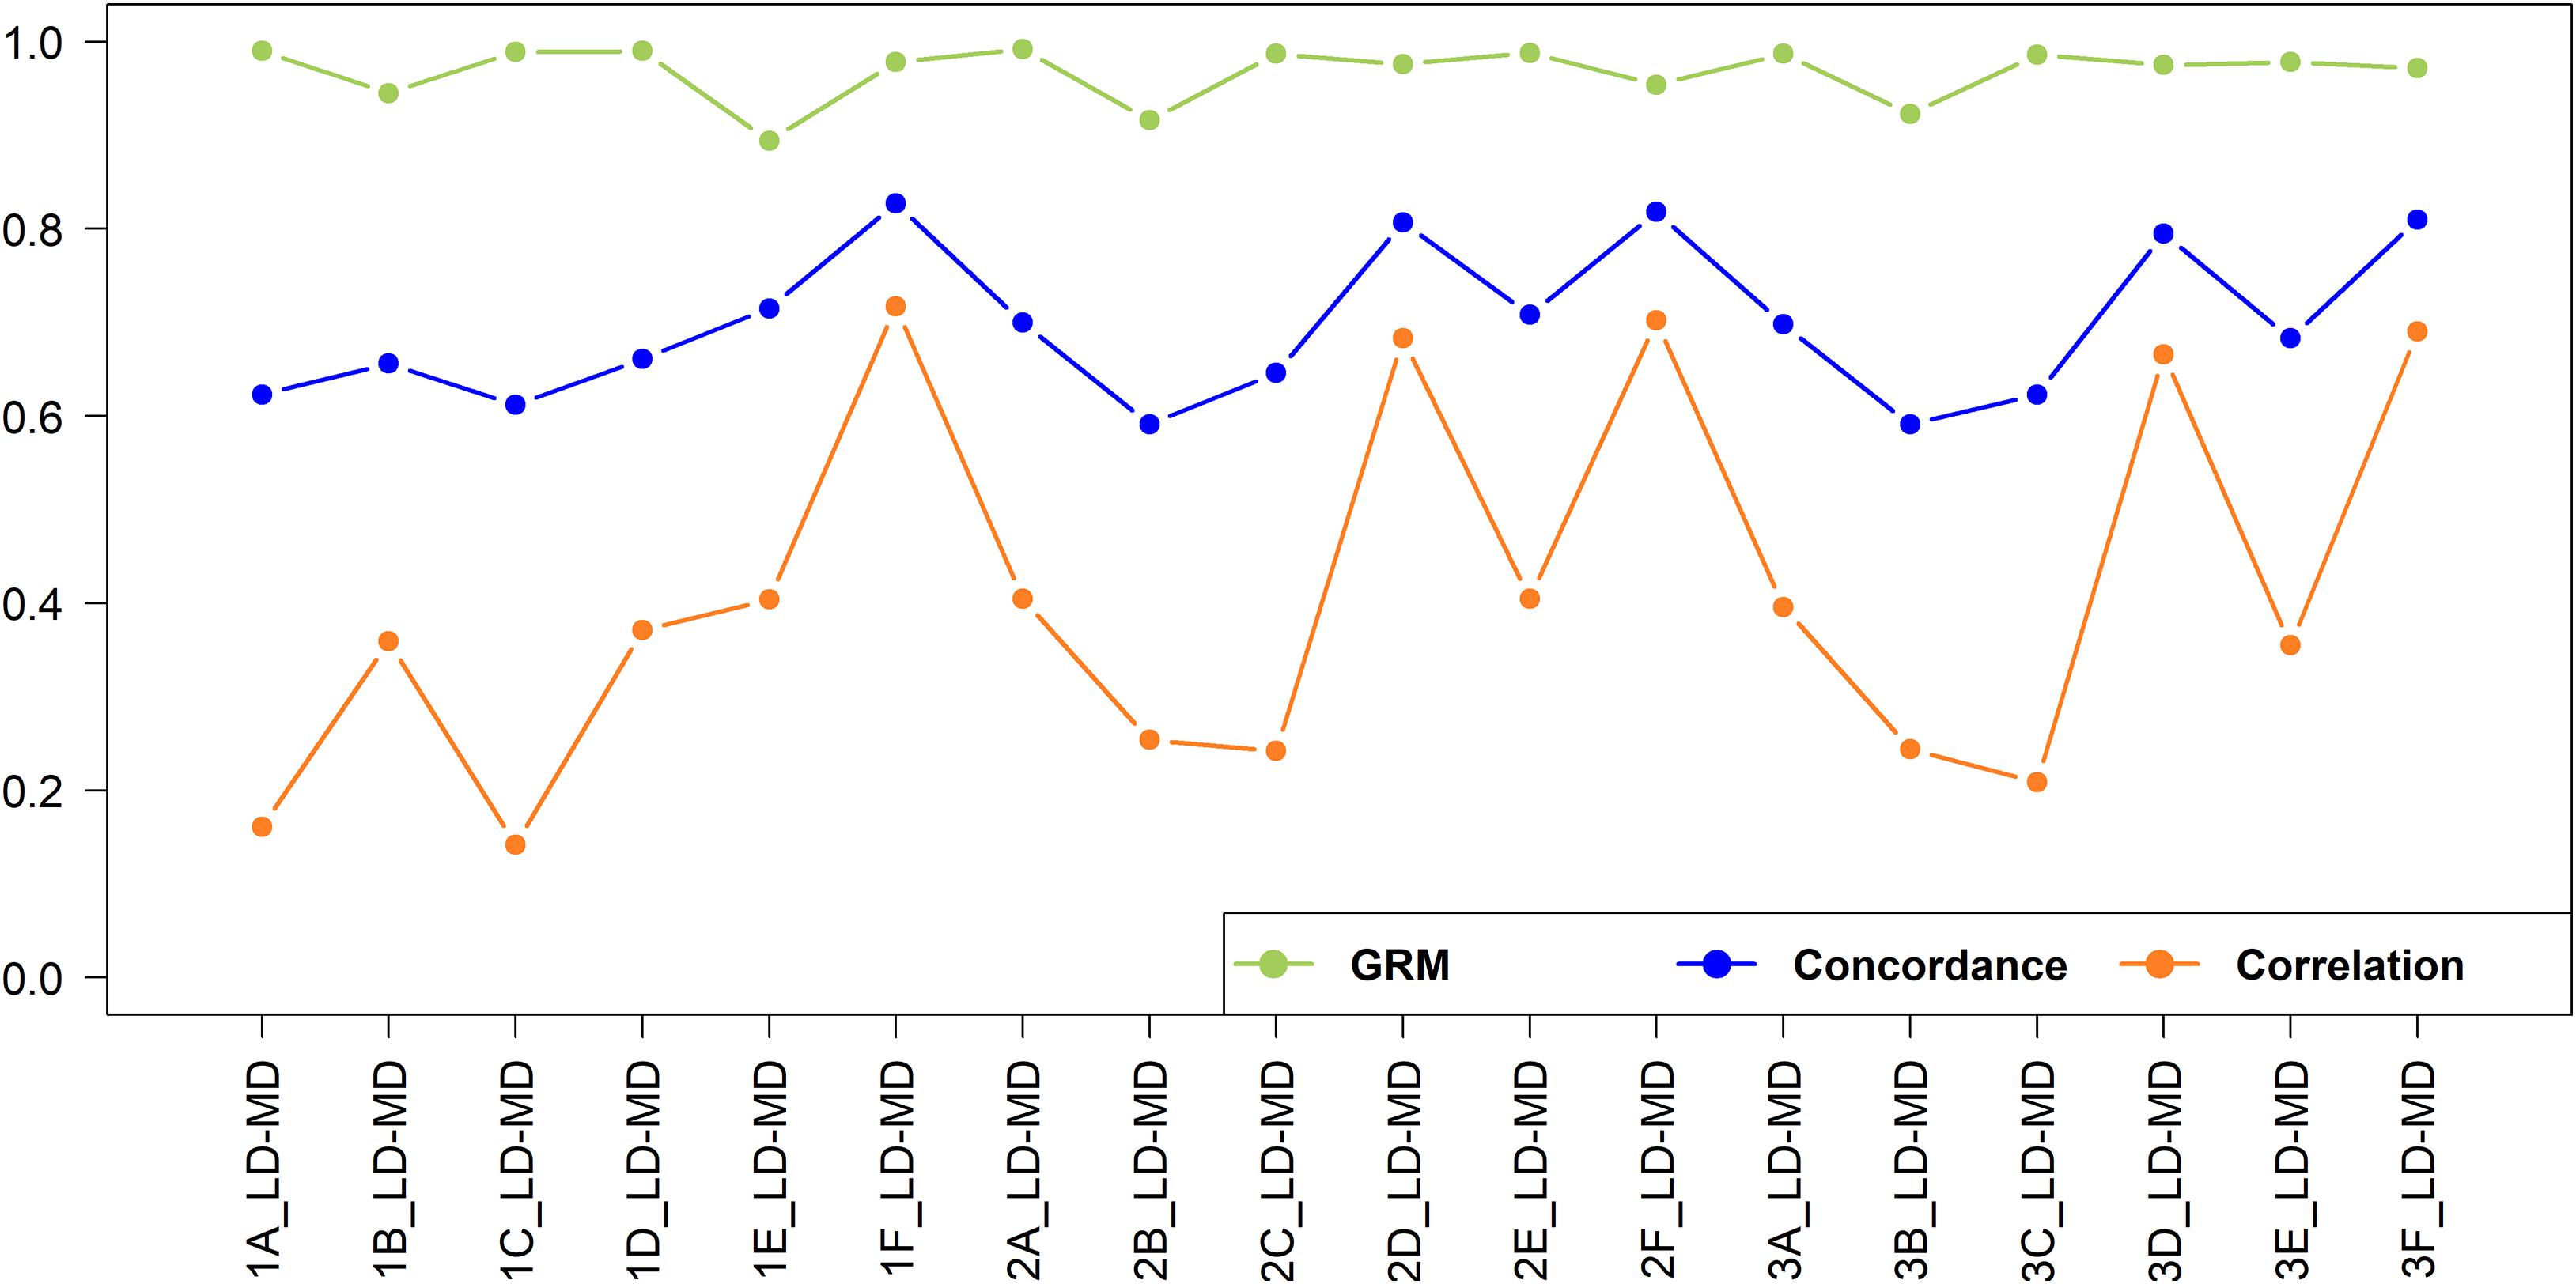
Figure 9. Genotype imputation accuracy and GRM correlation between real and imputed genotypes for imputation from low to medium-density.
In this study, the concordance was included for comparison with published literature but is not further discussed here as it represents a poor measure of the accuracy of imputation. From this point onwards, the estimate of the accuracy of imputation is the correlation of imputed versus true SNP genotypes. A total of 23,606 SNPs were imputed from low to high-density dataset. The imputation accuracies from low to medium-density were very low for all scenarios, ranging from 0.142 to 0.717. The best-case scenario (1F_LD-MD; r = 0.717), has an r2 of only 0.514; i.e., only 51.4% of the variation in SNP genotypes is accounted for imputation. Low accuracy of imputation may not be a major problem for some applications. Figure 9 also shows the correlation of the off-diagonal elements to the GRM built with imputed versus true genotypes, and these range from 0.894 to 0.992. This suggests that genomic estimated breeding values (GEBV) resulting from imputed versus real genotypes should be very highly correlated in many cases (Wu et al., 2016; Aliloo et al., 2018).
The imputation accuracies for the crossbreds were relatively higher when crossbreds or a combination of indigenous and crossbred populations were used as the reference sets. For Scenario 1, where East African populations were used as a reference, the accuracy was higher within the East African crossbred populations (Scenario 1F_LD-MD), while it was very low for imputation of West African indigenous populations (Scenario 1A_LD-MD and Scenario 1C_LD-MD). The accuracy improved when the imputation was performed within the West African indigenous (Scenario 2A_LD-MD) and crossbreds (Scenario 2D_LD-MD). The inclusion of East African indigenous to West African indigenous reference set did not improve the imputation accuracy (Scenario 2A_LD-MD versus Scenario 3A_LD-MD), while adding East African crossbreds to the West African crossbred reference set (Scenario 3D_LD-MD) resulted in a slight decrease in imputation accuracy.
Imputation accuracies are generally expected to be reasonably high for European dairy breeds, given that the SNP assays were in part designed for use in European B. taurus breeds and that training of imputation is often based on large sample sizes. Several authors reported an imputation accuracy (correlation) greater than 0.9 in European dairy breeds (Dassonneville et al., 2012; Mulder et al., 2012; Berry et al., 2014). This allows their widespread use for imputation and then the application to generate genomic EBVs, allowing lower cost and wider application of genotyping in genetic improvement. The accuracy in our African crossbred populations never approaches that found in European dairy breeds, even where the reference data involves many thousand animals sampled from the same population, as in the use of East African data to impute East African crossbred genotypes. We, therefore, infer that a new assay will need to be designed if low-density assays are to be reliable for use in genetic analyses of African crossbred dairy cattle. Although we have much less data on indigenous breeds than crossbreds, and hence cannot clearly differentiate the impact of low sample size versus poor assay design, it is reasonable to infer that newly designed assays will also be required for use in African indigenous breeds. Another reason could be the higher genetic diversity in African indigenous breeds compared to European dairy breeds (Gebrehiwot, 2020; Gebrehiwot et al., 2020), which might complicate imputation and reduces accuracy.
Genotype Imputation From Medium-Density to High-Density
The imputation concordance and correlation and the correlation of off-diagonal elements of the GRM for imputation from medium to high density are shown in Figure 10. A total of 592,660 SNPs were imputed from medium to high-density dataset. As expected given the substantially larger number of SNPs involved and hence smaller distance between adjacent SNPs, the imputation accuracy was always higher than when imputing from low to medium density.
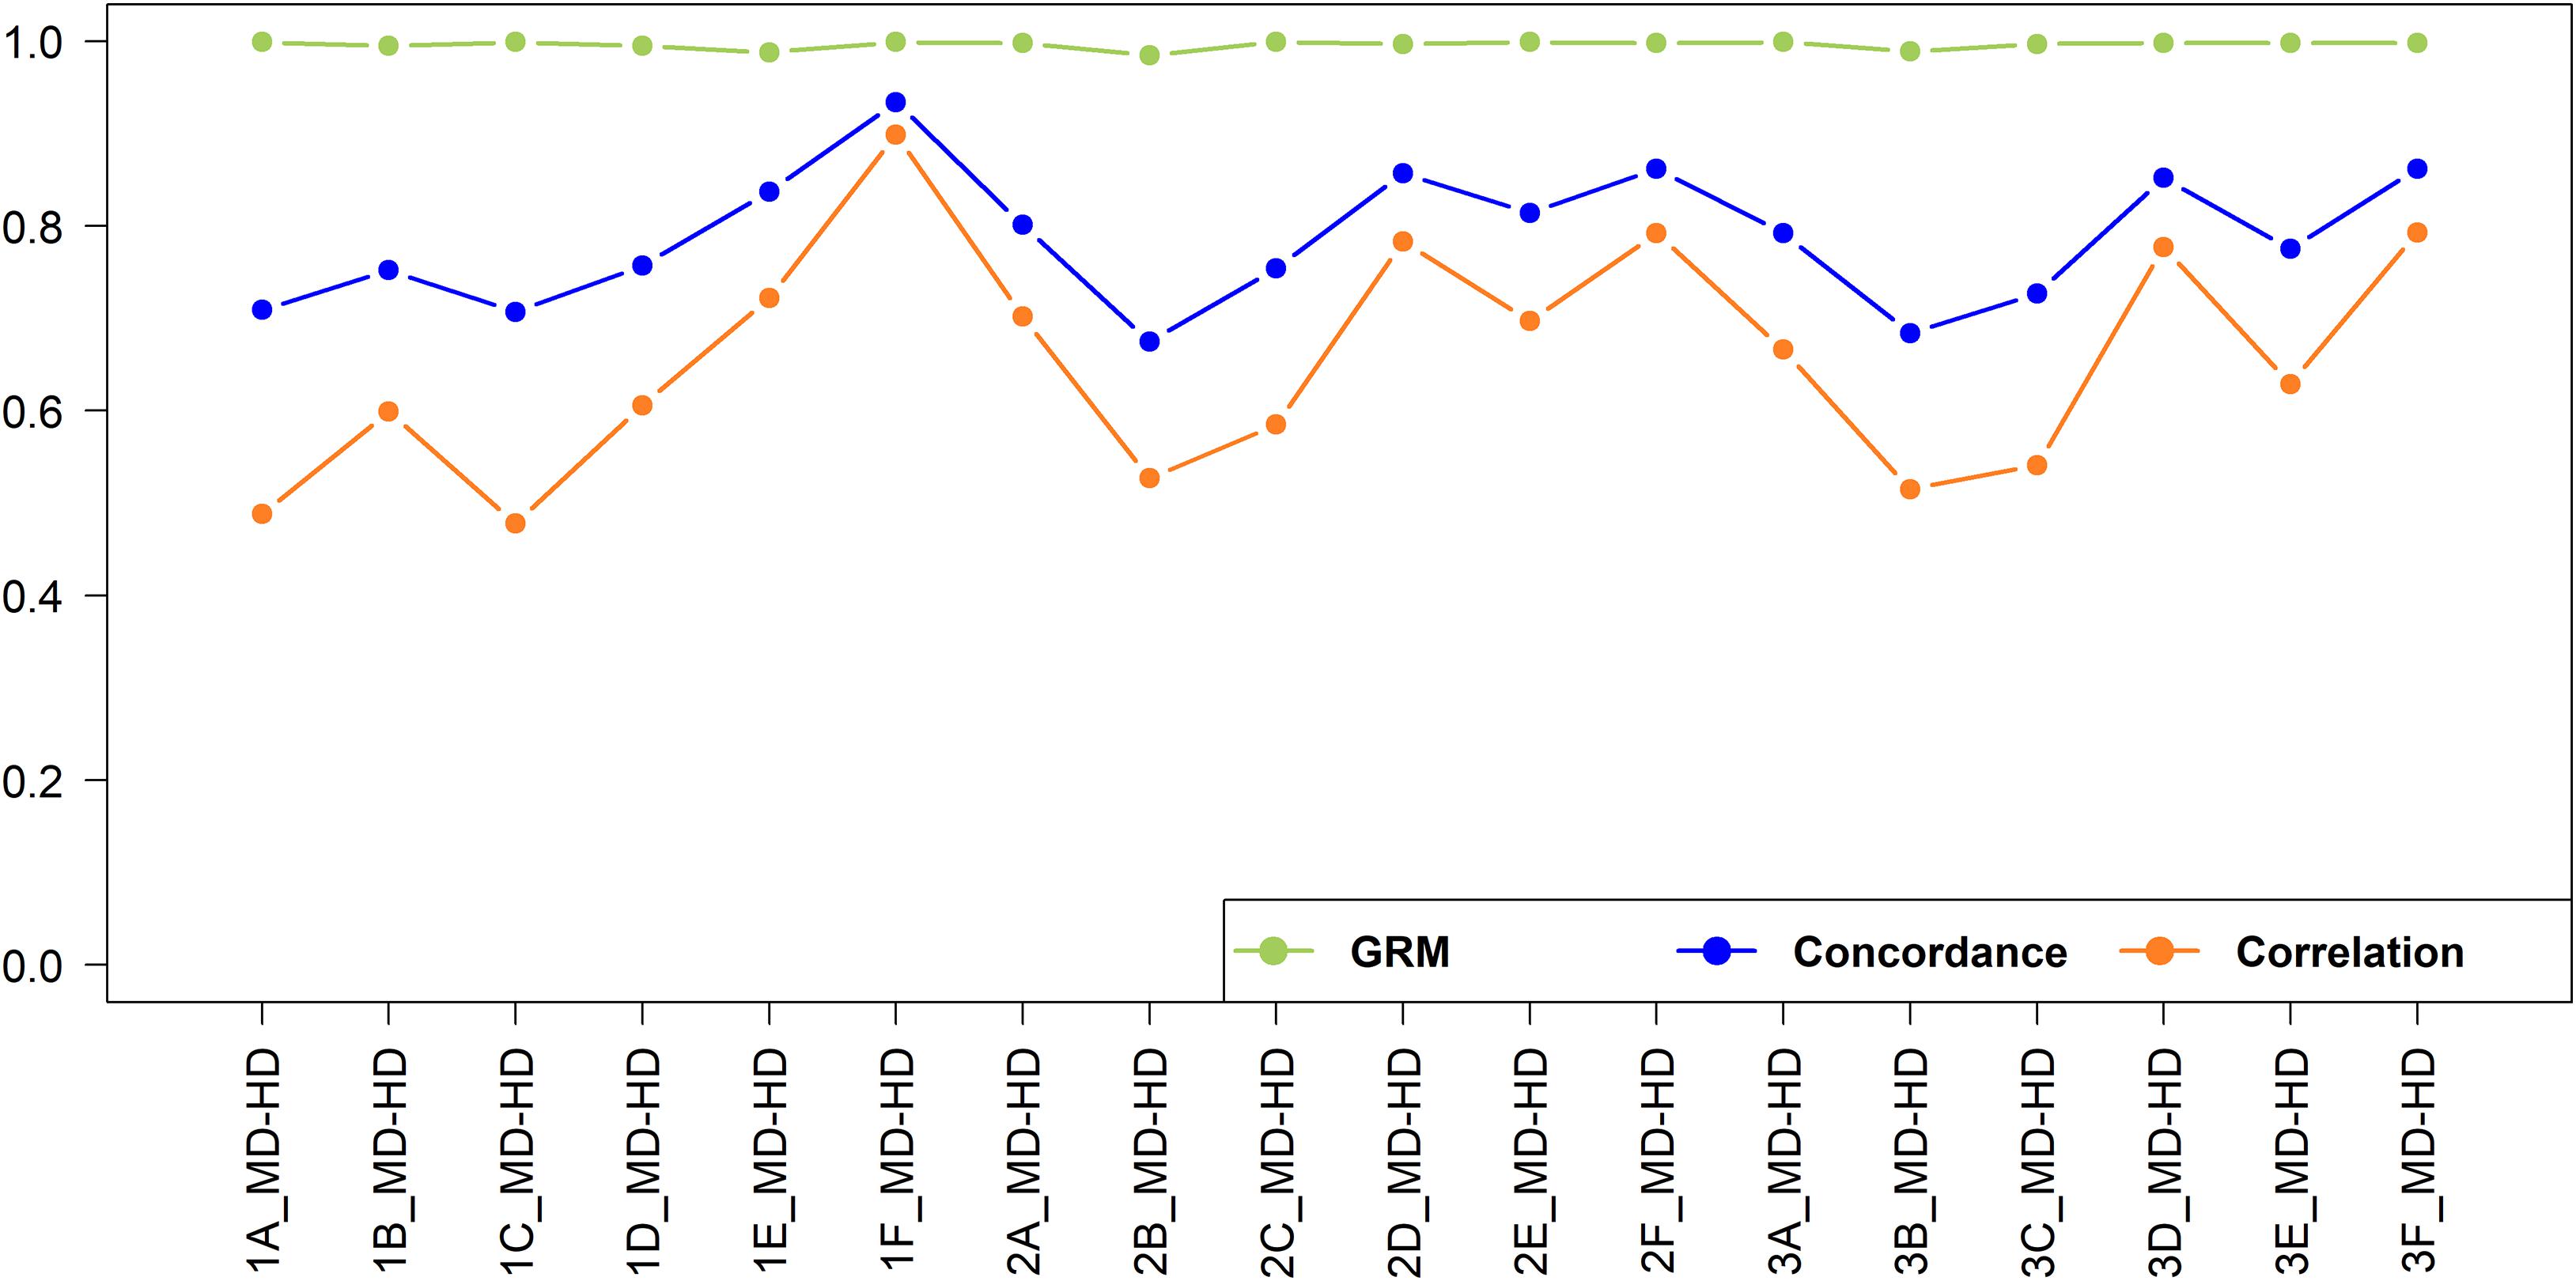
Figure 10. Genotype imputation accuracy and GRM correlation between real and imputed genotypes for imputation from medium to high-density.
In general, the accuracy was higher when imputation was performed within the geographical region than across geographical regions. This observation was also made in European dairy breeds, were a Holstein reference population yielded a lower imputation accuracy in German Black Pied cattle, despite providing a larger reference, compared to using a reference population of the same breed (Korkuæ et al., 2019). The accuracy was the highest (correlation = 0.899) when East African crossbreds were used as a reference set to impute East African crossbreds (Scenario 1F_MD_HD). This was because of the larger size of the reference set, and the reference set being sampled from the same population as the target set. Recently, Aliloo et al. (2018) reported a slightly higher imputation accuracy (correlation = 0.927) using a combined data of East African crossbred cows and bulls compared to the accuracy obtained in our study, which the data used here is a subset of the populations used by these authors. The slightly higher accuracy is likely due to the higher number of SNPs in their medium-density (dataset (42k SNPs) compared to the number available in our study (29k SNPs).
In West African populations, the accuracy of imputation was higher for crossbreds than the indigenous populations. This is in concordance with (Rowan et al., 2019) who reported that a multi-breed composite reference significantly increased imputation accuracy compared to a within-breed reference population. The highest correlation (0.702) for West African indigenous animals was found when a West African indigenous reference population was used (Scenario 2A_MD-HD), while the lowest correlation (0.478) was found when an East African indigenous reference population was used (Scenario 1C_MD-HD). The lower imputation accuracy for the indigenous populations compared to that of crossbreds is likely due to a combination of the smaller reference population size and the relatively high effective population sizes (Ne) and high genetic diversity in the African indigenous breeds (Gebrehiwot, 2020; Gebrehiwot et al., 2020). The accuracy of imputation for the indigenous populations would likely have been improved if the imputation had been performed within indigenous breeds, hence maximizing the shared LD between SNPs, rather than pooling all the indigenous data together; but sample sizes were too small here to test that hypothesis. The research here does not directly identify a target number to be genotyped but by extrapolation from imputation in the East African crossbred populations (Aliloo et al., 2018) at least 1,000 animals will be needed.
The addition of East African indigenous data to the West African indigenous reference data (Scenario 3A_MD-HD) and the addition of the East African crossbred data to the West African crossbred reference data (Scenario 3D_MD-HD) decreased the accuracies of prediction of West African indigenous and West African crossbreds by 4 and 1%, respectively. Brøndum et al. (2012) reported a similar reduction of imputation accuracy in a Holstein population when Danish, Swedish and Finnish Red cattle populations were added to the Holstein-Friesian reference set. This is likely due to a lack of consistent LD phase between these populations. In all scenarios, adding indigenous and crossbred reference data to impute crossbreds or adding crossbred data to indigenous data to impute in indigenous animals either decreased accuracies or increased only slightly (<3%) compared to use of crossbred or indigenous reference data alone. These small changes in accuracy, even when a large amount of data was added (e.g., Scenario 1C_MD-HD and 1D_MD-HD versus Scenario 1A_MD-HD and 1B_MD-HD, respectively), indicate that the additional data had little or no shared LD phase with the target population. Taken together, the results show that in order to obtain reasonably high accuracy of imputation within African indigenous or crossbred populations substantial reference data will need to be collected for the target populations because reference data from indigenous or crossbred populations from other regions of Africa generally provide poor accuracy of imputation.
The correlations of the off-diagonal elements of the GRMs constructed using real versus imputed genotypes (Figure 10) were all above 0.985. This is consistent with previous findings that even with a high error rate in genotype imputation, the genomic prediction accuracy still can be high (Wu et al., 2016; Aliloo et al., 2018). Our study further assessed the correlations of off-diagonal elements of the GRMs constructed using the real low-density versus medium-density and medium-density versus high-density genotypes for East African indigenous and crossbred populations and obtained correlation of 0.958 and 0.990 and 0.938 and 0.987, respectively. The high correlations among off-diagonal elements of GRMs from different density panels implies that the loss in genetic gain to implement genomic prediction using low or medium-density datasets compared to high-density genotypes is small in the East African cattle populations. Previously, Habier et al. (2009) and Cleveland et al. (2010) supported the feasibility of undertaking genomic prediction based on low-density genotypes for practical implementation, and the cost-efficiency of low-density genotypes allows a much larger proportion of the population to be included in the genomic evaluation procedure (Wiggans et al., 2012).
Overall, genomic information from high-density genotypes provides the opportunity to increase the rate of genetic progress in breeding programs (Hayes and Goddard, 2001). Though the price of high-density marker arrays is continually reducing, genotyping cost still is one of the main limiting factors for cost-efficient genomic applications. This high cost could be an issue in developing countries in Africa, where financial resources are very limited for the key stakeholders, such as smallholder dairy farmers. Therefore, a strategy that is used to overcome the cost limitations is to genotype a sufficiently large number of reference individuals from a given population with higher density or fully sequenced while the majority will be genotyped with lower density. This cost-effective strategy provides reliabilities of GEBVs that are similar to those obtained if selection candidates were genotyped with the higher-density chip (Khatkar et al., 2012; Mulder et al., 2012).
Conclusion
This study shows that ancestral heterozygosity can be estimated with high accuracy in African crossbred populations and will be far superior to the use of observed individual heterozygosity for estimating heterosis in such crossbred populations. The population-based imputation results highlighted the effects of different reference populations, SNP density, and sample size on imputation accuracy. It has been hoped by research groups working in Africa that high imputation accuracy might be achieved in African populations by using large-scale imputation information from other populations to impute in populations in which there is limited high-density genotype information, as has often been found to be possible for different breeds in developed countries. Unfortunately, the results show clearly that it was not possible to achieve high imputation accuracy in West African crossbred or indigenous populations based on large reference data sets from East Africa, and so larger population-specific genotype samples, especially considering the larger genetic diversity of African indigenous cattle, will be required to achieve high accuracy. This study provides a strong foundation to integrate genotype imputation into routine genomic evaluation pipelines for African cattle populations as a cost-effective way to boost the power of genomic-based genetic improvement.
Data Availability Statement
Data were sourced from the public domain and privately held databases as detailed in the manuscript. In most cases, the data held privately is available on request to the institution owning the data.
Ethics Statement
Ethical review and approval was not required for the animal study because Not applicable. Data sourced from previous studies.
Author Contributions
NG, JG, and HA conceived and designed the outline for the study. KM supervised the original Senegal study and arranged for the collection and genotyping of new Senegal samples used here. AM collected the 141 crossbred samples. NG performed the data analysis and drafted the manuscript. HA and MA gave methodological support. NG, JG, ES, HA, and KM interpreted the results. All authors read and approved the final manuscript.
Funding
NG was funded by the University of New England International Postgraduate Research Award (UNE IPRA). This research was funded in part by the Bill and Melinda Gates Foundation and with UK aid from the UK Government’s Department for International Development (grant agreement OPP1127286) under the auspices of the Centre for Tropical Livestock Genetics and Health (CTLGH), established jointly by the International Livestock Research Institute, University of Edinburgh, and SRUC (Scotland’s Rural College). The findings and conclusions contained within are those of the authors and do not necessarily reflect positions or policies of the funding providers.
Conflict of Interest
The authors declare that the research was conducted in the absence of any commercial or financial relationships that could be construed as a potential conflict of interest.
Acknowledgments
This work utilized data made available through the Genomics Reference Resource for African Cattle (GRRFAC) project, which is an initiative of African partners and the Centre for Tropical Livestock Genetics and Health (CTLGH). CTLGH was established jointly by the International Livestock Research Institute, University of Edinburgh, and Scotland’s Rural College. GRRFAC was funded by the Bill and Melinda Gates Foundation and with UK aid from the UK Foreign, Commonwealth and Development Office (grant agreement OPP1127286), as well as the CGIAR Research Program on Livestock (CRP Livestock), which is supported by contributors to the CGIAR Trust. GRRFAC partners who contributed specifically to this work are: Dr. Amadou Traore from Institut de l’Environnement et du Recherches Agricoles de Burkina Faso (INERA, Burkina Faso samples).
Supplementary Material
The Supplementary Material for this article can be found online at: https://www.frontiersin.org/articles/10.3389/fgene.2021.584355/full#supplementary-material
Supplementary Figure S1 | Ancestral origin heterozygosity against European breed proportion of crossbred animals using LAMP-LD based on (A) two-way admixture and (B) three-way admixture, showing the number of animals clustered at a particular location. Note that the clustering algorithm causes exaggerated shifts of the centroid of each point on the plot compared to Figures 4B, 5B.
Supplementary Figure S2 | Individual heterozygosity in West African crossbred cattle plotted against European breed proportion estimated using two-way admixture using (A) ADMIXTURE and (B) LAMP-LD.
Supplementary Figure S3 | The value of correlation and concordance of imputed SNPs against the MAF for the 2F_LD-MD scenario.
References
Alexander, D. H., Novembre, J., and Lange, K. (2009). Fast model-based estimation of ancestry in unrelated individuals. Genome Res. 19, 1655–1664. doi: 10.1101/gr.094052.109
Aliloo, H., Mrode, R., Okeyo, A., and Gibson, J. P. (2020). Ancestral haplotype mapping for GWAS and detection of signatures of selection in admixed dairy cattle of Kenya. Front. Genet. 11:544. doi: 10.3389/fgene.2020.00544
Aliloo, H., Mrode, R., Okeyo, A., Ni, G., Goddard, M., and Gibson, J. (2018). The feasibility of using low-density marker panels for genotype imputation and genomic prediction of crossbred dairy cattle of East Africa. J. Dairy Sci. 101, 9108–9127. doi: 10.3168/jds.2018-14621
Aulchenko, Y. S., Ripke, S., Isaacs, A., and Van Duijn, C. M. (2007). GenABEL: an R library for genome-wide association analysis. Bioinformatics 23, 1294–1296. doi: 10.1093/bioinformatics/btm108
Bahbahani, H., Clifford, H., Wragg, D., Mbole-Kariuki, M. N., Van Tassell, C., Sonstegard, T., et al. (2015). Signatures of positive selection in East African Shorthorn Zebu: a genome-wide single nucleotide polymorphism analysis. Sci. Rep. 5:11729. doi: 10.1038/srep11729
Baran, Y., Pasaniuc, B., Sankararaman, S., Torgerson, D. G., Gignoux, C., Eng, C., et al. (2012). Fast and accurate inference of local ancestry in Latino populations. Bioinformatics 28, 1359–1367. doi: 10.1093/bioinformatics/bts144
Berry, D. P., and Kearney, J. (2011). Imputation of genotypes from low-to high-density genotyping platforms and implications for genomic selection. Animal 5, 1162–1169. doi: 10.1017/S1751731111000309
Berry, D. P., Mcclure, M. C., and Mullen, M. P. (2014). Within and across breed imputation of high density genotypes in dairy and beef cattle from medium and low density genotypes. J. Anim. Breed. Genet. 131, 165–172. doi: 10.1111/jbg.12067
Brøndum, R. F., Ma, P., Lund, M. S., and Su, G. (2012). Short communication: genotype imputation within and across Nordic cattle breeds. J. Dairy Sci. 95, 6795–6800. doi: 10.3168/jds.2012-5585
Brown, R., and Pasaniuc, B. (2014). Enhanced methods for local ancestry assignment in sequenced admixed individuals. PLoS Comput. Biol. 10:e1003555. doi: 10.1371/journal.pcbi.1003555
Browning, B. L., and Browning, S. R. (2016). Genotype imputation with millions of reference samples. Am. J. Hum. Genet. 98, 116–126. doi: 10.1016/j.ajhg.2015.11.020
Browning, S. R., and Browning, B. L. (2007). Rapid and accurate haplotype phasing and missing-data inference for whole-genome association studies by use of localized haplotype clustering. Am. J. Hum. Genet. 81, 1084–1097. doi: 10.1086/521987
Chen, M., Yang, C., Li, C., Hou, L., Chen, X., and Zhao, H. (2014). Admixture mapping analysis in the context of GWAS with GAW18 data. BMC Proc. BioMed Cent. 1–5.
Churchhouse, C., and Marchini, J. (2013). Multiway admixture deconvolution using phased or unphased ancestral panels. Genet. Epidemiol. 37, 1–12. doi: 10.1002/gepi.21692
Cleveland, M., Forni, S., Garrick, D., and Deeb, N. (2010). “Prediction of genomic breeding values in a commercial pig population,” in Proceedings of the 9th World Congress on Genetics Applied to Livestock Production, Volume Species breeding: Pig breeding – Lecture Sessions, 0266, Leipzig.
Consortium, B. H., Gibbs, R. A., Taylor, J. F., Van Tassell, C. P., Barendse, W., Eversole, K. A., et al. (2009). Genome-wide survey of SNP variation uncovers the genetic structure of cattle breeds. Science 324, 528–532. doi: 10.1126/science.1167936
Das, S., Forer, L., Schönherr, S., Sidore, C., Locke, A. E., Kwong, A., et al. (2016). Next-generation genotype imputation service and methods. Nat. Genet. 48, 1284–1287. doi: 10.1038/ng.3656
Dassonneville, R., Fritz, S., Ducrocq, V., and Boichard, D. (2012). Short communication: imputation performances of 3 low-density marker panels in beef and dairy cattle. J. Dairy Sci. 95, 4136–4140. doi: 10.3168/jds.2011-5133
De Cara, M., Fernández, J., Toro, M., and Villanueva, B. (2011). Using genome wide information to minimize the loss of diversity in conservation programmes. J. Anim. Breed. Genet. 128, 456–464. doi: 10.1111/j.1439-0388.2011.00971.x
Decker, J. E., Mckay, S. D., Rolf, M. M., Kim, J., Alcalá, A. M., Sonstegard, T. S., et al. (2014). Worldwide patterns of ancestry, divergence, and admixture in domesticated cattle. PLoS Genet. 10:e1004254. doi: 10.1371/journal.pgen.1004254
Druet, T., and Georges, M. (2010). A hidden Markov model combining linkage and linkage disequilibrium information for haplotype reconstruction and quantitative trait locus fine mapping. Genetics 184, 789–798. doi: 10.1534/genetics.109.108431
Effa, K., Dessie, T., Yilma, Z., and Haile, A. (2009). “Cattle breeding strategies for sustainable genetic improvement in Ethiopia,” in Proceedings of the 17th Annual Conference of Ethiopian Society of Animal Production (ESAP). Climate Change, Livestock and People: Challenges, Opportunities, and the Way Forward, Addis Ababa.
Ema, P. N., Lassila, L., Missohou, A., Marshall, K., Tapio, M., Tebug, S. F., et al. (2018). Milk production traits among indigenous and crossbred dairy cattle in Senegal. Afr. J. Food Agric. Nutr. Dev. 18, 13572–13587.
Falush, D., Stephens, M., and Pritchard, J. K. (2003). Inference of population structure using multilocus genotype data: linked loci and correlated allele frequencies. Genetics 164, 1567–1587.
Flori, L., Thevenon, S., Dayo, G. K., Senou, M., Sylla, S., Berthier, D., et al. (2014). Adaptive admixture in the West African bovine hybrid zone: insight from the Borgou population. Mol. Ecol. 23, 3241–3257. doi: 10.1111/mec.12816
Gautier, M., Flori, L., Riebler, A., Jaffrézic, F., Laloé, D., Gut, I., et al. (2009). A whole genome Bayesian scan for adaptive genetic divergence in West African cattle. BMC Genomics 10:550. doi: 10.1186/1471-2164-10-550
Gebrehiwot, N. (2020). Application of Genomic Data to Map Genetic Diversity and Enable Genetic Improvement in African Cattle, With Particular Reference to Smallholder Dairy Cattle. Ph.D. thesis, The University of New England, Armidale, NSW.
Gebrehiwot, N. Z., Strucken, E. M., Aliloo, H., Marshal, K., and Gibson, J. P. (2020). The patterns of admixture, divergence, and ancestry of African cattle populations determined from genome-wide SNP data. BMC Genomics 21:869. doi: 10.1186/s12864-020-07270-x
Gondro, C., Porto Neto, L. R., and Lee, S. H. (2014). snpqc–an R pipeline for quality control of Illumina SNP genotyping array data. Anim. Genet. 45, 758–761. doi: 10.1111/age.12198
Gregory, K., and Cundiff, L. (1980). Crossbreeding in beef cattle: evaluation of systems. J. Anim. Sci. 51, 1224–1242. doi: 10.2527/jas1980.5151224x
Habier, D., Fernando, R. L., and Dekkers, J. C. (2009). Genomic selection using low-density marker panels. Genetics 182, 343–353. doi: 10.1534/genetics.108.100289
Hanotte, O., Bradley, D. G., Ochieng, J. W., Verjee, Y., Hill, E. W., and Rege, J. E. O. (2002). African pastoralism: genetic imprints of origins and migrations. Science 296, 336–339. doi: 10.1126/science.1069878
Hayes, B., and Goddard, M. (2001). Prediction of total genetic value using genome-wide dense marker maps. Genetics 157, 1819–1829.
Hickey, J. M., Kinghorn, B. P., Tier, B., Van Der Werf, J. H., and Cleveland, M. A. (2012). A phasing and imputation method for pedigreed populations that results in a single-stage genomic evaluation. Genet. Sel. Evol. 44:9. doi: 10.1186/1297-9686-44-9
Howie, B., Fuchsberger, C., Stephens, M., Marchini, J., and Abecasis, G. R. (2012). Fast and accurate genotype imputation in genome-wide association studies through pre-phasing. Nat. Genet. 44, 955–959. doi: 10.1038/ng.2354
Howie, B. N., Donnelly, P., and Marchini, J. (2009). A flexible and accurate genotype imputation method for the next generation of genome-wide association studies. PLoS Genet. 5:e100052. doi: 10.1371/journal.pgen.1000529
Iversen, M. W., Nordbø, Ø, Gjerlaug-Enger, E., Grindflek, E., Lopes, M. S., and Meuwissen, T. (2019). Effects of heterozygosity on performance of purebred and crossbred pigs. Genet. Sel. Evol. 51:8. doi: 10.1186/s12711-019-0450-1
Kasarapu, P., Porto-Neto, L. R., Fortes, M. R., Lehnert, S. A., Mudadu, M. A., Coutinho, L., et al. (2017). The Bos taurus–Bos indicus balance in fertility and milk related genes. PLoS One 12:e0181930. doi: 10.1371/journal.pone.0181930
Khatkar, M. S., Moser, G., Hayes, B. J., and Raadsma, H. W. (2012). Strategies and utility of imputed SNP genotypes for genomic analysis in dairy cattle. BMC Genomics 13:538. doi: 10.1186/1471-2164-13-538
Khayatzadeh, N., Mészáros, G., Utsunomiya, Y., Schmitz Hsu, F., Seefried, F., Schnyder, U., et al. (2018). Effects of breed proportion and components of heterosis for semen traits in a composite cattle breed. J. Anim. Breed. Genet. 135, 45–53. doi: 10.1111/jbg.12304
Kim, J., Hanotte, O., Mwai, O. A., Dessie, T., Bashir, S., Diallo, B., et al. (2017). The genome landscape of indigenous African cattle. Genome Biol. 18:34. doi: 10.1186/s13059-017-1153-y
Korkuæ, P., Arends, D., and Brockmann, G. A. (2019). Finding the optimal imputation strategy for small cattle populations. Front. Genet. 10:52. doi: 10.3389/fgene.2019.00052
Li, Y., Willer, C. J., Ding, J., Scheet, P., and Abecasis, G. R. (2010). MaCH: using sequence and genotype data to estimate haplotypes and unobserved genotypes. Genet. Epidemiol. 34, 816–834. doi: 10.1002/gepi.20533
Loh, P.-R., Danecek, P., Palamara, P. F., Fuchsberger, C., Reshef, Y. A., Finucane, H. K., et al. (2016). Reference-based phasing using the Haplotype Reference Consortium panel. Nat. Genet. 48, 1443–1448. doi: 10.1038/ng.3679
Marshall, K., Salmon, G., Tebug, S., Juga, J., Macleod, M., Poole, J., et al. (2020). Net benefits of smallholder dairy cattle farms in Senegal can be significantly increased through the use of better dairy cattle breeds and improved management practices. J. Dairy Sci. 103, 8197–8217. doi: 10.3168/jds.2019-17334
Marshall, K., Tebug, S., Salmon, G. R., Tapio, M., Juga, J., and Missohou, A. (2017). Improving Dairy Cattle Productivity in Senegal. ILRI Policy Brief 22. Nairobi: ILRI.
Mbole-Kariuki, M. N., Sonstegard, T., Orth, A., Thumbi, S., De, C., Bronsvoort, B., et al. (2014). Genome-wide analysis reveals the ancient and recent admixture history of East African Shorthorn Zebu from Western Kenya. Heredity 113, 297–305. doi: 10.1038/hdy.2014.31
McAllister, A. (2002). Is crossbreeding the answer to questions of dairy breed utilization? J. Dairy Sci. 85, 2352–2357. doi: 10.3168/jds.S0022-0302(02)74315-4
Mulder, H., Calus, M., Druet, T., and Schrooten, C. (2012). Imputation of genotypes with low-density chips and its effect on reliability of direct genomic values in Dutch Holstein cattle. J. Dairy Sci. 95, 876–889. doi: 10.3168/jds.2011-4490
Okomo-Adhiambo, M. (2002). Characterisation of Genetic Diversity in Indigenous Cattle of East Africa: Use of Microsatellite DNA Techniques. AGTR Case Study. Nairobi: ILRI.
Padhukasahasram, B. (2014). Inferring ancestry from population genomic data and its applications. Front. Genet. 5:204. doi: 10.3389/fgene.2014.00204
Pasaniuc, B., Sankararaman, S., Kimmel, G., and Halperin, E. (2009). Inference of locus-specific ancestry in closely related populations. Bioinformatics 25, i213–i221. doi: 10.1093/bioinformatics/btp197
Pritchard, J. K., Stephens, M., and Donnelly, P. (2000). Inference of population structure using multilocus genotype data. Genetics 155, 945–959.
R Core Team (2018). R: A Language and Environment for Statistical Computing. Vienna: R Foundation for Statistical Computing.
Rege, J. (2001). Zebu Cattle of Kenya: Uses, Performance, Farmer Preferences, Measures of Genetic Diversity and Options for Improved Use. Addis Ababa: ILRI.
Rowan, T. N., Hoff, J. L., Crum, T. E., Taylor, J. F., Schnabel, R. D., and Decker, J. E. (2019). A multi-breed reference panel and additional rare variants maximize imputation accuracy in cattle. Genet. Sel. Evol. 51:77. doi: 10.1186/s12711-019-0519-x
Sankararaman, S., Sridhar, S., Kimmel, G., and Halperin, E. (2008). Estimating local ancestry in admixed populations. Am. J. Hum. Genet. 82, 290–303. doi: 10.1016/j.ajhg.2007.09.022
Sargolzaei, M., Chesnais, J., and Schenkel, F. (2011). FImpute-an efficient imputation algorithm for dairy cattle populations. J. Dairy Sci. 94:421.
Sargolzaei, M., Chesnais, J. P., and Schenkel, F. S. (2014). A new approach for efficient genotype imputation using information from relatives. BMC Genomics 15:478. doi: 10.1186/1471-2164-15-478
Strucken, E. M., Al-Mamun, H. A., Esquivelzeta-Rabell, C., Gondro, C., Mwai, O. A., and Gibson, J. P. (2017). Genetic tests for estimating dairy breed proportion and parentage assignment in East African crossbred cattle. Genet. Sel. Evol. 49, 67. doi: 10.1186/s12711-017-0342-1
Strucken, E. M., Swaminathan, M., Joshi, S., and Gibson, J. (2019). “Genetic characterization of Indian indigenous cattle breeds,” in Proceedings of the Assocation for the Advancement of Animal Breeding and Genetics (AAABG), Armidale, NSW, 187–190.
Tegegne, A., Gebremedhin, B., and Hoekstra, D. (2010). Livestock Input Supply and Service Provision in Ethiopia: Challenges and Opportunities for Market-Oriented Development. IPMS Working Paper 20. Nairobi: ILRI.
Utsunomiya, Y., Milanesi, M., Fortes, M., Porto Neto, L., Utsunomiya, A., Silva, M., et al. (2019). Genomic clues of the evolutionary history of Bos indicus cattle. Anim. Genet. 50, 557–568. doi: 10.1111/age.12836
VanRaden, P. M. (2008). Efficient methods to compute genomic predictions. J. Dairy Sci. 91, 4414–4423. doi: 10.3168/jds.2007-0980
VanRaden, P. M., O’connell, J. R., Wiggans, G. R., and Weigel, K. A. (2011). Genomic evaluations with many more genotypes. Genet. Sel. Evol. 43, 10. doi: 10.1186/1297-9686-43-10
Verdugo, M. P., Mullin, V. E., Scheu, A., Mattiangeli, V., Daly, K. G., Delser, P. M., et al. (2019). Ancient cattle genomics, origins, and rapid turnover in the Fertile Crescent. Science 365, 173–176.
Weerasinghe, M. S. P. W. (2014). Use of Genetic Polymorphisms to Assess the Genetic Structure and Breed Composition of Crossbred Animals. Ph.D. thesis, The University of New England, Armidale NSW.
Wiggans, G., Cooper, T., Vanraden, P., Olson, K., and Tooker, M. (2012). Use of the Illumina Bovine3K BeadChip in dairy genomic evaluation. J. Dairy Sci. 95, 1552–1558. doi: 10.3168/jds.2011-4985
Wu, X.-L., Xu, J., Feng, G., Wiggans, G. R., Taylor, J. F., He, J., et al. (2016). Optimal design of low-density SNP arrays for genomic prediction: algorithm and applications. PLoS One 11:e0161719. doi: 10.1371/journal.pone.0161719
Wuletaw, Z. (2004). Performance Evaluation of Cattle Crossbreeding Program of Integrated Livestock Development Project: Case study on the Contribution of Crossbred Animals on the Livelihood of the Rural Community.Gondar: Integrated Livestock Development Project [ILDP].
Keywords: ADMIXTURE, African cattle, global ancestry, Minimac, LAMP-LD, local ancestry, PCA, SNPs
Citation: Gebrehiwot NZ, Aliloo H, Strucken EM, Marshall K, Al Kalaldeh M, Missohou A and Gibson JP (2021) Inference of Ancestries and Heterozygosity Proportion and Genotype Imputation in West African Cattle Populations. Front. Genet. 12:584355. doi: 10.3389/fgene.2021.584355
Received: 17 July 2020; Accepted: 22 February 2021;
Published: 23 March 2021.
Edited by:
Shu-Hong Zhao, Huazhong Agricultural University, ChinaReviewed by:
Mekonnen Haile-Mariam, Department of Economic Development, Jobs, Transport and Resources, AustraliaNegar Khayatzadeh, University of Natural Resources and Life Sciences Vienna, Austria
Copyright © 2021 Gebrehiwot, Aliloo, Strucken, Marshall, Al Kalaldeh, Missohou and Gibson. This is an open-access article distributed under the terms of the Creative Commons Attribution License (CC BY). The use, distribution or reproduction in other forums is permitted, provided the original author(s) and the copyright owner(s) are credited and that the original publication in this journal is cited, in accordance with accepted academic practice. No use, distribution or reproduction is permitted which does not comply with these terms.
*Correspondence: Netsanet Z. Gebrehiwot, YmdlYnJlaGlAbXl1bmUuZWR1LmF1; John P. Gibson, amdpYnNvbjVAdW5lLmVkdS5hdQ==