- 1Key Laboratory for Xinjiang Endemic and Ethnic Diseases, Department of Pathology, Shihezi University School of Medicine, Shihezi, China
- 2Department of Pathology and Medical Research Center, Beijing Chaoyang Hospital, Capital Medical University, Beijing, China
TP53 mutation (TP53MUT) is one of the most common gene mutations and frequently occurs in many cancers, especially esophageal carcinoma (ESCA), and it correlates with clinical prognostic outcomes. Nevertheless, the mechanisms by which TP53MUT regulates the correlation between ESCA and prognosis have not been sufficiently studied. Here, in the current research, we constructed a TP53MUT-related signature to predict the prognosis of patients with esophageal cancer and successfully verified this model in patients in the TP53 mutant group, esophageal squamous cell carcinoma group, and adenocarcinoma group. The risk scores proved to be better independent prognostic factors than clinical features, and prognostic features were combined with other clinical features to establish a convincing nomogram to predict overall survival from 1 to 3 years. In addition, we further predicted the tumor immune cell infiltration, chemical drugs, and immunotherapy responses between the high-risk group and low risk group. Finally, the gene expression of the seven-gene signature (AP002478.1, BHLHA15, FFAR2, IGFBP1, KCTD8, PHYHD1, and SLC26A9) can provide personalized prognosis prediction and insights into new treatments.
Introduction
Esophageal carcinoma (ESCA) is the seventh most common malignant tumor globally (Bray et al., 2020), with a 5-year survival rate ranging from 10 to 25% (Stein et al., 2005). This type of carcinoma consists of two main subtypes: esophageal adenocarcinoma (ESAD) and esophageal squamous cell carcinoma (ESCC). The incidence of both types of cancer is increasing year on year, so this study investigated the two together (Wei et al., 2015; Deng et al., 2018). Despite a variety of clinical treatments, the 5-year overall survival (OS) rate of this disease is still low (Suntharalingam et al., 2017; Huang and Yu, 2018). Recently, a handful of evidence has indicated that the number of immune-inflammatory cells in the tumor microenvironment (TME) may be associated with malignant phenotypes of ESCA (Lin et al., 2016; Kelly, 2017), thereby promoting the production and development of the population of ESCA (Zhao et al., 2020). Therefore, we need to further reveal the possible function and mechanism by which this TP53-related signature is mediated in ESCA.
P53 is a well-known suppressor gene that has multiple antitumor functions, including apoptosis, senescence, cell cycle arrest, DNA repair, and autophagy response (Hong et al., 2014; Zhang et al., 2017; Lundsten et al., 2020; Shi et al., 2020). Aside from the fundamental role of p53 in suppressing tumor initiation, abnormalities in TP53 (TP53 mutation status) are the most common genetic alterations observed, resulting in abnormal cell growth and other oncogene functions in human cancers, including non-small-cell lung cancer, breast cancer, liver cancer, and ESCA (Silwal-Pandit et al., 2017; Giacomelli et al., 2018; Jiao et al., 2018; Kang et al., 2018; Long et al., 2019; Xu et al., 2020). A wealth of published articles also show that TP53Mut is significantly linked to patient outcomes by effectively modulating cancer cells to secrete cytokines and chemokines (Canale et al., 2020), supporting cancer cell onset and dissemination by establishing the TME (Ham et al., 2019; Pathak et al., 2015). For instance, TP53Mut was reported to induce CXCL5, CXCL8, and CXCL12, which promoted cell migration and invasion in vitro, thus confirming that the secretion of pro-angiogenic factors and chemokines is a gain-of-function for TP53Mut (Ignacio et al., 2018). Intriguingly, TP53Mut literature associated with the tumor microenvironment (TME) has not been well reported in ESCA, and it is still unclear whether the regulation of immunity in ESCA depends on TP53 mutation. Therefore, therapeutic strategies targeting mutated TP53, which most patients with ESCA carry, may present a novel perspective for understanding the development of ESCA.
In this paper, we aimed to construct a TP53-related prognostic signature and to divide patients into two subtypes with different responses to chemotherapy. This was found to play a pivotal role in immune-related biological function in ESCA development. Overall, our studies highlight a new regulatory possibility for ESCA, which could contribute to the development of a therapeutic strategy for patients with esophageal carcinoma.
Materials and Methods
Patients and Specimens
The RNA-Seq data, somatic mutation data, and corresponding clinical data with ESCA patients were obtained from TCGA (February 1st, 20201) (Tomczak et al., 2015). We collected 171 samples with gene expression data, including 160 tumor tissue samples, 11 normal samples, and 181 somatic mutation data, from the TCGA database. Somatic mutation data of 396 esophageal adenocarcinoma cases and 291 esophageal squamous cell carcinoma cases were obtained from the ICGC database2 (Banks and Lopezotín, 2010). Gene set enrichment analysis (GSEA) (Kuleshov et al., 2019; Reimand et al., 2019) was performed to investigate the potential mechanisms of TP53 mutation and wild-type TP53. The number of random sample permutations was set at 1,000, and the significance threshold was set at p < 0.05.
Identification of Differentially Expressed Genes
Perl and R scripts were used for all data processing and normalized analysis and usage. Furthermore, the mRNA expression profile was analyzed to screen differentially expressed genes (DEGs) between the ESCA and normal samples. Dysregulated genes in the two groups were identified by using the edgeR package (Robinson et al., 2010). A | log 2fold change (log2FC) | > 2 and adjusted P < 0.05 were set as the threshold of differences. In addition, we divided the data into two groups based on the TP53 wild-type and mutated types; the mRNA expression profile was also analyzed to screen differentially expressed genes (DEGs) between these group. A | log2fold change (log2FC) | > 1 and adjusted P < 0.05 were set as the threshold of differences. By intersecting with the above DEGs, target genes were eventually achieved.
Constructing the Prognosis Signature
The univariate Cox proportional hazard regression method was used to assess the relationship between DEGs and OS of patients. The 12 candidate genes (P < 0.05) were selected for stepwise multivariate Cox regression fitting. The remaining OS-related genes were adjusted by the stepwise multivariate Cox regression model. Furthermore, we identified those genes that fit in the model were independently associated with OS. Finally, according to the median risk score, patients were divided into a high-risk group and a low-risk group for comparison, and the log-rank test was used to compare the survival difference between the two groups.
Independent Prognostic Role of the Multigene Signature and Construction of the Nomogram
To validate whether the prognostic signature could be independent among clinical parameters, including sex, age, tumor grade, TNM stage, and risk score, univariate and multivariate analyses were performed using the Cox regression model method with a forward stepwise procedure. Statistical significance was defined as a P-value < 0.05. All data were processed using the R package “survival ROC.” Additionally, a nomogram was established based on the independent prognostic factors identified by multivariate analysis to investigate the 1–, 2–, and 3-year OS of ESCA patients. The nomogram and calibration plots were generated using the RMS R package (Version: 5.1–3).
Immunotherapeutic and Chemotherapeutic Response Prediction
The programmed cell death 1 (PCDC1, also known as PD-1)/CD274 molecule (CD274, also known as PD-L1) and cytotoxic T-lymphocyte associated protein 4 (CTLA-4) pathways have been implicated in tumor immune evasion, and therefore, immune checkpoint inhibitors targeting PD-1 and CTLA-4 can thereby enhance antitumor immunity. We used the Tumor Immune Dysfunction and Exclusion (TIDE) algorithm and subclass mapping to predict clinical responses to immune checkpoint inhibitors as previously described (Jiang et al., 2018; Fu et al., 2020). As chemotherapy is commonly used to treat ESCA, we used the R package “pRRophetic” to estimate the chemotherapeutic response determined by the half maximal inhibitory concentration (IC50) of each ESCA patient on the Genomics of Drug Sensitivity in Cancer (GDSC) website (Garnett et al., 2012; Yang et al., 2012; Orio et al., 2016).
Estimation of Tumor-Infiltrating Immune Cells
CIBERSORT is an analytical tool developed by Newman et al. to provide an estimation of the abundances of member cell types in a mixed cell population using gene expression data, and it is highly consistent with ground-truth estimations in many cancers (Newman et al., 2015). Hence, we used a combination of the normalized esophageal cancer gene expression matrix and the LM22 signature matrix to estimate the scores of 22 human hematopoietic cell phenotypes between high- and low-risk patients. For each sample, the sum of all estimated immune cell type scores is equal to 1. The R package “Genefilter” was used to screen each sample, and the threshold was set at a p-value < 0.05. The final CIBERSORT output was subsequently analyzed.
Statistical Analyses
Statistical analyses were performed with R software (Version 3.6.1). Univariate and multivariate Cox regression models were used to evaluate prognostic significance. The overall survival (OS) time of the risk groups was analyzed using Kaplan-Meier (KM) survival analysis, followed by a log-rank test. The sensitivity and specificity of the model were evaluated using ROC curves. Additionally, we verified the confidence of the model using test data sets and entire data sets. Recently, hazard ratios (HRs) and 95% confidence intervals (CIs) were used to describe the relative risk. A P-value < 0.05 was regarded as a statistically significant difference.
Results
TP53 Mutations in ESCA
From the TCGA data, TP53 mutation in ESCA was found to be extraordinarily high (83%; Figure 1A). Previous studies have shown that TP53MUT in ESCA plays a crucial role in patient prognosis and tumor-promoting phenotypes in vivo and in vitro (Ralhan et al., 2000; Makino et al., 2010; Wong et al., 2013). Similar to these observations, we also identified the TP53 mutation status of ESAC in the ICGC database, which occurred at a high frequency in the TCGA data (ranked first, Figures 1B,C). The location and frequency of the mutation in ESCA are shown in Figures 2A,B. Moreover, GSEA was performed to participate in gene ontological (GO) enrichment and KEGG pathway analysis to explore insights into TP53 mutation functionality. The results illustrated that samples with and without TP53 mutations were obviously clustered in KEGG_DNA_REPLICATION, KEGG_MISSMATCH_REPAIR; KEGG_CELL_CYCLE, KEGG_ SMALL_CELL_LUNG_CANCER, GO_ADAPTIVE_IMMUNE _RESPONSE, GO_ORGAN_OR_TISSUE_SPECIFIC_IMMUNE _RESPONSE (Wu et al., 2020), GO_REGULATION _OF_HUMORAL_IMMUNE_RESPONSE, GO_T_HELPER_1_ TYPE_IMMUNE_RESPONSE, and GO_REGULATION_OF_ IMMUNE_EFFECTOR_PROCESS, suggesting that the gene associated with TP53MUT can have an immunomodulatory effect on ESCA (Figure 1D).
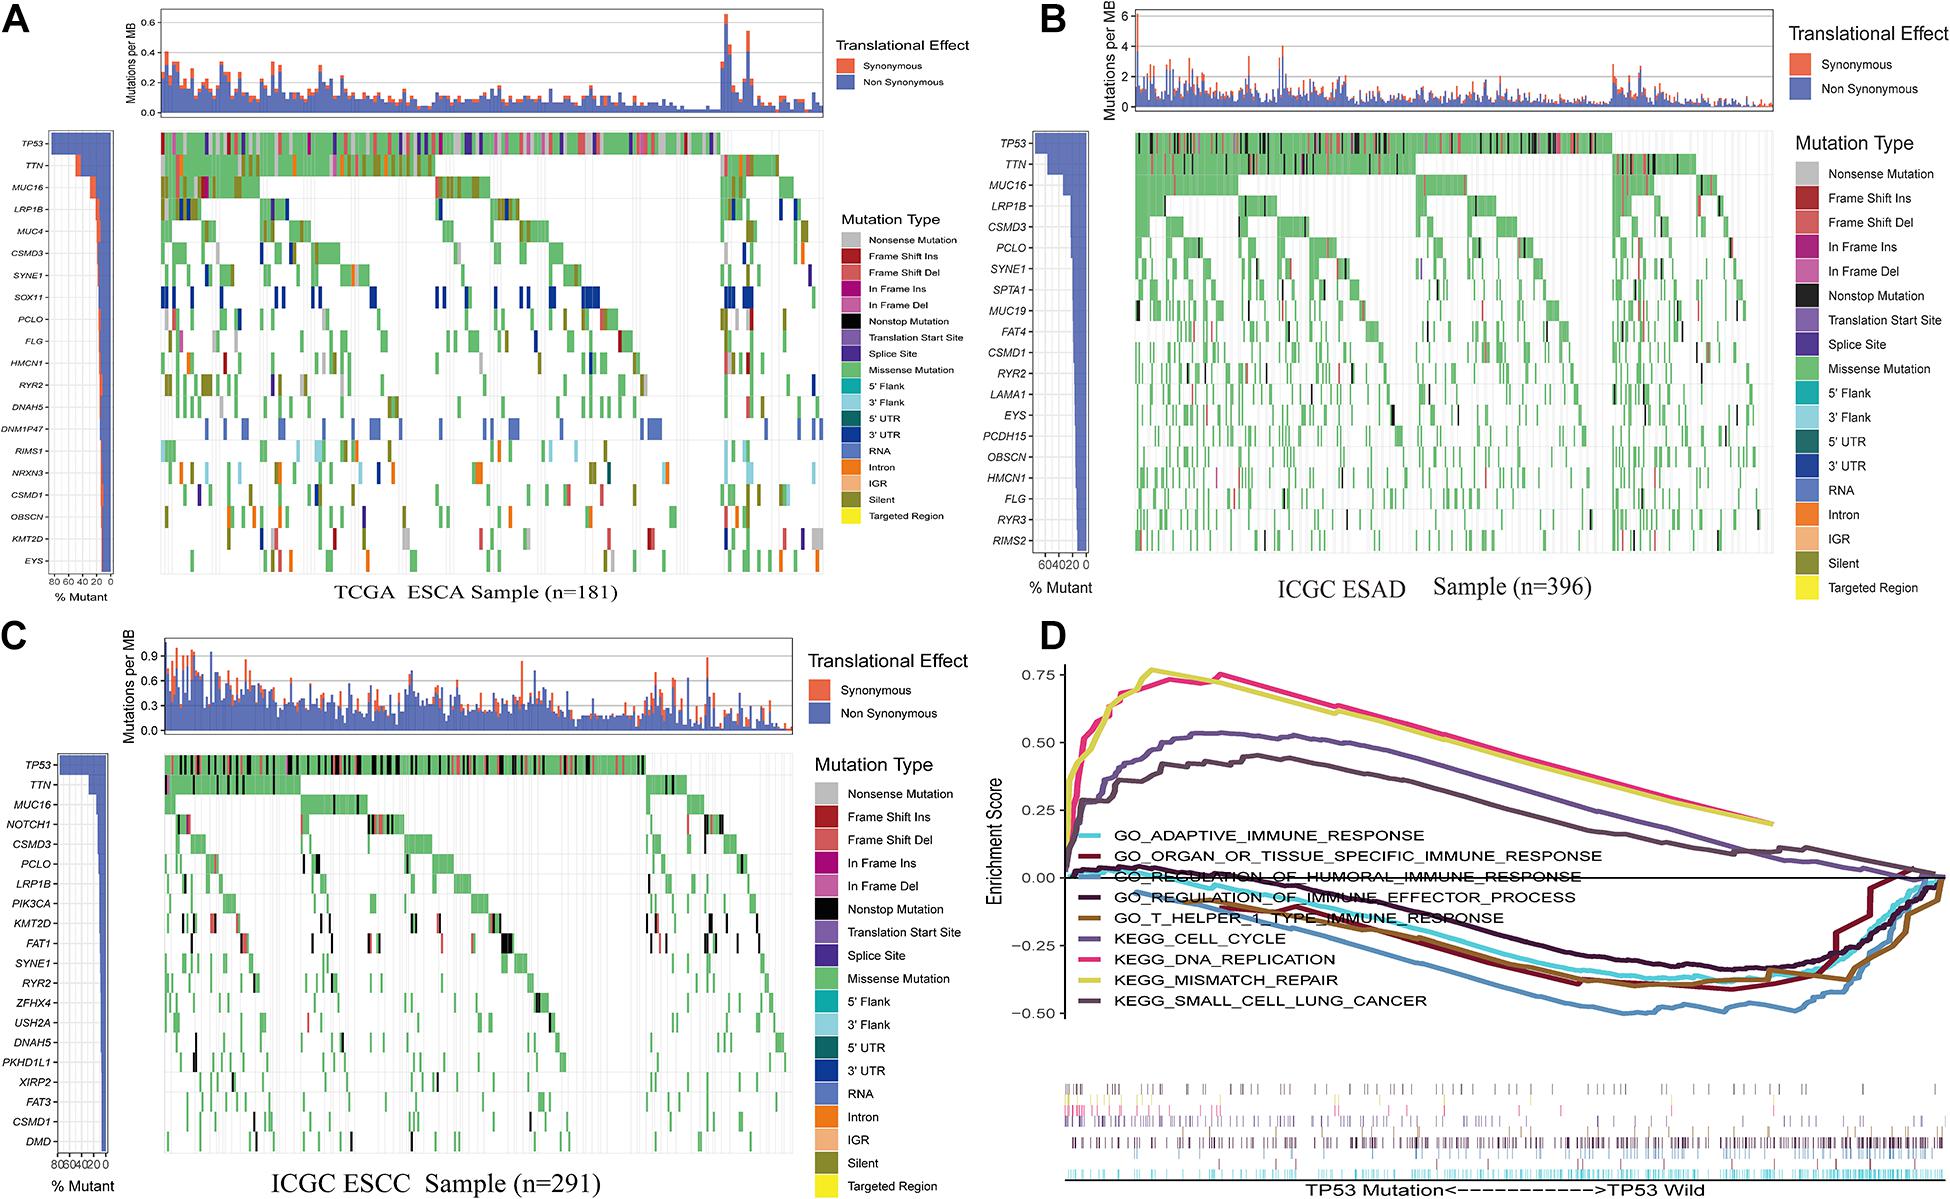
Figure 1. Somatic mutation analysis. (A) Overview of somatic mutations in all samples in the ESCA TCGA cohorts. (B) Mutations in ESAD samples in the ICGC cohorts. (C) Mutations in ESCC samples in the ICGC cohorts. (D) GSEA of samples with and without TP53 mutations. Abbreviations ESAD: esophageal adenocarcinoma, ESCC: esophageal squamous cell carcinoma.

Figure 2. The location of various somatic mutations in esophageal squamous cell carcinoma (A) and esophageal adenocarcinoma on chromosomes (B).
Identification of DEGs-3 in ESCA Patients
A total of 2123 DEGs-2 were incorporated into our subsequent analysis (log2| fold change| > 2 and adj. P < 0.05) between the ESCA and adjacent tissues (Figures 3A,B). Furthermore, we classified ESCA patients with TP53WT and TP53MUT cohorts and identified 1275 DEGs-1 above them ((log2| fold change| > 1 and adj. P < 0.05) (Figures 3C,D). Ultimately, by performing the intersections of DEG-1 and DEG-2 as DEG-3, 250 common DEGs were chosen (Figure 3E).
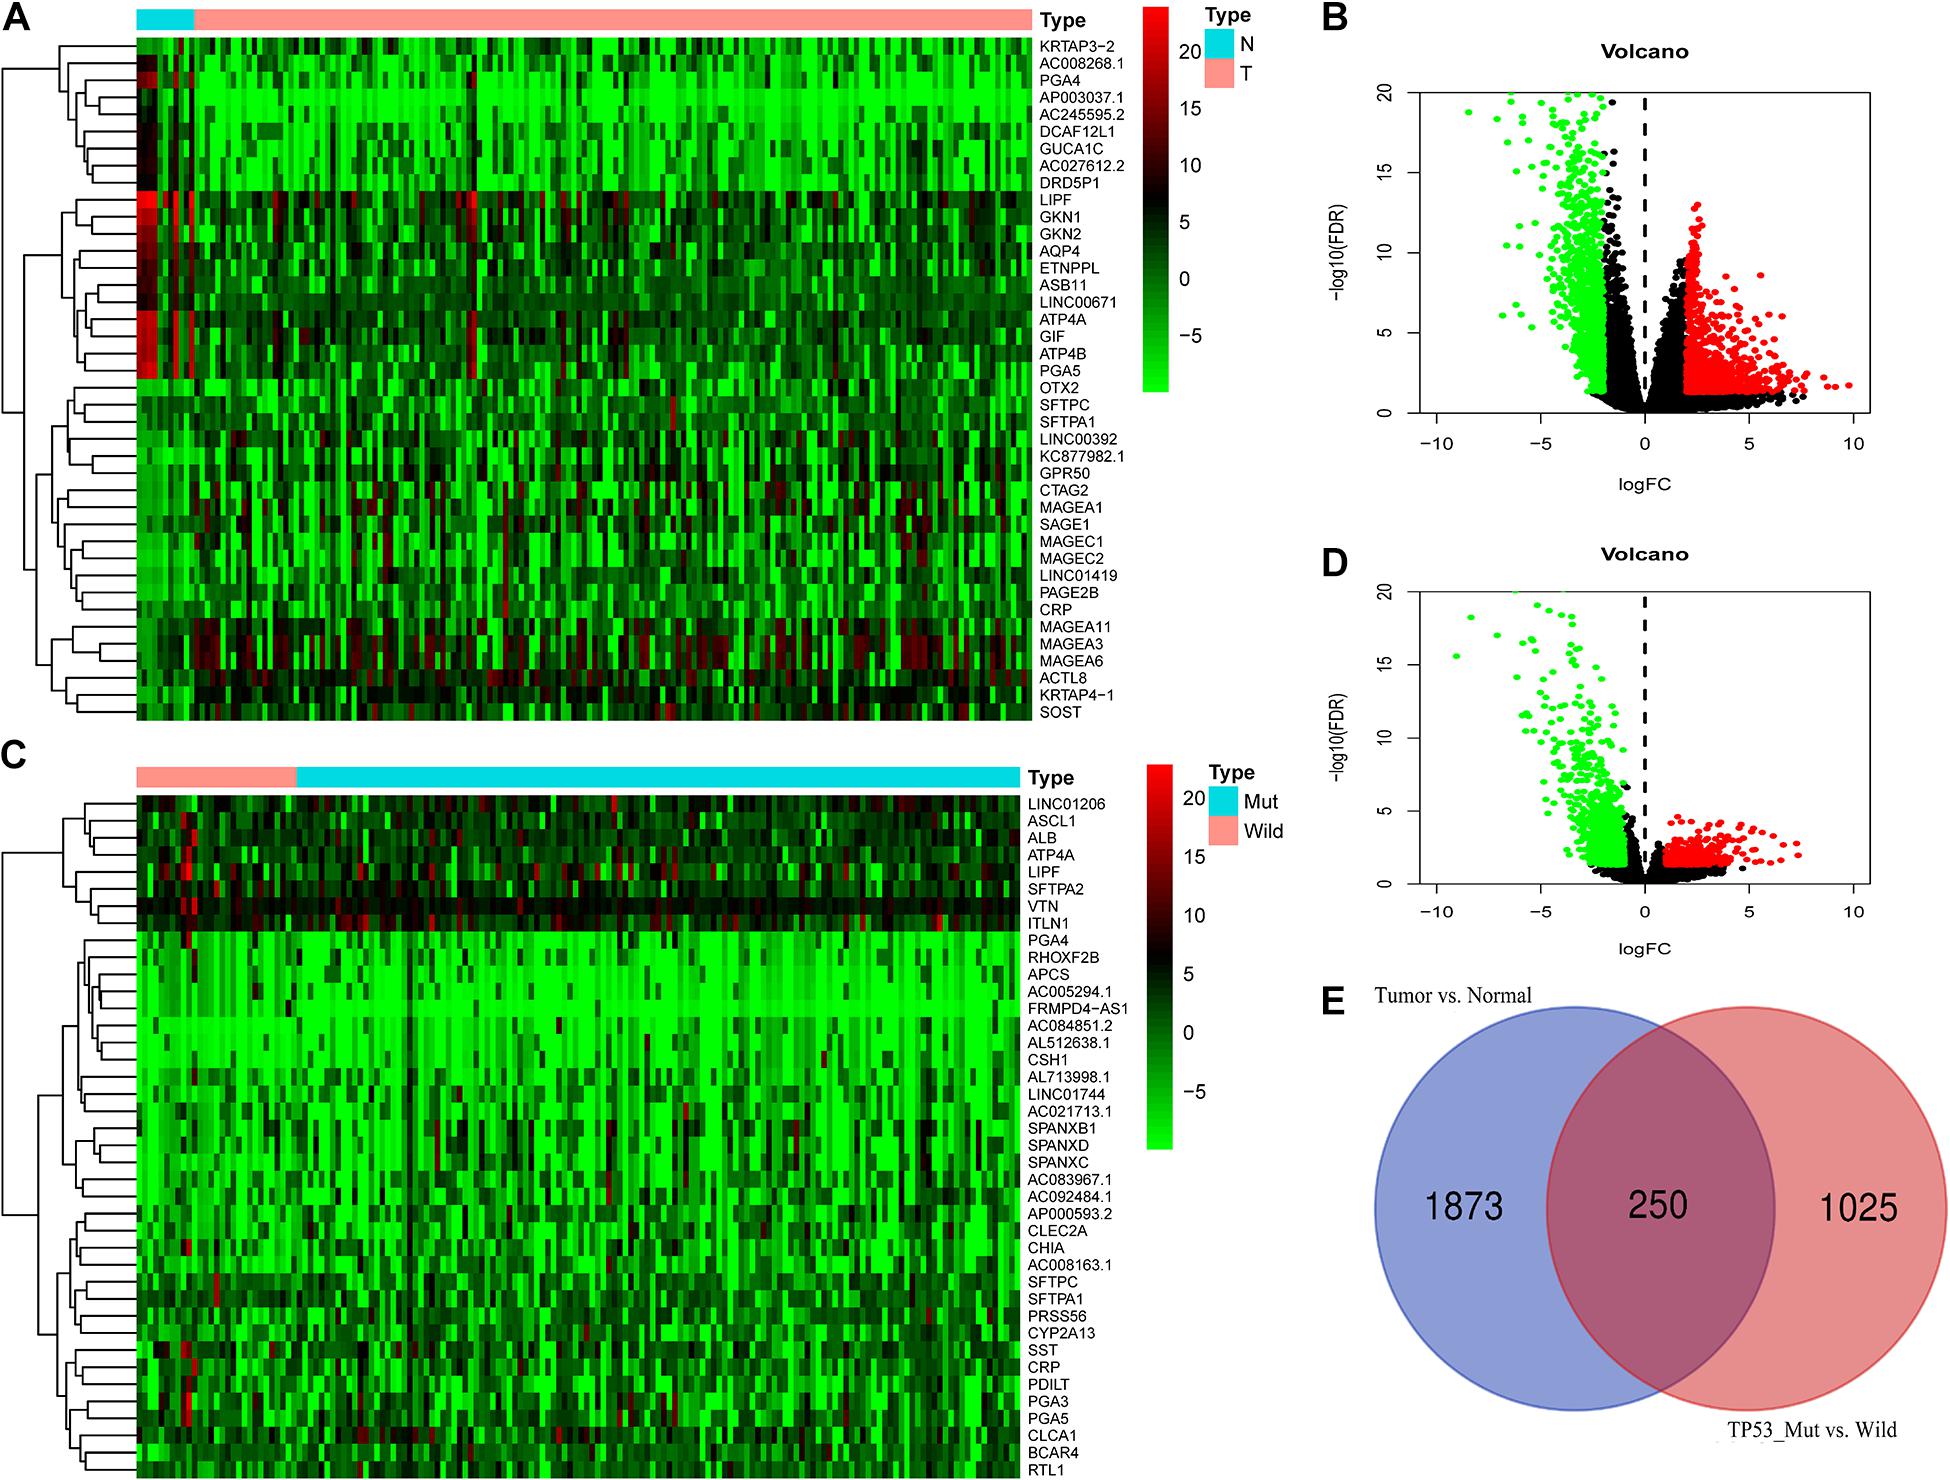
Figure 3. Differential expression analysis (A,B) DEG-2 between ESCA and adjacent tissues. (C,D) DEGs-1 between the ESCA TP53WT and TP53MUT cohorts. (E) DEGs-3: intersections of DEGs-1 and DEGs-2. Abbreviations ESCA: esophageal carcinoma.
A Prognostic Signature Based on the DEGs-3
Based on the above DEGs-3, we screened these 250 candidate genes to evaluate the genetic prognostic markers using the univariate analysis. Among the 12 candidate variables (Figure 4A), the seven-gene prognosis prediction model (Table 1 and Figure 4B) was eventually filtered and was independently associated with prognosis. The risk score was calculated using a multivariate Cox proportional hazard regression model: risk score = 0.093∗ (AP002478.1 expression level) –0.243∗ (BHLHA15 expression level) + 0.282∗ (FFAR2 expression level) + 0.103∗ (IGFBP1 expression level) –0.150∗ (KCTD8 expression level)–0.160∗ (PHYHD1 expression level) –0.165∗ (SLC26A9 expression level). According to the model, ESCA patients were divided into high- and low-risk groups using the median risk score. Patients in the high-risk group had an obviously worse OS than their corresponding counterparts (P < 0.00001, log-rank test, Figure 5A). The longest survival time for the high-risk group was 4 years; in contrast, that for the low-risk group was 6 years. The time-dependent ROC curve results revealed that this seven-gene signature could strongly predict the OS of ESCA patients (AUC = 0.746; Figure 5B). The distribution of risk scores and vital statuses of patients sorted by survival time and the seven-genes expression heatmap were also consistent with these findings (Figures 5C–E). Moreover, in the subgroup analysis the gene signature showed better predictive power for patients in the TP53 mutant group, ESCC group, and ESAD group (Figures 6A–C), indicating that this model has good predictive ability in esophageal cancer.
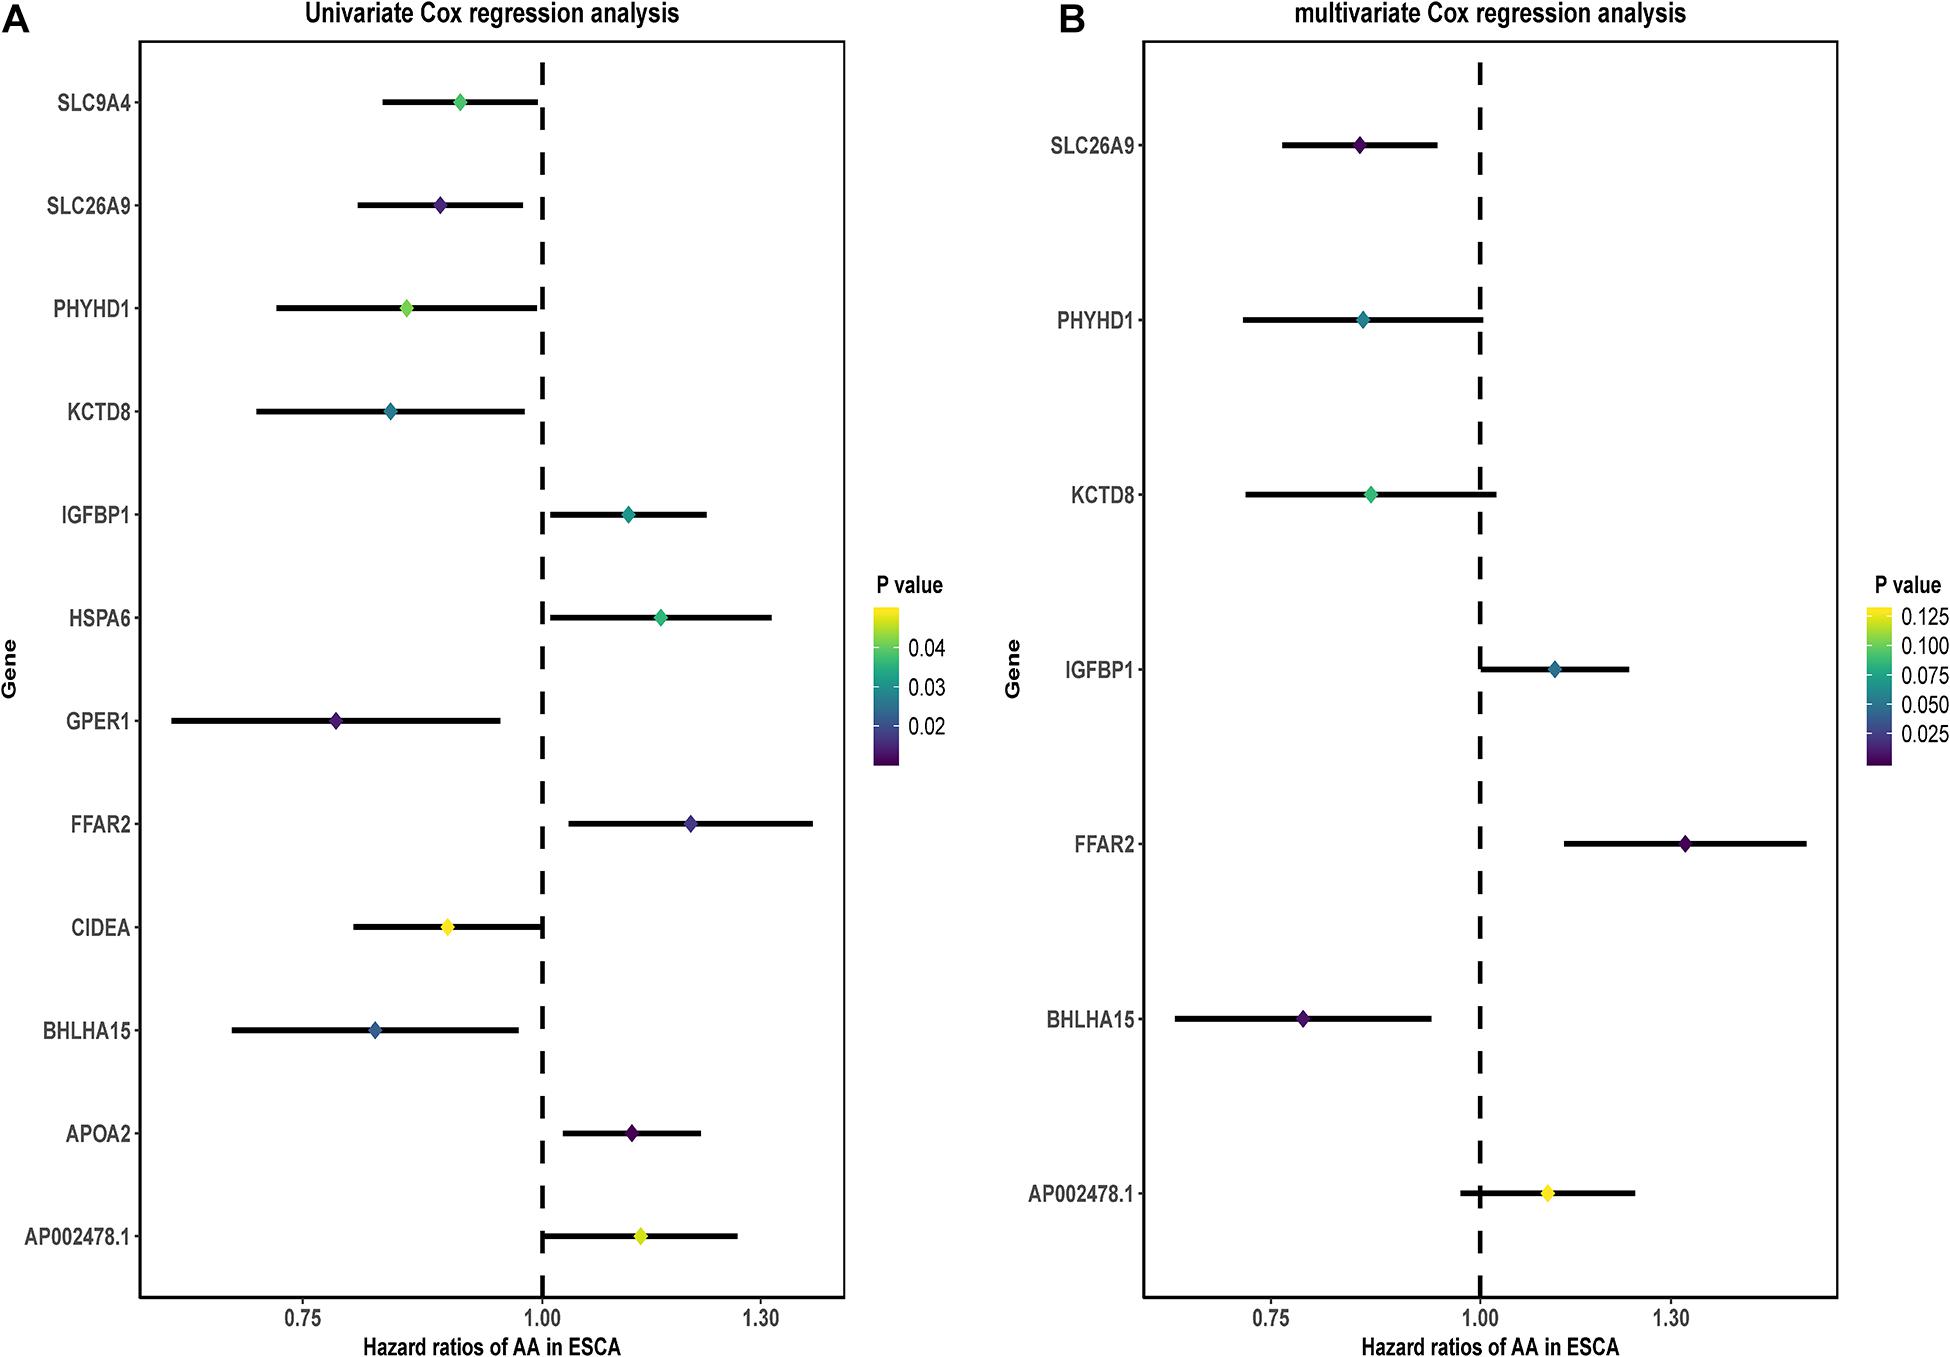
Figure 4. Construction of the DEG-based prognostic signature. (A) Prognostic value of DEG-3 according to univariate Cox regression analysis. (B) Prognostic value of DEG-3 according to multivariate Cox regression analysis.
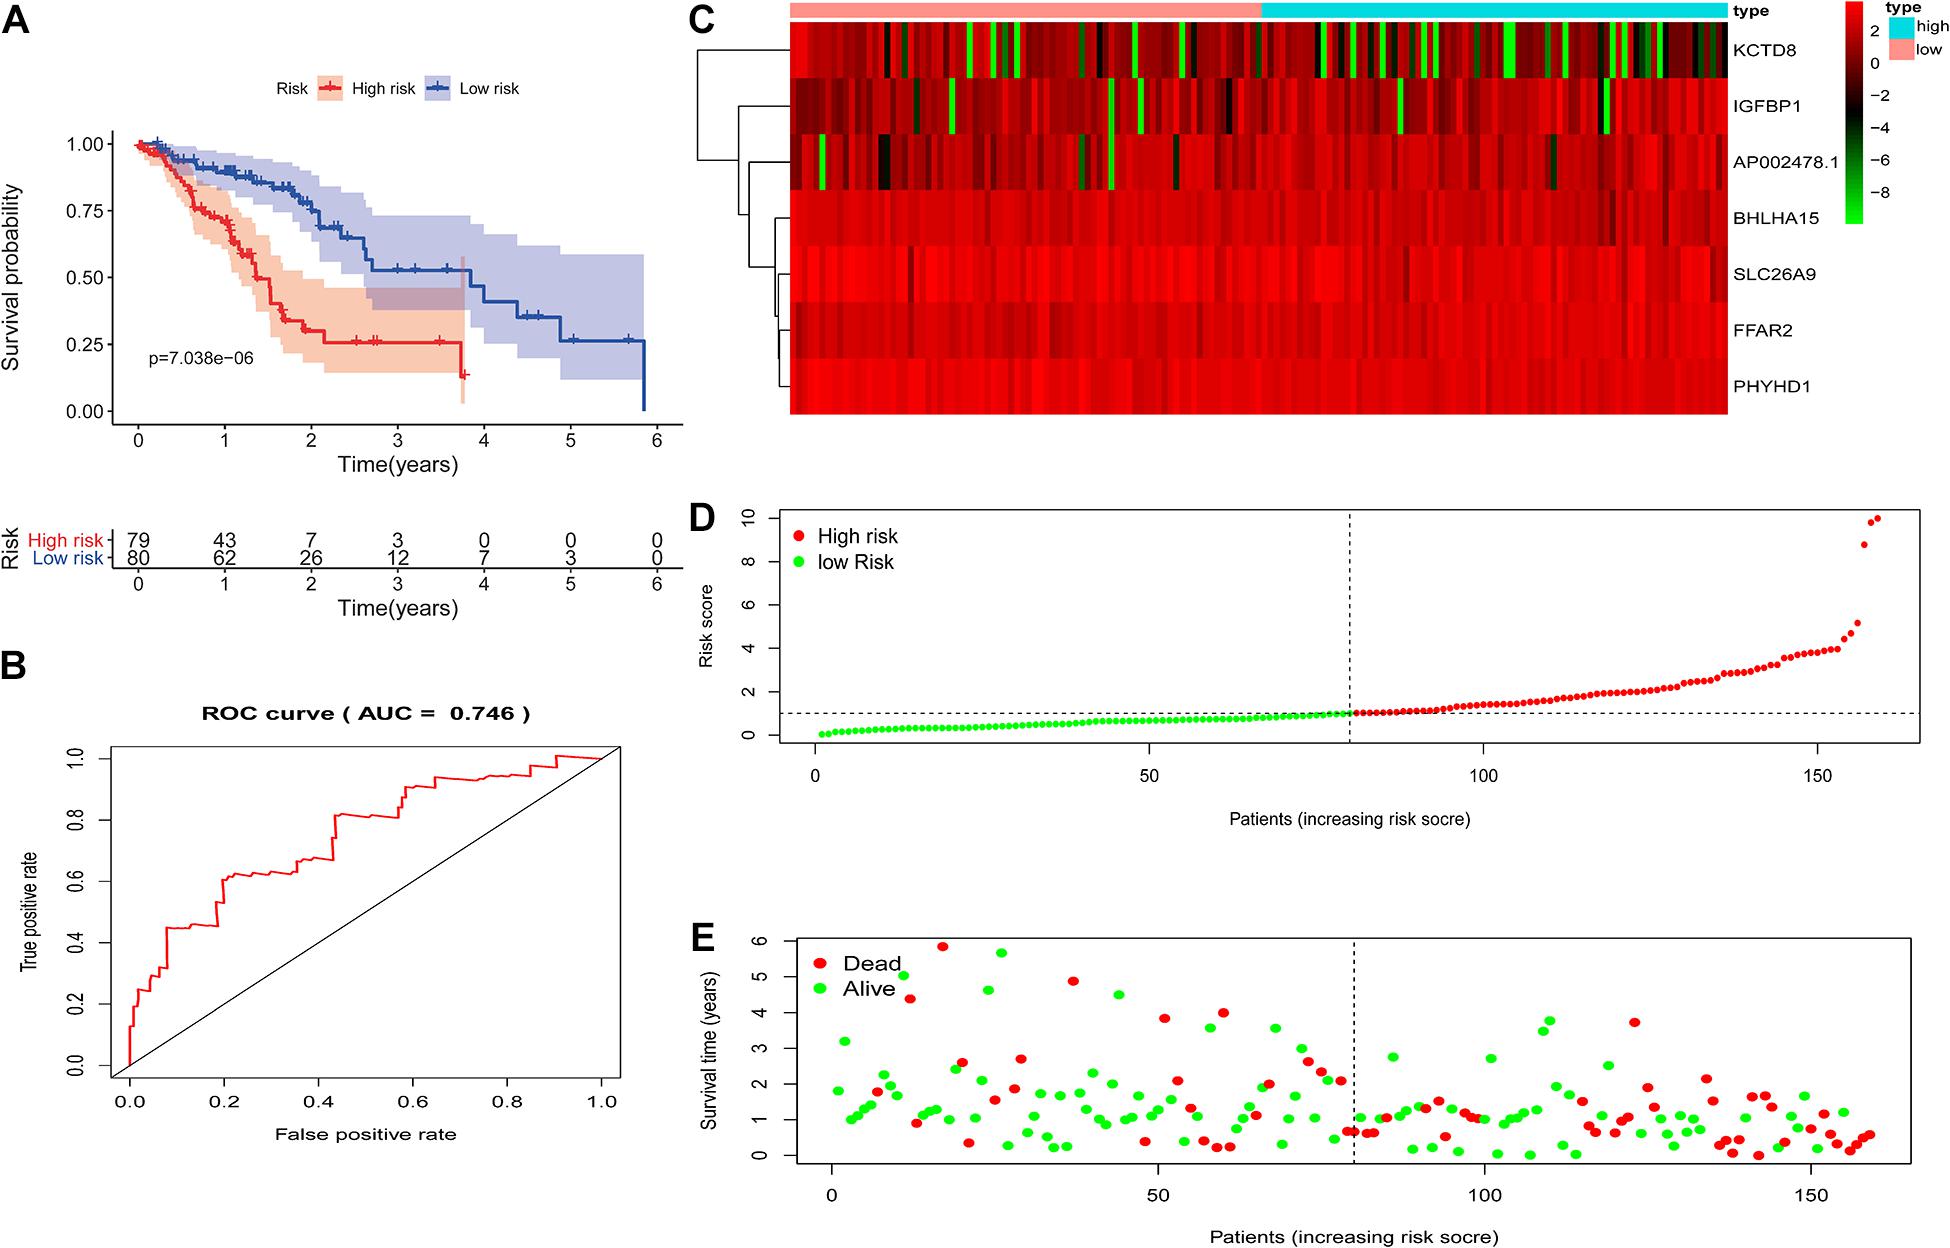
Figure 5. The prognostic values of the signature. (A) Kaplan-Meier survival curves of the relative overall survival of high- and low-risk patients. (B) ROC curve analysis of the prognostic signature. (C) Heatmap of three-gene expression profiles in the high- and low-risk groups. (D) The distribution of the three gene-based risk scores. (E) Vital statuses of patients in the high- and low-risk groups.

Figure 6. Kaplan-Meier analysis of overall survival in ESCA patients according to the risk model. Kaplan-Meier analysis of the TP53 mutation subgroup (A); the ESCC subgroup (B); and the ESAD subgroup (C).
Among these seven genes, the coefficients of BHLHA15, KCTD8, PHYHD1, and SLC26A9 were negative, suggesting that they may have a survival promotion function, while the remaining genes seemed to be risk factors and were more highly expressed in the high-level group than in the low-level group.
Independent Prognostic Role and Construction of a Nomogram Based on the Signature
Clinical information of ESCA patients, including sex, age, tumor subtype, TNM stage, TP53, and risk score, were included for further analysis. The univariate and multivariate analyses indicated that the risk score from the seven-gene signature was a specific predictor of OS (hazard ratio = 1.513, P < 0.001) (Figures 7A,B). The AUCs of the prognostic model, age, sex, subtype, stage, T stage, M stage, N stage, and TP53 were 0.771, 0.560, 0.491, 0.594, 0.643, 0.543, 0.552, 0.668, and 0.466, respectively (Figure 7C). Based on the above findings, we constructed a nomogram combined with our signature and clinical features (sex, subtype, stage, TP53, and risk score) to directly predict the 1-, 2-, and 3-year survival rates (Figure 7D).
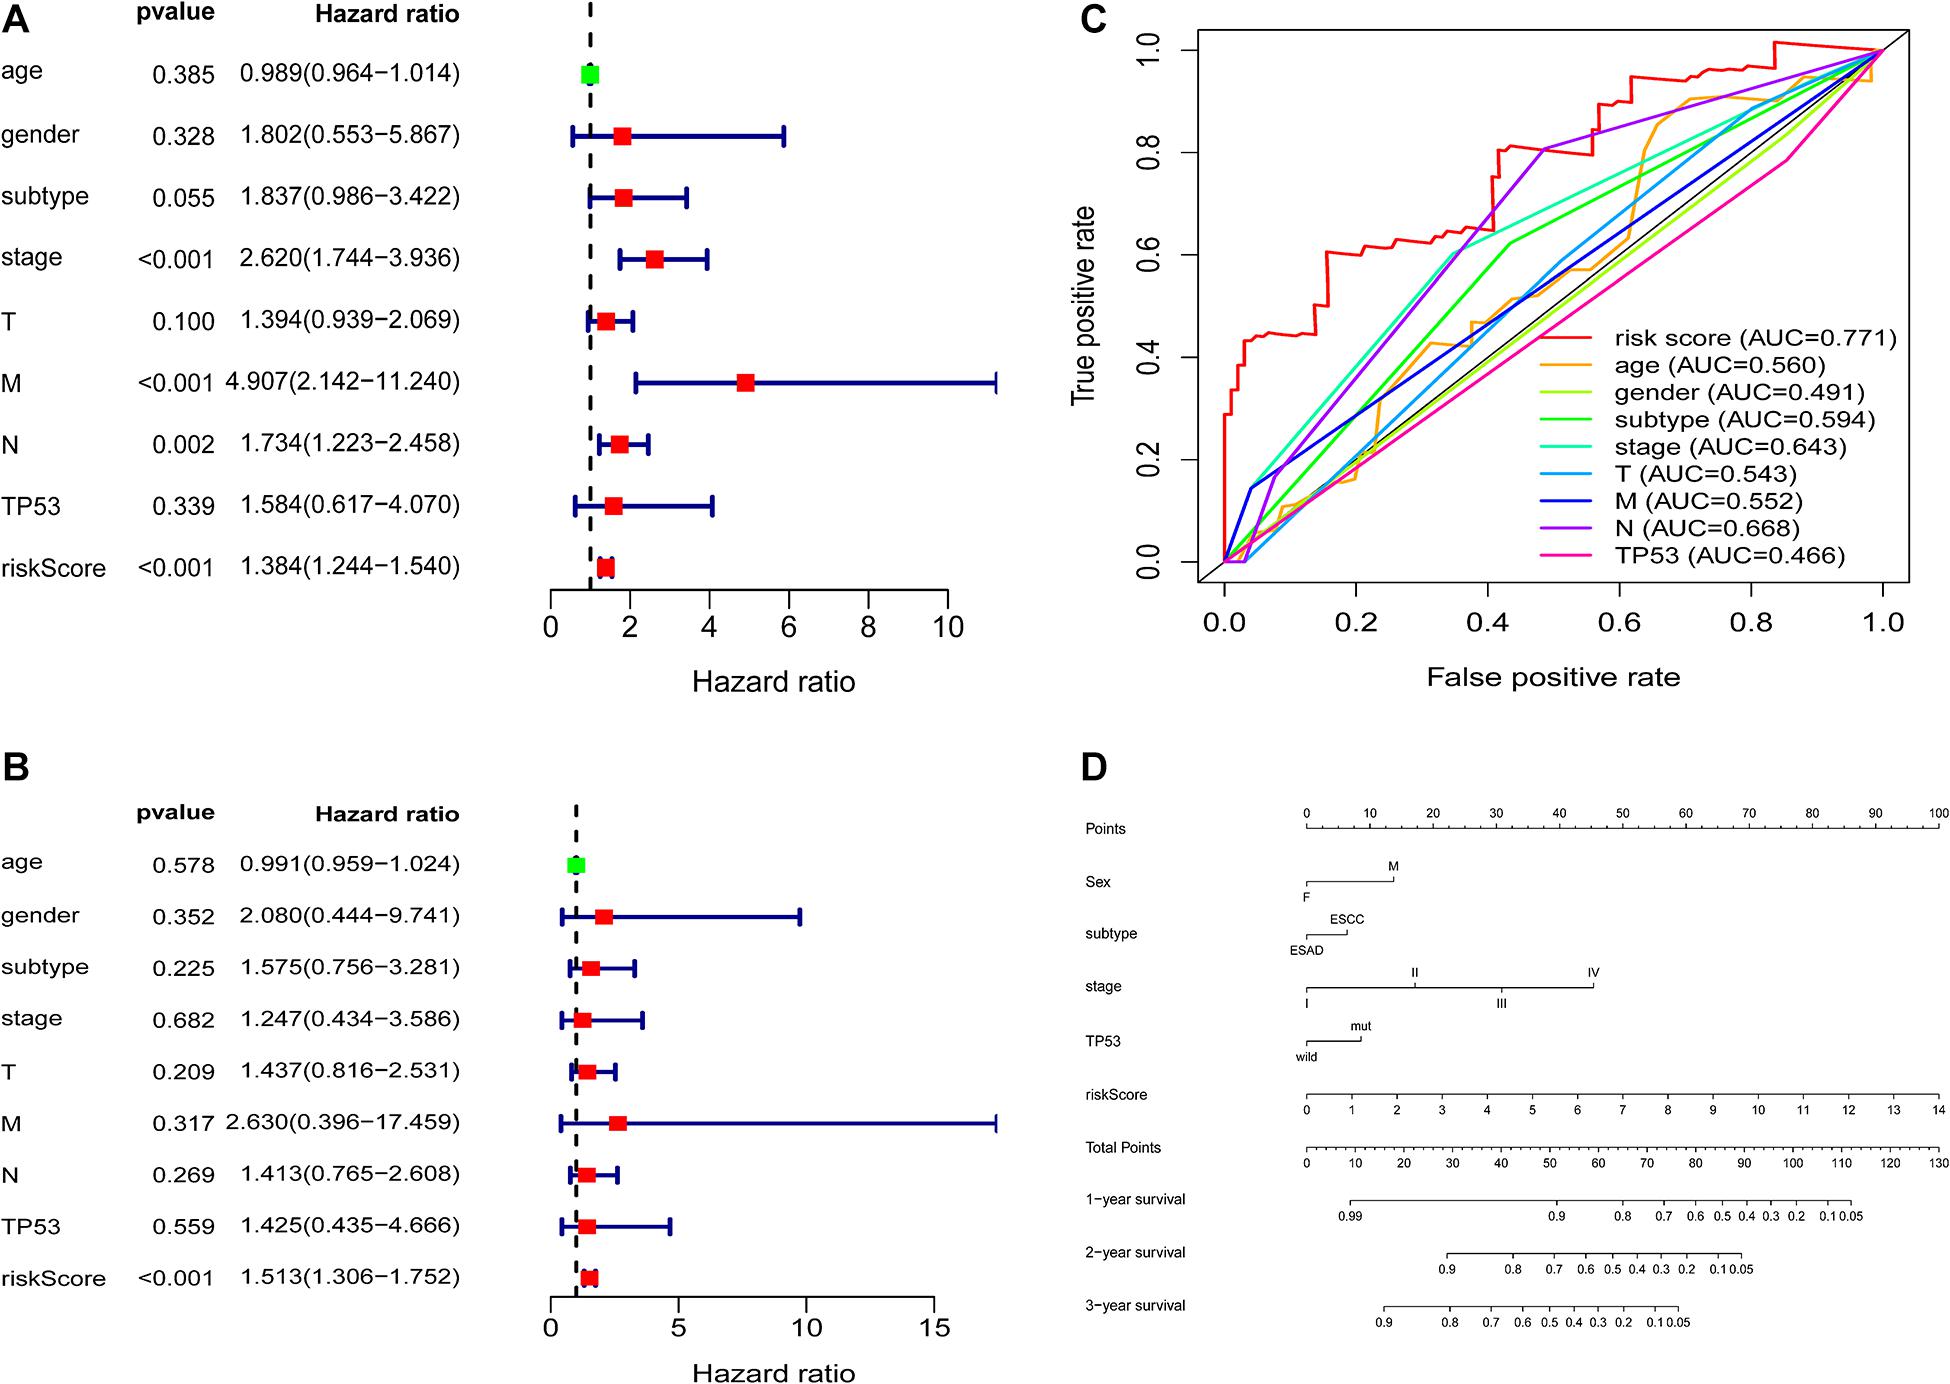
Figure 7. Correlation between the seven-gene signature and patient clinical characteristics (A,B) Univariate and multivariate Cox regression analyses of the correlations between the TP53-associated signature and clinical characteristics with overall survival. (C) ROC curve analyses of age, sex, subtype, stage, T stage, M stage, N stage, TP53, and prognostic risk model. (D) Nomogram for predicting the 1-, 3-, and 5-year overall survival of patients with ESCA.
Therapeutic Responses for ESCA
The TIDE score was significantly different between the TP53 mutant group and the wild-type group. Patients in the TP53 mutant group had higher TIDE scores (Figure 8A), but there was no significant difference in the scores between the high- and low-risk groups (Figure 8B). Subsequently, we explored changes in chemotherapy resistance and found that three chemotherapy and targeted drugs showed great differences in the estimated IC50 between the TP53MUT and wild groups, and 24 chemotherapy and targeted drugs showed great differences in the estimated IC50 between the high-risk and low-risk groups, with patients in the mutant group or high-risk group having higher IC50 values (Figures 8C,D). Together, these results can provide better guidance for treatment selection of drug for ESCA patients.
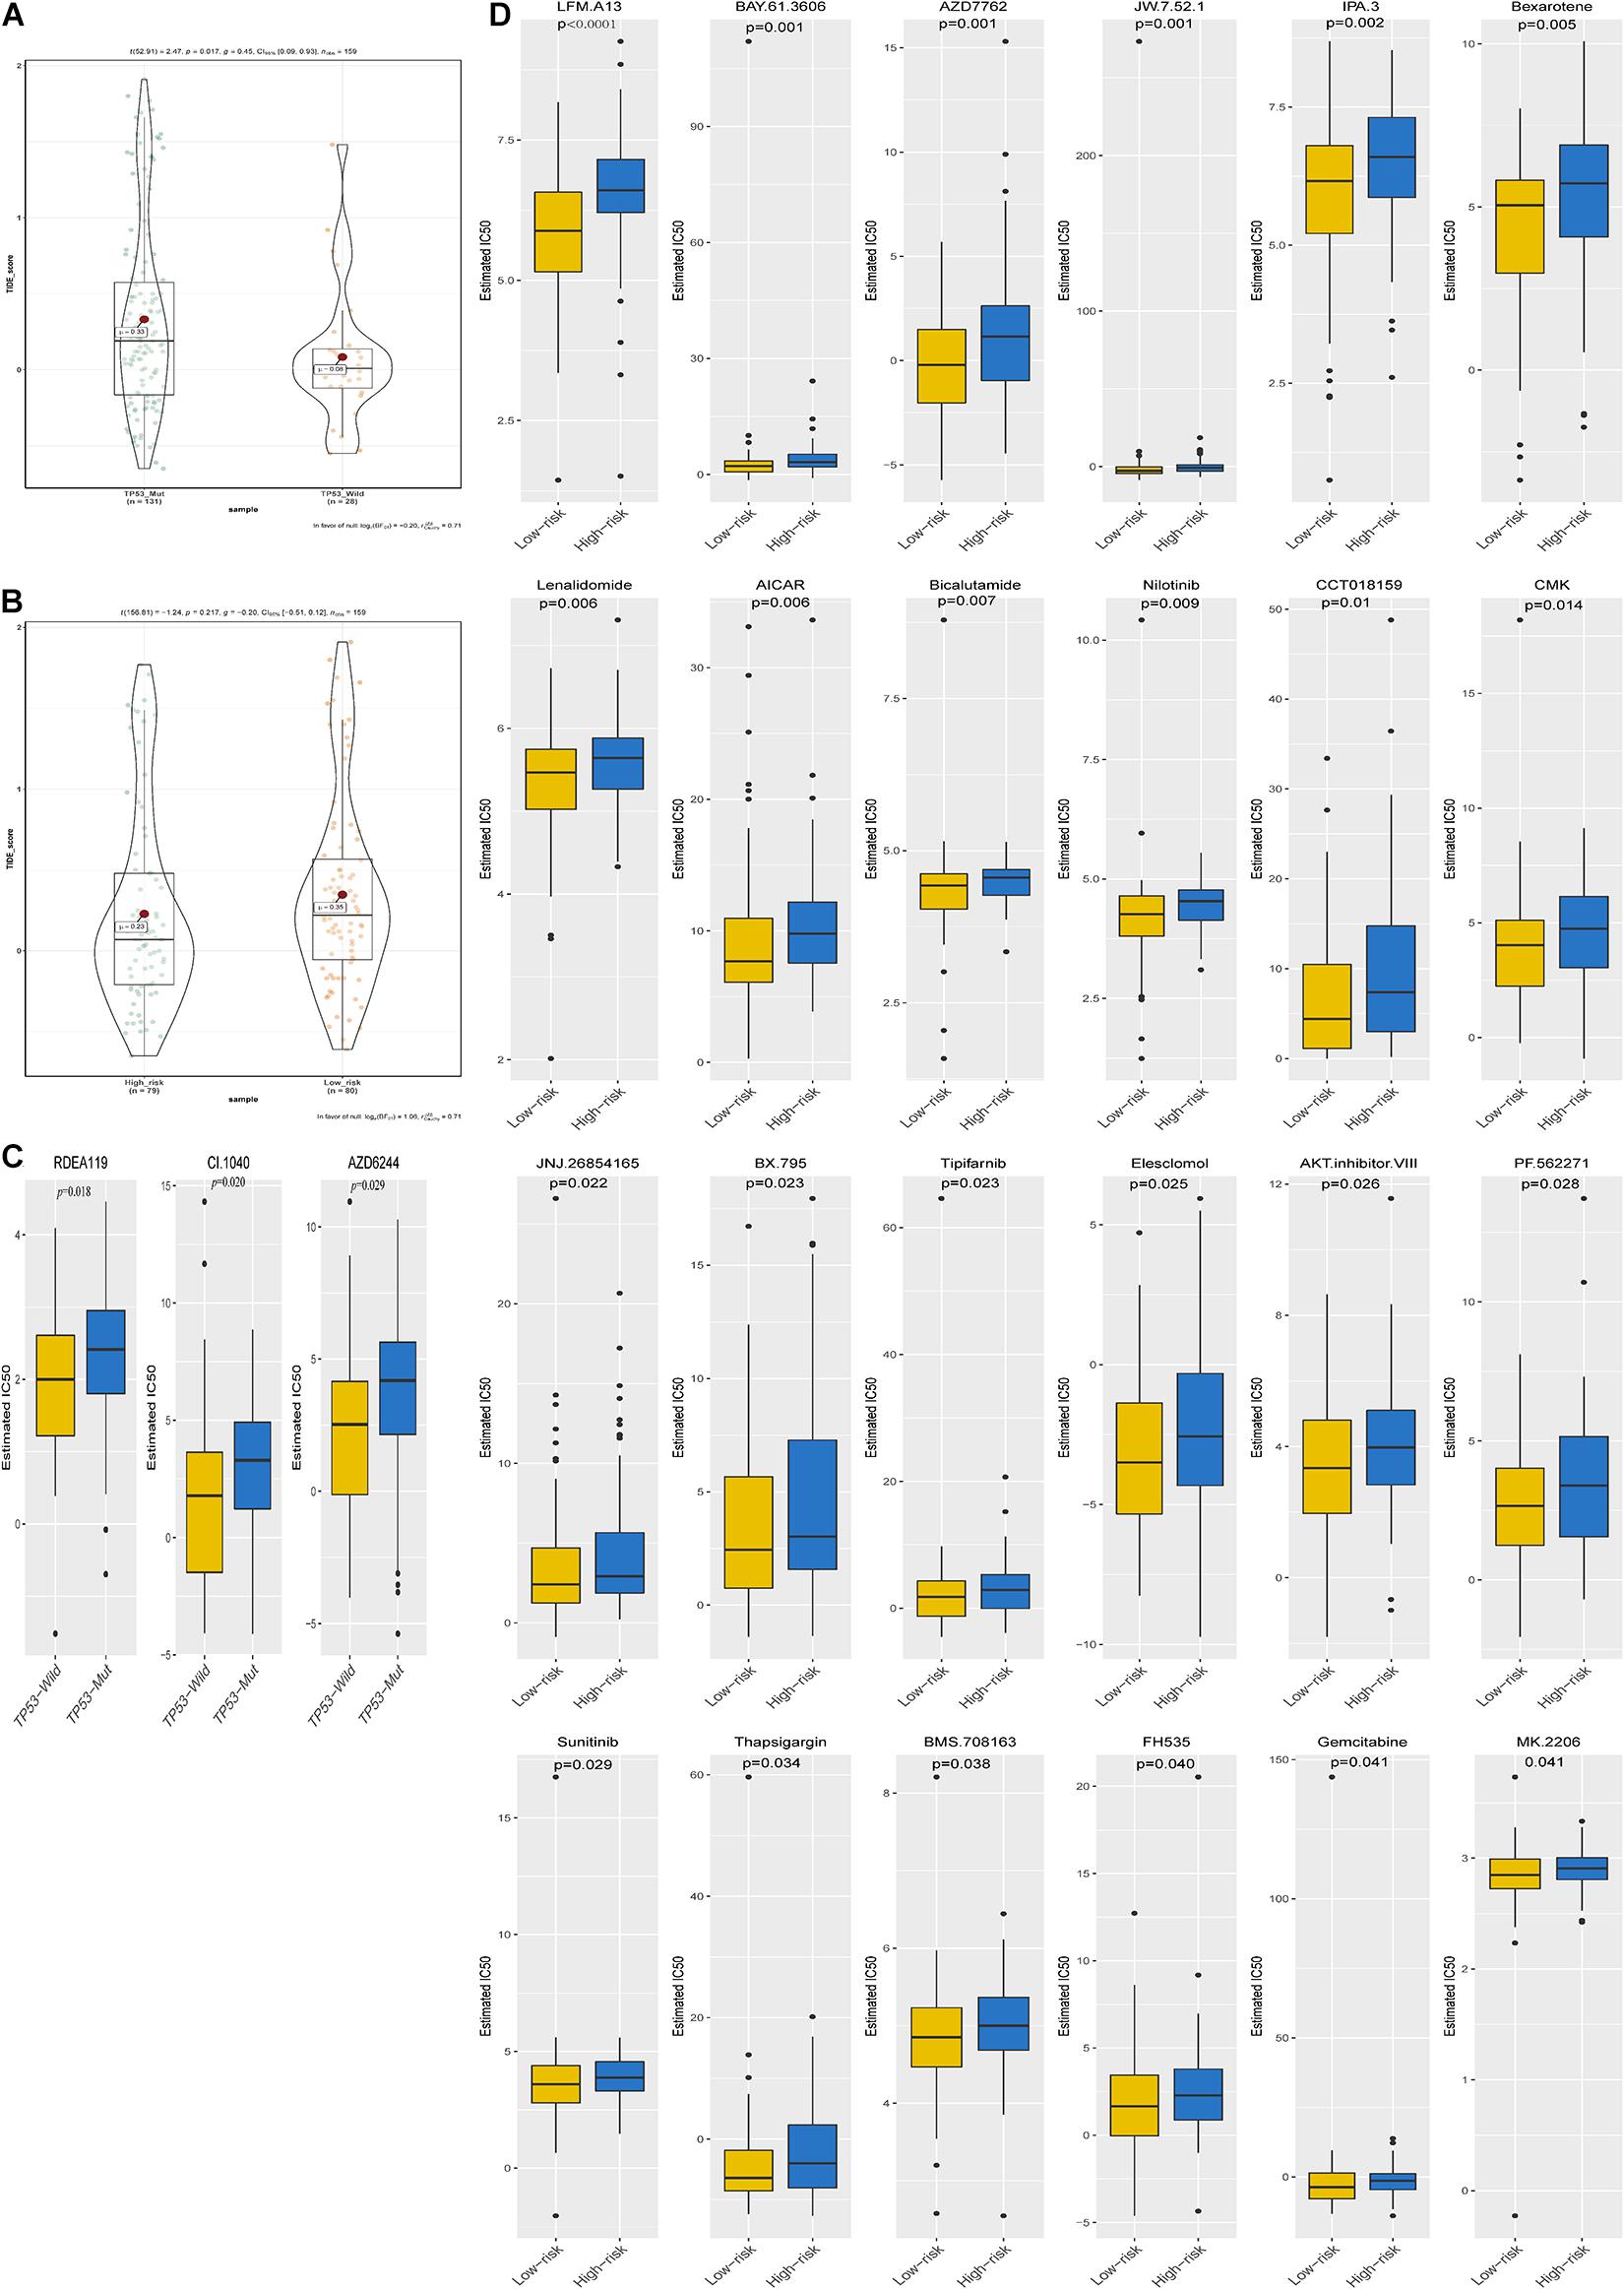
Figure 8. Immunotherapeutic and chemotherapeutic responses in the TP53WT and TP53MUT cohorts and the high- and low-risk patients with ESCA (A,B). Immunotherapeutic response to anti-CTLA-4 and anti-PD-1 treatments in the high- and low-risk patients and the TP53WT and TP53MUT cohorts. (C,D) Differential chemotherapeutic responses in the TP53WT and TP53MUT cohorts and the high- and low-risk patients.
Immune Cell Infiltration Landscape in ESCA Patients
We investigated the difference between high-risk and low-risk patients via the CIBERSORT algorithm in 22 immune cell infiltrates of ESCA. The immune cells varied distinctly between samples (Figure 9A); moreover, immune cell proportions were weakly to moderately correlated (Figure 9B). The heat map also exhibited the difference in immune cell infiltration between the two groups, where the colors ranging from green to red represent the infiltration density from low to high (Figure 9C). The Wilcoxon rank-sum test was also accurately applied to explore this difference and found that several immune cells conferred a significantly low infiltration density in the high-risk groups, including T cells CD8 (P = 0.021), regulatory T cells (P = 0.030), M1 macrophages (P = 0.04), and resting mast cells (P = 0.001) (Figure 9D). In light of the above analysis, we hypothesized that this signature was linked to immune cell infiltrates and has implications for poor survival outcomes.
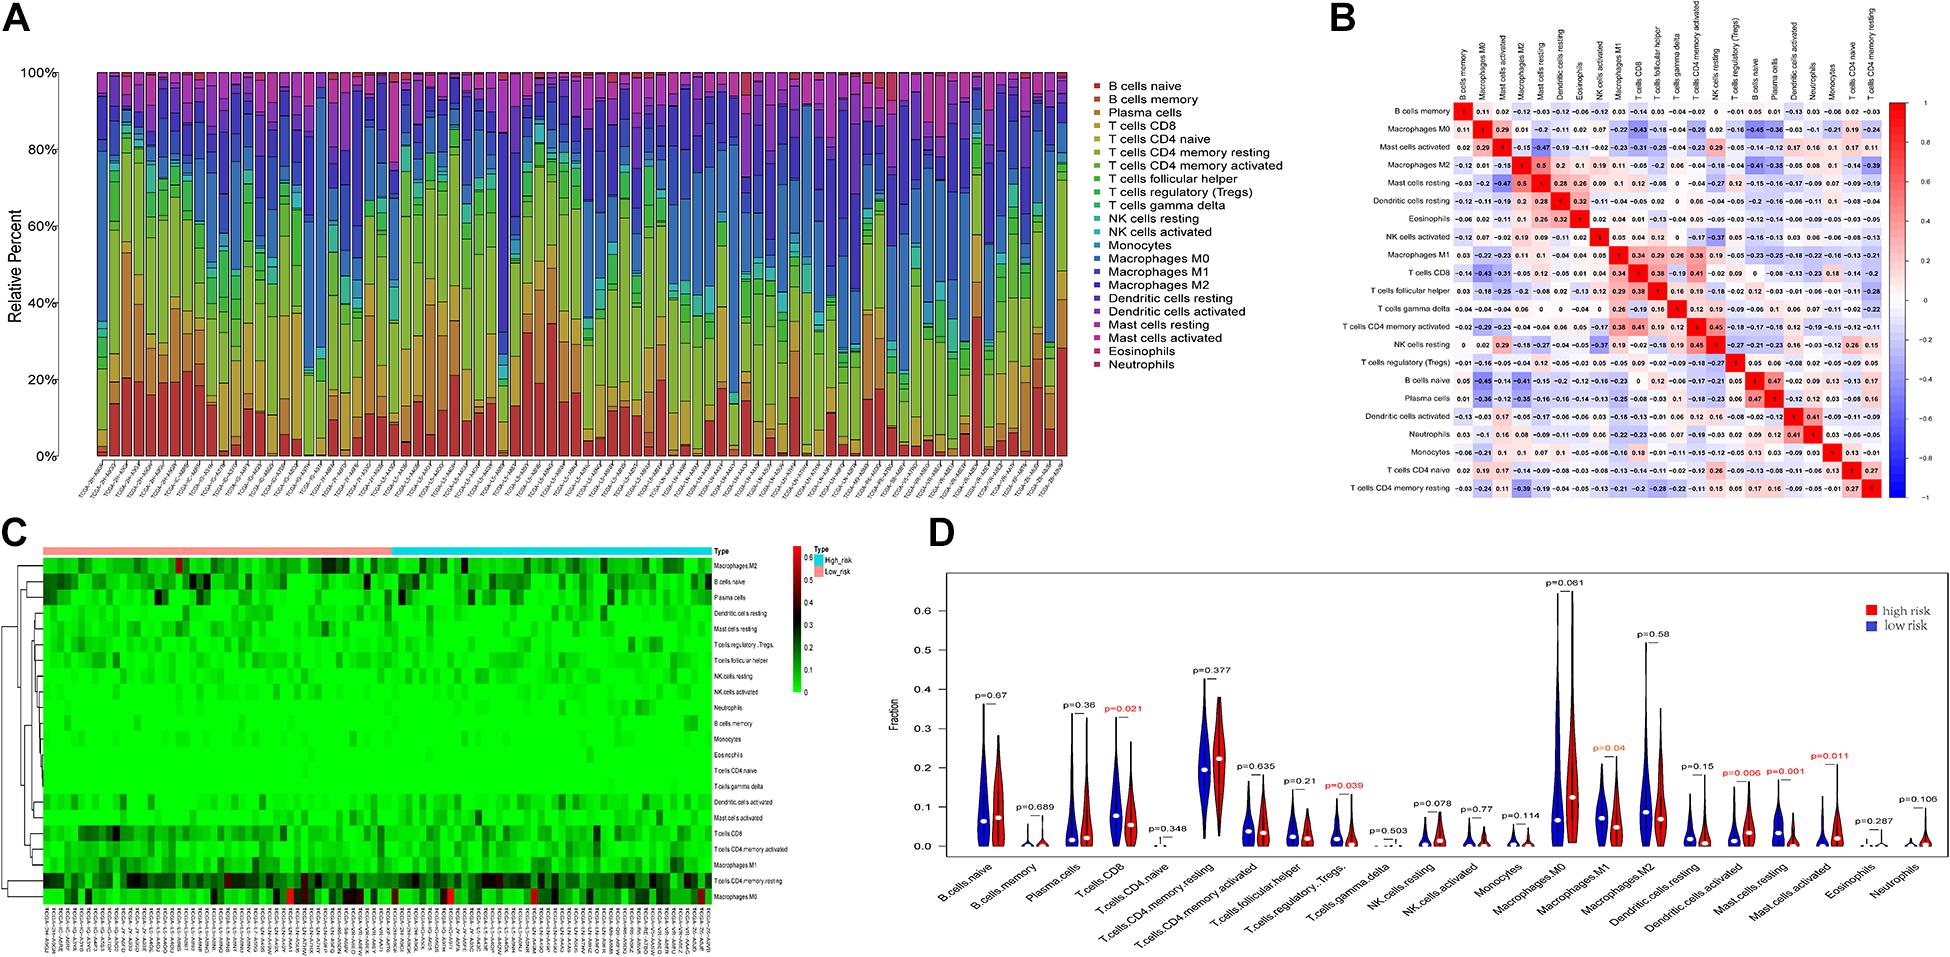
Figure 9. Immune cell infiltration landscapes in high- and low-risk patients with ESCA. (A) Relative level of immune cell infiltration in high- and low-risk patients. (B) Correlation matrix and (C) heatmap of the 22 immune cell proportions. (D) Differences in immune cell infiltration between high- and low-risk patients.
Correlation Between Immune Cell Infiltration and Expression of Seven Genes
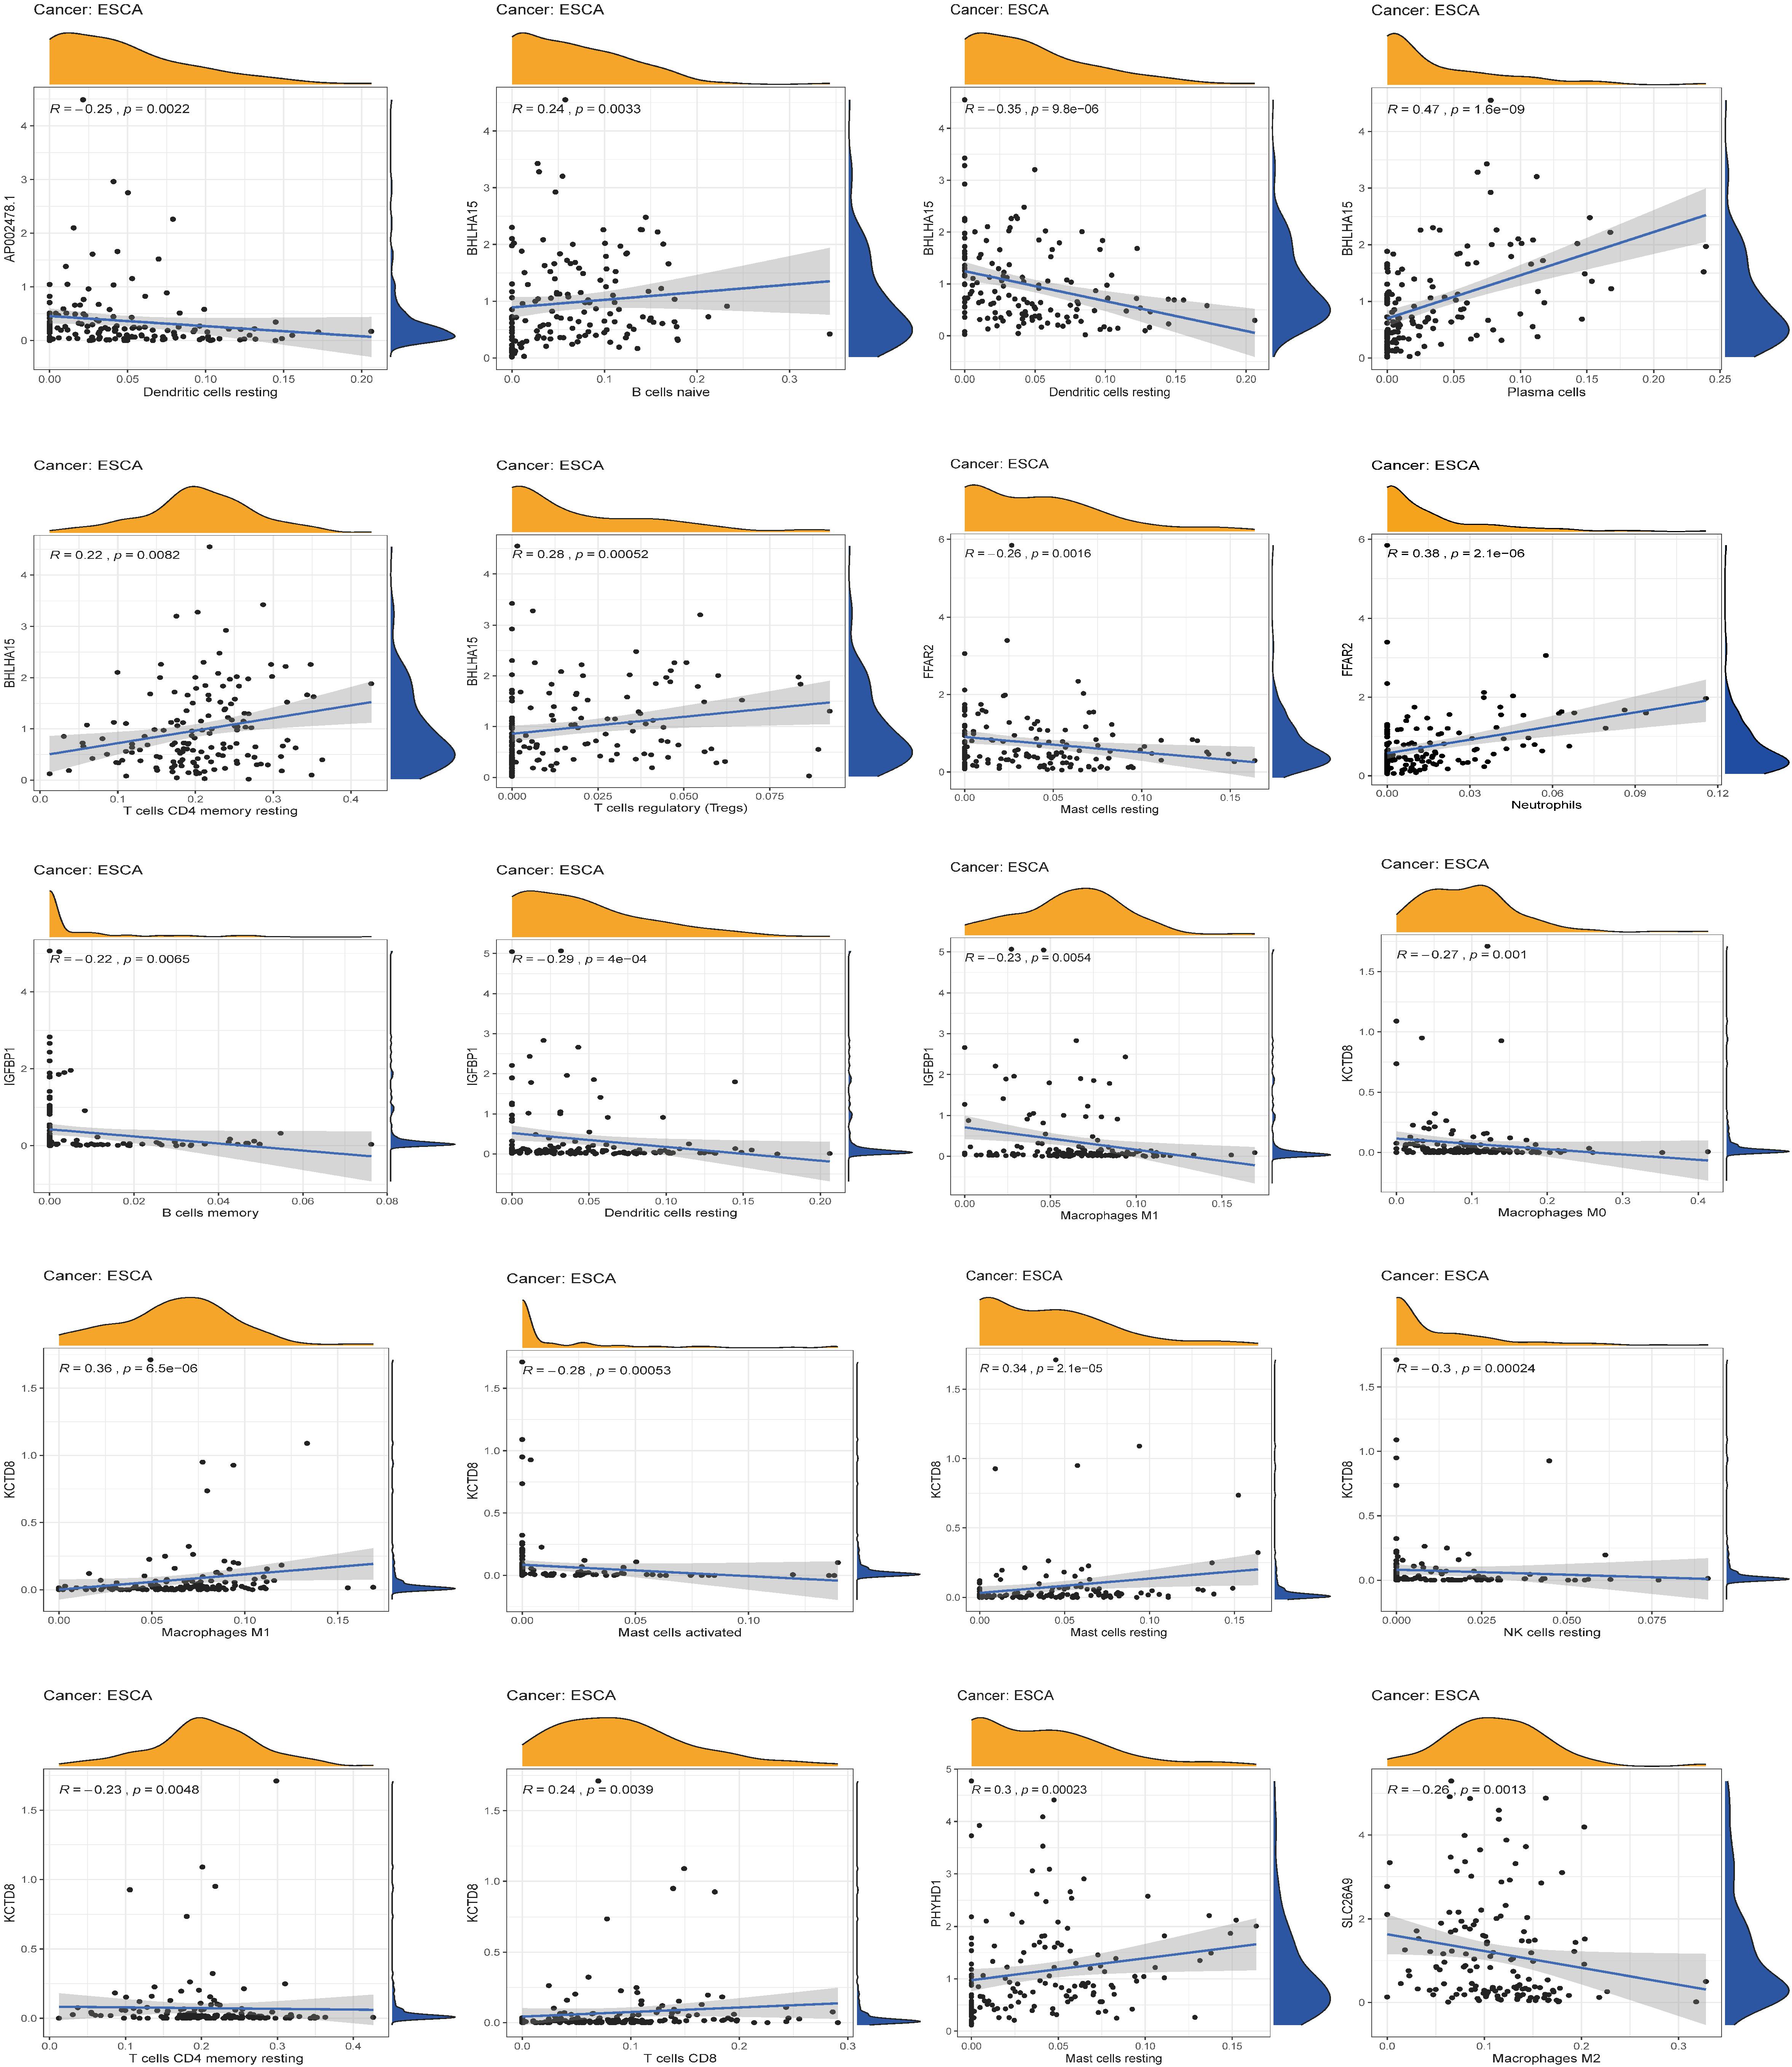
After identifying the immunotherapeutic value of the signature, a significant correlation was found between the expression level of the seven genes and the level of immune infiltration for ESCA (Figure 10). Scatter plots were generated with partial Spearman’s correlation and analyzed for statistical significance. AP002478.1, BHLHA15, and IGFBP1 expression was significantly associated with resting dendritic cells (correlation = –0.25, –0.35, and –0.29, p-value < 0.01), while the expression of these genes was also significantly related to NK cell activation, M0 macrophages, M2 macrophages, follicular helper T cells, and plasma cell immune infiltration (p-value < 0.01).
Discussion
ESCA remains one of the most malignant gastrointestinal cancers and is ranked sixth in cancer-related mortality worldwide (Domper Arnal et al., 2015). Despite advancements in diagnosis and treatment for ESCA in recent decades, its incidence and mortality have only been slightly reduced (Gupta and Kumar, 2017). TP53MUT is involved in immunity by modulating apoptosis, antiviral defense, and the induction of type I IFN, thereby promoting cytokine production and immune checkpoint evasion in some cancer cells (Yao and Sherif, 2016; Moore et al., 2018; Li et al., 2020). However, the mechanisms by which TP53MUT regulates the correlation between ESCA prognosis and TME have not been well reported. Therefore, it is essential to elucidate the TP53MUT-associated immune effect on ESCA.
In our current work, two groups of DEGs (DEGs-1 and DEGs-2) were obtained from ESCA tissues and matched normal specimens, as well as TP53WT and TP53MUT cohorts. We further intersected the two above groups to identify the TP53 mutations associated with ESCA. Strikingly, the GSEA results illustrated that mutated TP53 was obviously enriched in immune biological functions, suggesting that TP53MUT can have an immunomodulatory effect on ESCA. Furthermore, we successfully constructed a signature to predict ESCA patient survival based on TP53MUT-linked genes, and the overall survival analysis showed a significant difference between the two groups, which had satisfactory specificity and sensitivity in the prediction of ESCA based on the various methods available. Aside from the above analyses, CIBERSORT can be used to evaluate the interaction between the 22 immune cell types and this signature that is closely related to the immune processes associated with human tumors. The high- and low-risk groups had obvious differences in terms of the types of immune infiltrating cells, such as CD8+ T cells, Tregs, M1 macrophages, resting mast cells, and resting dendritic cells. Taken together, the results indicate that this immune-related signature may be one of the factors leading to differences in patient prognoses.
It has been reported that TP53MUT-mediated biological processes are significantly associated with immune activities in multiple cancers. Researchers have found that adoptive transfer of wild-type TP53-specific T cell clones restricts the growth of mutant TP53-transformed MEFs in vivo (Hoffmann et al., 2002; Zwaveling et al., 2002). Behring et al. (2019) also determined that TP53 mutation in breast tumors is associated with immune inflammation-related gain of function and changes in tumor-associated macrophages. More importantly, we identified a number of TP53-mediated pathways whose activities were significantly associated with immune activities in ESCA. In addition, in the TP53Mut group, the TIDE score was high, so they may be candidates for immune therapy (Lim et al., 2018). Unfortunately, we found that TIDE had no more substantial value in patients with high-risk ESCA than in their low-risk counterparts. This is mainly because there are fewer tumor species than in other tumors. Moreover, chemotherapy has been successful at treating ESCA (van den Ende et al., 2018), and patients of TP53-mut are more sensitive to the drugs RDEA119, CI.1040, and AZD6244 than their TP53-wild counterparts. Low-risk patients are more sensitive to 24 chemotherapy drugs and targeted drugs than their high-risk counterparts. Taken together, this work can serve as a reference for clinical decisions regarding suitable drugs, as patients in different groups are likely to show different immunotherapeutic responses.
The above results show that the poor prognosis in ESCA patients is mainly because of the reduction in immune activity and inhibited immune response in the TME, which can be targeted to overcome tumor immune suppression and enhance antitumor immunity. TP53WT and low-risk patients with ESCA may benefit from immunotherapy and chemotherapy, while TP53MUT and high-risk patients need different treatments. Nevertheless, some limitations of our investigation should be noted. First, the biological function of the seven identified genes, especially their association with immune infiltration, must be evaluated in functional assays. Second, only a limited amount of data was used for the performance assessment, so it is necessary to collect more robust datasets and to validate this signature in the future.
Furthermore, AP002478.1, a non-coding RNA identified in this study, lacks relevant research reports. BHLHA15 (also known as Mist1), a basic helix-loop-helix transcription factor, can give rise to cancers (Hayakawa et al., 2015; Sakitani et al., 2017). FFAR2 (also named GPR43) is a member of the G-protein-coupled receptor family that is expressed in leukocytes and the colon (Tan et al., 2014). The microbial metabolite-sensing receptor FFAR2 is critical for the regulation of immune cell function and the maintenance of gut homeostasis, and the loss of FFAR2 increases tumor burden in multiple models of tumorigenesis (Sivaprakasam et al., 2016; Pan et al., 2017; Kim et al., 2018). Insulin-like growth factor binding proteins (IGFBPs) are a family of secreted proteins that were originally characterized as passive carriers of insulin-like growth factors (IGFs) in the circulation with high affinity. The intranuclear roles of IGFBPs are transcriptional regulation, induction of apoptosis, and DNA damage repair, which point to their intimate involvement in tumor development, progression, and resistance to treatment (Baxter, 2014). Studies have shown that miR-454-3p overexpression can inhibit the expression of insulin-like growth factor 2 mRNA-binding protein 1 (IGF2BP1) at the protein and mRNA expression levels and thus inhibit the occurrence and development of esophageal cancer (Yan et al., 2020). Consistent with our study, IGF2BP1 is a poor prognostic factor for esophageal cancer (Yan et al., 2020). There have been few studies on KCTD12 in cancer. Some researchers have reported that hypermethylation of KCTD8 is associated with the occurrence and development of breast cancer (Faryna et al., 2012), which is consistent with our study. PHYHD1, phytanoyl-CoA dioxygenase domain containing 1, is a putative ortholog of Xenopus phytanoyl-CoA dioxygenase-like (Furusawa et al., 2016). Reports of PHYHD1 in cancer are rare, and bioinformatics analyses have shown that PHYHD1 is associated with the prognosis of laryngeal squamous cell carcinoma (Cui et al., 2020). SLC26 (solute carrier family 26) proteins function as anion transporters and/or channels (Alper and Sharma, 2013). Nevertheless, information regarding the role of SLC26A9 in cancer is lacking.
Conclusion
In conclusion, for the first time, we established a gene signature based on TP53 mutation status. This signature was found to be an independent prognostic factor for ESCA patients and showed promising sensitivity and specificity for survival predictions. In addition, immune cell infiltration differences were observed in the ESCA immune microenvironment, which could guide drug treatment strategies.
Data Availability Statement
Publicly available datasets were analyzed in this study. This data can be found here: https://portal.gdc.cancer.gov/repository.
Author Contributions
HZ, ZH, and YS designed the experiments, and wrote and revised the paper. ZY and QS designed the experiments and analyzed the data. KW, ZZ, and ZL collected the data and modified the language of the article. XC and FL conducted the experiments. All authors contributed to the article and approved the submitted version.
Funding
This study was supported by grants from the National Natural Science Foundation of China (Nos. 81773116, 81760436, 81560399, 81460362, and 81860518) and the National Early Detection and Treatment Project for Upper Digestive Tract in Rural Area in China (2009).
Conflict of Interest
The authors declare that the research was conducted in the absence of any commercial or financial relationships that could be construed as a potential conflict of interest.
Acknowledgments
We thank the TCGA and ICGC databases for the availability of the data.
Footnotes
References
Alper, S., and Sharma, A. (2013). The SLC26 gene family of anion transporters and channels. Mol. Aspects Med. 34, 494–515. doi: 10.1016/j.mam.2012.07.009
Banks, R., and Lopezotín, C. (2010). International network of cancer genome projects. Nature 464, 993–998.
Baxter, R. (2014). IGF binding proteins in cancer: mechanistic and clinical insights. Nat. Rev. Cancer 14, 329–341. doi: 10.1038/nrc3720
Behring, M., Vazquez, A. I., Cui, X., Irvin, M. R., Ojesina, A. I., Agarwal, S., et al. (2019). Gain of function in somatic TP53 mutations is associated with immune-rich breast tumors and changes in tumor-associated macrophages. Mol. Genet. Genomic Med. 7:e1001. doi: 10.1002/mgg3.1001
Bray, F., Ferlay, J., Soerjomataram, I., Siegel, R. L., Torre, L. A., and Jemal, A. (2020). Global cancer statistics 2018: GLOBOCAN estimates of incidence and mortality worldwide for 36 cancers in 185 countries. CA Cancer J. Clin. 68, 394–424. doi: 10.3322/caac.21492
Canale, M., Petracci, E., Delmonte, A., Bronte, G., Chiadini, E., Ludovini, V., et al. (2020). Concomitant TP53 mutation confers worse prognosis in EGFR-mutated non-small cell lung cancer patients treated with TKIs. J. Clin. Med. 9:1047. doi: 10.3390/jcm9041047
Cui, J., Wang, L., Zhong, W., Chen, Z., Chen, J., Yang, H., et al. (2020). Identification and validation of methylation-driven genes prognostic signature for recurrence of laryngeal squamous cell carcinoma by integrated bioinformatics analysis. Cancer Cell Int. 20:472. doi: 10.1186/s12935-020-01567-3
Deng, H. Y., Li, G., and Luo, J. (2018). Does oesophageal stenosis have any impact on survival of oesophageal cancer patients? Interact. Cardiovasc. Thorac. Surg. 27, 384–386. doi: 10.1093/icvts/ivy095
Domper Arnal, M. J., Ferrandez Arenas, A., and Lanas Arbeloa, A. (2015). Esophageal cancer: risk factors, screening and endoscopic treatment in Western and Eastern countries. World J. Gastroenterol. 21, 7933–7943. doi: 10.3748/wjg.v21.i26.7933
Faryna, M., Konermann, C., Aulmann, S., Bermejo, J., Brugger, M., Diederichs, S., et al. (2012). Genome-wide methylation screen in low-grade breast cancer identifies novel epigenetically altered genes as potential biomarkers for tumor diagnosis. FASEB J. 26, 4937–4950. doi: 10.1096/fj.12-209502
Fu, J., Li, K., Zhang, W., Wan, C., Zhang, J., Jiang, P., et al. (2020). Large-scale public data reuse to model immunotherapy response and resistance. Genome Med. 12:21. doi: 10.1186/s13073-020-0721-z
Furusawa, Y., Kubo, T., and Fukazawa, T. (2016). Phyhd1, an XPhyH-like homologue, is induced in mouse T cells upon T cell stimulation. Biochem. Biophys. Res. Commun. 472, 551–556. doi: 10.1016/j.bbrc.2016.03.039
Garnett, M. J., Edelman, E. J., Heidorn, S. J., Greenman, C. D., Dastur, A., Lau, K. W., et al. (2012). Systematic identification of genomic markers of drug sensitivity in cancer cells. Nature 483, 570–575. doi: 10.1038/nature11005
Giacomelli, A. O., Yang, X., Lintner, R. E., McFarland, J. M., Duby, M., Kim, J., et al. (2018). Mutational processes shape the landscape of TP53 mutations in human cancer. Nat. Genet. 50, 1381–1387. doi: 10.1038/s41588-018-0204-y
Gupta, B., and Kumar, N. (2017). Worldwide incidence, mortality and time trends for cancer of the oesophagus. Eur. J. Cancer Prev. 26, 107–118. doi: 10.1097/cej.0000000000000249
Ham, S. W., Jeon, H. Y., Jin, X., Kim, E. J., Kim, J. K., Shin, Y. J., et al. (2019). TP53 gain-of-function mutation promotes inflammation in glioblastoma. Cell Death Differ. 26, 409–425. doi: 10.1038/s41418-018-0126-3
Hayakawa, Y., Ariyama, H., Stancikova, J., Sakitani, K., Asfaha, S., Renz, B., et al. (2015). Mist1 expressing gastric stem cells maintain the normal and neoplastic gastric epithelium and are supported by a perivascular stem cell niche. Cancer Cell 28, 800–814. doi: 10.1016/j.ccell.2015.10.003
Hoffmann, T. K., Donnenberg, A. D., Finkelstein, S. D., Donnenberg, V. S., Friebe-Hoffmann, U., Myers, E. N., et al. (2002). Frequencies of tetramer+ T cells specific for the wild-type sequence p53(264-272) peptide in the circulation of patients with head and neck cancer. Cancer Res. 62, 3521–3529.
Hong, B., van den Heuvel, A. P., Prabhu, V. V., Zhang, S., and El-Deiry, W. S. (2014). Targeting tumor suppressor p53 for cancer therapy: strategies, challenges and opportunities. Curr. Drug Targets 15, 80–89. doi: 10.2174/1389450114666140106101412
Huang, F. L., and Yu, S. J. (2018). Esophageal cancer: risk factors, genetic association, and treatment. Asian J. Surg. 41, 210–215. doi: 10.1016/j.asjsur.2016.10.005
Ignacio, R. M. C., Lee, E. S., Wilson, A. J., Beeghly-Fadiel, A., Whalen, M. M., and Son, D. S. (2018). Chemokine network and overall survival in TP53 wild-type and mutant ovarian cancer. Immune Netw. 18:e29. doi: 10.4110/in.2018.18.e29
Jiang, P., Gu, S., Pan, D., Fu, J., Sahu, A., Hu, X., et al. (2018). Signatures of T cell dysfunction and exclusion predict cancer immunotherapy response. Nat. Med. 24, 1550–1558. doi: 10.1038/s41591-018-0136-1
Jiao, X. D., Qin, B. D., You, P., Cai, J., and Zang, Y. S. (2018). The prognostic value of TP53 and its correlation with EGFR mutation in advanced non-small cell lung cancer, an analysis based on cBioPortal data base. Lung Cancer 123, 70–75. doi: 10.1016/j.lungcan.2018.07.003
Kang, N., Wang, Y., Guo, S., Ou, Y., Wang, G., Chen, J., et al. (2018). Mutant TP53 G245C and R273H promote cellular malignancy in esophageal squamous cell carcinoma. BMC Cell Biol. 19:16. doi: 10.1186/s12860-018-0167-y
Kelly, R. J. (2017). Immunotherapy for esophageal and gastric cancer. Am. Soc Clin. Oncol. Educ. Book 37, 292–300. doi: 10.14694/edbk_175231
Kim, M., Friesen, L., Park, J., Kim, H., and Kim, C. (2018). Microbial metabolites, short-chain fatty acids, restrain tissue bacterial load, chronic inflammation, and associated cancer in the colon of mice. Eur. J. Immunol. 48, 1235–1247. doi: 10.1002/eji.201747122
Kuleshov, M. V., Diaz, J. E. L., Flamholz, Z. N., Keenan, A. B., Lachmann, A., Wojciechowicz, M. L., et al. (2019). modEnrichr a suite of gene set enrichment analysis tools for model organisms. Nucleic Acids Res. 47, W183–W190. doi: 10.1093/nar/gkz347
Li, L., Li, M., and Wang, X. (2020). Cancer type-dependent correlations between TP53 mutations and antitumor immunity. DNA Repair (Amst) 88:102785. doi: 10.1016/j.dnarep.2020.102785
Lim, Y. W., Chen-Harris, H., Mayba, O., Lianoglou, S., Wuster, A., Bhangale, T., et al. (2018). Germline genetic polymorphisms influence tumor gene expression and immune cell infiltration. Proc. Natl. Acad. Sci. U.S.A. 115, E11701–E11710. doi: 10.1073/pnas.1804506115
Lin, E. W., Karakasheva, T. A., Hicks, P. D., Bass, A. J., and Rustgi, A. K. (2016). The tumor microenvironment in esophageal cancer. Oncogene 35, 5337–5349. doi: 10.1038/onc.2016.34
Long, J., Wang, A., Bai, Y., Lin, J., Yang, X., Wang, D., et al. (2019). Development and validation of a TP53-associated immune prognostic model for hepatocellular carcinoma. EBioMedicine 42, 363–374. doi: 10.1016/j.ebiom.2019.03.022
Lundsten, S., Hernandez, V. A., Gedda, L., Saren, T., Brown, C. J., Lane, D. P., et al. (2020). Tumor-targeted delivery of the p53-activating peptide VIP116 with PEG-stabilized lipodisks. Nanomaterials (Basel) 10:783. doi: 10.3390/nano10040783
Makino, T., Yamasaki, M., Miyata, H., Yoshioka, S., Takiguchi, S., Fujiwara, Y., et al. (2010). p53 Mutation status predicts pathological response to chemoradiotherapy in locally advanced esophageal cancer. Ann. Surg. Oncol. 17, 804–811. doi: 10.1245/s10434-009-0786-9
Moore, E. C., Sun, L., Clavijo, P. E., Friedman, J., Harford, J. B., Saleh, A. D., et al. (2018). Nanocomplex-based TP53 gene therapy promotes anti-tumor immunity through TP53- and STING-dependent mechanisms. Oncoimmunology 7:e1404216. doi: 10.1080/2162402x.2017.1404216
Newman, A. M., Liu, C. L., Green, M. R., Gentles, A. J., Feng, W., Xu, Y., et al. (2015). Robust enumeration of cell subsets from tissue expression profiles. Nat. Methods 12, 453–457. doi: 10.1038/nmeth.3337
Orio, F., Knijnenburg, T. A., Vis, D. J., Bignell, G. R., Menden, M. P., Schubert, M., et al. (2016). A landscape of pharmacogenomic interactions in cancer. Cell 166, 740–754.
Pan, P., Skaer, C. W., Wang, H., Oshima, K., Huang, Y., Yu, J., et al. (2017). Loss of free fatty acid receptor 2 enhances colonic adenoma development and reduces the chemopreventive effects of black raspberries in ApcMin/+ mice. Carcinogenesis 38, 86–93. doi: 10.1093/carcin/bgw122
Pathak, S., Meng, W. J., Nandy, S. K., Ping, J., Bisgin, A., Helmfors, L., et al. (2015). Radiation and SN38 treatments modulate the expression of microRNAs, cytokines and chemokines in colon cancer cells in a p53-directed manner. Oncotarget 6, 44758–44780. doi: 10.18632/oncotarget.5815
Ralhan, R., Arora, S., Chattopadhyay, T. K., Shukla, N. K., and Mathur, M. (2000). Circulating p53 antibodies, p53 gene mutational profile and product accumulation in esophageal squamous-cell carcinoma in India. Int. J. Cancer 85, 791–795.
Reimand, J., Isserlin, R., Voisin, V., Kucera, M., Tannus-Lopes, C., Rostamianfar, A., et al. (2019). Pathway enrichment analysis and visualization of omics data using g:Profiler, GSEA, cytoscape and enrichmentmap. Nat. Protoc. 14, 482–517. doi: 10.1038/s41596-018-0103-9
Robinson, M. D., McCarthy, D. J., and Smyth, G. K. (2010). edgeR: a bioconductor package for differential expression analysis of digital gene expression data. Bioinformatics 26, 139–140. doi: 10.1093/bioinformatics/btp616
Sakitani, K., Hayakawa, Y., Deng, H., Ariyama, H., Kinoshita, H., Konishi, M., et al. (2017). CXCR4-expressing Mist1(+) progenitors in the gastric antrum contribute to gastric cancer development. Oncotarget 8, 111012–111025. doi: 10.18632/oncotarget.22451
Shi, X., Kaller, M., Rokavec, M., Kirchner, T., Horst, D., and Hermeking, H. (2020). Characterization of a p53/miR-34a/CSF1R/STAT3 feedback-loop in colorectal cancer. Cell Mol. Gastroenterol. Hepatol. 10, 391–418. doi: 10.1016/j.jcmgh.2020.04.002
Silwal-Pandit, L., Langerod, A., and Borresen-Dale, A. L. (2017). TP53 mutations in breast and ovarian cancer. Cold Spring Harb. Perspect. Med. 7:a026252. doi: 10.1101/cshperspect.a026252
Sivaprakasam, S., Gurav, A., Paschall, A., Coe, G., Chaudhary, K., Cai, Y., et al. (2016). An essential role of Ffar2 (Gpr43) in dietary fibre-mediated promotion of healthy composition of gut microbiota and suppression of intestinal carcinogenesis. Oncogenesis 5:e238. doi: 10.1038/oncsis.2016.38
Stein, H. J., Feith, M., Bruecher, B. L., Naehrig, J., Sarbia, M., and Siewert, J. R. (2005). Early esophageal cancer: pattern of lymphatic spread and prognostic factors for long-term survival after surgical resection. Ann. Surg. 242, 566–573: discussion 573-5. doi: 10.1097/01.sla.0000184211.75970.85
Suntharalingam, M., Winter, K., Ilson, D., Dicker, A. P., Kachnic, L., Konski, A., et al. (2017). Effect of the addition of cetuximab to paclitaxel, cisplatin, and radiation therapy for patients with esophageal cancer: The NRG oncology RTOG 0436 phase 3 randomized clinical trial. JAMA Oncol. 3, 1520–1528. doi: 10.1001/jamaoncol.2017.1598
Tan, J., McKenzie, C., Potamitis, M., Thorburn, A., Mackay, C., and Macia, L. (2014). The role of short-chain fatty acids in health and disease. Adv. Immunol. 121, 91–119. doi: 10.1016/b978-0-12-800100-4.00003-9
Tomczak, K., Czerwinska, P., and Wiznerowicz, M. (2015). The cancer genome atlas (TCGA): an immeasurable source of knowledge. Contemp. Oncol. (Pozn) 19, A68–A77. doi: 10.5114/wo.2014.47136
van den Ende, T., Smyth, E., Hulshof, M., and van Laarhoven, H. W. M. (2018). Chemotherapy and novel targeted therapies for operable esophageal and gastroesophageal junctional cancer. Best Pract. Res. Clin. Gastroenterol. 3, 45–52. doi: 10.1016/j.bpg.2018.11.005
Wei, W. Q., Chen, Z. F., He, Y. T., Feng, H., Hou, J., Lin, D. M., et al. (2015). Long-term follow-up of a community assignment, one-time endoscopic screening study of esophageal cancer in china. J. Clin. Oncol. 33, 1951–1957. doi: 10.1200/jco.2014.58.0423
Wong, G. S., Lee, J. S., Park, Y. Y., Klein-Szanto, A. J., Waldron, T. J., Cukierman, E., et al. (2013). Periostin cooperates with mutant p53 to mediate invasion through the induction of STAT1 signaling in the esophageal tumor microenvironment. Oncogenesis 2:e59. doi: 10.1038/oncsis.2013.17
Wu, C., Rao, X., and Lin, W. (2020). Immune landscape and a promising immune prognostic model associated with TP53 in early-stage lung adenocarcinoma. Cancer Med. 10, 806–823. doi: 10.1002/cam4.3655
Xu, F., Lin, H., He, P., He, L., Chen, J., Lin, L., et al. (2020). A TP53-associated gene signature for prediction of prognosis and therapeutic responses in lung squamous cell carcinoma. Oncoimmunology 9:1731943. doi: 10.1080/2162402x.2020.1731943
Yan, A., Wang, C., Zheng, L., Zhou, J., and Zhang, Y. (2020). MicroRNA-454-3p inhibits cell proliferation and invasion in esophageal cancer by targeting insulin-like growth factor 2 mRNA-binding protein 1. Oncol. Lett. 20:359. doi: 10.3892/ol.2020.12223
Yang, W., Jorge, S., Patricia, G., Edelman, E. J., Howard, L., Simon, F., et al. (2012). Genomics of drug sensitivity in cancer (GDSC): a resource for therapeutic biomarker discovery in cancer cells. Nucleic Acids Res. 41, D955–D961.
Yao, Z., and Sherif, Z. A. (2016). The effect of epigenetic silencing and TP53 mutation on the expression of DLL4 in human cancer stem disorder. Oncotarget 7, 62976–62988. doi: 10.18632/oncotarget.11316
Zhang, X., Cheng, Q., Yin, H., and Yang, G. (2017). Regulation of autophagy and EMT by the interplay between p53 and RAS during cancer progression (Review). Int. J. Oncol. 51, 18–24. doi: 10.3892/ijo.2017.4025
Zhao, Y., Xu, E., Yang, X., Zhang, Y., Chen, H., Wang, Y., et al. (2020). Tumor infiltrative growth pattern correlates with the immune microenvironment and is an independent factor for lymph node metastasis and prognosis in stage T1 esophageal squamous cell carcinoma. Virchows Arch. 477, 401–408. doi: 10.1007/s00428-020-02801-z
Keywords: oesophageal carcinoma, TP53, signature, immune cell infiltration, therapeutic responses
Citation: Zhang H, Huang Z, Song Y, Yang Z, Shi Q, Wang K, Zhang Z, Liu Z, Cui X and Li F (2021) The TP53-Related Signature Predicts Immune Cell Infiltration, Therapeutic Response, and Prognosis in Patients With Esophageal Carcinoma. Front. Genet. 12:607238. doi: 10.3389/fgene.2021.607238
Received: 16 September 2020; Accepted: 06 May 2021;
Published: 16 June 2021.
Edited by:
Yue-miao Zhang, Peking University People’s Hospital, ChinaReviewed by:
Roberto Rangel, University of Texas MD Anderson Cancer Center, United StatesJin Yang, Ningbo First Hospital, China
Copyright © 2021 Zhang, Huang, Song, Yang, Shi, Wang, Zhang, Liu, Cui and Li. This is an open-access article distributed under the terms of the Creative Commons Attribution License (CC BY). The use, distribution or reproduction in other forums is permitted, provided the original author(s) and the copyright owner(s) are credited and that the original publication in this journal is cited, in accordance with accepted academic practice. No use, distribution or reproduction is permitted which does not comply with these terms.
*Correspondence: Xiaobin Cui, Y3VpeGlhb2JpbjQzNjNAZm94bWFpbC5jb20=; Feng Li, bGlmZW5nNzg1NUAxMjYuY29t
†These authors have contributed equally to this work
 Hongpan Zhang
 Zheng Huang1†
 Qi Shi
 Feng Li
