 Jingping Yuan
 Changwei Shen
 Bihua Chen1,2
- 1School of Horticulture and Landscape Architecture, Henan Institute of Science and Technology, Xinxiang, China
- 2Henan Engineering Research Center of the Development and Utilization of Characteristic Horticultural Plants, Xinxiang, China
- 3School of Resources and Environmental Sciences, Henan Institute of Science and Technology, Xinxiang, China
- 4Zhengzhou Vegetable Research Institute (ZVRI), Zhengzhou, China
Cucurbita Linn. vegetables have a long history of cultivation and have been cultivated all over the world. With the increasing area of saline–alkali soil, Cucurbita Linn. is affected by salt stress, and calmodulin-binding transcription activator (CAMTA) is known for its important biological functions. Although the CAMTA gene family has been identified in several species, there is no comprehensive analysis on Cucurbita species. In this study, we analyzed the genome of Cucurbita maxima and Cucurbita moschata. Five C. moschata calmodulin-binding transcription activators (CmoCAMTAs) and six C. maxima calmodulin-binding transcription activators (CmaCAMTAs) were identified, and they were divided into three subfamilies (Subfamilies I, II, and III) based on the sequence identity of amino acids. CAMTAs from the same subfamily usually have similar exon–intron distribution and conserved domains (CG-1, TIG, IQ, and Ank_2). Chromosome localization analysis showed that CmoCAMTAs and CmaCAMTAs were unevenly distributed across four and five out of 21 chromosomes, respectively. There were a total of three duplicate gene pairs, and all of which had experienced segmental duplication events. The transcriptional profiles of CmoCAMTAs and CmaCAMTAs in roots, stems, leaves, and fruits showed that these CAMTAs have tissue specificity. Cis-acting elements analysis showed that most of CmoCAMTAs and CmaCAMTAs responded to salt stress. By analyzing the transcriptional profiles of CmoCAMTAs and CmaCAMTAs under salt stress, it was shown that both C. moschata and C. maxima shared similarities against salt tolerance and that it is likely to contribute to the development of these species. Finally, quantitative real-time polymerase chain reaction (qRT-PCR) further demonstrated the key role of CmoCAMTAs and CmaCAMTAs under salt stress. This study provided a theoretical basis for studying the function and mechanism of CAMTAs in Cucurbita Linn.
Introduction
Environmental conditions are highly important to the growth and productivity of plants. However, the adverse environment caused by biotic and abiotic stresses typically allows plants to cope with it by developing or activating some mechanisms (Yamniuk and Vogel, 2004). One of the prime research priorities for scientists in recent years has been to clarify the mechanism of plant stress response. For this purpose, several genes and pathways have been identified (Büyük et al., 2016). Research on plant transcription factors (TFs), for example, has been rapidly increased in the regulation of stress-related genes. With this development, the identification of TFs in plants at the whole-genome stage has become an increasingly popular source of research and is necessary for understanding the plant stress response (Yamniuk and Vogel, 2004; Büyük et al., 2016; Inal et al., 2017). TFs play important roles in cell and non-cell signal transduction by interacting with cis-elements (Wei et al., 2017).
As the secondary messenger of eukaryotes, Ca2+ ions play important roles in gene transcription and intracellular signal transduction. At present, many sensor proteins, such as calmodulin (CaM), are responsive to Ca2+ concentration changes inside and outside cells (İlhan et al., 2018). Calmodulin-binding transcription activator (CAMTA) family is called a rapid stress response element when screening calmodulin-binding protein (Min et al., 2009; Pant et al., 2018). Based on functional differentiation, CAMTA included a variety of functional domains: (1) CG-1 DNA-binding domain at the N terminal, which includes nuclear localization signal; (2) ankyrin repeats, which are responsive to the mediated interaction of protein–protein; (3) calmodulin binding domain (CaMBD), which includes different numbers of IQ motifs (IQXXXRGXXXR). These domains combine with CaM in a Ca2+-independent way (Bouché et al., 2002; Kaplan et al., 2006; Finkler et al., 2007; Yang et al., 2012).
The CAMTA gene was first reported in tobacco (Yang and Poovaiah, 2000). Since then, the CAMTA gene family has been identified in many species, for instance, 6, 7, 10, 9, 15, 18, and 7 genes were found in Arabidopsis thaliana, Solanum lycopersicum, Vitis vinifera, Zea mays, Glycine max, Brassica napus, and Populus trichocarpa, respectively (Bouché et al., 2002; Yang et al., 2012; Shangguan et al., 2014; Yue et al., 2015; Wang et al., 2015; Rahman et al., 2016a; Wei et al., 2017). Related literature showed that CAMTA TFs were involved in responses to a variety of stresses, including drought stress, heat stress, cold stress, salt stress, ultraviolet ray, wound stress, abscisic acid, and salicylic acid (Yang et al., 2012, 2015; Pandey et al., 2013; Zhao et al., 2013; Shangguan et al., 2014; Yue et al., 2015; Rahman et al., 2016a; Wei et al., 2017).
In A. thaliana, AtCAMTA1 regulated drought stress by acting on the cis-acting elements of several stress-responsive genes, such as RD26, ERD7, RAB18, LTPs, COR78, CBF1, and HSPs (Pandey et al., 2013). At the same time, AtCAMTA1 mutants showed lower drought resistance than the wild type in A. thaliana (Pandey et al., 2013). In addition, AtCAMTA3 regulated the defense response of pathogens by activating EDS1-mediated SA signals (Du et al., 2009), and it could also directly regulate NDR1 and EIN3 to participate in ethylene-induced senescence (Nie et al., 2012). A. thaliana CAMTA1–CAMTA3 double mutants were more sensitive to cold stress (Doherty et al., 2009). The CAMTA genes in Phaseolus vulgaris have been identified, and all PvulCAMTA genes were targeted by miRNAs, which play a role in the response mechanism of salt stress (Büyük et al., 2019).
Cucurbita Linn. vegetables have a long history of cultivation and are cultivated all over the world. In recent years, Cucurbita Linn. has been paid more and more attention as a yellow-green vegetable with healthcare benefits (Henz et al., 2020; Ibeh et al., 2020). Cucurbita Linn. seeds and pulp have high nutritional value and are suitable for deep processing. However, with the increasing saline–alkali soil area, it is particularly important to study the salt-resistant mechanism and screen salt-tolerant varieties of Cucurbita Linn. as a non-salt vegetable (Zhao, 2006). C. maxima and C. moschata are the two main cultivated species of Cucurbita Linn.
Many CAMTAs have been identified in different plants through the whole-genome identification method, but there is no report in Cucurbita Linn. (Wang et al., 2015; Wei et al., 2017; İlhan et al., 2018). The main purpose of this study is to identify and characterize the CAMTA gene in C. maxima and C. moschata and to explore their crucial role under salt stress. In this study, several bioinformatics tools were used to analyze the number, distribution, classification, gene structure, protein structure, gene duplication, and evolution of CAMTA genes in C. maxima and C. moschata. Moreover, to validate the function of the CAMTA genes under salt stress, we also performed RNA-seq and qRT-PCR analyses. The result of this study is of great significance to the genetic improvement of salt-tolerant varieties of Cucurbita Linn.
Materials and Methods
Identification and Characterization of CAMTAs in C. moschata and C. maxima
To identify the CAMTAs in Cucurbita Linn., we downloaded the C. moschata and C. maxima genomes from the Cucurbit genomics database (CuGenDB1) (Sun et al., 2017). The proteins of six A. thaliana CAMTAs (AtCAMT1–AtCAMT6) were downloaded from the NCBI database2 by using their gene IDs from previous literature (Zhang et al., 2019), and they were used as search queries against the Cucurbit genomics database by BLASTP. The E-value cutoff was set up at a threshold of 1 × e–10, and the protein sequences with less than 70% of the corresponding A. thaliana were eliminated from the study. In addition, we used CD-Search3 and SMART4 to verify the different CAMTA domains such as the IPT/TIG, IQ motifs, ankyrin repeats, and CG-1 DNA-binding domain. After removing the false-positive genes, the remaining genes were termed C. moschata CAMTAs (CmoCAMTAs) and C. maxima CAMTA (CmaCAMTAs). The information on the coding sequence and protein sequence of CmoCAMTA and CmaCAMTA is listed in Supplementary Table 1.
The physicochemical characteristics of CmoCAMTAs and CmaCAMTAs include the theoretical isoelectric point (pI), the length of amino acids (aa), and theoretical molecular weight (MW). All of them were analyzed by ExPASy5. The subcellular locations of CmoCAMTA and CmaCAMTA were predicted by Plant-mPLoc (Chou and Shen, 2010).
Construction of Phylogenetic Tree
To construct the unrooted evolutionary tree of CAMTAs from C. moschata and C. maxima, CmoCAMTA and CmaCAMTA protein sequences were downloaded from the Cucurbit genomics database, and the tree was constructed with the help of MEGA 7.0 (Sudhir et al., 2016) using the neighbor-joining (NJ) method. The parameters were set as follows: completed deletion, Poisson model, and a branch tree cutoff value of 80%. Also, MEGA 7.0 was used to analyze the phylogenetic relationships of CAMTA in A. thaliana, C. moschata, and C. maxima.
Structure Analysis of CAMTAs From C. moschata and C. maxima
To explore the structural characteristics of CAMTAs in C. moschata and C. maxima, the genomic DNA and corresponding cDNA sequences were downloaded from the Cucurbit genomics database. The intron-exon structure pattern was mapped by Gene Structure Display Server (GSDS6) (Hu et al., 2015).
To further analyze the conserved motif of CAMTAs in C. moschata and C. maxima, the protein sequences of CmoCAMTAs and CmaCAMTAs were used. The conserved motifs were presented on the Multiple Expectation Maximization or Motif Elicitation (MEME7) (Bailey and Elkan, 1995), while the LOGOs (Supplementary Figure 1) of motifs can also be presented through MEME.
To analyze the conserved domain of CAMTA protein in C. moschata and C. maxima, the protein sequences of CmoCAMTAs and CmaCAMTAs were used. The location information of the conserved domain was extracted from Batch Web CD-Search Tool8 (Marchler-Bauer et al., 2017), and the Simple BioSequence Viewer (Chen et al., 2020) in TBtools was finally used for visualization. The information about these conserved domains in CAMTA proteins from C. moschata and C. maxima is listed in Supplementary Table 2.
Gene Duplication of CAMTAs in C. moschata and C. maxima
Information on CmoCAMTA and CmaCAMTA genes, including the length of the genes on the chromosome, the starting position, and the terminal position of the genes on the chromosome, was investigated in the Cucurbit genomics database. The chromosomal locations of the CmoCAMTAs and CmaCAMTAs were mapped by visualization tools9.
To identify gene duplication, all CmoCAMTAs used Local Blast for the blastn program, and when the nucleotide sequence identity was greater than 85%, the E-value was less than 1 × e–10, and the gene alignment coverage was greater than 0.75; the two genes were considered to be a duplicated gene pair (Yuan et al., 2019). In addition, two genes were separated by one or several genes, as long as the distance between the two genes was less than 100 kb; it was called tandemly duplicated genes (Wang et al., 2010). The synonymous substitution ratio (Ks) was calculated on a Ka/Ks calculator according to Gojo-bori and Nei’s previous method (Zhang et al., 2006). In order to remove the saturation of substitutions, we discard gene pairs with Ks > 2.0 (Blanc and Wolfe, 2004; Li et al., 2014). The divergence time (T) of the duplicated genes was calculated based on T = Ks/2λ × 10–6 million years ago (Mya), λ = 1.5 × 10⁻⁸ (Emanuelsson et al., 2000).
Extraction of Cucurbita Linn. CAMTA Promoter Sequence and Analysis of Cis-Acting Elements
To analyze the salt stress-related cis-acting elements of Cucurbita Linn., promoter sequences (2,000 bp before the start codon) were extracted from the Cucurbit genomics database. These sequences were analyzed on the PlantCARE program10 and finally displayed by the Simple BioSequence Viewer in TBtools (Chen et al., 2020).
Expression Profiles of Cucurbita Linn. CAMTAs in RNA-Seq
To analyze the tissue expression characteristics of Cucurbita Linn. CAMTAs, the transcriptional profiles of C. moschata and C. maxima in root, stem, leaf, and fruit were analyzed according to the previously published transcriptome data (BioProject: PRJNA385310) (Sun et al., 2017). In this study, “Rifu” in C. moschata and “Rimu” in C. maxima were used as research materials.
To analyze the response of Cucurbita Linn. to salt stress, the transcript profiles of CAMTAs in leaf veins and leaf mesophylls were analyzed according to the transcriptome data (BioProject: PRJNA464060) (Niu et al., 2018). “N12” in C. moschata and “N15” in C. maxima were used as research materials.
Materials and Experimental Treatment
In this study, “Baimi 9” from C. moschata and “Beiguan” from C. maxima were used as research materials to analyze the expression of CAMTAs under salt stress. The seeds were provided by the pumpkin team of the School of Horticulture and Landscape Architecture, Henan Institute of Science and Technology. The seeds were first sown in a tray with a matrix meteorite (3:1) mixture and then placed in a plant growth chamber for cultivation. The artificial growth conditions were set as follows: daytime temperature of 25°C, 16 h of light, light intensity of 350 μmol/m2/s, night temperature of 16°C, and a relative humidity of 65%. When the seedlings have grown to 2 months, healthy and neat seedlings were selected and cultured in Hoagland’s solution at pH 6.5. After 5 days of adaptation, 50 healthy and consistent seedlings of each variety were selected for NaCl treatment (the concentration of NaCl was 75 mM), and the remaining 50 seedlings were used as control. The veins and mesophyll were collected after 12 h of salt treatment, and each treatment had three independent biological replicates, and 10 seedlings per biological replicate were selected for mixed sampling. All samples were frozen in liquid nitrogen and stored at −70°C for quantitative real-time PCR (qRT-PCR) analysis.
qRT-PCR Analysis
The control and salt-treated samples were taken from the freezer at −70°C and then fully ground with liquid nitrogen in the molding machine. The RNA was extracted by RNA-Solv@ reagent (Omega) and reverse-transcribed into cDNA with PrimeScriptTM RT Master Mix (TaKaRa) after DNase treatment, which was used as a template for qRT-PCR determination. The primers of CmoCAMTAs, CmaCAMTAs, and internal reference gene (β-actin) were first designed on Prime premier 6.0 and then blasted in the Cucurbit genomics database to verify the specificity of primers (Supplementary Table 3). Finally, the specificity of the primers was verified by the melting curve on Applied Biosystems 7,500. The reaction system included 10 μl of SYBR Green I, 2 μl of cDNA template, 0.4 μl of ROX dye II, 0.4 μl of primers, and 6.8 μl of ddH2O. The reaction conditions were set as follows: 95°C pre-denaturation for 30 s, 95°C for 5 s, and 60°C for 34 s (40 cycles). The melting curve was 95°C for 15 s, 60°C for 60 s, and 95°C for 15 s. Each sample was performed with three technical replicates, and the data were analyzed with the 2–ΔΔCt method (Livak and Schmittgen, 2001) and presented by HeatMap in TBtools (Chen et al., 2020).
Results
Identification and Characterization of CmoCAMTAs and CmaCAMTAs
Through the BLASTP program of six AtCAMTA proteins in the Cucurbit genomics database and a series of false positives and the same gene deletion steps, five CmoCAMTAs and six CmaCAMTAs were identified. According to their distribution on chromosomes (from the first chromosome to the last chromosome, from the top position to the end position of one chromosome), these genes were named CmoCAMTA1-CmoCAMTA5 and CmaCAMTA1-CmaCAMTA6, respectively.
The physical and chemical characteristics of five CmoCAMTAs and six CmaCAMTAs are listed in Table 1. The coding region of CmoCAMTAs ranged from 2,745 (CmoCAMTA4) to 3,270 bp (CmoCAMTA5), and the corresponding translated amino acids ranged from 914 to 1,089 aa (Table 1). Their theoretical molecular weight (MW) and theoretical isoelectric point (pI) were 103.36 (CmoCAMTA4) to 121.38 kDa (CmoCAMTA5) and 5.69 (CmoCAMTA5) to 7.7 (CmoCAMTA2), respectively. Similarly, the coding region of CmaCAMTAs ranged from 2,748 (CmaCAMTA5) to 3,273 bp (CmaCAMTA6), and the corresponding translated amino acids ranged from 915 to 1,090 aa (Table 1). Their theoretical MW and pI were 103.44 (CmaCAMTA5) to 121.64 kDa (CmaCAMTA3) and 5.66 (CmaCAMTA3) to 7.71 (CmaCAMTA5), respectively. Both CmoCAMTAs and CmaCAMTAs revealed diversity in the coding region, amino acid sequence, and MW and had low isoelectric points. Subcellular localization prediction analysis showed that all CmoCAMTAs and CmaCAMTAs were localized to the nucleus.
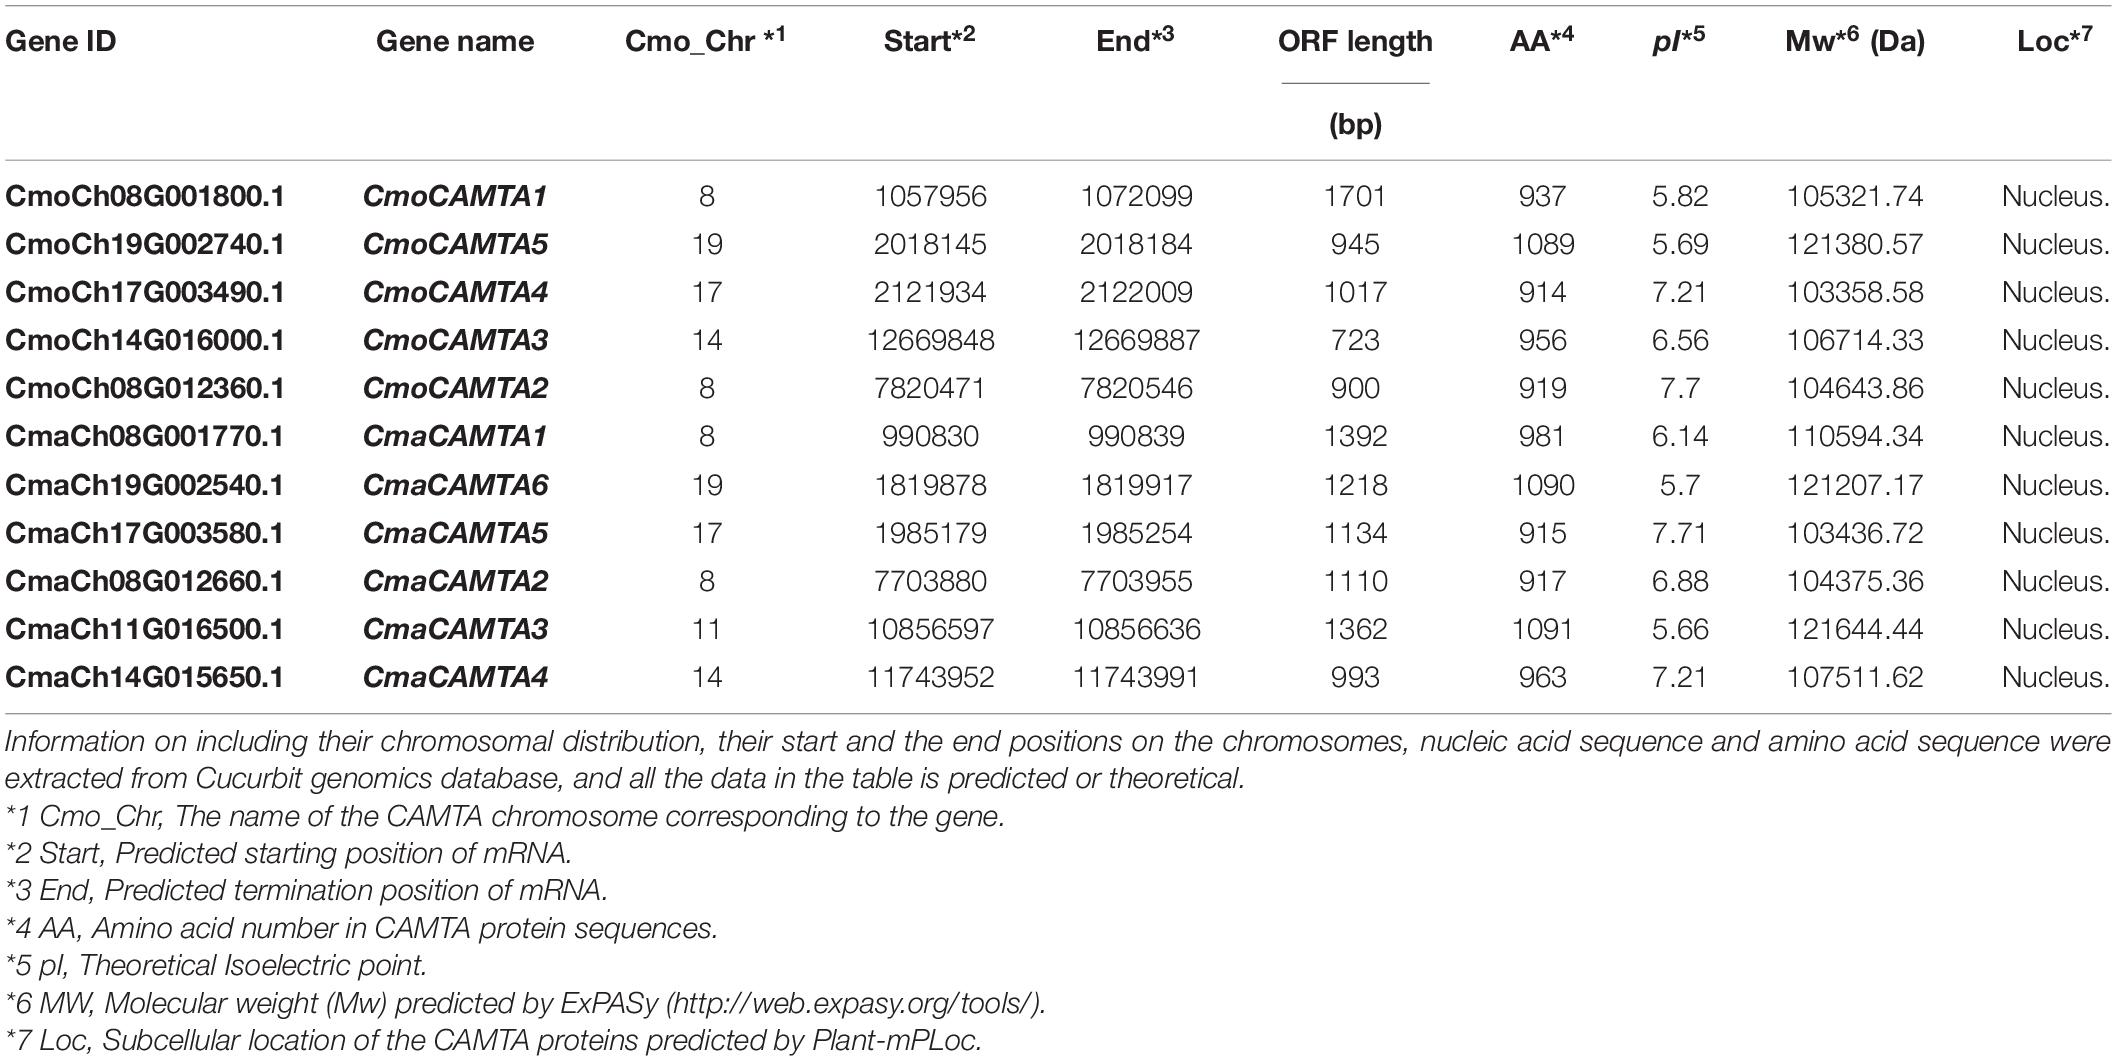
Table 1. Physical and chemical characteristics of the 5 CmoCAMTAs and 6 CmaCAMTAs.
Phylogenetic Relationship of CAMTAs in C. moschata, C. maxima, and A. thaliana
According to the identity of amino acid sequence, five CmoCAMTAs, six CmaCAMTAs, and six AtCAMTAs were used to construct an unrooted evolutionary tree. As shown in Figure 1, these genes were divided into three subfamilies (Subfamilies I, II, and III). Subfamily I contained the most (eight) members, subfamily II contained the least (three) members; the remaining six proteins belong to Subfamily III. Each subfamily contained CmoCAMTA, CmaCAMTA, and A. thaliana CAMTA (Figure 1).
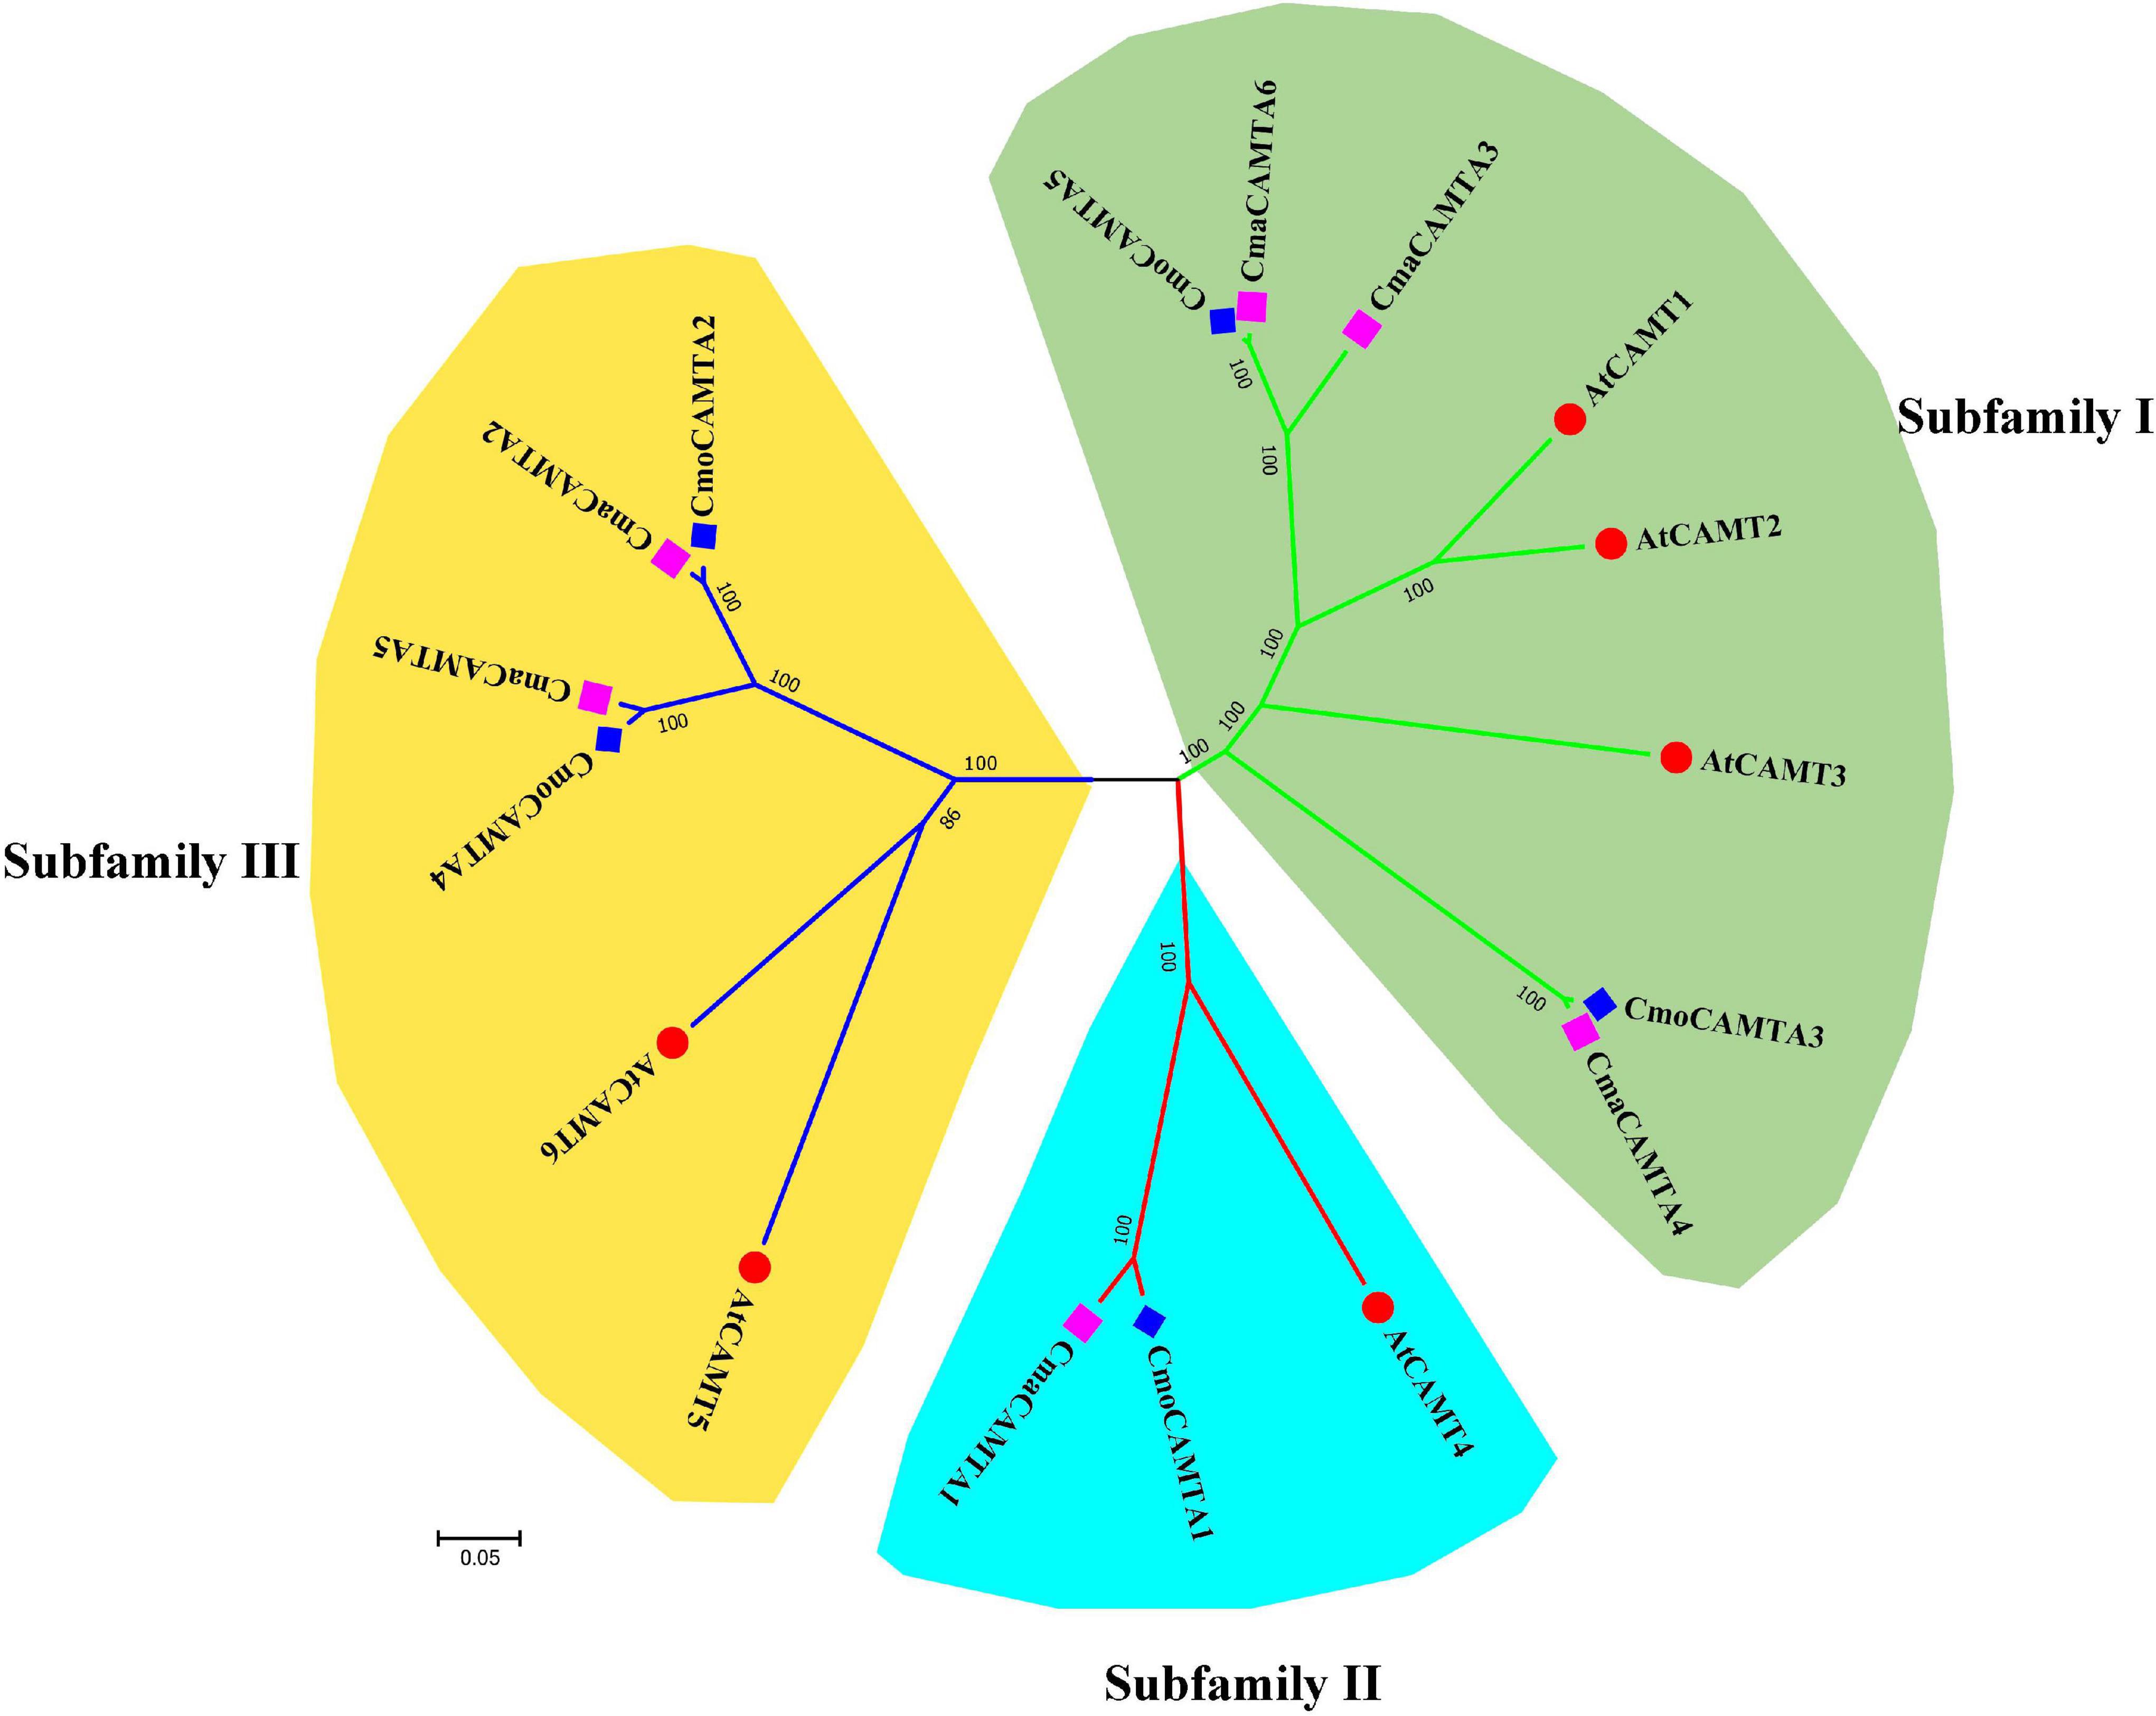
Figure 1. The phylogeny tree of five CmoCAMTAs, six CmaCAMTAs, and six AtCAMTAs. It was constructed by the neighbor-joining (NJ) method with 1,000 bootstrap replicates, and the cutoff value of the condensed tree was 80%. Each subfamily was highlighted with a specific background color.
Gene Structures of CAMTAs in C. moschata and C. maxima
By analyzing the intron–exon structure pattern of 11 Cucurbita Linn. CAMTAs (five CmoCAMTAs and six CmaCAMTAs), it showed that all CAMTAs contained 12–14 exons (Figure 2B). Some genes in the same branch contained similar structural features, such as CmoCAMTA5, CmaCAMTA6, and CmaCAMTA3 contained 12 exons and similar intron lengths (Figures 2A,B). In addition, CmoCAMTA4 as well as CmaCAMTA5 and CmoCAMTA2 as well as CmaCAMTA2 also contained 12 and 13 exons with similar intron length, respectively (Figure 2B).
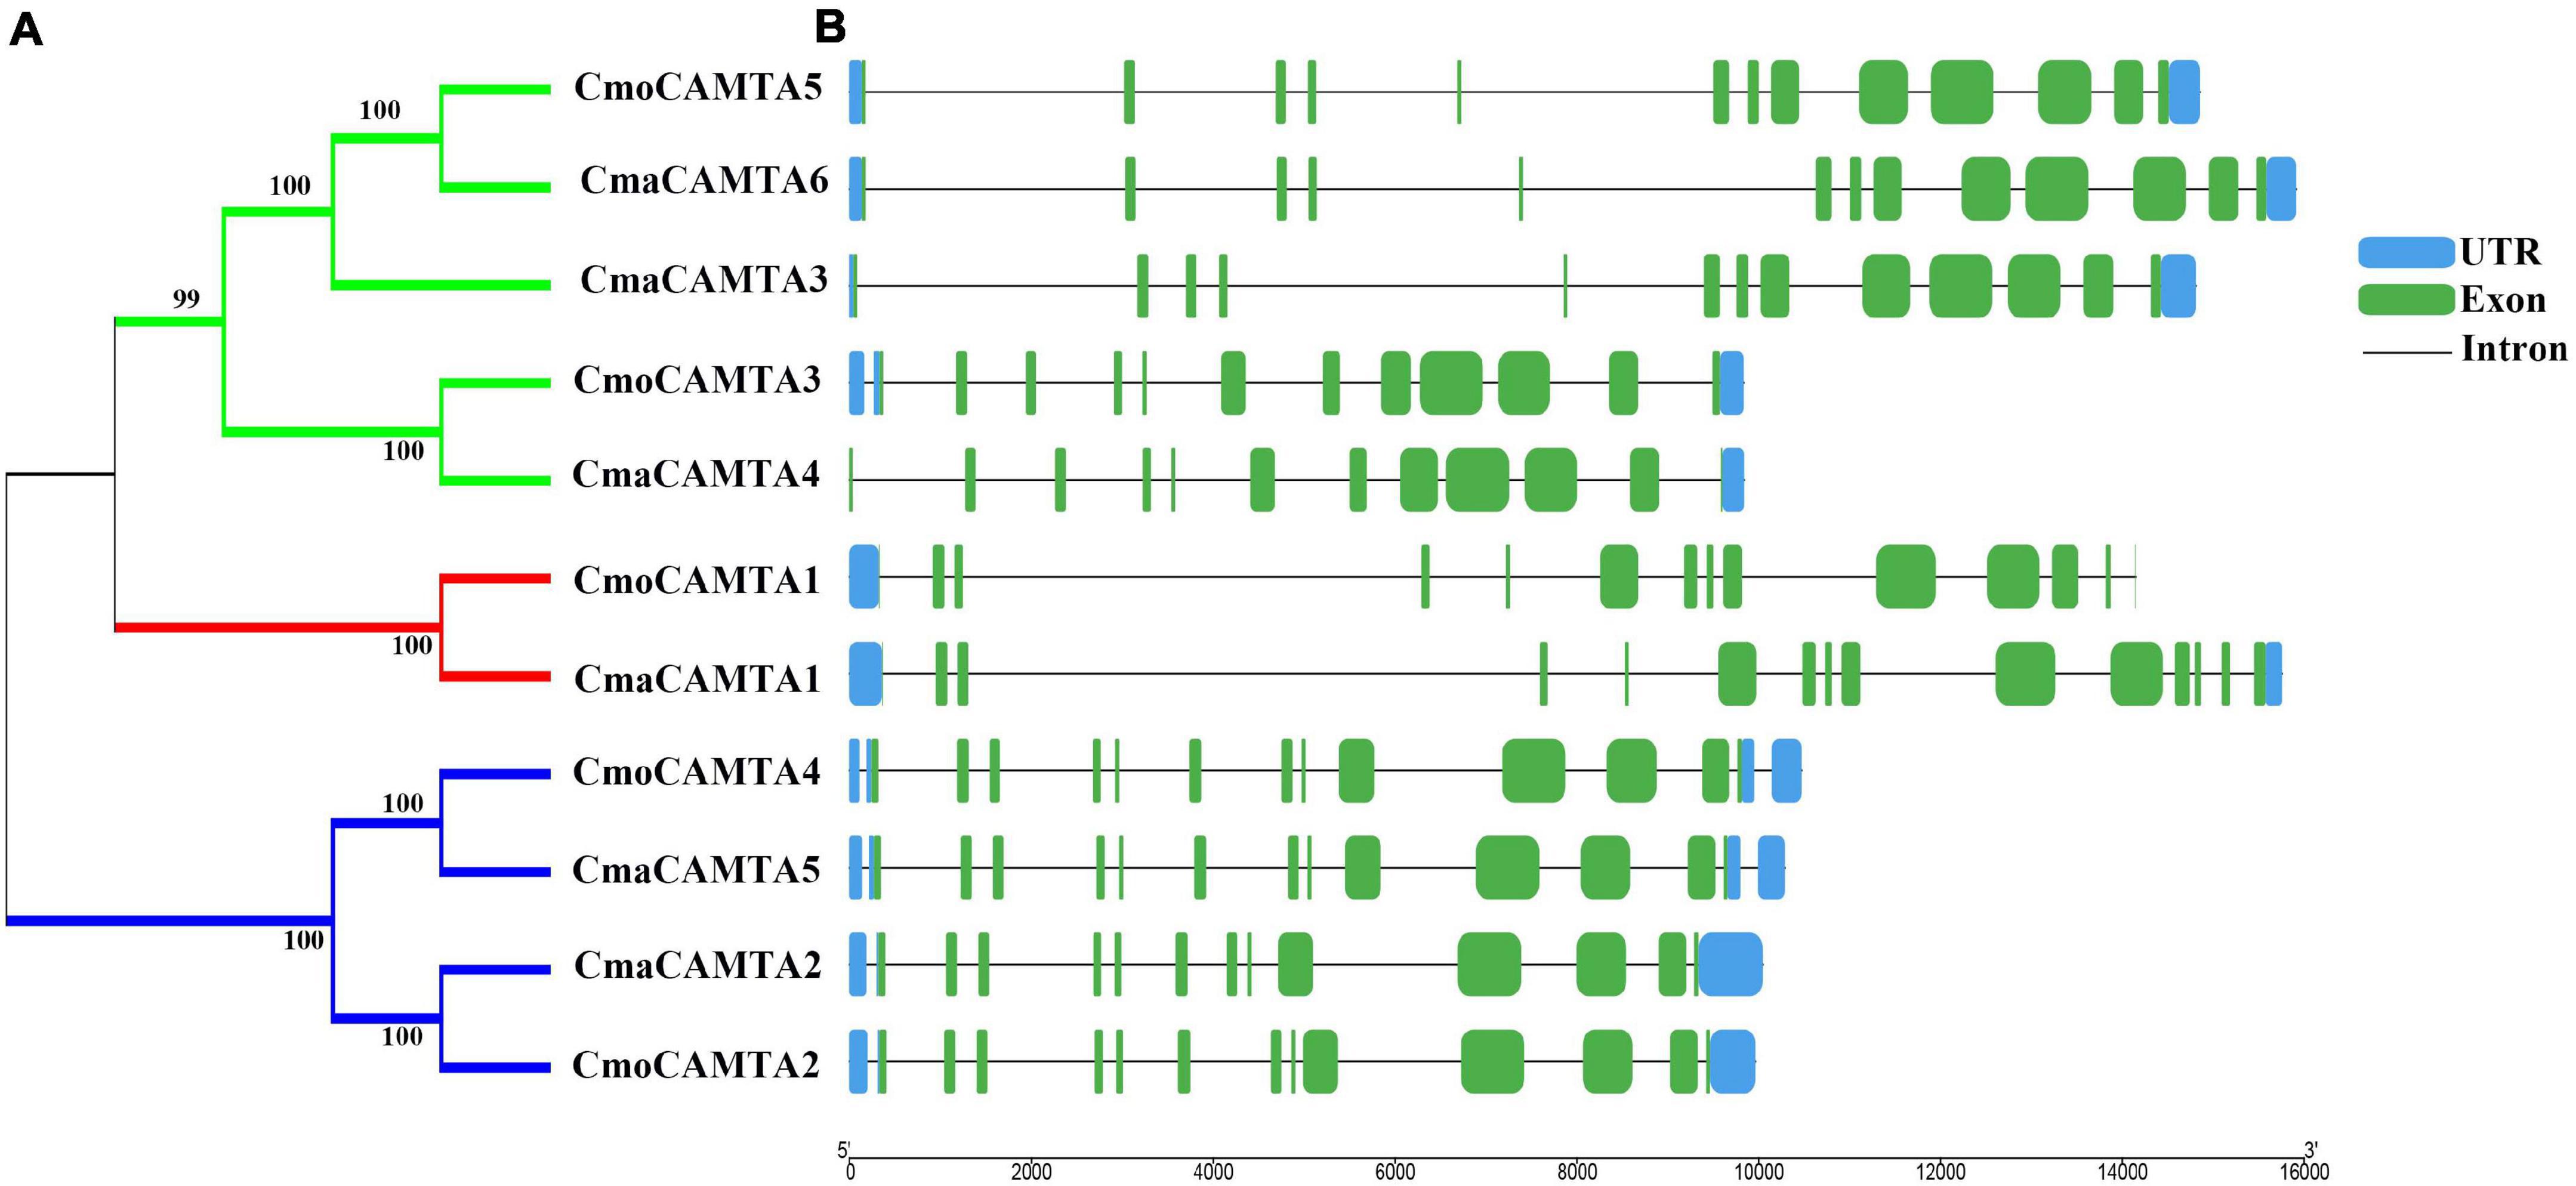
Figure 2. Classification and exon–intron distribution of five CmoCAMTAs and six CmaCAMTAs. (A) The phylogeny tree of five CmoCAMTAs and six CmaCAMTAs. It was constructed by the neighbor-joining (NJ) method with 1,000 bootstrap replicates, and the cutoff value of the condensed tree was 80%. (B) The exon-intron distribution of five CmoCAMTAs and six CmaCAMTAs. The GSDS was used, and the exons, introns, and untranslated regions (UTRs) were indicated with green boxes, blue boxes, and gray lines, respectively. The length of the introns and exons can be estimated based on the bottom scale.
Motif Composition and Conserved Domain of Five CmoCAMTAs and Six CmaCAMTAs
Motif analysis of CmaCAMTA and CmoCAMTA proteins indicated that motif 1 to motif 20 existed in all CAMTA proteins, but the CAMTA proteins in different subfamilies usually had different motif positions, such as motif 17, motif 15, and motif 16 (Figure 3A). CAMTA proteins in the same branches were similar, such as all CAMTA proteins in Subfamily III (Figure 3A). Conserved domain analysis showed that each CAMTA protein contained CG-1, TIG, IQ, and Ank_2 domains (Figure 3B). Detailed information about conserved domains is listed in Supplementary Table 2.
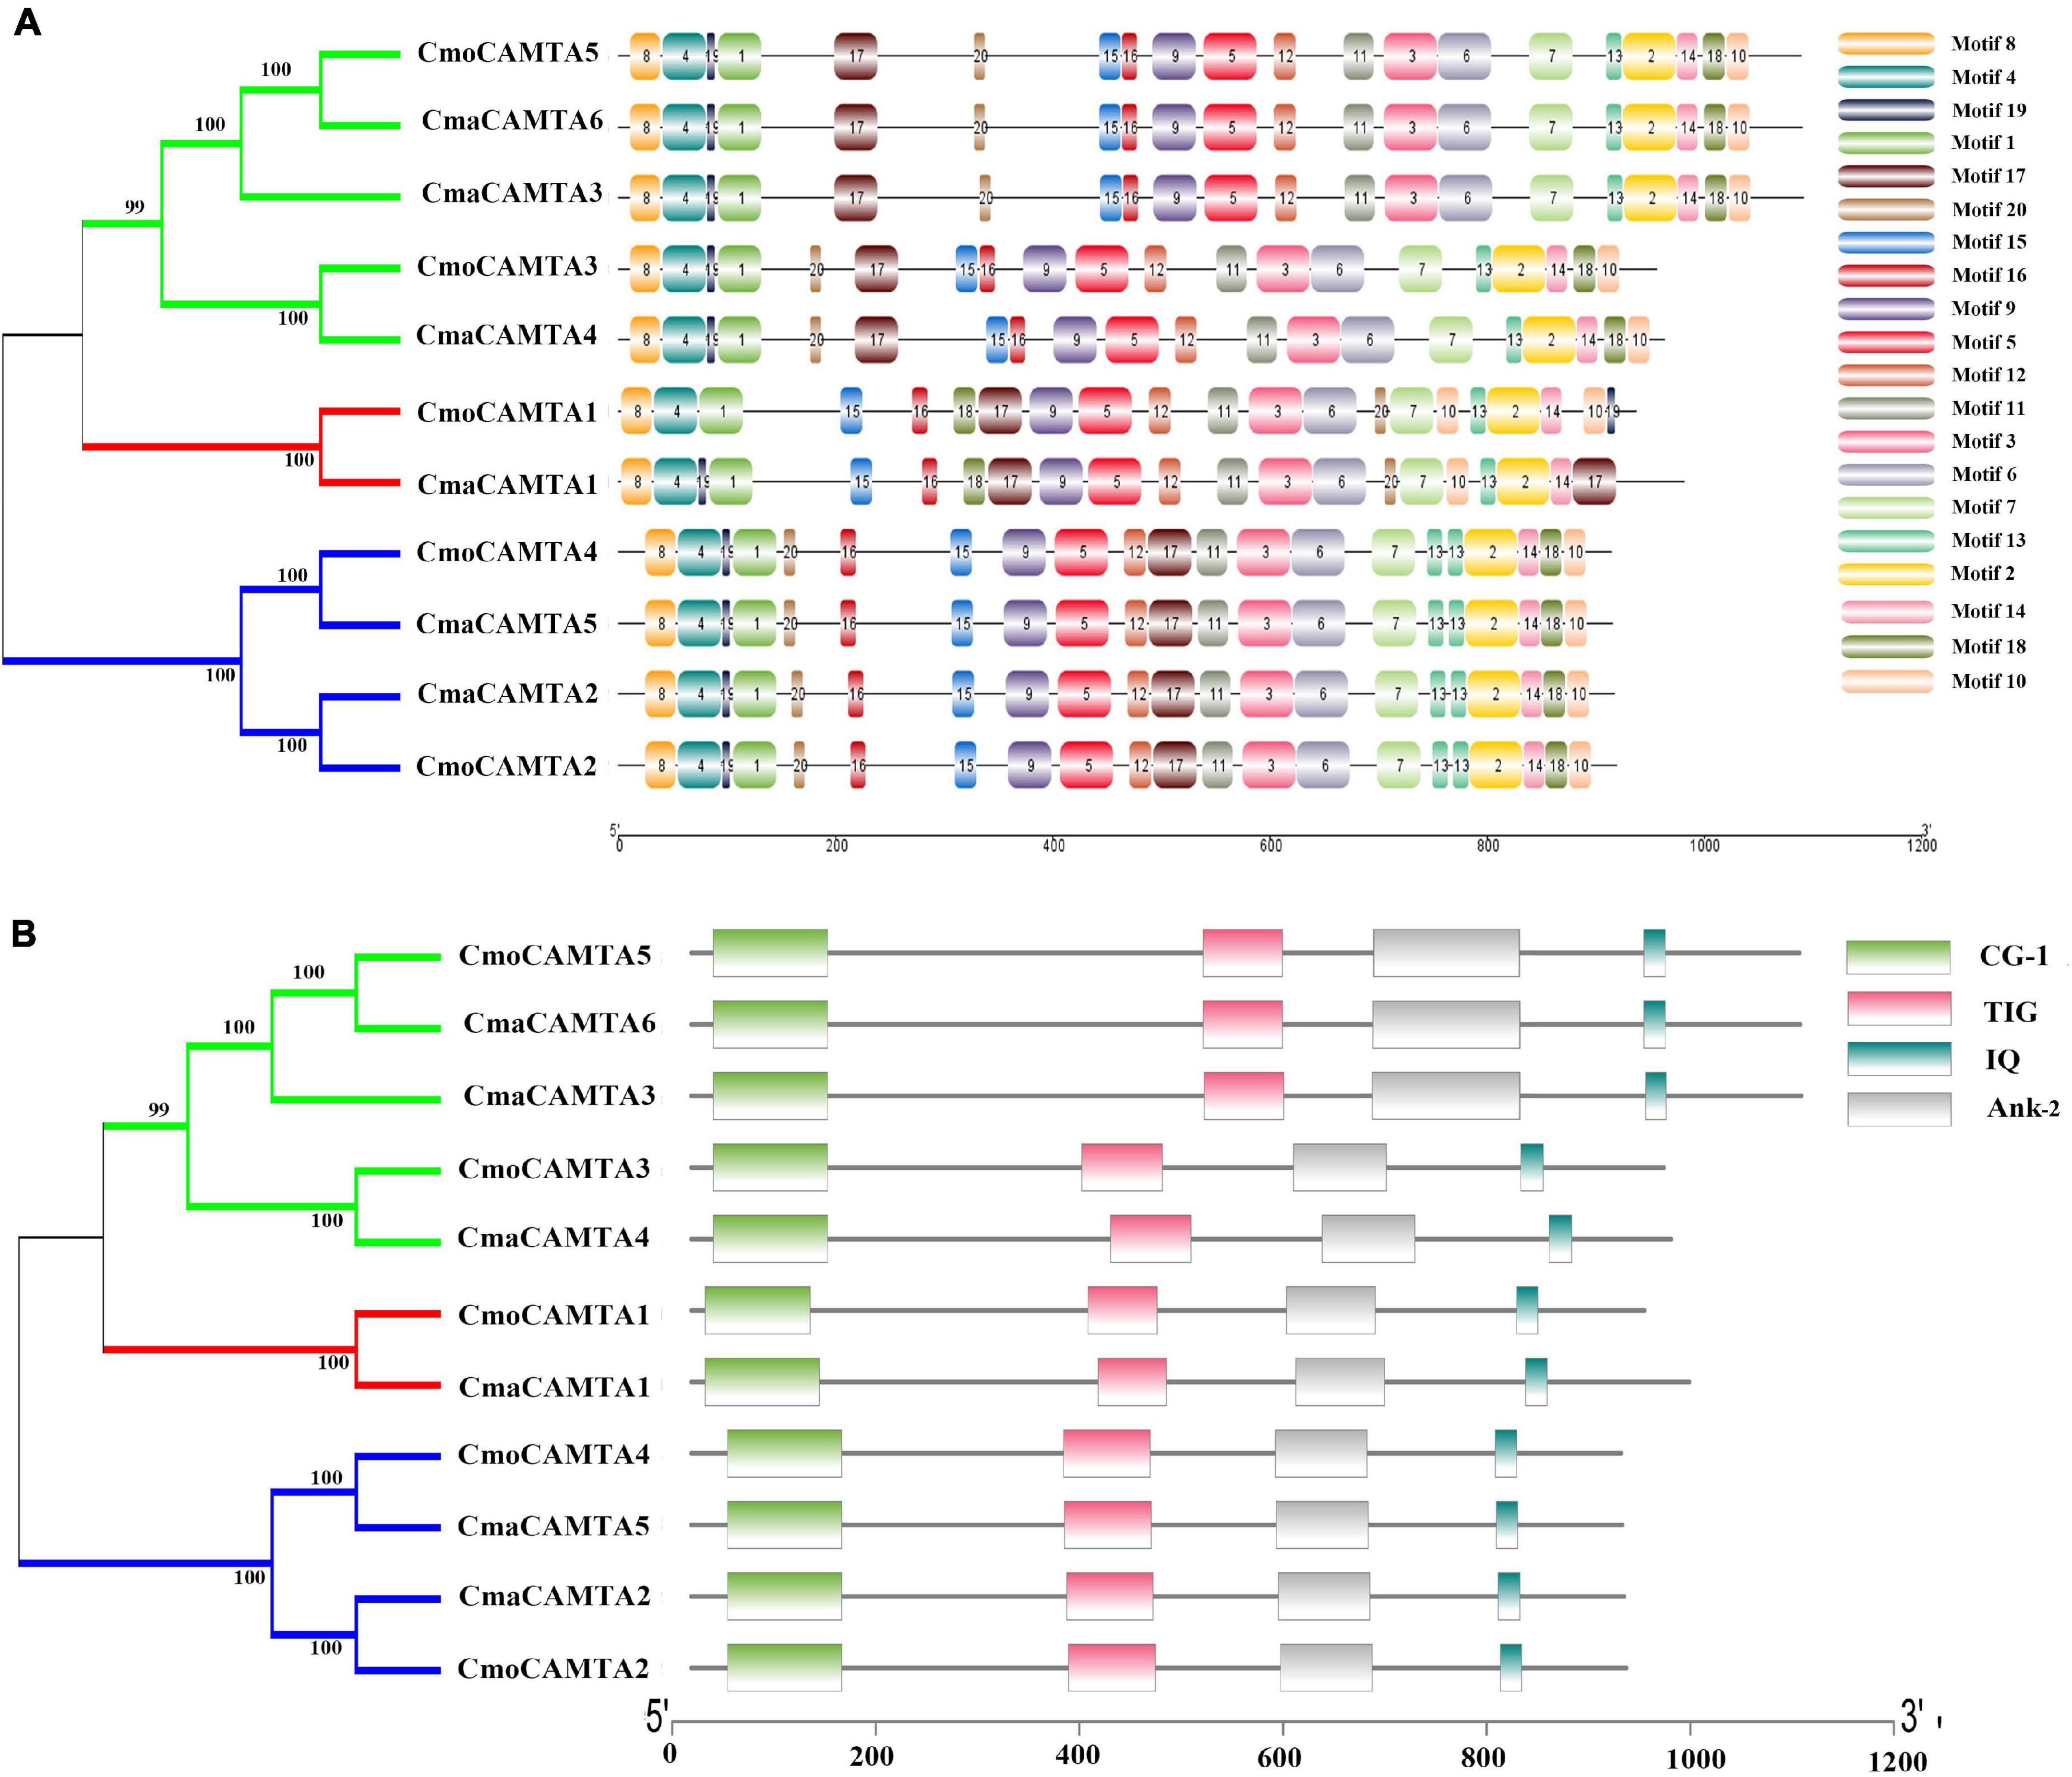
Figure 3. Conserved motifs and conserved domains of five CmoCAMTAs and six CmaCAMTAs. (A) Conserved motifs in five CmoCAMTAs and six CmaCAMTAs. Motif 1 to motif 10 represented different motifs, and they were represented by different color boxes on the right. (B) Conserved domains in five CmoCAMTAs and six CmaCAMTAs. CG-1, CG-1 domains. TIG, IPT/TIG domain. IQ, including the conserved sequences of Ile and Gln, is a calmodulin-binding motif. Ank_2, ankyrin repeats.
A comprehensive analysis of the motif and conserved domains of CmaCAMTA and CmoCAMTA proteins revealed that motif 1, motif 4, and part of motif 8 constituted the CG-1 domain; part of motif 9 and motif 5 constituted the TIG domain; motif 11, motif 3, and motif 6 constituted the Ank_2 domain; motif 2 constituted the IQ motif (Figures 3A,B). It is hypothesized that, based on the above study, most of them shared conserved structure like other CAMTAs in different species, and they are likely to respond to certain other stresses and stimulus signals.
Distribution and Gene Duplication of Five CmoCAMTAs and Six CmaCAMTAs
To predict the location of CmaCAMTAs and CmaCAMTAs on the chromosomes, the start position of CmaCAMTAs and CmaCAMTAs and the length of the corresponding chromosomes were analyzed. The results showed that five CmoCAMTAs and six CmaCAMTAs were distributed across four (Cmo_Chr08, Cmo_Chr14, Cmo_Chr17, and Cmo_Chr19) and five (Cma_Chr08, Cma_Chr11, Cma_Chr14, Cma_Chr17, and Cma_Chr19) out of 21 chromosomes, respectively (Figure 4). In addition, three duplicated gene pairs (CmoCAMTA4_CmoCAMTA2, CmaCAMTA6_CmaCAMTA3, and CmaCAMTA5_CmaCAMTA2) were found in Cucurbita Linn. Ka/Ks indicated that the duplicated gene pairs had diverged at 8.62–9.64 million years ago (Mya) (Supplementary Table 4).
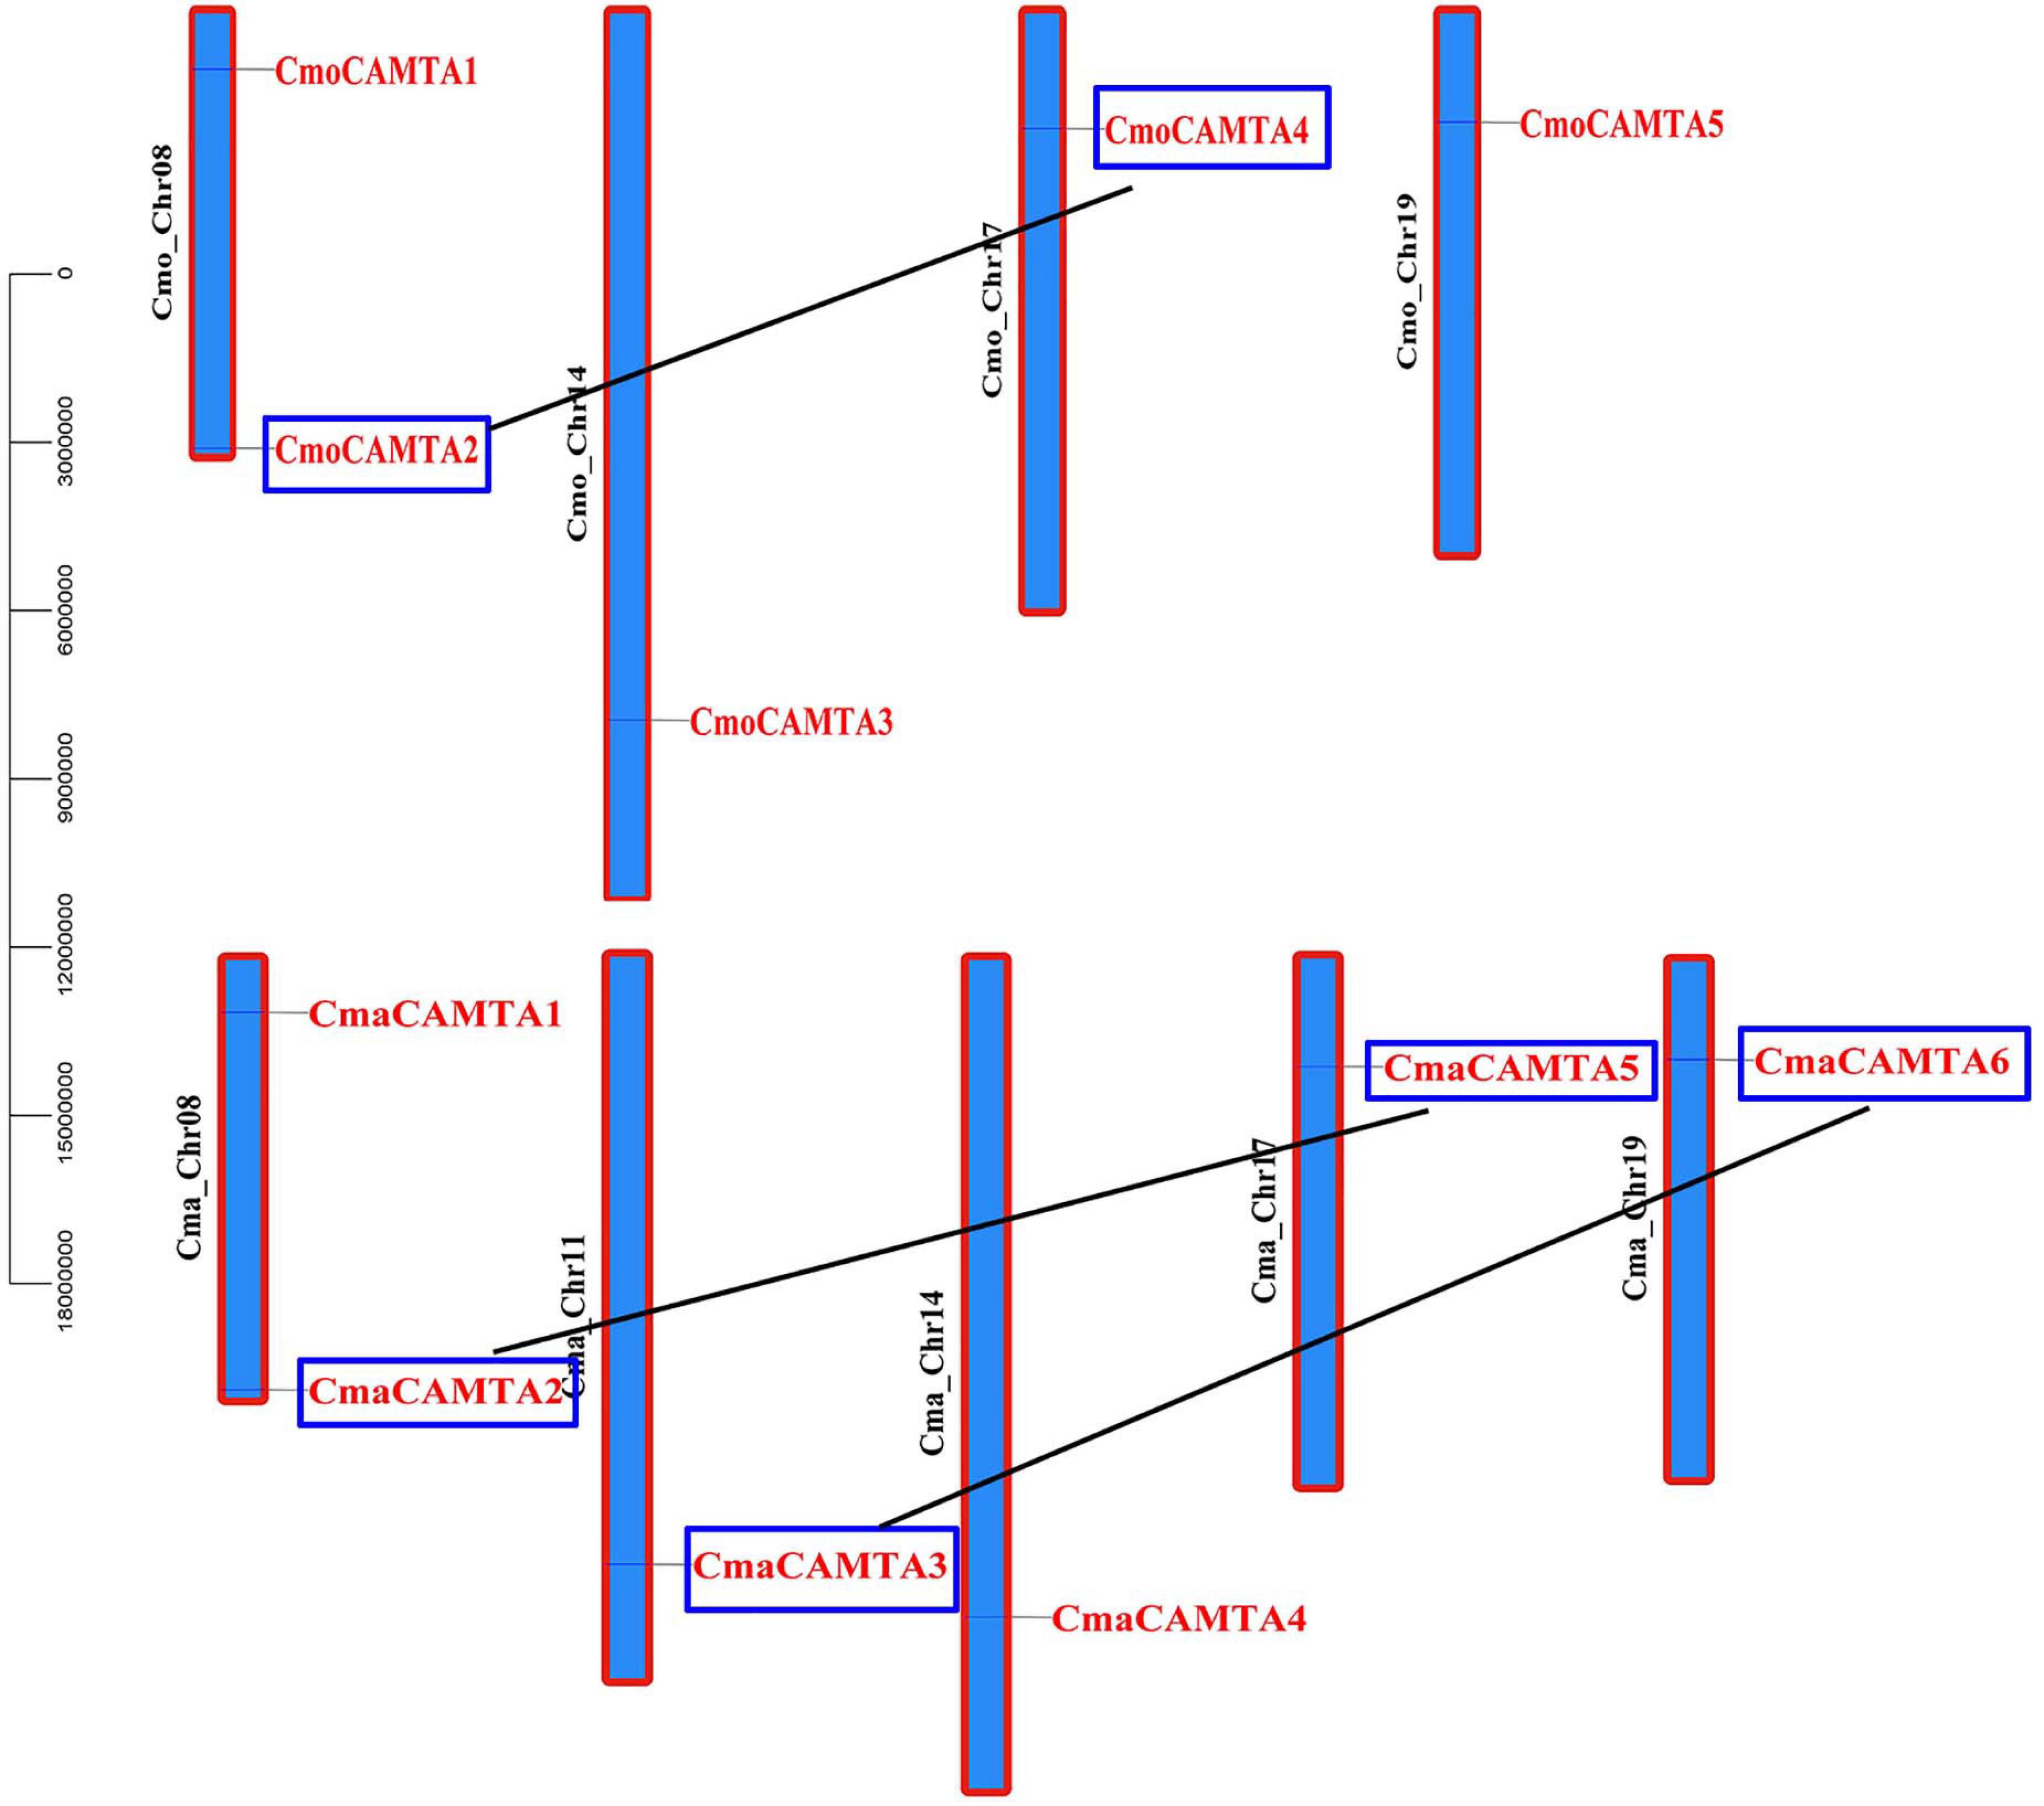
Figure 4. The distribution and duplication events of five CmoCAMTAs and six CmaCAMTAs on the chromosome. The location of these genes on the chromosome was visualized using the visualization tools. The duplicated gene pairs were indicated with blue boxes and connected by black lines.
Cis-Acting Elements in Five CmoCAMTA and Six CmaCAMTA Promoters
The cis-acting elements are specific motifs that exist in the promoter region of a gene sequence that regulates gene transcription. For instance, TGA-element, G-box, TGACG-motif, ABRE, GT1-motif, and MBS were all related to salt stress (Yamniuk and Vogel, 2004; Saeediazar et al., 2014). To explore whether CmoCAMTAs and CmaCAMTAs were involved in salt stress, we predicted and analyzed the cis-acting elements of these gene promoters. Details information about cis-acting elements are listed in Supplementary Table 5.
The prediction results showed that CmoCAMTA5 and CmaCAMTA6 promoters contained the highest number of (five) TGACG-motif (Figure 5). CmaCAMTA6, CmaCAMTA3, CmaCAMTA1, CmoCAMTA4, CmaCAMTA5, CmaCAMTA2, and CmoCAMTA2 contained a higher number of (four to eight) ABRE compared with other gene promoters. At the same time, CmoCAMTA4, CmaCAMTA5, CmaCAMTA2, and CmoCAMTA2 contain a higher number of (four to six) G-box than other genes (Figure 5). ABRE and G-box were presented in 10 of 11 Cucurbita Linn. CAMTA gene promoters (Figure 5), which fully reflect the response of CmoCAMTAs and CmaCAMTAs to salt stress.
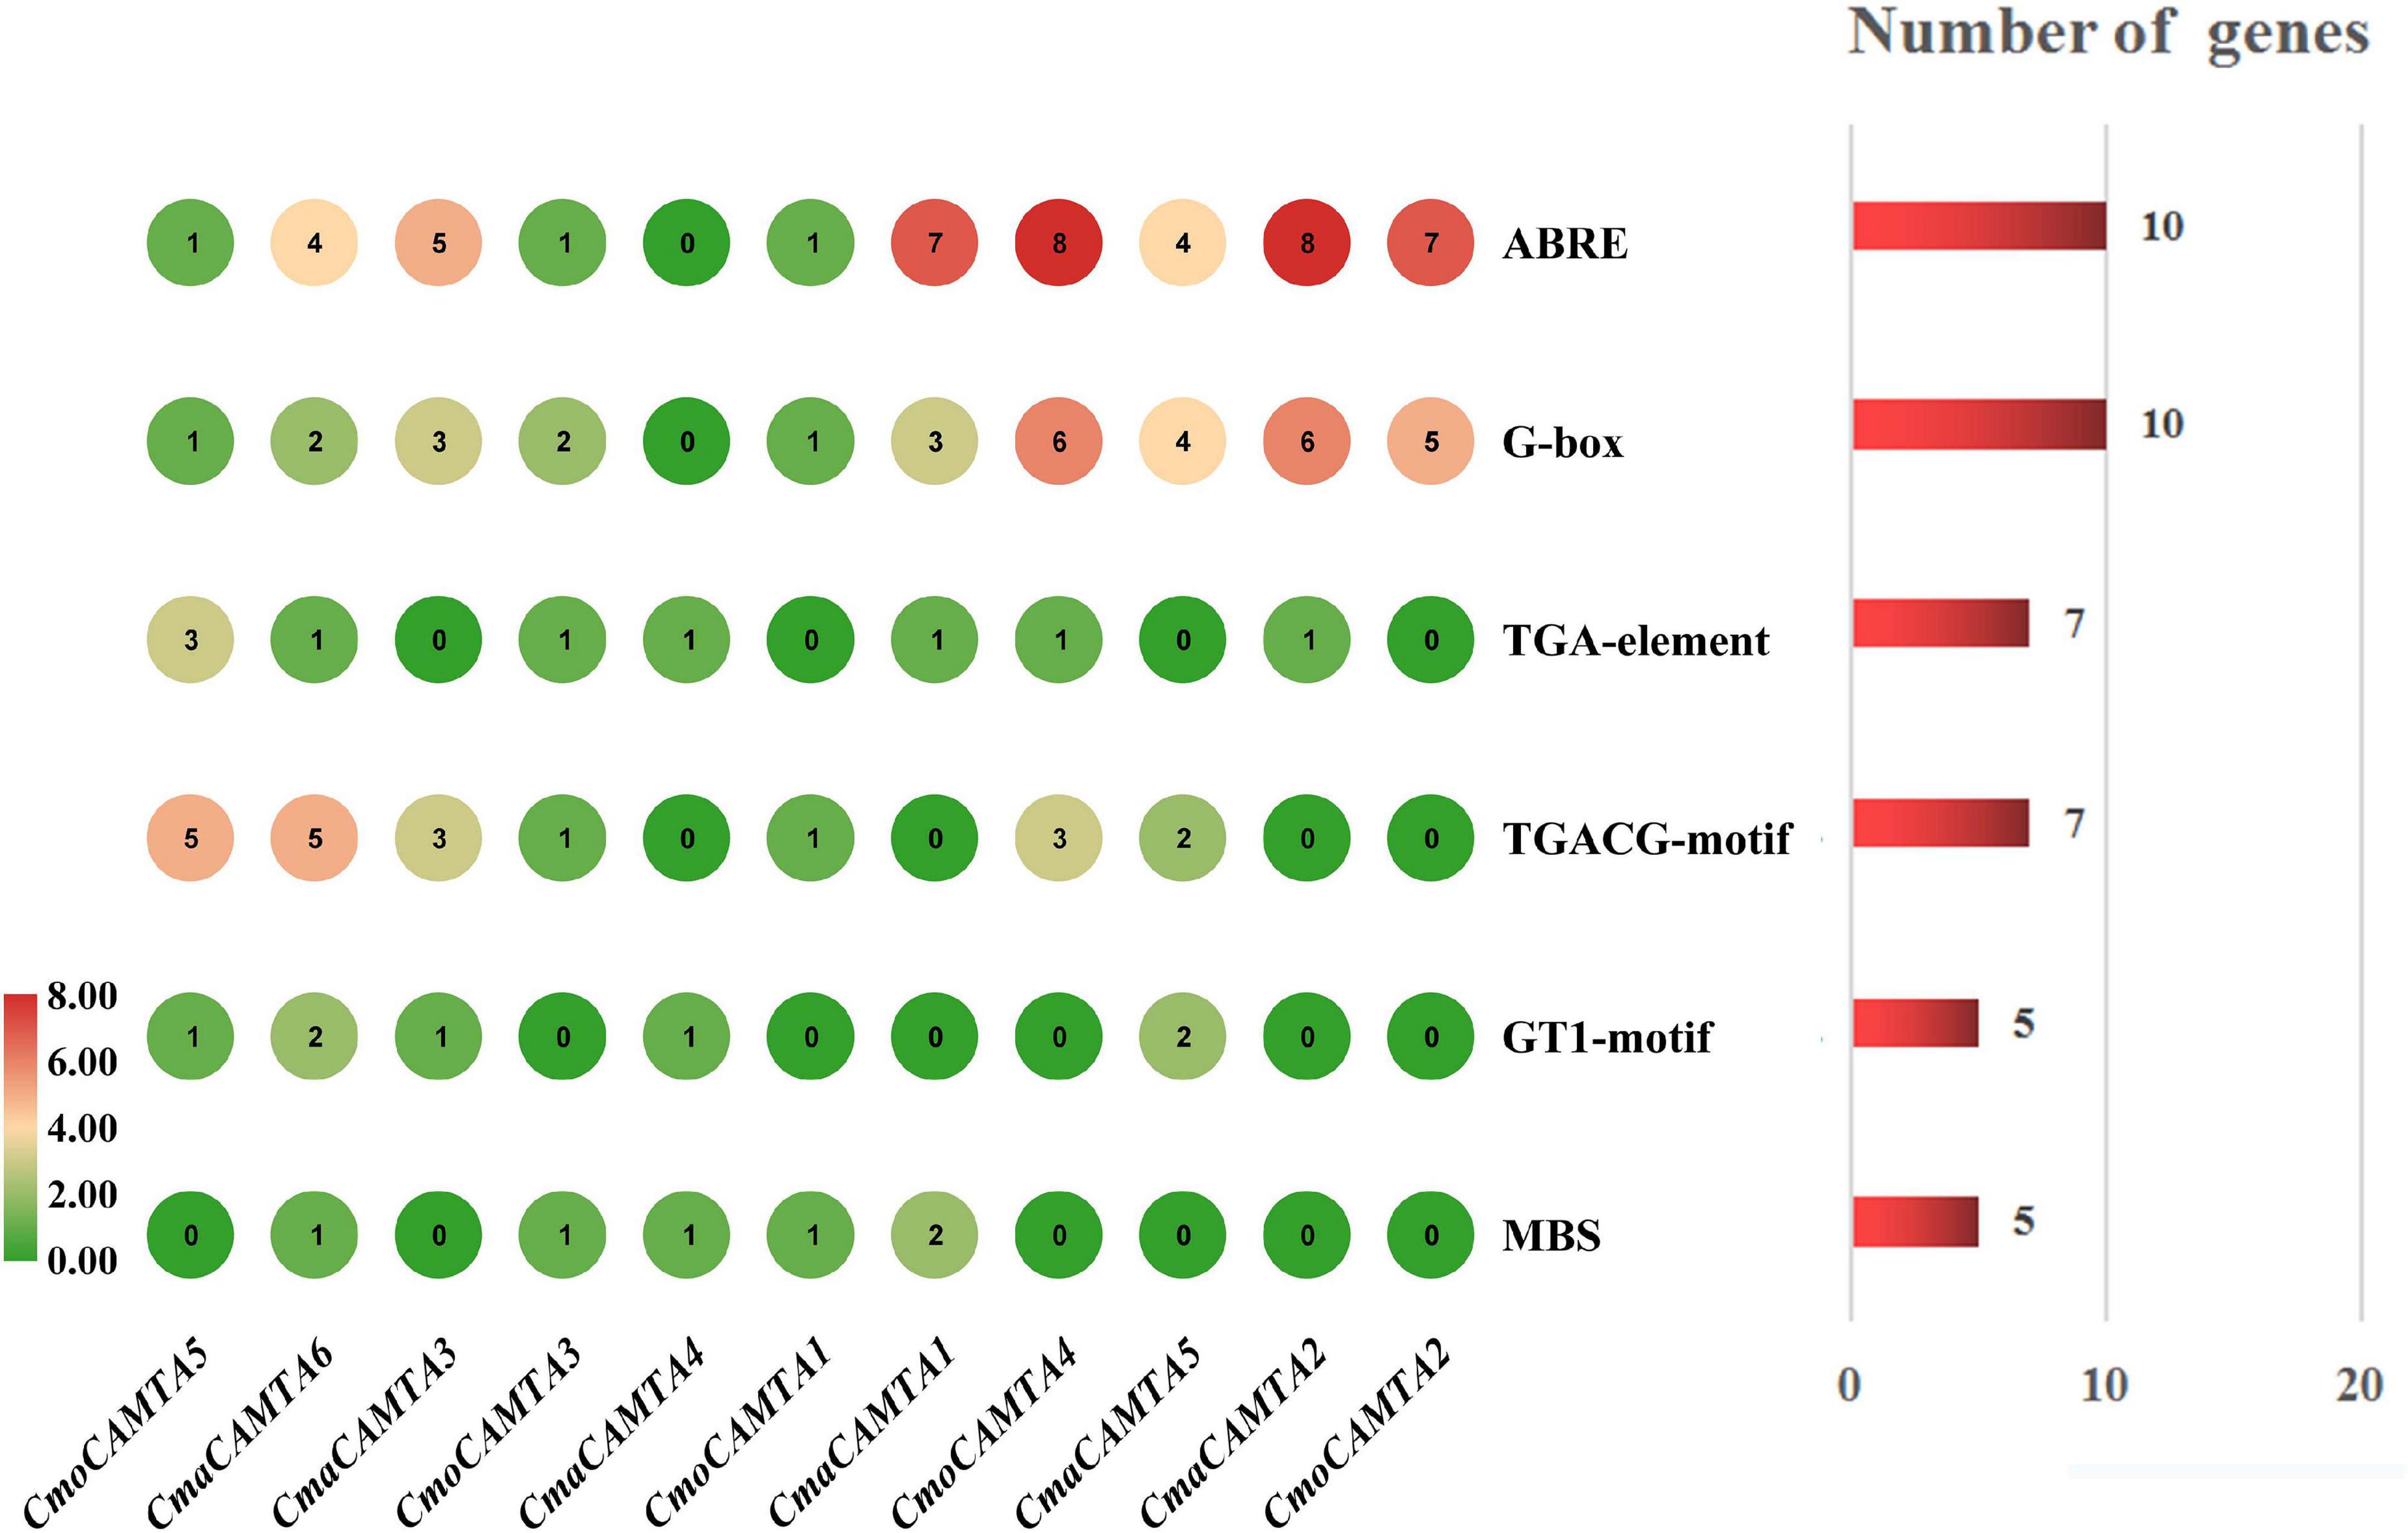
Figure 5. Cis-acting elements in five CmoCAMTAs and six CmaCAMTAs promoters. The cis-acting elements were predicted by the PlantCARE program and displayed with the Simple BioSequence Viewer in TBtools. The circle represented the number of specific cis-acting elements per gene. The chart and number on the right indicated the number of genes corresponding to the specific cis-acting element.
The Expression Profile of CmoCAMTAs and CmaCAMTAs in Different Tissues
By analyzing the expression profile of CmoCAMTAs and CmaCAMTAs in root, stem, leaf, and fruit, the results showed that except for CmaCAMTA4, other genes had higher expression profiles (Figure 6). In addition, the expression of all CmoCAMTAs and CmaCAMTAs in roots was higher than that in stem, leaf, and fruit tissues. Moreover, the expression level of CmaCAMTA4, CmaCAMTA1, CmaCAMTA5, CmaCAMTA3, CmaCAMTA6, and CmaCAMTA2 in fruits was higher than that in leaves, indicating that these genes may play important roles in fruits.
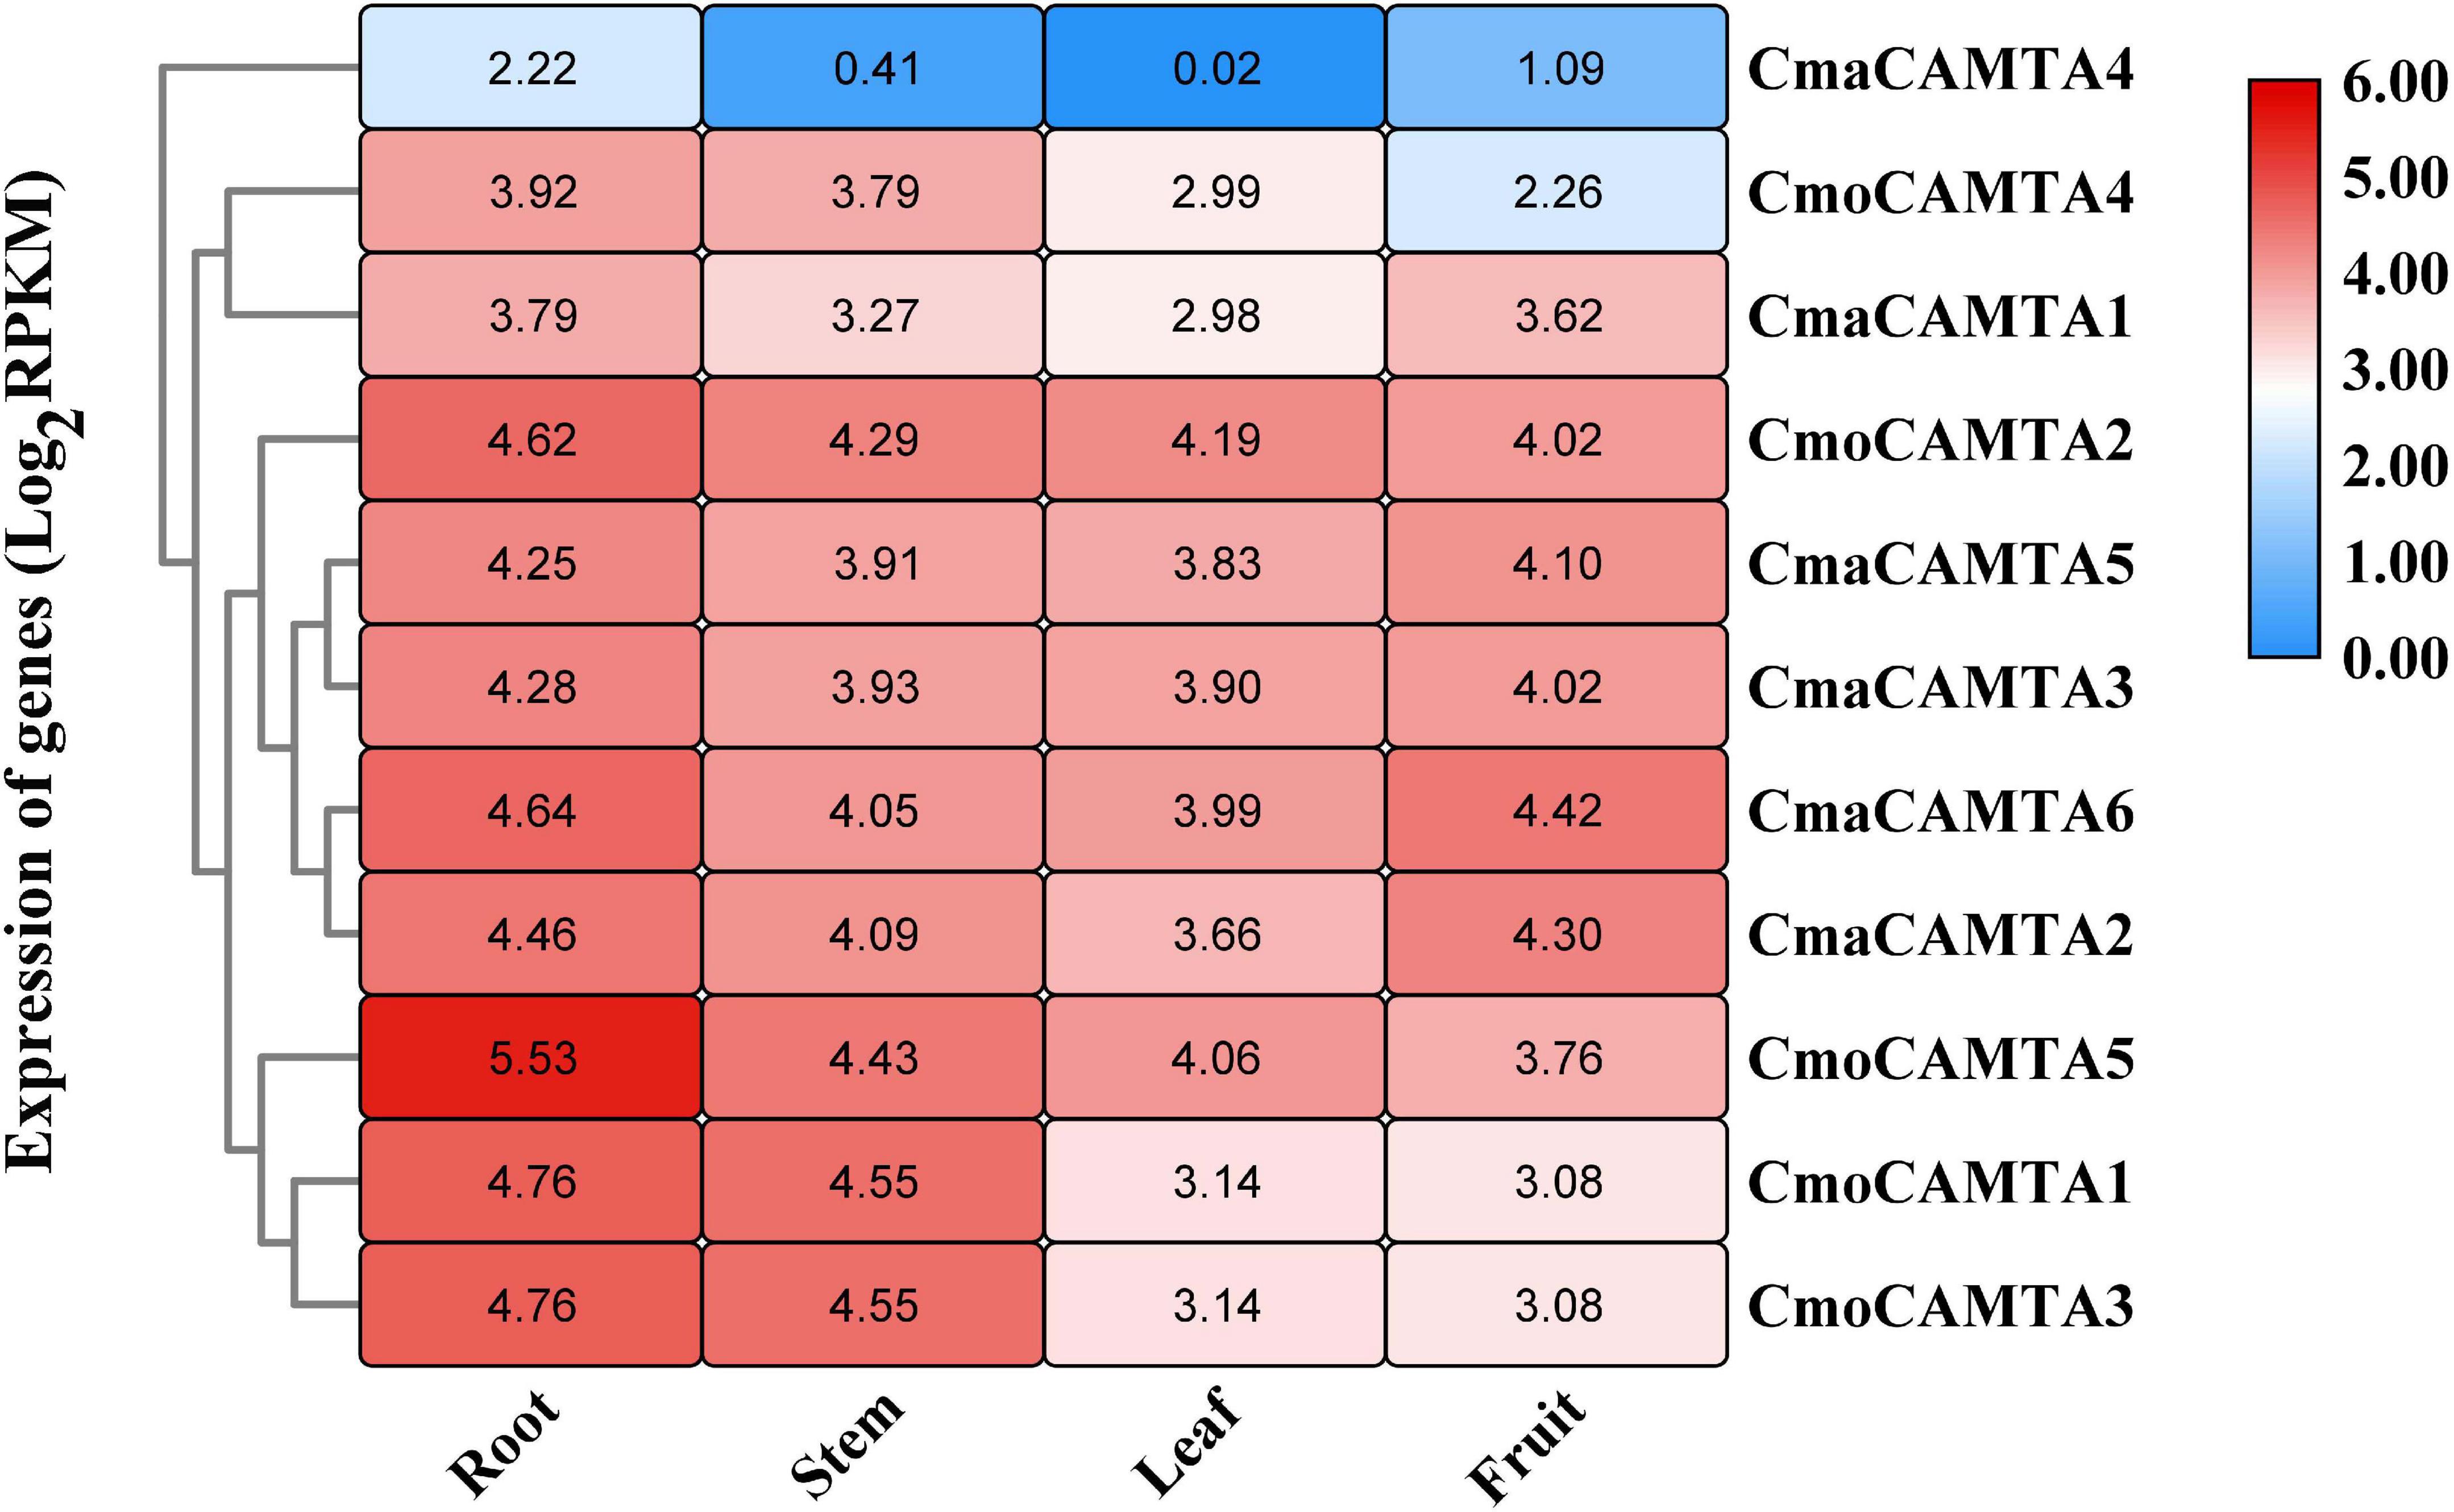
Figure 6. Heat map and hierarchical clustering of five CmoCAMTAs and six CmaCAMTAs in the root, stem, leaf, and fruit. All data and the bar on the right of the heat map were standardized by Log2 (RPKM).
Transcriptional Patterns of CmoCAMTAs and CmaCAMTAs in Leaf Vein and Leaf Mesophyll Under Salt Stress
In Cucurbita Linn. plants, to explore the response of CAMTAs in leaf veins and leaf mesophyll under salt stress, we analyzed them based on previous RNA-seq data. The results of the heat map and cluster analysis showed that all CmoCAMTAs in the leaf vein were significantly induced under salt stress, while all CmoCAMTAs in the leaf mesophyll were inhibited under salt stress (Figure 7A). In C. maxima (“N12”), the expression of these genes was similar to that in C. moschata (“N15”) (Figure 7B). Overall, the relative expression level of CAMTAs in C. maxima was higher than that in C. moschata. The expression levels of CmoCAMTA3 and CmaCAMTA4 were lower than those of other genes in the same cultivar (Figures 7A,B), so it was speculated that CmoCAMTA3 and CmaCAMTA4 downregulation may be conserved in Cucurbita species under salt stress.
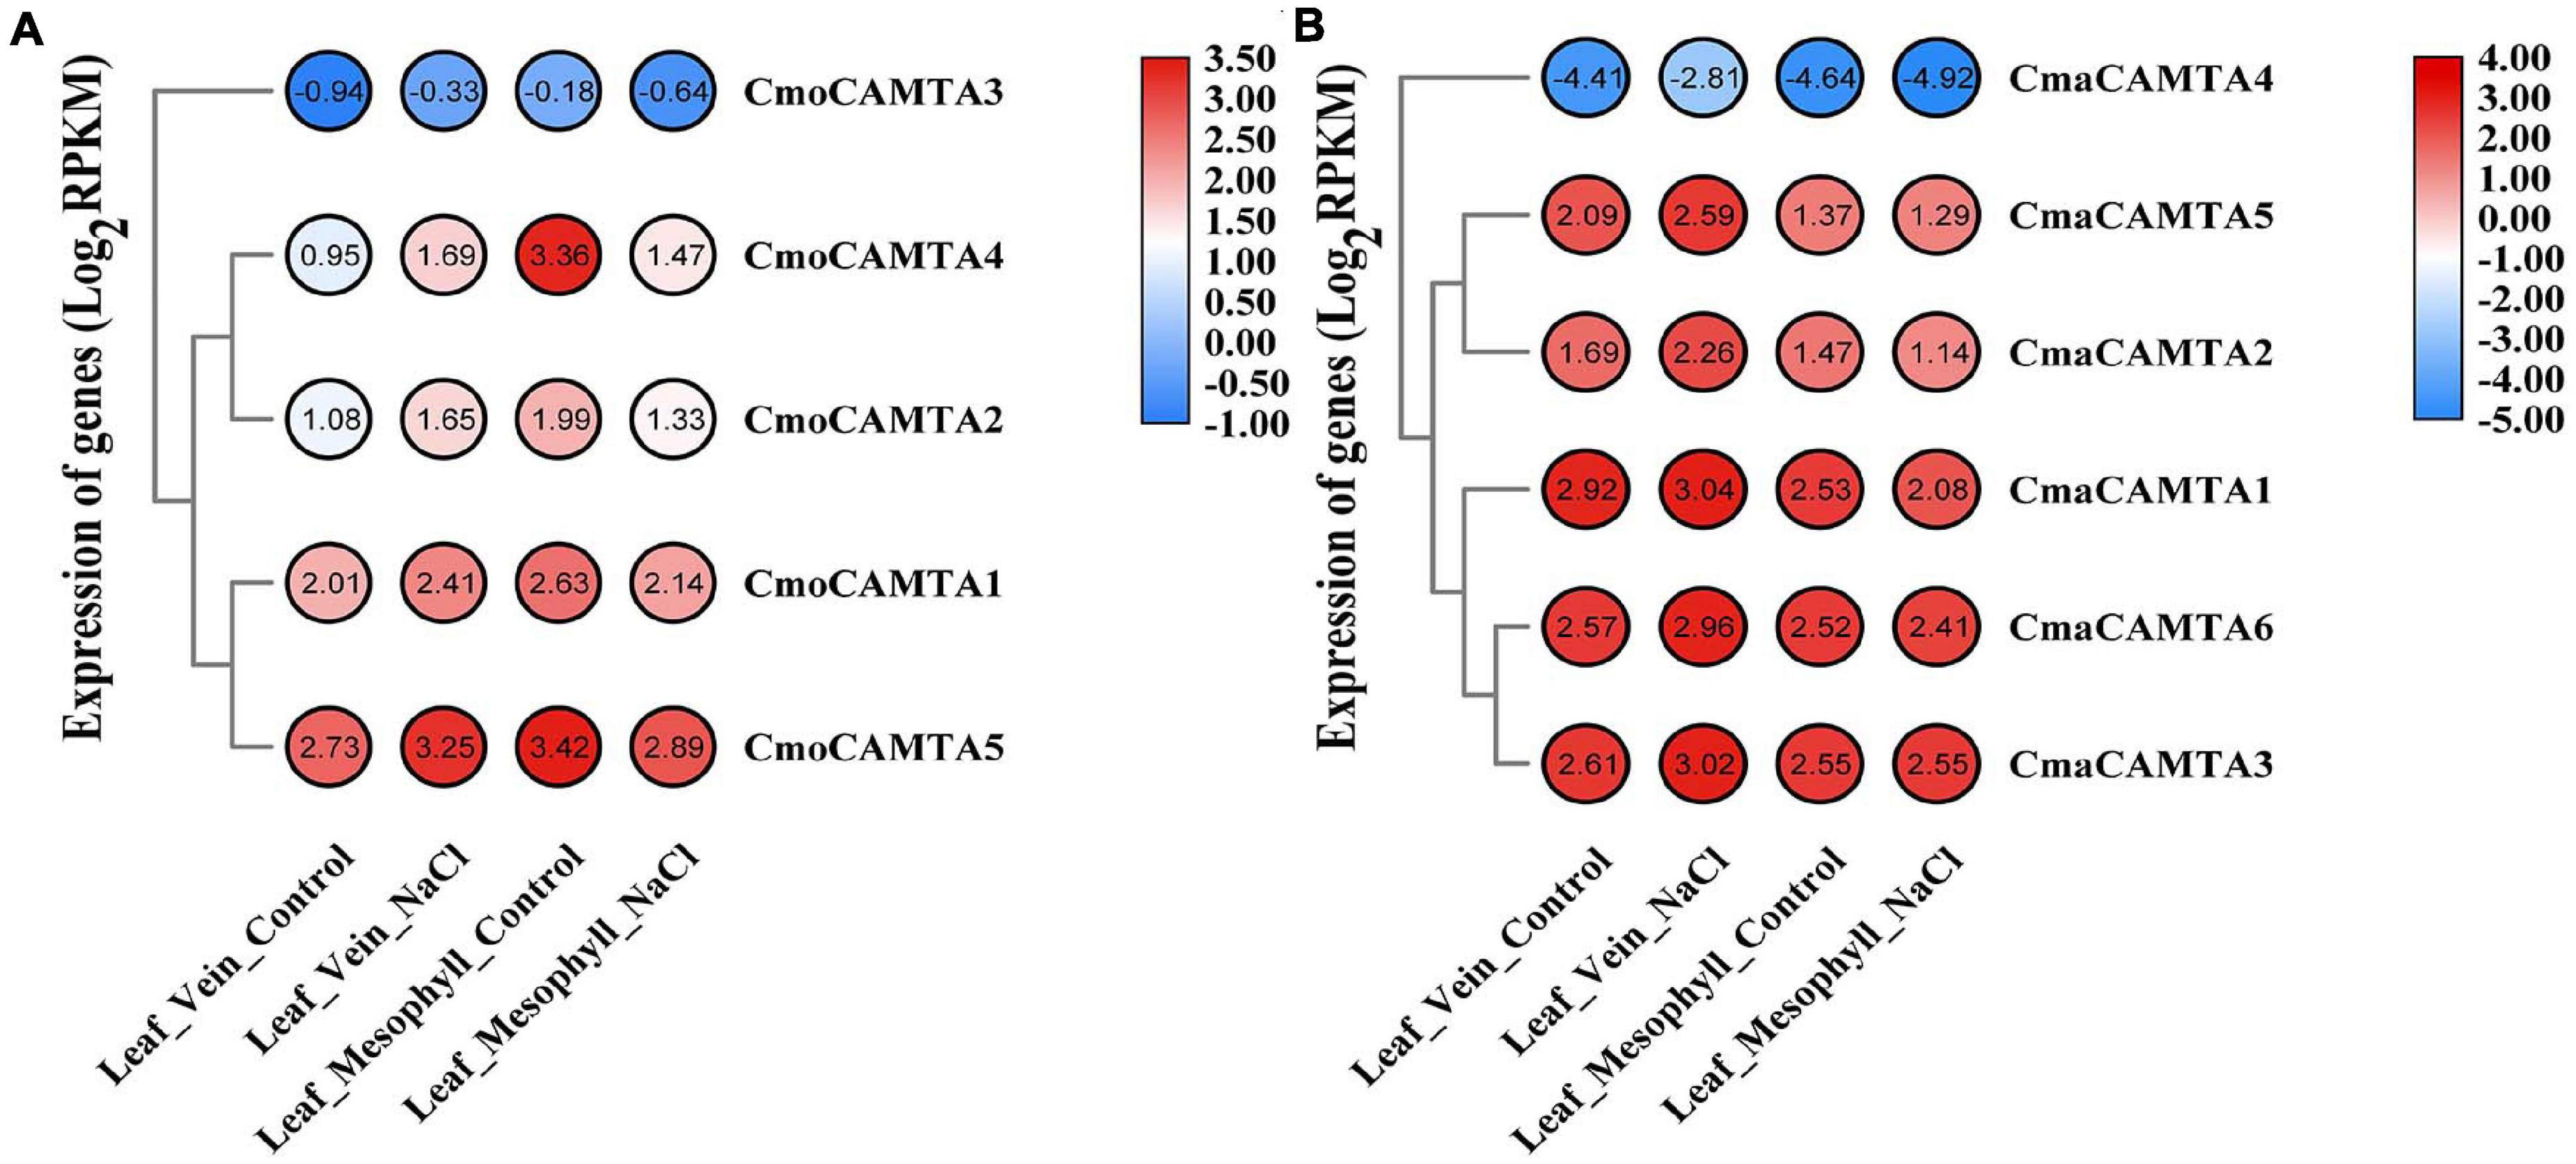
Figure 7. The expression level of the CAMTA genes in C. moschata (“N15”) and C. maxima (“N12”) under salt stress. (A) Heat map and hierarchical clustering of five CmoCAMTAs in leaf mesophyll and leaf vein under NaCl treatment and control conditions. (B) Heat map and hierarchical clustering of six CmaCAMTA genes in leaf mesophyll and leaf vein under NaCl treatment and control conditions. All data and the bar on the right of the heat map were standardized by Log2 (RPKM).
qRT-PCR Verification of CmoCAMTAs and CmaCAMTAs in Leaf Vein and Leaf Mesophyll Under Salt Stress
To further determine the response of CmoCAMTAs and CmaCAMTAs in leaf vein and leaf mesophyll under salt stress, we treated C. moschata “Baimi 9” and C. maxima “Beiguan” with a NaCl solution. After 12 h of salt stress, phenotypic observation showed no significant difference between the saline-treated seedlings and the control. However, in the leaf vein of “Baimi 9,” the results showed that after 12 h of NaCl treatment, the relative expression profiles of CmoCAMTA1, CmoCAMTA2, CmoCAMTA4, and CmoCAMTA5 in treated samples were 1.27–1.9 times that of the control samples (Figure 8A). Only CmoCAMTA3 had no significant difference under salt stress. In the leaf mesophyll of “Baimi 9,” the relative expression level of all CmoCAMTAs decreased to 30–57% of the control samples under salt stress (Figure 8B). In the vein of “Beiguan,” the expression levels of CmaCAMTA2 and CmaCAMTA4 under salt stress were 1.32 and 1.61 times that of the control, respectively (Figure 8C). The relative expression levels of CmaCAMTA1 and CmaCAMTA2 in the leaf mesophyll under salt stress decreased to 37–52% of the control treatment, while the relative expression levels of CmaCAMTA3 under salt stress were 1.52 times that of the control treatment (Figure 8D). Comprehensive analysis indicated that CmoCAMTA1, CmoCAMTA2, CmoCAMTA4, CmoCAMTA5, and CmaCAMTA2 played a key role in both veins and mesophyll, CmaCAMTA5 and CmaCAMTA6 did not respond to salt stress, and the remaining genes played a role only in veins or mesophyll.
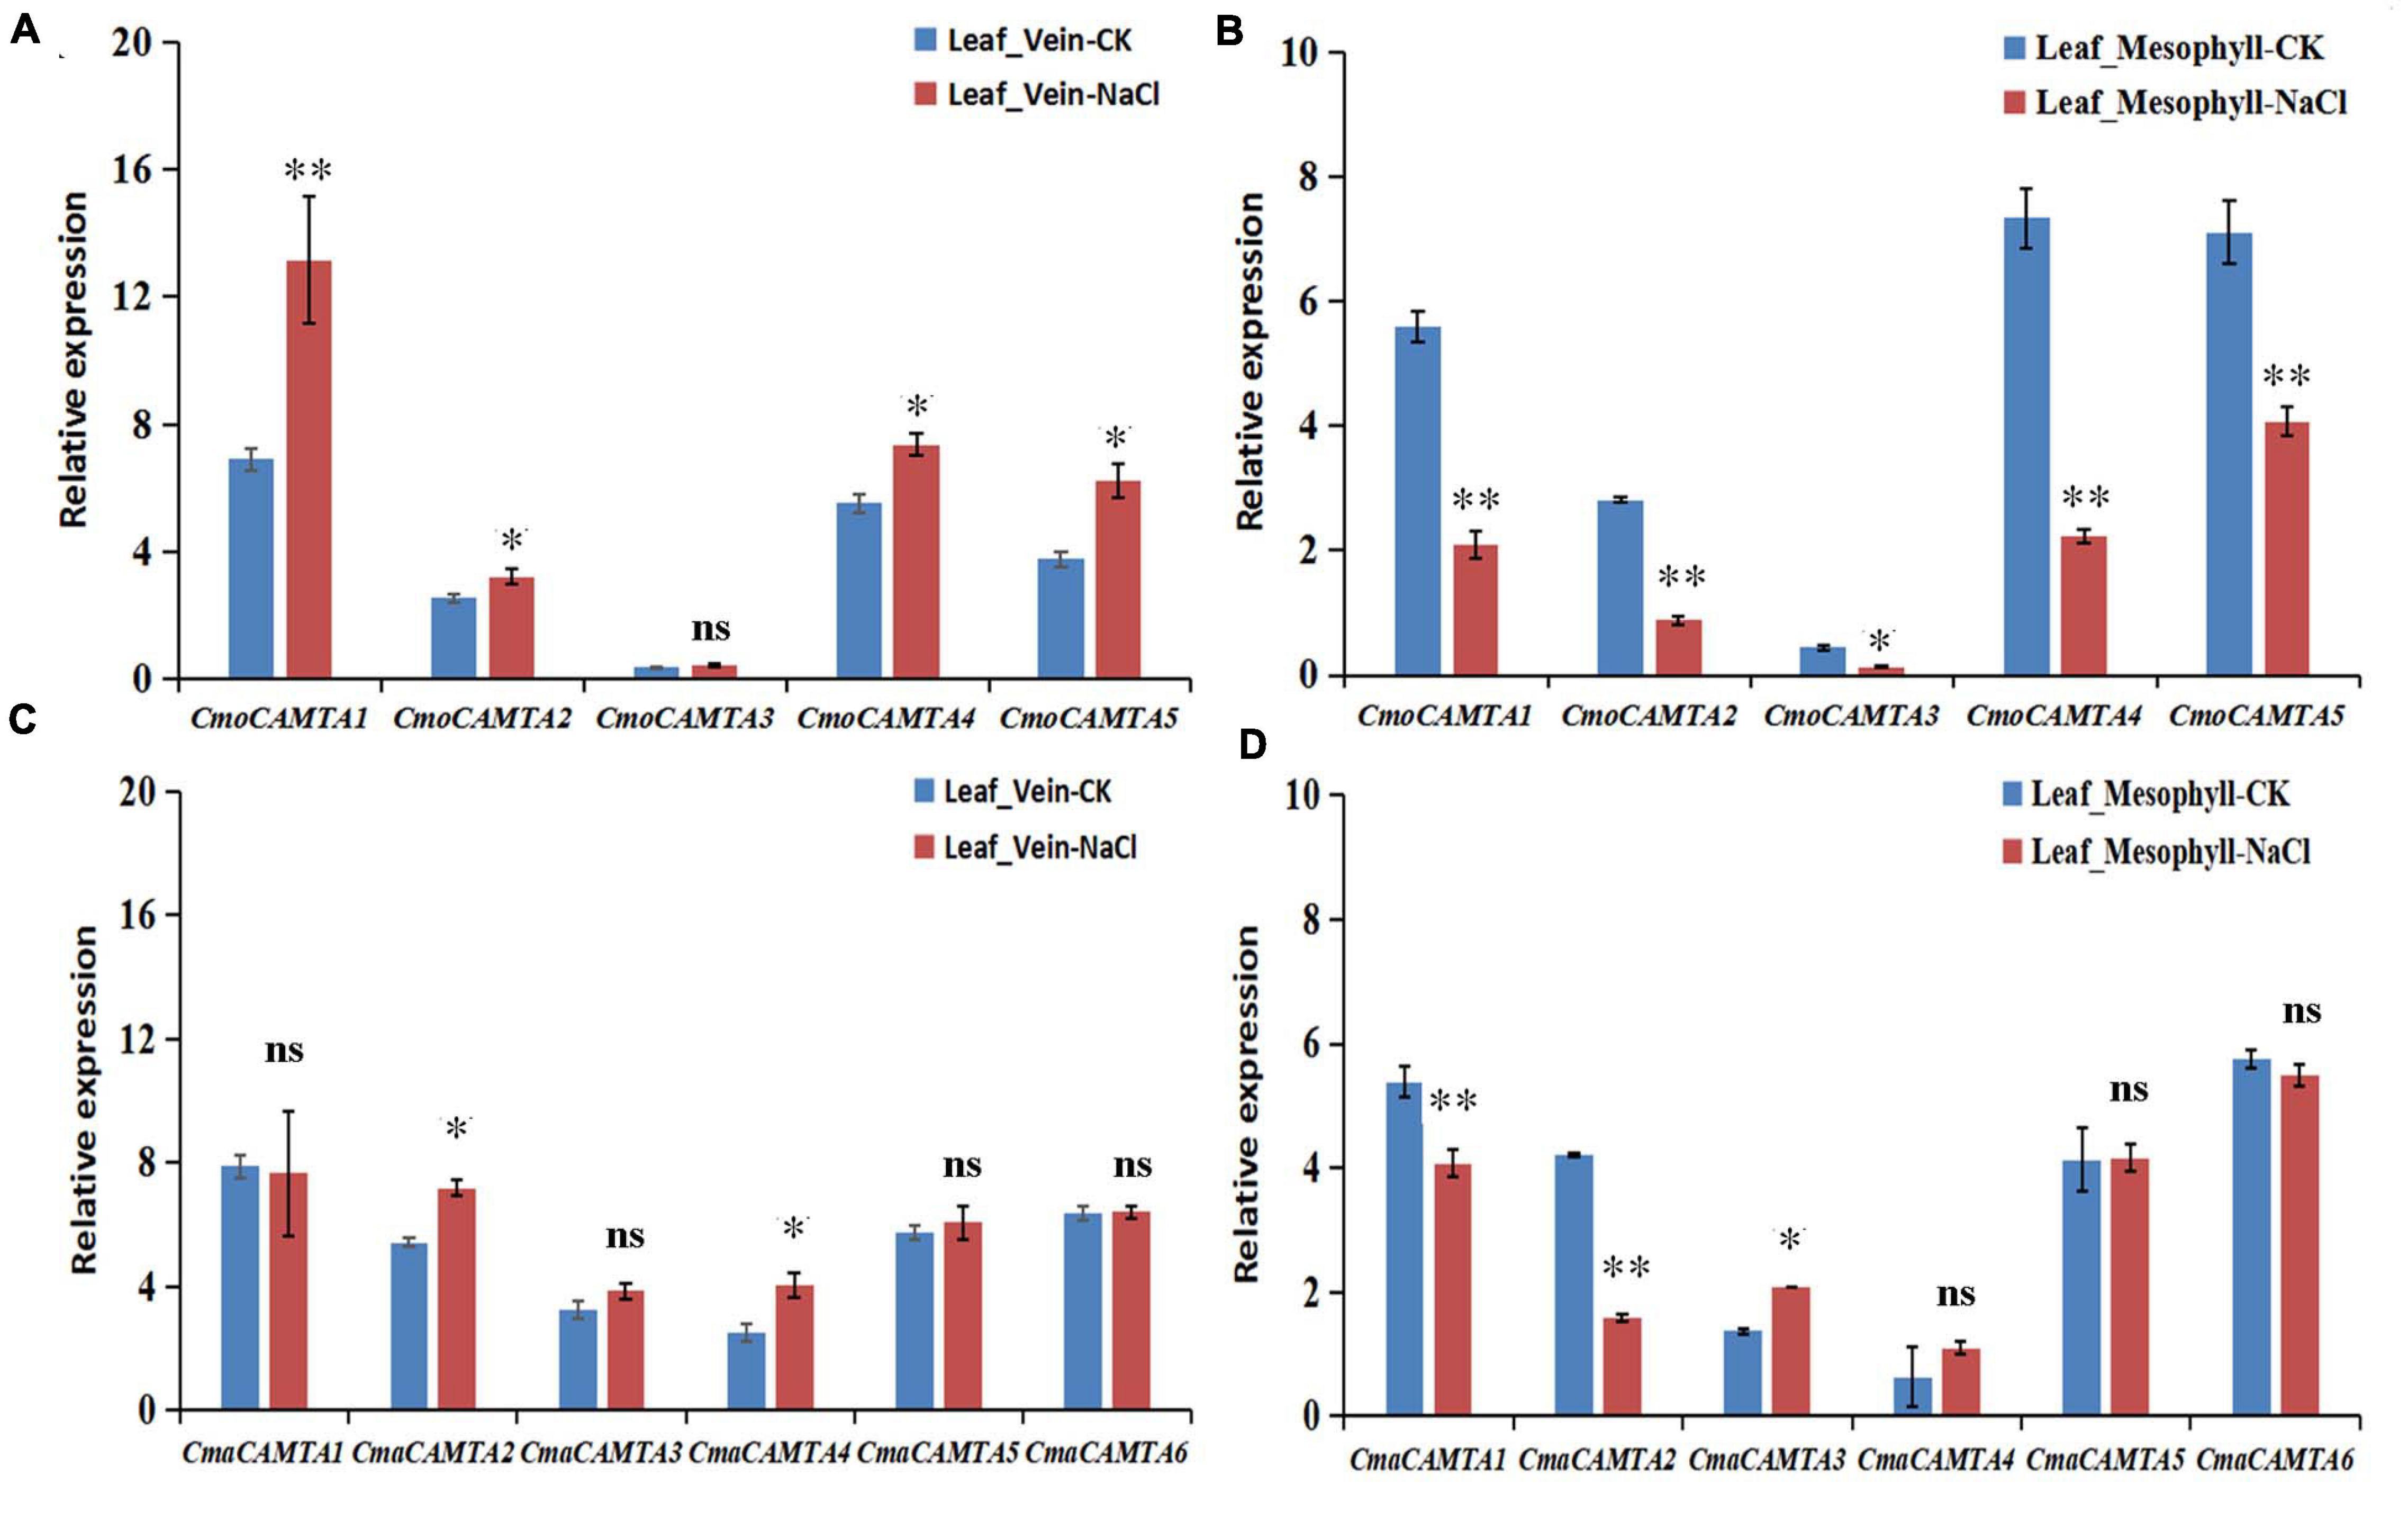
Figure 8. Expression level of the CAMTA genes in C. moschata (“Baimi 9”) and in C. maxima (“Beiguan”) under salt stress. (A) The expression level of the CAMTA genes in the leaf vein of “Baimi 9.” (B) The expression level of the CAMTA genes in the mesophyll of “Baimi 9.” (C) The expression level of the CAMTA genes in the leaf vein of “Beiguan.” (D) The expression level of the CAMTA genes in the mesophyll of “Beiguan.” The data were calculated by the 2–ΔΔCt method, and we used the reference gene (β-actin) to correct the expression level of the target gene. Errors bars indicated the standard errors of three biological replicates, and asterisks indicated that the expression levels of genes under CK and salt treatment were significantly different in between (∗P < 0.05, ∗∗P < 0.01).
Discussion
So far, six CAMTA genes from A. thaliana (Zhang et al., 2019), six CAMTA genes from Gossypium arboreum (Wei et al., 2017), seven CAMTA genes from Gossypium raimondii (Wei et al., 2017), nine CAMTA genes from Z. mays (Yue et al., 2015), 15 CAMTA genes from G. max (Wang et al., 2015), eight CAMTA genes from P. vulgaris L. (Büyük et al., 2019), five CAMTA genes from Musa acuminata (Meer et al., 2019), seven CAMTA genes from S. lycopersicum (Yang et al., 2012), and eight CAMTA genes from Brassica campestris ssp. chinensis (Hu et al., 2015) have been identified. In this study, a total of 11 predicted CAMTAs (five CmoCAMTAs and six CmaCAMTAs) in Cucurbita Linn. were identified using bioinformatics tools.
The identified CmoCAMTA and CmaCAMTA proteins ranged from 914 to 1,089 aa, which was similar to the CAMTA proteins from other different plant species (Wei et al., 2017; Zhang et al., 2019). Except for CmoCAMTA4, CmoCAMTA2, CmaCAMTA5, and CmaCAMTA4, which have higher theoretical isoelectric points (7.21–7.71), the remaining CAMTA proteins all had theoretical isoelectric points of less than 7 (Table 1), indicating that these proteins may be positively charged at a physiological pH. Subcellular localization prediction analysis showed that all CmoCAMTAs and CmaCAMTAs were located in the nucleus, which was consistent with the characteristics of TFs.
To evaluate the evolutionary relationship of CAMTA gene families in Cucurbita Linn., a total of five CmoCAMTA, six CmaCAMTA, and six AtCAMTA proteins were analyzed. The phylogeny tree showed that these genes were assigned to three subfamilies (Subfamilies I, II, and III) (Figure 1), which was similar to the report of A. thaliana CAMTA protein (Zhang et al., 2019). The phylogeny relationships showed that the same subfamily contained CAMTAs from C. moschata, C. maxima, and A. thaliana, indicating that they may come from the same ancestor. In addition, the homology relationship between C. moschata CAMTAs and C. maxima CAMTAs was closer than that of A. thaliana (Figure 1). Based on the phylogenetic tree of CAMTA family genes in C. moschata and C. moschata, five orthologous gene pairs were identified, and they were CmoCAMTA5_CmaCAMTA6, CmoCAMTA3_CmaCAMTA4, CmoCAMTA1_CmaCAMTA1, CmoCAMTA4_CmaCAMTA5, and CmoCAMTA2_CmaCAMTA2.
Figure 2 reflected the gene structure of CAMTAs in C. moschata and C. maxima; the exon number of CAMTAs in Cucurbita Linn. was between 12 and 14, which was similar to the exon number of CAMTAs in G. max, and Z. mays (Wang et al., 2015; Yue et al., 2015). It showed that CAMTAs have important conservation among plant species. Orthologous gene pairs usually contain similar intron–exon structures, such as the orthologous gene pair CmoCAMTA4_CmaCAMTA5 and CmoCAMTA2_CmaCAMTA2, which contained the same number of exons and introns, respectively (Figure 2). Structural analysis showed that all CAMTAs of C. moschata and C. maxima contained ankyrin repeats, IQ motifs, IPT/TIG domain, and CG-1 DNA-binding domain (Figure 3B and Supplementary Table 2). This result is consistent with previous analysis in the P. vulgaris (Büyük et al., 2019), Z. mays L. (Yue et al., 2015), and Fragaria ananassa (Leng et al., 2015) CAMTA gene families. According to previous studies, CAMTAs can be divided into two groups according to the existence of the TIG domain (Rahman et al., 2016b). Based on this classification, Cucurbita Linn. CAMTA protein belongs to a class containing TIG, while A. thaliana belongs to plants containing non-TIG CAMTA protein (Rahman et al., 2016b).
Chromosome location of CAMTA in Cucurbita Linn. showed that 11 CAMTA genes were unevenly distributed on chromosomes and that three duplicated gene pairs have fragment duplication events, which were known to have occurred between 8.62 and 9.64 MYA. In addition, the ratio of Ka to Ks of all duplicated gene pairs were less than 1 (Supplementary Table 4), indicating that these gene pairs have undergone purification selection. Cis-acting element analysis showed that the duplicated genes pairs CmoCAMTA4_CmoCAMTA2 and CmaCAMTA5_CmaCAMTA2 all contain G-box and ABRE cis-acting elements, so it was speculated that these two duplicated gene pairs may have similar functions.
The expression level of CmaCAMTA4 was lower than that of other genes, which indicated that the expression of CmaCAMTA4 was limited in time and space. Furthermore, the duplicated genes CmaCAMTA6_CmaCAMTA3 and CmaCAMTA5_CmaCAMTA2 contained similar tissue expression patterns (Figure 6), indicating that these two duplicated gene pairs may have similar functions.
The promoter sequence obtained from the Cucurbit genomics database was extracted to detect the cis-acting elements of CAMTA genes in Cucurbita Linn. As a result, many cis-acting elements were found, including ABRE, G-box, TGA-element, TGACG-motif, GT1-motif, and MBS (Figure 5). Related studies showed that ABRE, G-box, MBS, GT1-motif, TGACG-motif, and TGA-element had regulatory effects under salt stress (Yamniuk and Vogel, 2004; Saeediazar et al., 2014). Therefore, we hypothesized that CAMTAs from C. moschata and C. maxima played key roles under salt stress. This has a theoretical basis for further studying the function and mechanism of salt-resistant genes.
Studies on CAMTAs involved in salt stress response have also been reported in other species. In citrus, three CsCAMTA (CsCAMTA1, CsCAMTA3, and CsCAMTA5) genes responded significantly under NaCl treatment (Ouyang et al., 2019). The expression level of CsCAMTA1 gradually decreased under salt stress and reached the peak at 24 h, which was 3.5 times lower than that of the control group. However, the expression of CsCAMTA5 and CsCAMTA3 decreased significantly only 24 h after treatment. In F. ananassa, the expression of FaCAMTA1 and FaCAMTA4 increased at 2 h and decreased at 12 h. The expression level of FaCAMTA3 was increasing under salt stress (Leng et al., 2015). Based on the RNA-seq data (BioProject: PRJNA464060) of Cucurbita Linn. leaves under salt stress (Niu et al., 2018), the transcription profiles of CmoCAMTAs and CmaCAMTAs in the leaf vein and leaf mesophyll were also analyzed, and we found that the transcription level of CmoCAMTA3 and CmaCAMTA4 was lower than that of other genes. Considering that CmoCAMTA3 and CmaCAMTA4 are orthologs, maybe this is the reason why they have the same low expression. At the same time, most of CmoCAMTAs and CmaCAMTAs played important roles in the vein under salt stress (Figure 7).
To further verify the role of CmoCAMTAs and CmaCAMTAs in leaf veins and leaf mesophyll under salt stress, we used qRT-PCR technology for further verification (Figure 8). In the leaf vein of “Baimi 9,” except from CmoCAMTA3, the CmoCAMTAs were significantly upregulated by salt stress (Figure 8A). In the mesophyll of “Baimi 9,” all CmoCAMTAs were significantly inhibited under salt stress (Figure 8B). For “Beiguan,” the expressions of CmaCAMTA2 and CmaCAMTA4 in leaf veins were significantly upregulated under salt stress, while the expressions of other genes showed no significant differences (Figure 8C). In mesophyll, the expression of CmaCAMTA1 and CmaCAMTA2 was significantly decreased under salt stress, while the expression of CmaCAMTA3 was significantly increased under salt stress, while the expression of the remaining genes showed no significant difference (Figure 8D). This result was consistent to the RNA-seq result, and they showed that CAMTAs had different responses to salt stress in the leaf vein and leaf mesophyll. According to the study of Niu et al. (2018), we speculate that this mechanism may be associated with the ability of the tolerant species to accumulate more Na+ in the leaf vein and to retain more K+ in the leaf mesophyll. Through the analysis of the expression level of CmoCAMTAs and CmaCAMTAs genes under salt stress in leaf veins and leaf mesophyll, it provides theoretical basis for further exploring the function of CmoCAMTAs and CmaCAMTAs genes and clarifying the molecular mechanism of these genes and is also of great guiding significance for the cultivation of new varieties of salt resistance.
Conclusion
In summary, we identified five CmoCAMTAs and six CmaCAMTAs in the Cucurbita genome according to a comprehensive analysis and provided the genetic information of gene distribution, gene structure, protein structure, and evolutionary relationship. We also examined the expression patterns of 11 CAMTAs in different tissues. Meanwhile, we explored the responses of five CmoCAMTAs and six CmaCAMTAs to salt stress, and it is found that these genes offer fundamental clues about their involvement in salt stress.
Data Availability Statement
The datasets presented in this study can be found in online repositories. The names of the repository/repositories and accession number(s) can be found in the article/Supplementary Material.
Author Contributions
CS conceived, designed, and analyzed the data. CS and JY wrote the manuscript. BC and XL identified Cucurbitaceae CAMTAs and analyzed the gene structure. CS and XL studied chromosome distribution and gene duplication of Cucurbitaceae CAMTAs. JY supervised the research. CS, AS, and JY revised the manuscript. All authors have read and approved the manuscript.
Funding
This work was mainly funded by the Scientific Research Foundation for High-level Talent (103010620001/015 and 2017034), the Major Science and Technology Projects in Henan Province (Innovation Demonstration Projects) (201111110600), and the Major Science and Technology Projects in Henan Province (Major Public Welfare Projects) (201300111300). The funding body has no role in the study design, data collection, analysis, and manuscript writing.
Conflict of Interest
The authors declare that the research was conducted in the absence of any commercial or financial relationships that could be construed as a potential conflict of interest.
Supplementary Material
The Supplementary Material for this article can be found online at: https://www.frontiersin.org/articles/10.3389/fgene.2021.647339/full#supplementary-material
Supplementary Figure 1 | Detailed information about the LOGOs of the motifs from CmoCAMTA and CmaCAMTA proteins. They were also obtained with MEME.
Supplementary Table 1 | The information on coding sequence and protein sequence of CmoCAMTAs and CmaCAMTAs.
Supplementary Table 2 | Prediction of the conserved domain position of CmoCAMTAs and CmaCAMTAs.
Supplementary Table 3 | List of primer sequences used for the qRT-PCR analysis of CmoCAMTA and CmaCAMTA genes.
Supplementary Table 4 | Ka/Ks and estimated divergence time for duplicated gene pairs from CmoCAMTA and CmaCAMTA.
Supplementary Table 5 | The position and sequence prediction of salt-related cis-acting elements in CmoCAMTA and CmaCAMTA gene promoters.
Footnotes
- ^ http://cucurbitgenomics.org/
- ^ http://www.ncbi.nlm.nih.gov/
- ^ https://www.ncbi.nlm.nih.gov/Structure/cdd/wrpsb.cgi
- ^ http://smart.embl-heidelberg.de/
- ^ http://web.expasy.org/tools/
- ^ http://gsds.cbi.Pku.edu.cn/
- ^ http://meme-suite.org/
- ^ https://www.ncbi.nlm.nih.gov/Structure/bwrpsb/bwrpsb.cgi
- ^ http://visualization.ritchielab.psu.edu/home/index
- ^ http://bioinformatics.psb.ugent.be/webtools/plantcare/html/
References
Bailey, T. L., and Elkan, C. (1995). The value of prior knowledge in discovering motifs with MEME. Proc. Int. Conf. Intell. Syst. Mol. Biol. 3, 21–29.
Blanc, G., and Wolfe, K. H. (2004). Widespread paleopolyploidy in model plant species inferred from age distributions of duplicate genes. Plant Cell 16, 1667–1678. doi: 10.1105/tpc.021345
Bouché, N., Scharlat, A., Snedden, W., Bouchez, D., and Fromm, H. (2002). A novel family of calmodulin-bind-ing transcription activators in multicellular organisms. J. Biol. Chem. 277, 21851–21861. doi: 10.1074/jbc.M200268200
Büyük, I., Inal, B., Ilhan, E., Tanriseven, M., Aras, S., and Erayman, M. (2016). Genome-wide identification of salinity responsive HSP70s in common bean. Mol. Biol. Rep. 43, 1–16. doi: 10.1007/s11033-016-4057-0
Büyük, Ý, İlhan, E., Sener, D., Ozsoy, A. U., and Aras, S. (2019). Genome-wide identification of CAMTA gene family members in Phaseolus vulgaris L. and their expression profiling during salt stress. Mol. Biol. Rep. 46, 2721–2732. doi: 10.1007/s11033-019-04716-8
Chen, C. J., Chen, H., Zhang, Y., Thomas, H. R., Frank, M. H., and Xia, R. (2020). TBtools: an integrative toolkit developed for interactive analyses of big biological data. Mol. Plant 13, 1194–1202. doi: 10.1016/j.molp.2020.06.009
Chou, K. C., and Shen, H. B. (2010). Plant-mPLoc: a top-down strategy to augment the power for predicting plant protein subcellular localization. PLoS One 5:e11335. doi: 10.1371/journal.pone.0011335
Doherty, C. J., Van Buskirk, H. A., Myers, S. J., and Thomashow, M. F. (2009). Roles for Arabidopsis CAMTA transcription factors in cold-regulated gene expression and freezing tolerance. Plant Cell 21, 972–984. doi: 10.1105/tpc.108.063958
Du, L., Ali, G. S., Simons, K. A., Hou, J., Yang, T., Reddy, A. S. N., et al. (2009). Ca2+/calmodulin regulates salicylic-acid-mediated plant immunity. Nature 457, 1154–1158. doi: 10.1038/nature07612
Emanuelsson, O., Nielsen, H., Brunak, S., and Heijne, G. (2000). Predicting subcellular localization of proteins based on their N-terminal amino acid sequence. J. Mol. Biol. 300, 1005–1016. doi: 10.1006/jmbi.2000.3903
Finkler, A., Asherypadan, R., and Fromm, H. (2007). CAMTAs: calmodulin-binding transcription activators from plants to human. FEBS Lett. 581, 3893–3898. doi: 10.1016/j.febslet.2007.07.051
Henz, S., Nitzsche, R., Kieling, M., Aganovic, K., and Hertel, C. (2020). Surrogate for electron beam inactivation of salmonella on pumpkin seeds and flax seeds. J. Food Prot. 83, 1775–1781. doi: 10.4315/JFP-20-088
Hu, R., Wang, Z., Wu, P., Tang, J., and Hou, X. L. (2015). Identification and abiotic stress analysis of calmodulin-binding transcription activator/signal responsive genes in non-heading Chinese cabbage (Brassica campestris ssp. Chinensis Makino). Plant Omics 8, 141–147.
Ibeh, N. I., Okungbowa, M. A., Ekrakena, T., and Ibeh, I. N. (2020). Biokinetics and phyto-toxicity of pumpkin leaves extract on human erythrocytes, “an in vitro study”. Asian J. Biol. Ences. 13, 134–138. doi: 10.3923/ajbs.2020.134.138
İlhan, E., and Büyük, İ, and Inal, B. (2018). Transcriptome–scale characterization of salt responsive bean TCP transcription factors. Gene 642, 64–73. doi: 10.1016/j.gene.2017.11.021
Inal, B., Büyük, I., Ilhan, E., and Aras, S. (2017). Genome-wide analysis of Phaseolus vulgaris C2C2-YABBY transcription factors under salt stress conditions. Biotechnology 7:302. doi: 10.1007/s13205-017-0933-0
Kaplan, B., Davydov, O., Knight, H., Galon, Y., Knight, M. R., Fluhr, R., et al. (2006). Rapid transcriptome changes induced by cytosolic Ca2+ transients reveal ABRE-related sequences as Ca2+-responsive cis-elements in Arabidopsis. Plant Cell 18, 2733–2748. doi: 10.1105/tpc.106.042713
Leng, X. P., Han, J., Wang, X. M., Zhao, M. Z., Sun, X., Wang, C., et al. (2015). Characterization of a calmodulin-binding transcription factor from strawberry (Fragaria × ananassa). Plant Genome 8:elantgenome2014.08.0039. doi: 10.3835/plantgenome2014.08.0039
Li, Z., Jiang, H. Y., Zhou, L. Y., Deng, L., Lin, Y. X., Peng, X. J., et al. (2014). Molecular evolution of the HD-ZIP I gene family in legume genomes. Gene 533, 218–228. doi: 10.1016/j.gene.2013.09.084
Livak, K. J., and Schmittgen, T. D. (2001). Analysis of relative gene expression data using real-time quantitative PCR and the 2–Δ Δ CT method. Methods 25, 402–408. doi: 10.1006/meth.2001.1262
Marchler-Bauer, A., Bo, Y., Han, L., He, J., Lanczycki, C., Lu, S., et al. (2017). CDD/SPARCLE: functional classification of proteins via subfamily domain architectures. Nucleic Acids Res. 45, D200–D203. doi: 10.1093/nar/gkw1129
Meer, L., Mumtaz, S., Labbo, A. M., Khan, M. J., and Sadiq, I. (2019). Genome-wide identification and expression analysis of calmodulin-binding transcription activator genes in banana under drought stress. Sci. Hortic. 244, 10–14. doi: 10.1016/j.scienta.2018.09.022
Min, C. K., Chung, W. S., Yun, D. J., and Cho, M. J. (2009). Calcium and calmodulin-mediated regulation of gene expression in plants. Mol. Plant 2, 13–21. doi: 10.1093/mp/ssn091
Nie, H., Zhao, C., Wu, G., Wu, Y., Chen, Y., and Tang, D. (2012). SR1, a calmodulin-binding transcription factor, modulates plant defense and ethylene-induced senescence by directly regulating NDR1 and EIN3. Plant Physiol. 158, 1847–1859. doi: 10.2307/41496324
Niu, M. L., Xie, J. J., Chen, C., Cao, H. S., Sun, J. Y., Kong, Q. S., et al. (2018). An early ABA-induced stomatal closure, Na+ sequestration in leaf vein and K+ retention in mesophyll confer salt tissue tolerance in Cucurbita species. J. Exp. Bot. 69, 4945–4960. doi: 10.1093/jxb/ery251
Ouyang, Z. G., Mi, L. F., Duan, H. H., Hu, W., Chen, J. M., Peng, T., et al. (2019). Differential expressions of citrus CAMTAs during fruit development and responses to abiotic stresses. Biol. Plantarum 63, 354–364. doi: 10.32615/bp.2019.041
Pandey, N., Ranjan, A., Pant, P., Tripathi, R. K., Ateek, F., Pandey, H. P., et al. (2013). CAMTA 1 regulates drought responses in Arabidopsis thaliana. BMC Genomics 14:216. doi: 10.1186/1471-2164-14-216
Pant, P., Iqbal, Z., Pandey, B. K., and Sawant, S. V. (2018). Genome-wide comparative and evolutionary analysis of calmodulin-binding transcription activator (CAMTA) family in Gossypium species. Sci. Rep. 8:5573. doi: 10.1038/s41598-018-23846-w
Rahman, H., Xu, Y. P., Zhang, X. R., and Cai, X. Z. (2016a). Brassica napus genome possesses extraordinary high number of CAMTA genes and CAMTA3 contributes to pamp triggered immunity and resistance to Sclerotinia sclerotiorum. Front. Plant Sci. 7:581. doi: 10.3389/fpls.2016.00581
Rahman, H., Yang, J., Xu, Y. P., Munyampundu, J. P., and Cai, X. Z. (2016b). Phylogeny of plant CAMTAs and role of AtCAMTAs in nonhost resistance to xanthomonas oryzae pv. oryzae. Front. Plant Sci. 7:177. doi: 10.3389/fpls.2016.00177
Saeediazar, S., Najafi-Zarrini, H., Ranjbar, G. A., and Heidari, P. (2014). Identification and study of cis-regulatory elements and phylogenetic relationship of TaSRG and other salt response genes. J. Bio. Env. Sci. 5, 1–5.
Shangguan, L., Wang, X., Leng, X., Liu, D., Ren, G., Tao, R., et al. (2014). Identification and bioinformatic analysis of signal responsive/calmodulin-binding transcription activators gene models in Vitis Vinifera. Mol. Biol. Rep. 41, 2937–2949. doi: 10.1007/s11033-014-3150-5
Sudhir, K., Glen, S., and Koichiro, T. (2016). MEGA7: molecular evolutionary genetics analysis version 7.0 for bigger datasets. Mol. Biol. Evol. 33, 1870–1874. doi: 10.1093/molbev/msw054
Sun, H. H., Wu, S., Zhang, G. Y., Jiao, C., Guo, S. G., Ren, Y., et al. (2017). Karyotype stability and unbiased fractionation in the paleo-allotetraploid cucurbita genomes. Mol. Plant 10, 1293–1306. doi: 10.1016/j.molp.2017.09.003
Wang, G. P., Zeng, H. Q., Hu, X. Y., Zhu, Y. Y., Chen, Y., Shen, C. J., et al. (2015). Identification and expression analyses of calmodulin-binding transcription activator genes in soybean. Plant Soil 386, 205–221. doi: 10.1007/s11104-014-2267-6
Wang, L., Guo, K., Li, Y., Tu, Y., Hu, H., Wang, B., et al. (2010). Expression profiling and integrative analysis of the CESA/CSL superfamily in rice. BMC Plant Biol. 10:282. doi: 10.1186/1471-2229-10-282
Wei, M., Xu, X., and Li, C. (2017). Identification and expression of CAMTA genes in Populus trichocarpa under biotic and abiotic stress. Sci. Rep. 7:17910. doi: 10.1038/s41598-017-18219-8
Yamniuk, A. P., and Vogel, H. J. (2004). Calmodulin’s flexibility allows for promiscuity in its interactions with target proteins and peptides. Mol. Biotechnol. 27, 33–57. doi: 10.1385/MB:27:1:33
Yang, T., Peng, H., Whitaker, B., and Conway, W. (2012). Characterization of a calcium/calmodulin-regulated SR/CAMTA gene family during tomato fruit development and ripening. BMC Plant Biol. 12:19. doi: 10.1186/1471-2229-12-19
Yang, T., and Poovaiah, B. W. (2000). An early ethylene up-regulated gene encoding a calmodulin-binding protein involved in plant senescence and death. J. Biol. Chem. 275, 38467–38473. doi: 10.1074/jbc.m003566200
Yang, Y., Sun, T., Xu, L., Pi, E., Wang, S., Wang, H., et al. (2015). Genome-wide identification of CAMTA gene family members in Medicago truncatula and their expression during root nodule symbiosis and hormone treatments. Front. Plant Sci. 6:459. doi: 10.3389/fpls.2015.00459
Yuan, J. P., Liu, T. K., Yu, Z. H., Li, Y., Ren, H. B., Hou, X. L., et al. (2019). Genome-wide analysis of the Chinese cabbage IQD gene family and the response of BrIQD5 in drought resistance. Plant Mol. Biol. 99, 603–620. doi: 10.1007/s11103-019-00839-5
Yue, R., Lu, C., Sun, T., Peng, T., Han, X., Qi, J., et al. (2015). Identification and expression profiling analysis of calmodulin-binding transcription activator genes in maize (Zea mays L.) under abiotic and biotic stresses. Front. Plant Sci. 6:576. doi: 10.3389/fpls.2015.00576
Zhang, J., Pan, X. T., Ge, T., Yi, S. L., Lv, Q., Zheng, Y. Q., et al. (2019). Genome-wide identification of citrus CAMTA genes and their expression analysis under stress and hormone treatments. J. Hortic. Sci. Biotech. 94, 331–340. doi: 10.1080/14620316.2018.1504631
Zhang, Z., Li, J., Zhao, X. Q., Wang, J., Wong, K. S., and Yu, J. (2006). KaKs_Calculator: calculating Ka and Ks through model selection and model averaging. Genom. Proteom. Bioinf. 4, 259–263. doi: 10.1016/S1672-0229(07)60007-2
Zhao, L. (2006). Study on the Physiology Response to Adaptability and Salt Stress in Pumpkin Seeding. Baoding: Agricultural University of Hebei.
Keywords: Cucurbita linn, CAMTA, genome-wide identification, salt stress, expression analysis
Citation: Yuan J, Shen C, Chen B, Shen A and Li X (2021) Genome-Wide Characterization and Expression Analysis of CAMTA Gene Family Under Salt Stress in Cucurbita moschata and Cucurbita maxima. Front. Genet. 12:647339. doi: 10.3389/fgene.2021.647339
Received: 29 December 2020; Accepted: 17 May 2021;
Published: 17 June 2021.
Edited by:
Maximiller Dal-Bianco, Universidade Federal de Viçosa, BrazilReviewed by:
Waltram Ravelombola, Texas A&M University, United StatesChenggen Chu, Edward T. Schafer Agricultural Research Center (USDA-ARS), United States
Copyright © 2021 Yuan, Shen, Chen, Shen and Li. This is an open-access article distributed under the terms of the Creative Commons Attribution License (CC BY). The use, distribution or reproduction in other forums is permitted, provided the original author(s) and the copyright owner(s) are credited and that the original publication in this journal is cited, in accordance with accepted academic practice. No use, distribution or reproduction is permitted which does not comply with these terms.
*Correspondence: Changwei Shen, Y2hhbmd3ZWlzaGVuQDE2My5jb20=