 Jose A. Domingos1,2*
 Xueyan Shen1
 Celestine Terence1
 Saengchan Senapin3,4
 Ha Thanh Dong3,5
 Marie R. Tan6
 Susan Gibson-Kueh1
 Dean R. Jerry1,2
- 1Tropical Futures Institute, James Cook University, Singapore, Singapore
- 2Centre for Sustainable Tropical Fisheries and Aquaculture, James Cook University, Townsville, QLD, Australia
- 3Faculty of Science, Fish Health Platform, Center of Excellence for Shrimp Molecular Biology and Biotechnology (Centex Shrimp), Mahidol University, Bangkok, Thailand
- 4National Center for Genetic Engineering and Biotechnology (BIOTEC), National Science and Technology Development Agency (NSTDA), Pathumthani, Thailand
- 5Faculty of Science and Technology, Suan Sunandha Rajabhat University, Bangkok, Thailand
- 6School of Applied Science (SAS), Republic Polytechnic, Singapore, Singapore
Marine farming of barramundi (Lates calcarifer) in Southeast Asia is currently severely affected by viral diseases. To better understand the biological implications and gene expression response of barramundi in commercial farming conditions during a disease outbreak, the presence of pathogens, comparative RNAseq, and histopathology targeting multiple organs of clinically “sick” and “healthy” juveniles were investigated. Coinfection of scale drop disease virus (SDDV) and L. calcarifer herpes virus (LCHV) were detected in all sampled fish, with higher SDDV viral loads in sick than in healthy fish. Histopathology showed that livers in sick fish often had moderate to severe abnormal fat accumulation (hepatic lipidosis), whereas the predominant pathology in the kidneys shows moderate to severe inflammation and glomerular necrosis. The spleen was the most severely affected organ, with sick fish presenting severe multifocal and coalescing necrosis. Principal component analysis (PC1 and PC2) explained 70.3% of the observed variance and strongly associated the above histopathological findings with SDDV loads and with the sick phenotypes, supporting a primary diagnosis of the fish being impacted by scale drop disease (SDD). Extracted RNA from kidney and spleen of the sick fish were also severely degraded likely due to severe inflammation and tissue necrosis, indicating failure of these organs in advanced stages of SDD. RNAseq of sick vs. healthy barramundi identified 2,810 and 556 differentially expressed genes (DEGs) in the liver and muscle, respectively. Eleven significantly enriched pathways (e.g., phagosome, cytokine-cytokine-receptor interaction, ECM-receptor interaction, neuroactive ligand-receptor interaction, calcium signaling, MAPK, CAMs, etc.) and gene families (e.g., tool-like receptor, TNF, lectin, complement, interleukin, chemokine, MHC, B and T cells, CD molecules, etc.) relevant to homeostasis and innate and adaptive immunity were mostly downregulated in sick fish. These DEGs and pathways, also previously identified in L. calcarifer as general immune responses to other pathogens and environmental stressors, suggest a failure of the clinically sick fish to cope and overcome the systemic inflammatory responses and tissue degeneration caused by SDD.
Introduction
Barramundi (Lates calcarifer), also known as Asian seabass, is an important tropical aquaculture food fish and a species that is receiving increased global attention due to its good attributes for aquaculture and consumer attractiveness (Jerry, 2013). As the barramundi industry grows and production intensifies, commercial farmers have seen the occurrence of several emerging viral and bacterial diseases that affects the survival of farmed stocks (Gibson-Kueh et al., 2012; de Groof et al., 2015; Dong et al., 2017a,b; Chang et al., 2018; Chen et al., 2019; Girisha et al., 2020). Emerging diseases are a particular threat to intensive barramundi aquaculture, where fish are directly exposed to the natural environment. In these open systems, it is impractical, due to the unavailability of efficacious commercial vaccines.
Scale drop disease virus (SDDV), a novel Megalocytivirus of the Iridoviridae family, has had devastating consequences on the production of barramundi in Southeast Asia, particularly during early juvenile phases (∼50–500 g) reared in sea cages. SDDV is often associated with mortalities ranging from 40 to 50% of cultured stock (Gibson-Kueh et al., 2012; de Groof et al., 2015; Senapin et al., 2019). While initial reports of the disease were from farms in Singapore (Gibson-Kueh et al., 2012; de Groof et al., 2015), SDDV has been reported in other Southeast Asian producing countries, such as Malaysia (Nurliyana et al., 2020), Thailand (Senapin et al., 2019), and Indonesia (de Groof et al., 2015). SDD was also recently reported in barramundi farmed in freshwater ponds in Thailand, suggesting this disease is not confined to marine aquaculture (Kerddee et al., 2020). Clinically affected fish show darkened bodies, scale loss, fin and tail erosion, and occasionally, cloudy eyes and red bellies (Gibson-Kueh et al., 2012; de Groof et al., 2015; Senapin et al., 2019; Nurliyana et al., 2020). Many of these gross abnormalities observed are similar to that caused by opportunistic bacterial infections, such that SDD was initially misdiagnosed as tenacibaculosis (Gibson-Kueh et al., 2012). Affected fish show systemic vasculitis and resulting tissue necrosis in all major organs, particularly in the spleen and kidney (Gibson-Kueh et al., 2012; Senapin et al., 2019).
Other emerging pathogens in cultured barramundi include L. calcarifer herpes virus (LCHV) (Chang et al., 2018; Meemetta et al., 2020), infectious spleen and kidney necrosis virus (ISKNV) (Dong et al., 2017a), Vibrio harveyi causing scale drop and muscle necrosis (Vh-SDMND) (Dong et al., 2017b), L. calcarifer birnavirus (LCBV) (Chen et al., 2019), and red sea bream iridovirus (RSIV) (Girisha et al., 2020). SDDV and LCHV infections in barramundi reportedly caused similar gross signs of scale loss (Chang et al., 2018), reiterating the need to use more specific diagnostic tests. PCR-based diagnostic methods have been established for these pathogens (Gias et al., 2011; de Groof et al., 2015; Meemetta et al., 2020; Sriisan et al., 2020). However, epidemiological studies characterizing the prevalence of these pathogens in farming sites have not yet been carried out. In fact, coinfections, rather than a single pathogen are commonly responsible for mortalities and production losses (Dong et al., 2015; Bastos Gomes et al., 2019; Nguyen et al., 2019; Kerddee et al., 2020). In some cases, such interactions might change how the host responds to a secondary infection in a counterintuitive manner, as for instance persistently nervous necrosis virus (NNV)-infected barramundi were shown to exhibit resistance to RSIV coinfection (Wu et al., 2013).
Recent genomic studies in barramundi have resulted in the development of linkage maps (Wang et al., 2015a, 2017a), molecular markers (Zhu et al., 2006a; Wang et al., 2015b), transcriptomes (Xia et al., 2011; Thevasagayam et al., 2015), and whole genome assemblies (Domingos et al., 2015; Vij et al., 2016). These studies have contributed to a better understanding of the biology of wild barramundi (Zhu et al., 2006b; Yue et al., 2009; Loughnan et al., 2019) and in aquaculture production (Domingos et al., 2013, 2014a,b, 2018, 2021; Loughnan et al., 2013, 2016; Ravi et al., 2014; Ngoh et al., 2015; Wang et al., 2015b). A number of studies have employed “omics” approaches targeted to better understand molecular pathways and genes involved in L. calcarifer’s adaptive stress response (Newton et al., 2013; Hook et al., 2017; Ma et al., 2020; Vij et al., 2020). Other studies investigated immune functions (Xia and Yue, 2010; Xia et al., 2011, 2013; Jiang et al., 2014; Liu et al., 2016), QTLs (Wang et al., 2017b) and disease resistance genes (Fu et al., 2013, 2014; Sun et al., 2020). Laboratory challenge trials have been carried out to understand the genetic basis of immune response and survival in barramundi associated with V. harveyi (Fu et al., 2013; Xia et al., 2011, 2013), Photobacterium damselae (Fu et al., 2013), Streptococcus iniae (Jiang et al., 2014), iridovirus (Wang et al., 2017b; Sun et al., 2020), and NNV (Liu et al., 2016). Transcriptome analyses based on RNAseq have proven to be a powerful tool to understand pathogenicity and fish immunity (Sudhagar et al., 2018).
To better understand recurring mortalities experienced during the early phases of sea cage culture of barramundi, this study investigated the transcriptional changes and associated histopathology in fish sampled during a major disease outbreak event. Tissues of clinically healthy and sick fish were collected, and histological analyses, qPCR, and PCR for significant pathogens and RNAseq methodologies were carried out. Our results showed significant changes in pathogen loads of SDDV but not LCHV, pathology, and differential gene expression between clinically healthy and sick barramundi.
Materials and Methods
Sample Collection
Juvenile barramundi were collected in a sea cage with a history of recent mortalities from a commercial farm in Singapore, in June 2019. Eight apparently diseased fish (hereafter termed “sick” fish—length, 26.5 ± 3.0 cm; weight, 231.3.1 ± 67.4 g) displaying lethargy (slow swimming at the surface), fin and body rot, and scale loss (or which scales were easily removed) were sampled for tissue collection, along with eight clinically healthy fish (hereafter termed “healthy”—length, 28.0 ± 2.5 cm; weight, 290.1 ± 71.6 g) exhibiting active swimming patterns, smooth body and skin, and clear eyes. Fish were euthanized in buckets containing 15 L of seawater and 15 ml of 10% clove oil (100 ppm), and immediately dissected after decapitation to collect the kidney, muscle, spleen, and liver (∼0.5 cm3). Tissues were subsampled and preserved either in RNAlater (Ambion, Austin, TX, United States) for RNA sequencing and pathogen screening by PCR and/or qPCR or 10% phosphate-buffered formalin for histology. Tissue samples in RNA later were kept on ice and transferred to a –20°C freezer on the same day for storage until processed for analyses. Formalin-fixed tissues were processed into 5 μm hematoxylin and eosin (H&E)-stained tissue sections at the Institute of Molecular and Cell Biology (IMCB) histology laboratory in Singapore. H&E-stained tissue sections were viewed under bright field microscopy, and images were captured using the Olympus Research Microscope BX53, Digital Camera DP74, and CellSensTM Standard Imaging System (Olympus Corporation, Tokyo, Japan).”
Screening of Five Putative Fish Pathogens by PCR Methods
The presence and load of pathogens in fish was identified via PCR/qPCR methods (Table 1). Firstly, genomic DNA was extracted from kidney and liver tissues of healthy (n = 8) and sick (n = 8) barramundi using a conventional phenol/chloroform and ethanol precipitation method. From this extract, 200 ng of DNA template was then used in each PCR reaction. Along with all tests for the target pathogen, amplification of the cytochrome c oxidase gene (COI) was included (Ivanova et al., 2007) to ensure quality of the DNA template. PCR diagnosis were conducted for three viral pathogens namely SDDV, LCHV, Megalocytivirus, and two bacterial pathogens Tenacibaculum maritimum and Vibrio harveyi causing scale drop and muscle necrosis (Vh-SDMND), as per Table 1.
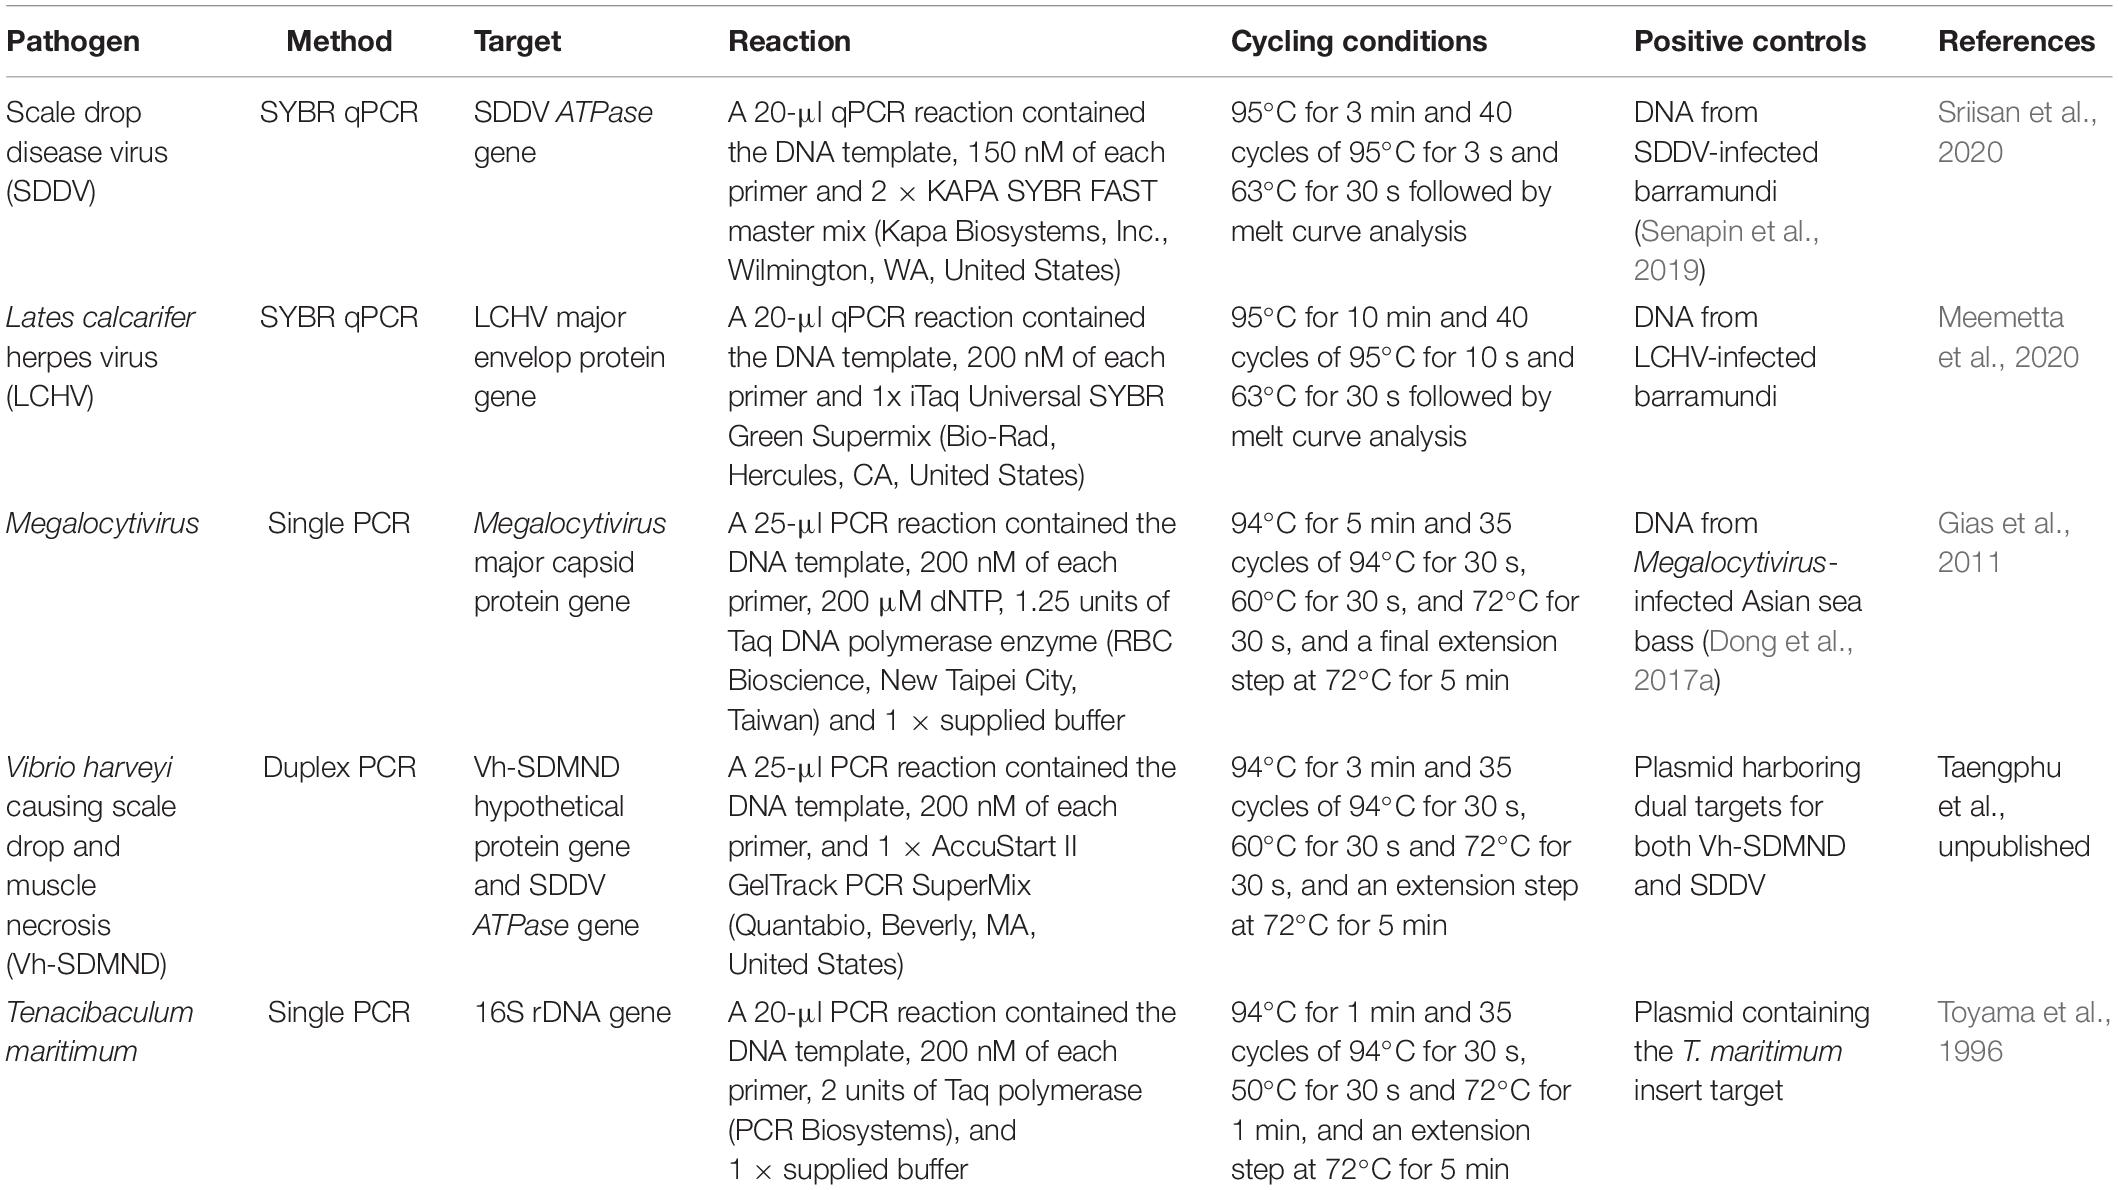
Table 1. Summary of molecular tests employed to detect and/or quantify pathogens present in kidney and liver of barramundi.
Copy numbers of SDDV and LCHV were calculated from respective standard graphs generated by qPCR amplifications of serially diluted plasmid containing corresponding viral insert target as previously described (Meemetta et al., 2020; Sriisan et al., 2020).
Statistical Analyses
Assessment of statistical differences between sick and healthy fish viral loads in kidney and liver was performed with a Mann-Whitney U-test at a significance level of 0.05. The association between the viral loads and the observed histopathological scores (hepatic reserves, lipidosis, glomerulonephritis, and splenitis) was explored using PCA with Spearman rank metrics in Xlstat® software (Addinsoft, Paris, France). The original set of eight variables of interest was reduced into two components of eigenvalues of 4.72 and 1.61 and represented as a two-dimensional plot.
RNA Extraction, Library Preparation, and Sequencing
Total RNA was extracted from three immune competent tissues (liver, spleen, and kidney) and muscle from all 16 fish using an RNeasy® Mini kit (Qiagen 74104, Qiagen, Frankfurt, Germany). All RNA samples were treated with RNase free DNase-I (M610A, Promega, Madison, WI, United States) to remove genomic DNA contamination. The quality and the quantity of the total RNA was determined with an Agilent 2100 Bioanalyzer (RNA 6000 Nano Chip Assay, Agilent, Böblingen, Germany) and a Qubit 3.0 (Quant-It dsRNA BR Assay, ThermoFischer Scientific, Waltham, MA, United States).
For the cDNA library preparations, 1 μg RNA was used as an input material for each sample. VAHTS mRNA-seq V3 Library Prep Kit for Illumina (NR611, Vazyme; San Diego, CA, United States) was used to generate sequencing libraries. In brief, mRNA with poly(A) was enriched by mRNA Capture Beads and fragmented by heating. Short mRNA was reverse-transcribed with random hexamer primers to generate the first cDNA, and then the second cDNA was synthesized. The cDNA fragments then went through an end repair process, the addition of a single “A” base to the 3′ end and then ligation of the adapters. The products were then purified and size selected (350 bp range). At the end, fragments were enriched by PCR and purified using VAHTSTM DNA Clean Beads. The quality and quantity of PCR product was determined by the Agilent Bioanalyzer 2100 and Qubit 2.0 (ThermoFisher). Finally, sequencing was undertaken on an Illumina Novaseq 6000 platform generating 150 bp paired-end reads.
RNA-Seq Data Mapping, Gene Differential Expression, and Enrichment Analysis
To obtain high-quality clean data for downstream analyses, raw reads of FASTQ format were firstly processed through in-house perl scripts. In this step, the low-quality reads and reads containing adaptors or poly-N were removed. At the same time, Q20, Q30, GC content, and sequence duplication level of the clean data were calculated.
Reference genome and gene model annotation files of L. calcarifer were downloaded from the NCBI1 genome website directly. Index of the reference genome was built using Bowtie v2.2.3 (Langmead and Salzberg, 2012), and paired-end clean reads were aligned to the reference genome using TopHat v2.0.12 (Kim et al., 2013). The process of genetic quantification of gene expression level was carried out by HTSeq v0.6.1 by counting the read numbers mapped to each gene (Anders et al., 2015), and then the expected number of fragments per kilobase of transcript sequence per millions base pairs sequenced (FPKM) of each gene was calculated based on the length of the gene and reads count mapped to this gene.
Differential expression statistical analysis between organs from sick and healthy fish was performed using the DESeq R package (1.18.0) (Wang et al., 2010). The resulting P-values were adjusted using the Benjamini and Hochberg’s approach for controlling the false-discovery rate. Genes with an adjusted P-value < 0.05 found by DESeq were assigned as the threshold for indicating significantly differential expression. Gene Ontology (GO) enrichment analysis of differentially expressed genes was implemented by the GOseq R package, in which gene length bias was corrected (Young et al., 2010). GO terms with corrected P-values < 0.05 were considered significantly enriched by differentially expressed genes. KOBAS software (Mao et al., 2005) was utilized to test the statistical enrichment of those differential expression genes in KEGG2 pathways.
Results
Pathogen Screening Using PCR and qPCR
While histopathology strongly suggested a primary infection with scale drop virus in both sick and clinically healthy fish, qualitative molecular tests (PCR) were carried out to rule out other possible concurrent infections that could cause the scale loss observed (Vh-SDMND, T. maritimum), or other viral diseases that could cause the occasional inclusion bodies observed in renal glomeruli or connective tissues within skeletal muscles in sick fish (Megalocytivirus). Based on PCR, liver and kidney samples returned negative for the presence of Megalocytivirus, Vh-SDMND, and T. maritimum in both sick and healthy fish, while all fish sampled were positive for SDDV and LCHV, with exception of two sick fish liver samples (out of seven) (Supplementary Table 1 and Supplementary Figure 1). SDDV and LCHV loads in the healthy fish ranged from 1 to 1,853 copies and 17 to 475 copies/qPCR reaction, respectively. SDDV and LCHV loads were higher in the sick fish, from 131 to 22,549 and 0 to 4,045 copies/qPCR reaction, respectively (Supplementary Table 2 and Figure 1A). SDDV overall loads were seven times higher than those for LCHV. SDDV loads in kidney and liver of sick fish were 8.4 and 3.6 times higher than those of healthy fish (Figure 1A). However, differences in loads between the two groups were not statistically significant (P > 0.05). The kidneys of sick fish had 3.6 times higher LCHV loads than those of healthy fish. Comparatively, LCHV loads in the liver were one magnitude lower than those in the kidney and two orders of magnitude lower than that of SDDV (Figure 1A, right). Amplicons from selected positive test samples (marked with an asterisk in Supplementary Table 1) were subjected to DNA sequence analysis and found to show one (99.3%) to zero nucleotide change (100% identity) among the SDDV product sequences. In contrast, two (97.85%) to no nucleotide differences (100% identity) were observed among the LCHV product sequences (Supplementary Figure 2).
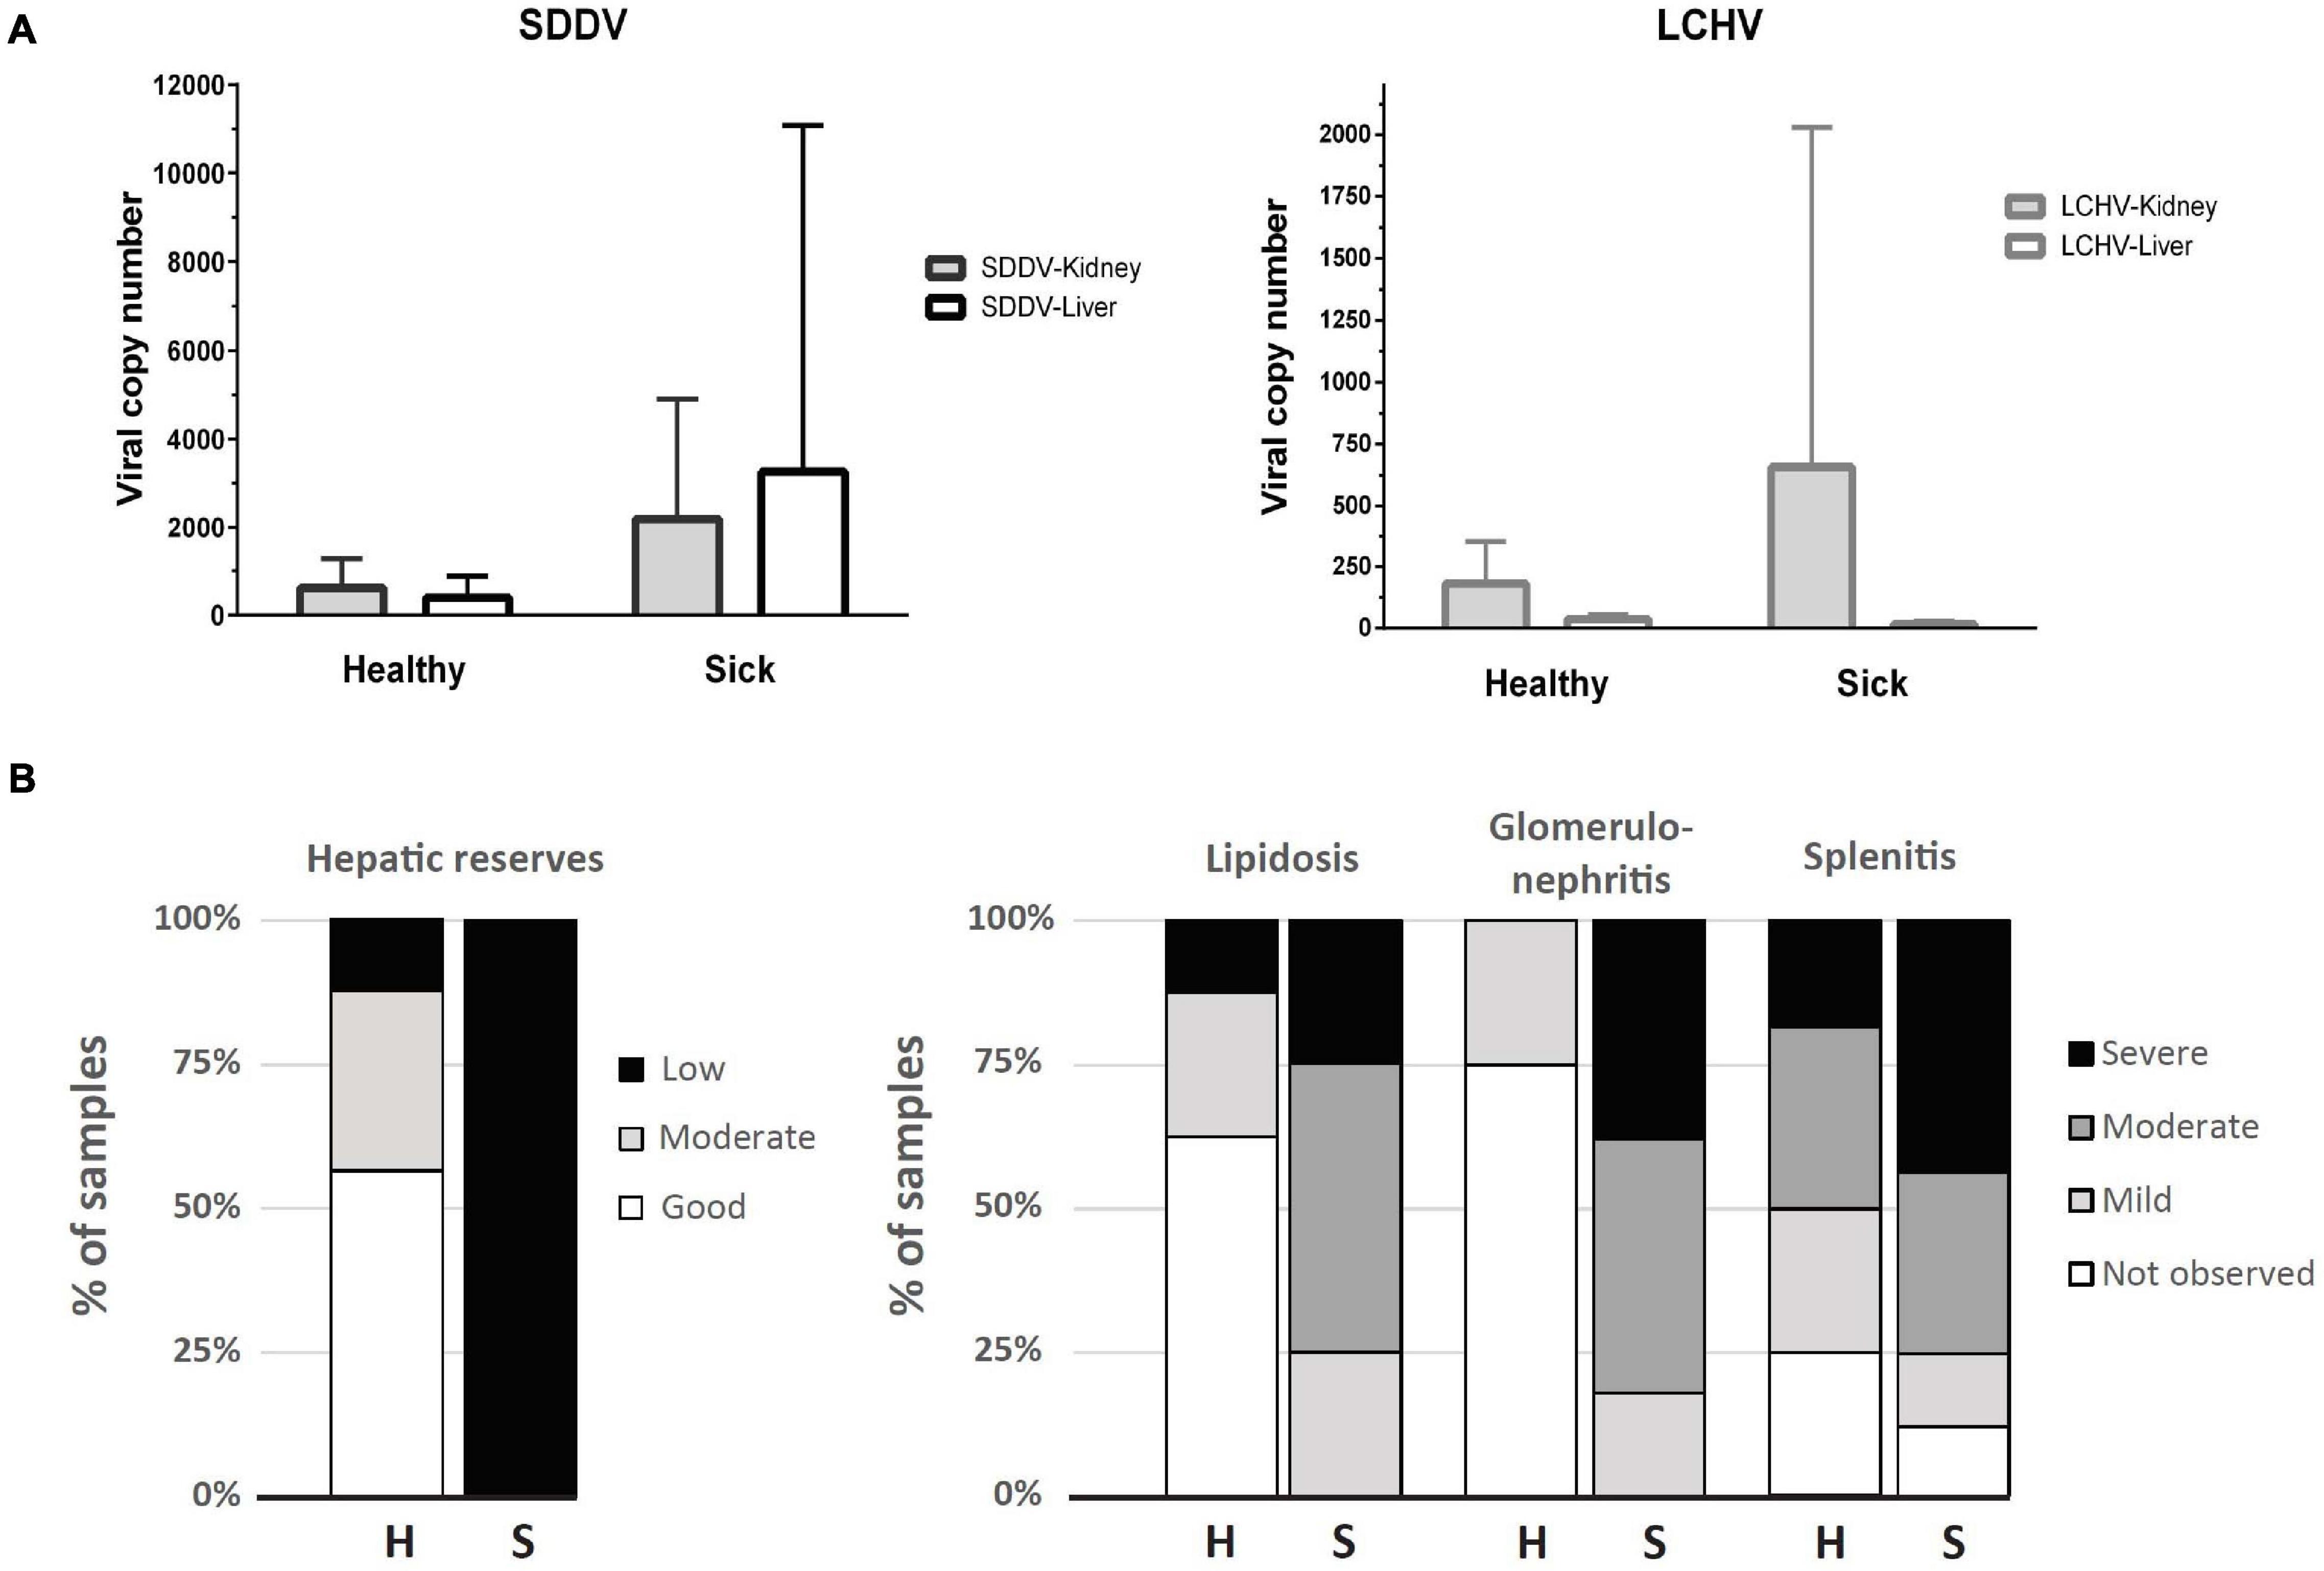
Figure 1. (A) Viral copy number (mean + SD) determined by qPCR assays for SDDV and LCHV of samples derived from kidney and liver (n = 8, except for liver of the sick fish, where n = 7). (B) Distribution of samples according to histopathology scores of liver (hepatic reserves and lipidosis), spleen (splenitis), and kidney (glomerulonephritis) of apparently healthy (H, n = 8) and sick (S, n = 8) barramundi.
Histopathology
Raw data on individual viral loads and histopathology scores are presented in Supplementary Table 2. Overall, clinically sick fish showed a greater degree of abnormalities, often related to inflammatory processes (Figure 1B). The wispy cytoplasmic appearance of H&E-stained livers with good hepatocellular reserves in healthy fish, differs from the more homogenous, basophilic cytoplasm in sick fish, with depleted hepatic reserves (Figures 2A,B). Moderate (score 2) to good (score 3) hepatocellular lipid and glycogen reserves were observed in most of the livers of clinically healthy barramundi (Figures 1B, 2A), in contrast to low hepatic reserves observed in all sick fish (Figures 1B, 2B). Moderate to severe, accumulation of large, round, lipid vacuoles or macrovesicles in liver cells (lipidosis), was observed in most sick barramundi (Figures 1B, 2C). Lipidosis is either not observed or mild in healthy fish, with the exception of one individual which had the highest SDDV loads within this group (Figure 1A and Supplementary Table 2).
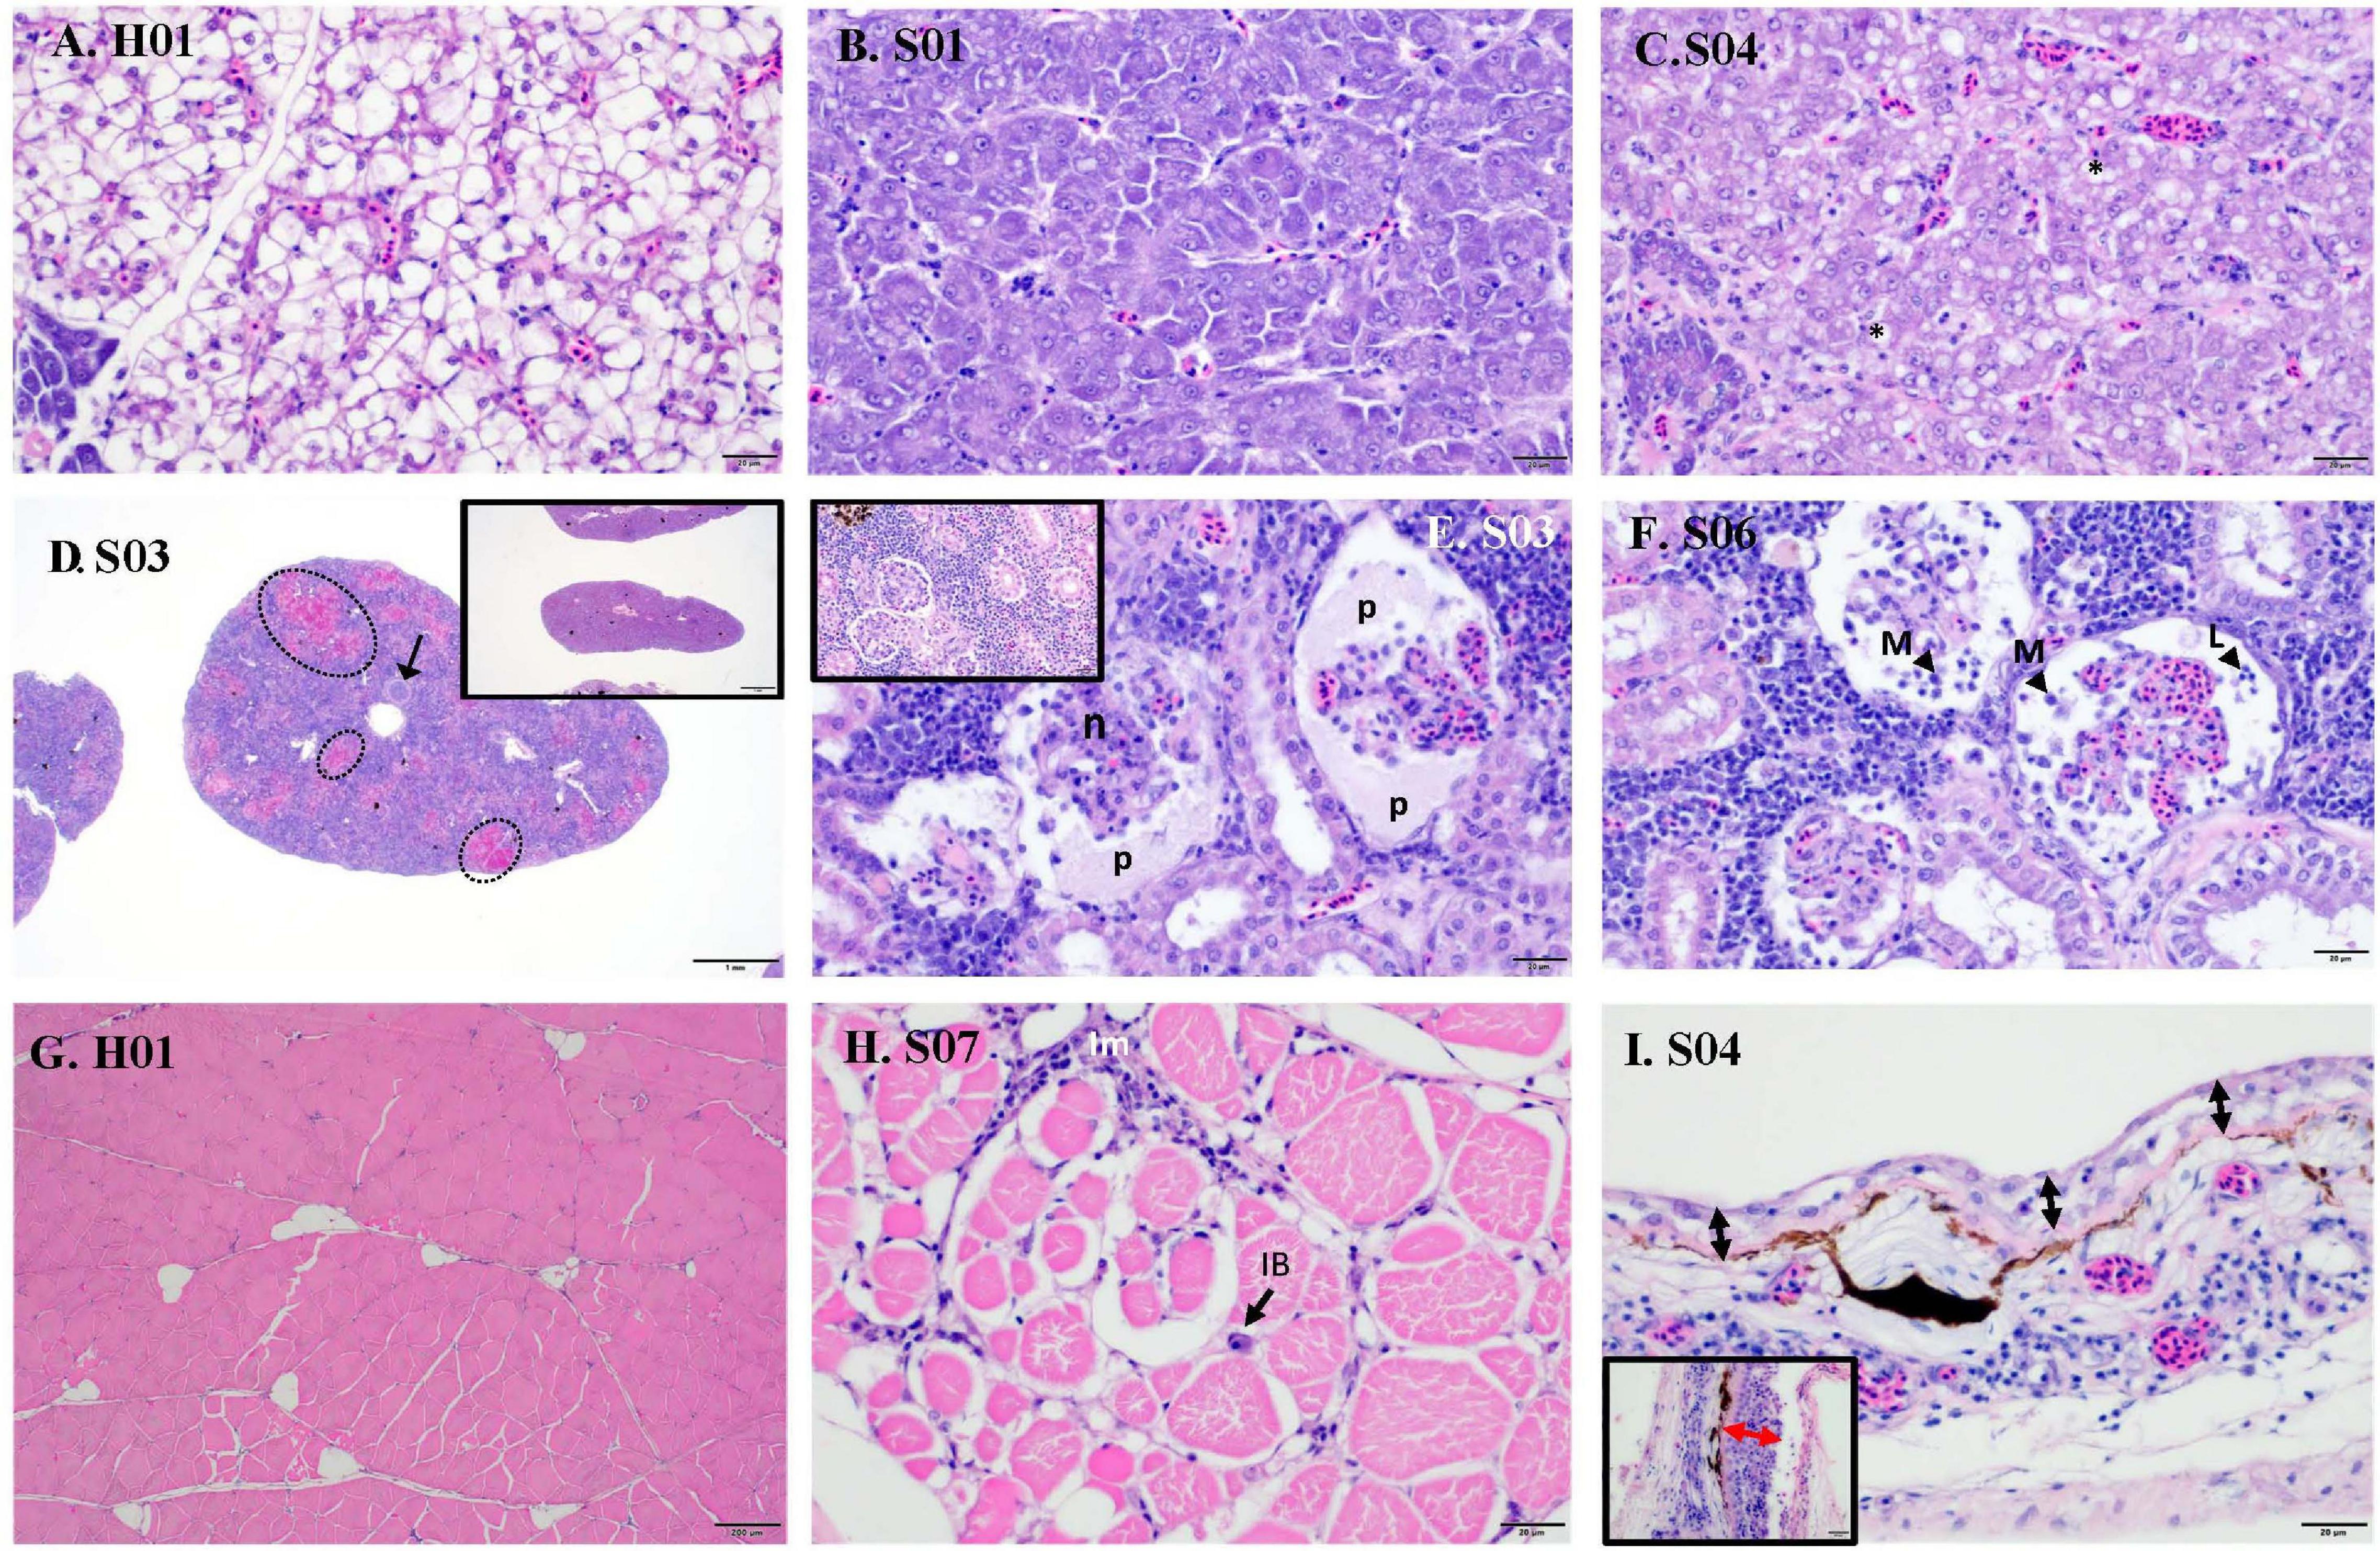
Figure 2. Histopathology of sick (S) and healthy (H) barramundi (hematoxylin and eosin stains). (A) Liver, wispy cytoplasmic appearance due to good levels of lipid reserves (fish H01). (B) Liver, homogenous, basophilic cytoplasm with low lipid reserves (fish S01). (C) Liver, severe hepatic lipidosis, with large lipid vacuoles or macrovesicles (*) (fish S04). (D) Spleen, moderate splenitis with multifocal necrosis (encircled, fish S03). Arrow shows occluded artery. Inset is spleen with no abnormalities (fish H06). (E) Kidney, severe glomerulonephritis, with pyknosis and karyorrhexis [necrosis (n)] and protein effusion (p) into Bowman’s space (fish S03). Inset is kidney with no abnormalities (fish H01). (F) Kidney, severe glomerulonephritis with glomerular necrosis and infiltration into Bowman’s space of macrophages (M) and lymphocytes (L) (fish S06). (G) Normal skeletal muscles (fish H01). (H) Interstitial myositis (Im), associated with occasional viral inclusion body (IB) (fish S07). (I) Thinning of epidermis (black arrow) (Fish S04), compared with thicker epidermis (red arrow) (inset, fish H01). Lymphocytic-monocytic infiltration surrounding dermal blood vessels.
Moderate to severe splenic inflammation (splenitis) were observed in both healthy and sick fish (Figure 1B). Moderate splenitis is characterized by multifocal necrosis (Figure 2D), while severe splenitis has multifocal to coalescing necrosis, affecting extensive areas of the spleen. Spleens with multifocal infarcts, or tissue deaths (necrosis), had occluded blood vessels, due to marked inflammatory response in the endothelium (obliterative endarteritis) (Figure 2D). While there was splenitis in a significant number of both clinically healthy and sick fish, moderate to severe kidney inflammation (glomerulonephritis) was observed only in all sick fish. The kidneys of diseased barramundi showed glomerular necrosis, protein effusion, and mixed infiltration of macrophages and lymphocytes into the Bowman’s space (protein loosing, necrotizing glomerulonephritis) (Figures 2E,F).
Mild multifocal interstitial myositis was observed in both healthy (H02, H04, and H05) and sick fish (S07), and occasionally in association with the presence of inclusion bodies (Figure 2H). Moderate, diffuse dermatitis was observed where skin was intact in tissue sections examined, in both healthy (H01, H02, H04, and H06) and sick fish (S02 and S04). In addition, severe thinning of epidermis was observed in the sick fish S04, lymphocytic-monocytic infiltration surrounding dermal blood vessels (perivasculitis) and occluded dermal blood vessels with obliterative endarteritis was observed in sick fish S06 (Figure 2I).
Two principal components derived from PCA explained 70.3% of the variance among SDDV and LCHV viral loads and histopathological findings (Figure 3). A positive association was observed between SDDV loads (both in the liver and in the kidney) and the major negative histopathological findings (glomerulonephritis, splenitis, and lipidosis) (component F1 > 2), which were inversely related to lipid score (component F1 < –2). In contrast, the PCA revealed no direct association of LCHV loads with any of the histopathological findings (and neither with SDDV loads). Although all healthy individuals were positive for both viruses (albeit with lower loads than sick individuals) and did present some of the histopathological alterations (most notably on the spleen, Figure 1B), the PCA revealed a marked difference in grouping of sick (F1 > 0) and healthy (F1 < 0) fish, with exception of S08 and H05 individuals, which respectively had the lowest and the highest SDDV loads within their groups (Supplementary Table 2).
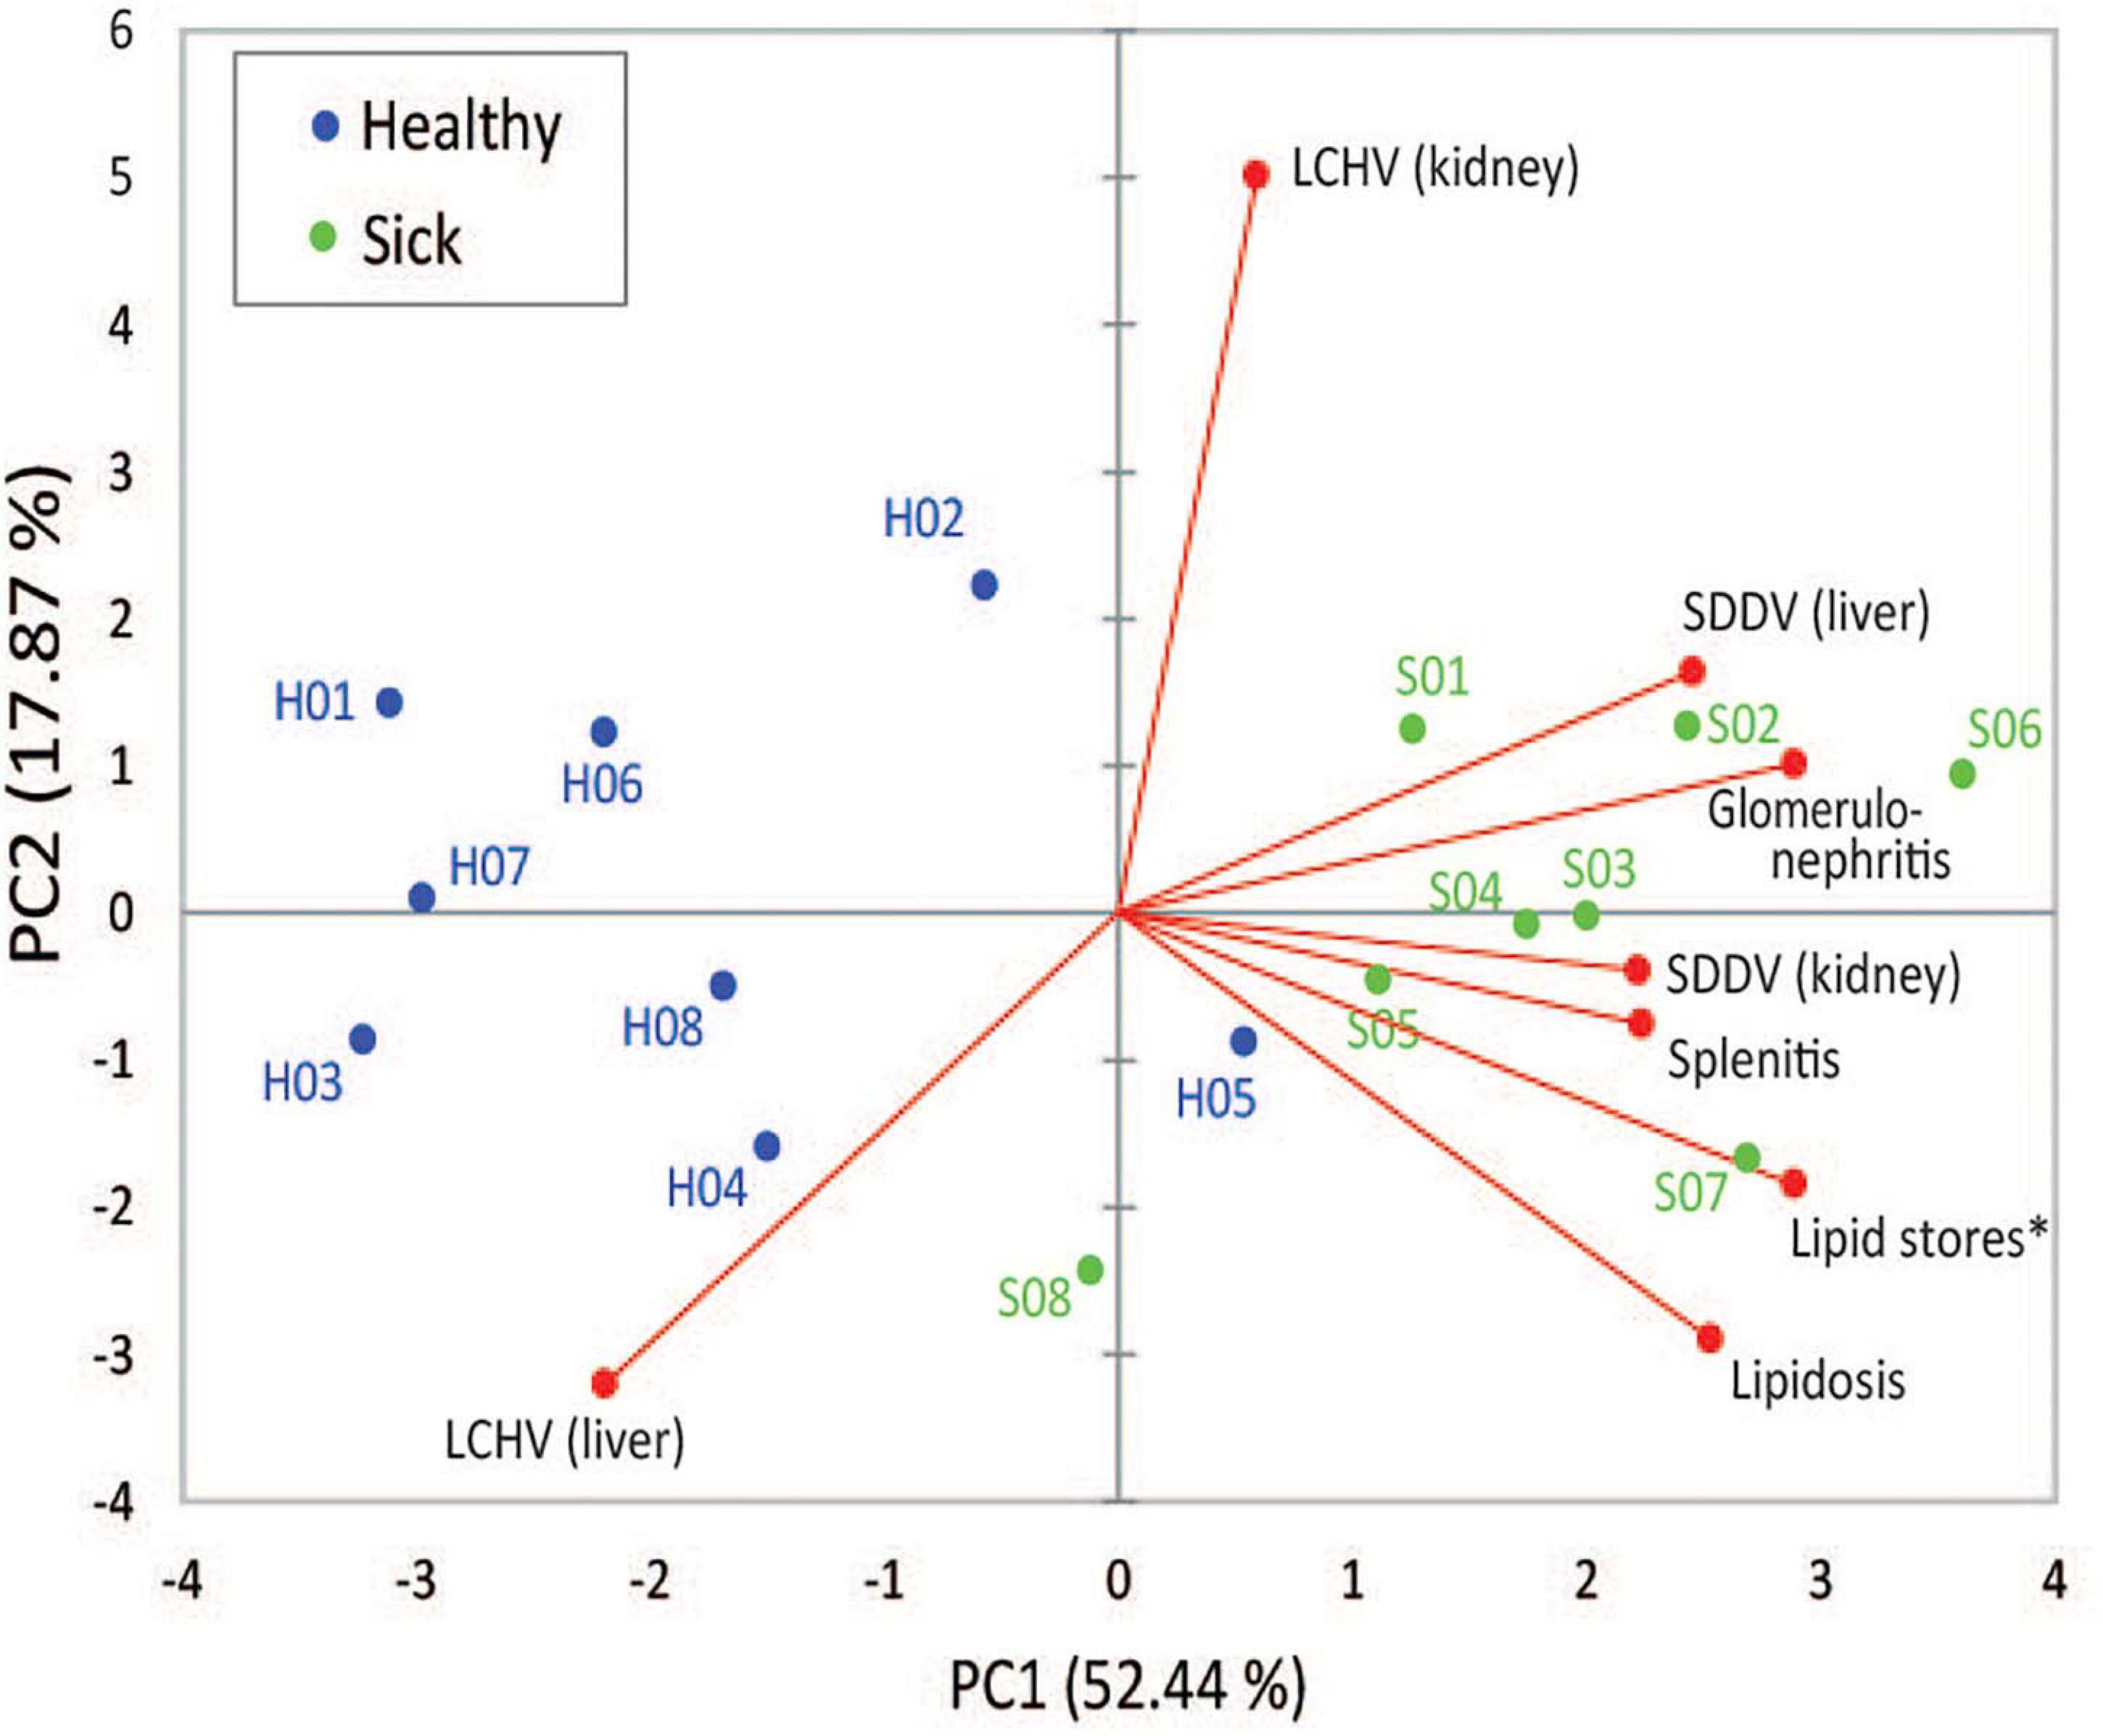
Figure 3. First and second components of principal component analysis (PCA), showing the relationship among SDDV and LCHV loads and histopathology features (red dots) and the overlay distribution of the individual sample of healthy (H01–H08, blue dots) and sick (S01–S08, green dots) barramundi juveniles in this study. Asterisk, for graphical purposes, lipid store values were multiplied by –1.
Severe RNA Degradation Observed in Spleen and Kidney of Sick Fish
Major differences were observed in the quality of RNA extracted from spleen and kidney of healthy vs. sick fish and between different organs in sick fish, as assessed with an Agilent 2100 Bioanalyzer (Figure 4). RNA integrity number (RIN, mean ± S.D.) for extracts from spleen and kidney of sick fish were 2.50 ± 0.55 and 3.39 ± 1.15, respectively. This contrasts with RIN of 9.93 ± 0.09 for liver, and 8.86 ± 1.03 for muscle RNA extracts for sick fish, and 9.37 ± 0.11 for RNA derived from all organs of healthy fish. As RNA in spleen and kidney samples of sick fish were degraded and did not pass quality control for sequencing, only liver and muscle tissues were used for transcriptomic comparisons between the two groups.
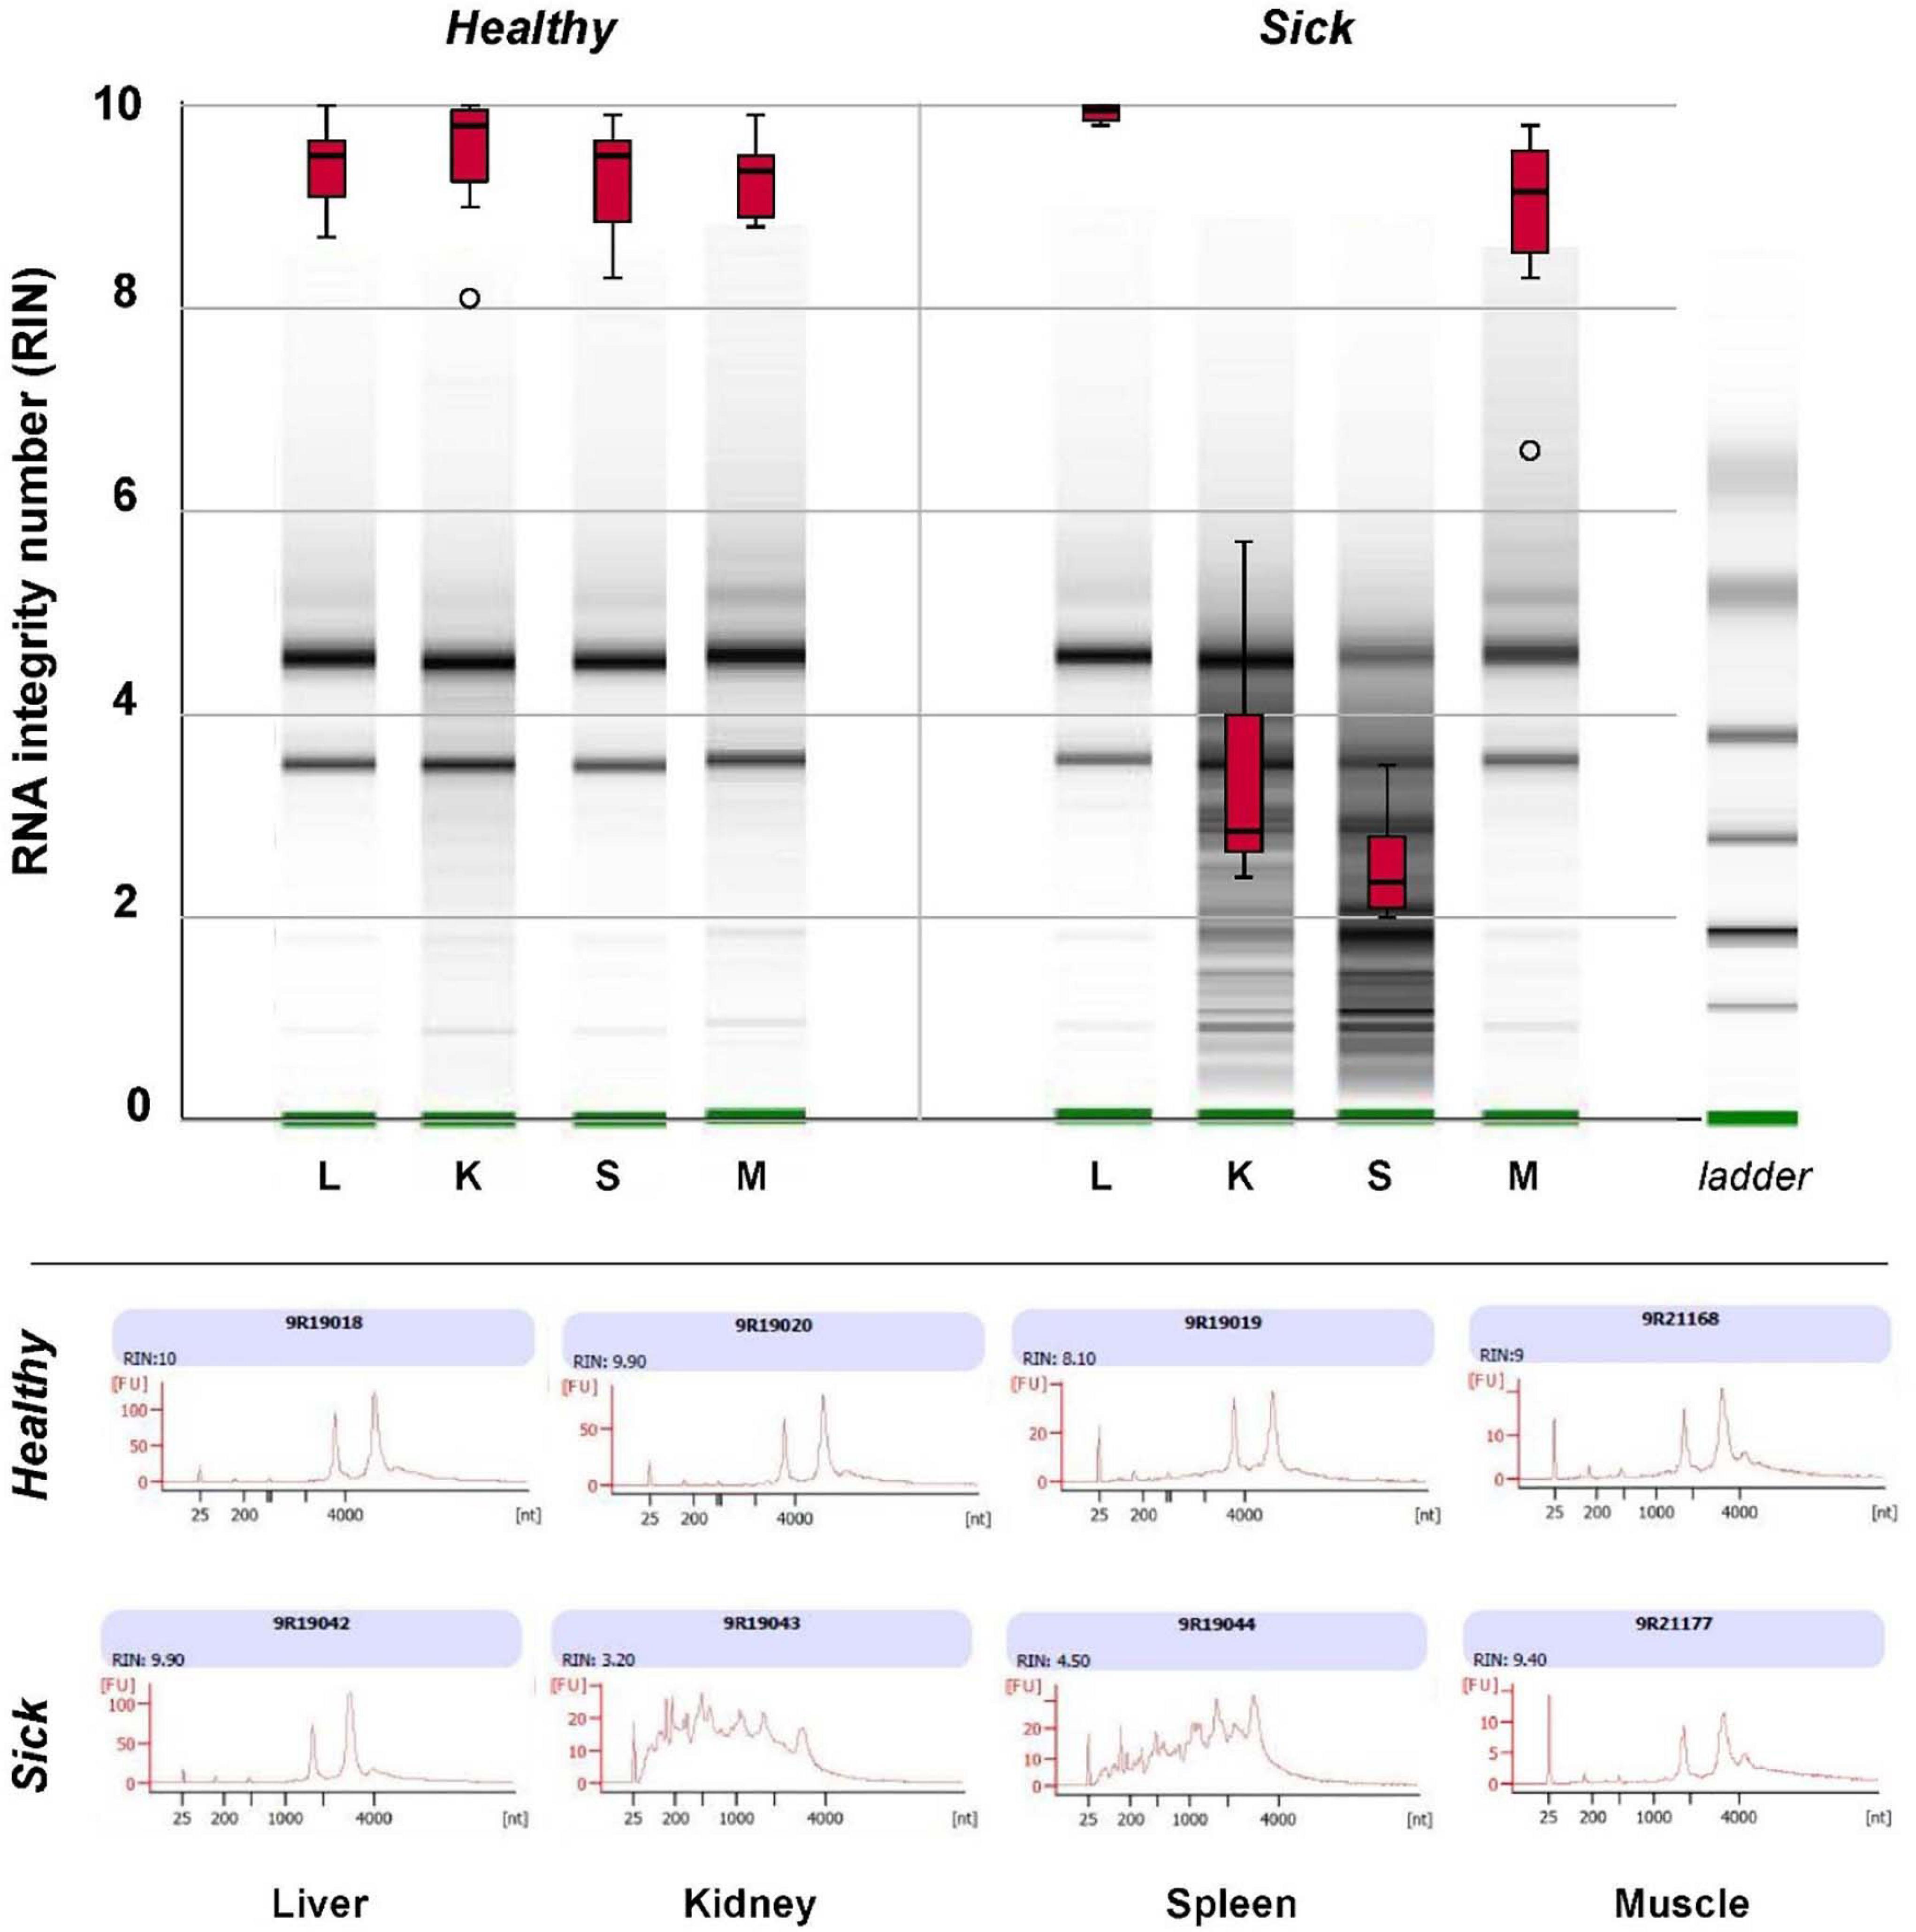
Figure 4. Box plots of RNA integrity number (RIN) of total RNA extracted from liver (L), kidney (K), spleen (S), and muscle (M) tissues of eight “sick” and eight “healthy” juvenile barramundi from a sea cage farm, as determined with an Agilent 2100 Bioanalyzer RNA 6000. Nanochip assay with representative gel images (top) and electropherogram (bottom) of total RNA extracts of sick and healthy fish, indicated severe degradation in RNA extracted from kidneys and spleens of sick fish.
Liver and Muscle RNA Sequencing, Mapping, and Analysis of Differentially Expressed Genes
RNA sequencing performed on eight sick and eight healthy fish generated a total of 1,426.10 and 1,831.68 million clean reads, from the liver and muscle tissues, respectively. An average of 101.80 million clean reads (ranging from 82.48 to 167.31 million) was obtained from each sample. The Q30 (i.e., probability of an incorrect base call of 1 in 1,000) and GC percentages of the reads were 92.84 and 50.08%, respectively. All the filtered clean reads were mapped individually against the annotated genome of L. calcarifer. In total, 2,504.23 million reads were successfully mapped, with approximately 2,306.56 million reads (92.1%) uniquely mapped (i.e., mapped to a single locus in the genome). Detailed sequencing and mapping results are summarized in Supplementary Table 3. RNAseq data (32 trancriptomes) have been deposited in NCBI under the accession number PRJNA713978.
To identify gene expression changes between liver (or between muscle) of sick and healthy fish, the FPKM method was used to calculate the expression levels of genes (Figure 5). For liver tissues, the average Pearson correlation coefficient (R2 values) for gene expression values was 0.92 (0.89–0.97) in healthy fish and 0.95 (0.93–0.98) in sick fish, indicating the high repeatability of biological replicates. For muscle tissues, the average R2 values was 0.82 (0.71–0.94) in healthy fish and 0.80 (0.51–0.95) in sick fish, which suggested less similarity in the gene expression patterns of muscle relative to liver between sick and healthy fish. Given the high number of biological samples randomly sampled within each group (n = 8) for a transcriptomic study, but still limited in relation to the farmed population subjected to the disease outbreak, all samples were utilized in the analysis. Comparison between liver of two groups (sick vs. healthy fish) revealed 2,810 significantly differentially expressed genes (DEGs). Among them, 1,083 were upregulated and 1,727 were downregulated in the liver of sick fish (Figure 5 and Supplementary Table 4). In the muscle, a total of 556 significantly DEGs were discovered, with 144 genes upregulated and the rest downregulated in sick fish (Figure 5 and Supplementary Table 5). To illustrate the DEGs detected in sick and healthy fish, heatmaps were generated for both liver and muscle separately (Supplementary Figures 3A,B). The transcriptomic profile in the livers of healthy fish was obviously different from that of the sick fish, with all eight samples from each group contained within two main clusters (Supplementary Figure 3A). Whereas in muscle, the expression pattern of the DEGs showed a less distinct clustering between the two groups compared with that of liver, with some sample overlap between muscle of sick and healthy animals between the two main clusters (Supplementary Figure 3B), probably because muscle is not an immune-related organ like liver and is thus is less affected by the disease. About 32% of the DEGs found in the muscle (n = 176) were also differentially expressed in the liver, whereby a 97% in concordance between up- or downregulation was observed. In terms of gene ontology, DEGs in both tissues were primarily classified within “cellular component,” followed by “biological processes” and then “molecular function” (Supplementary Figure 4).
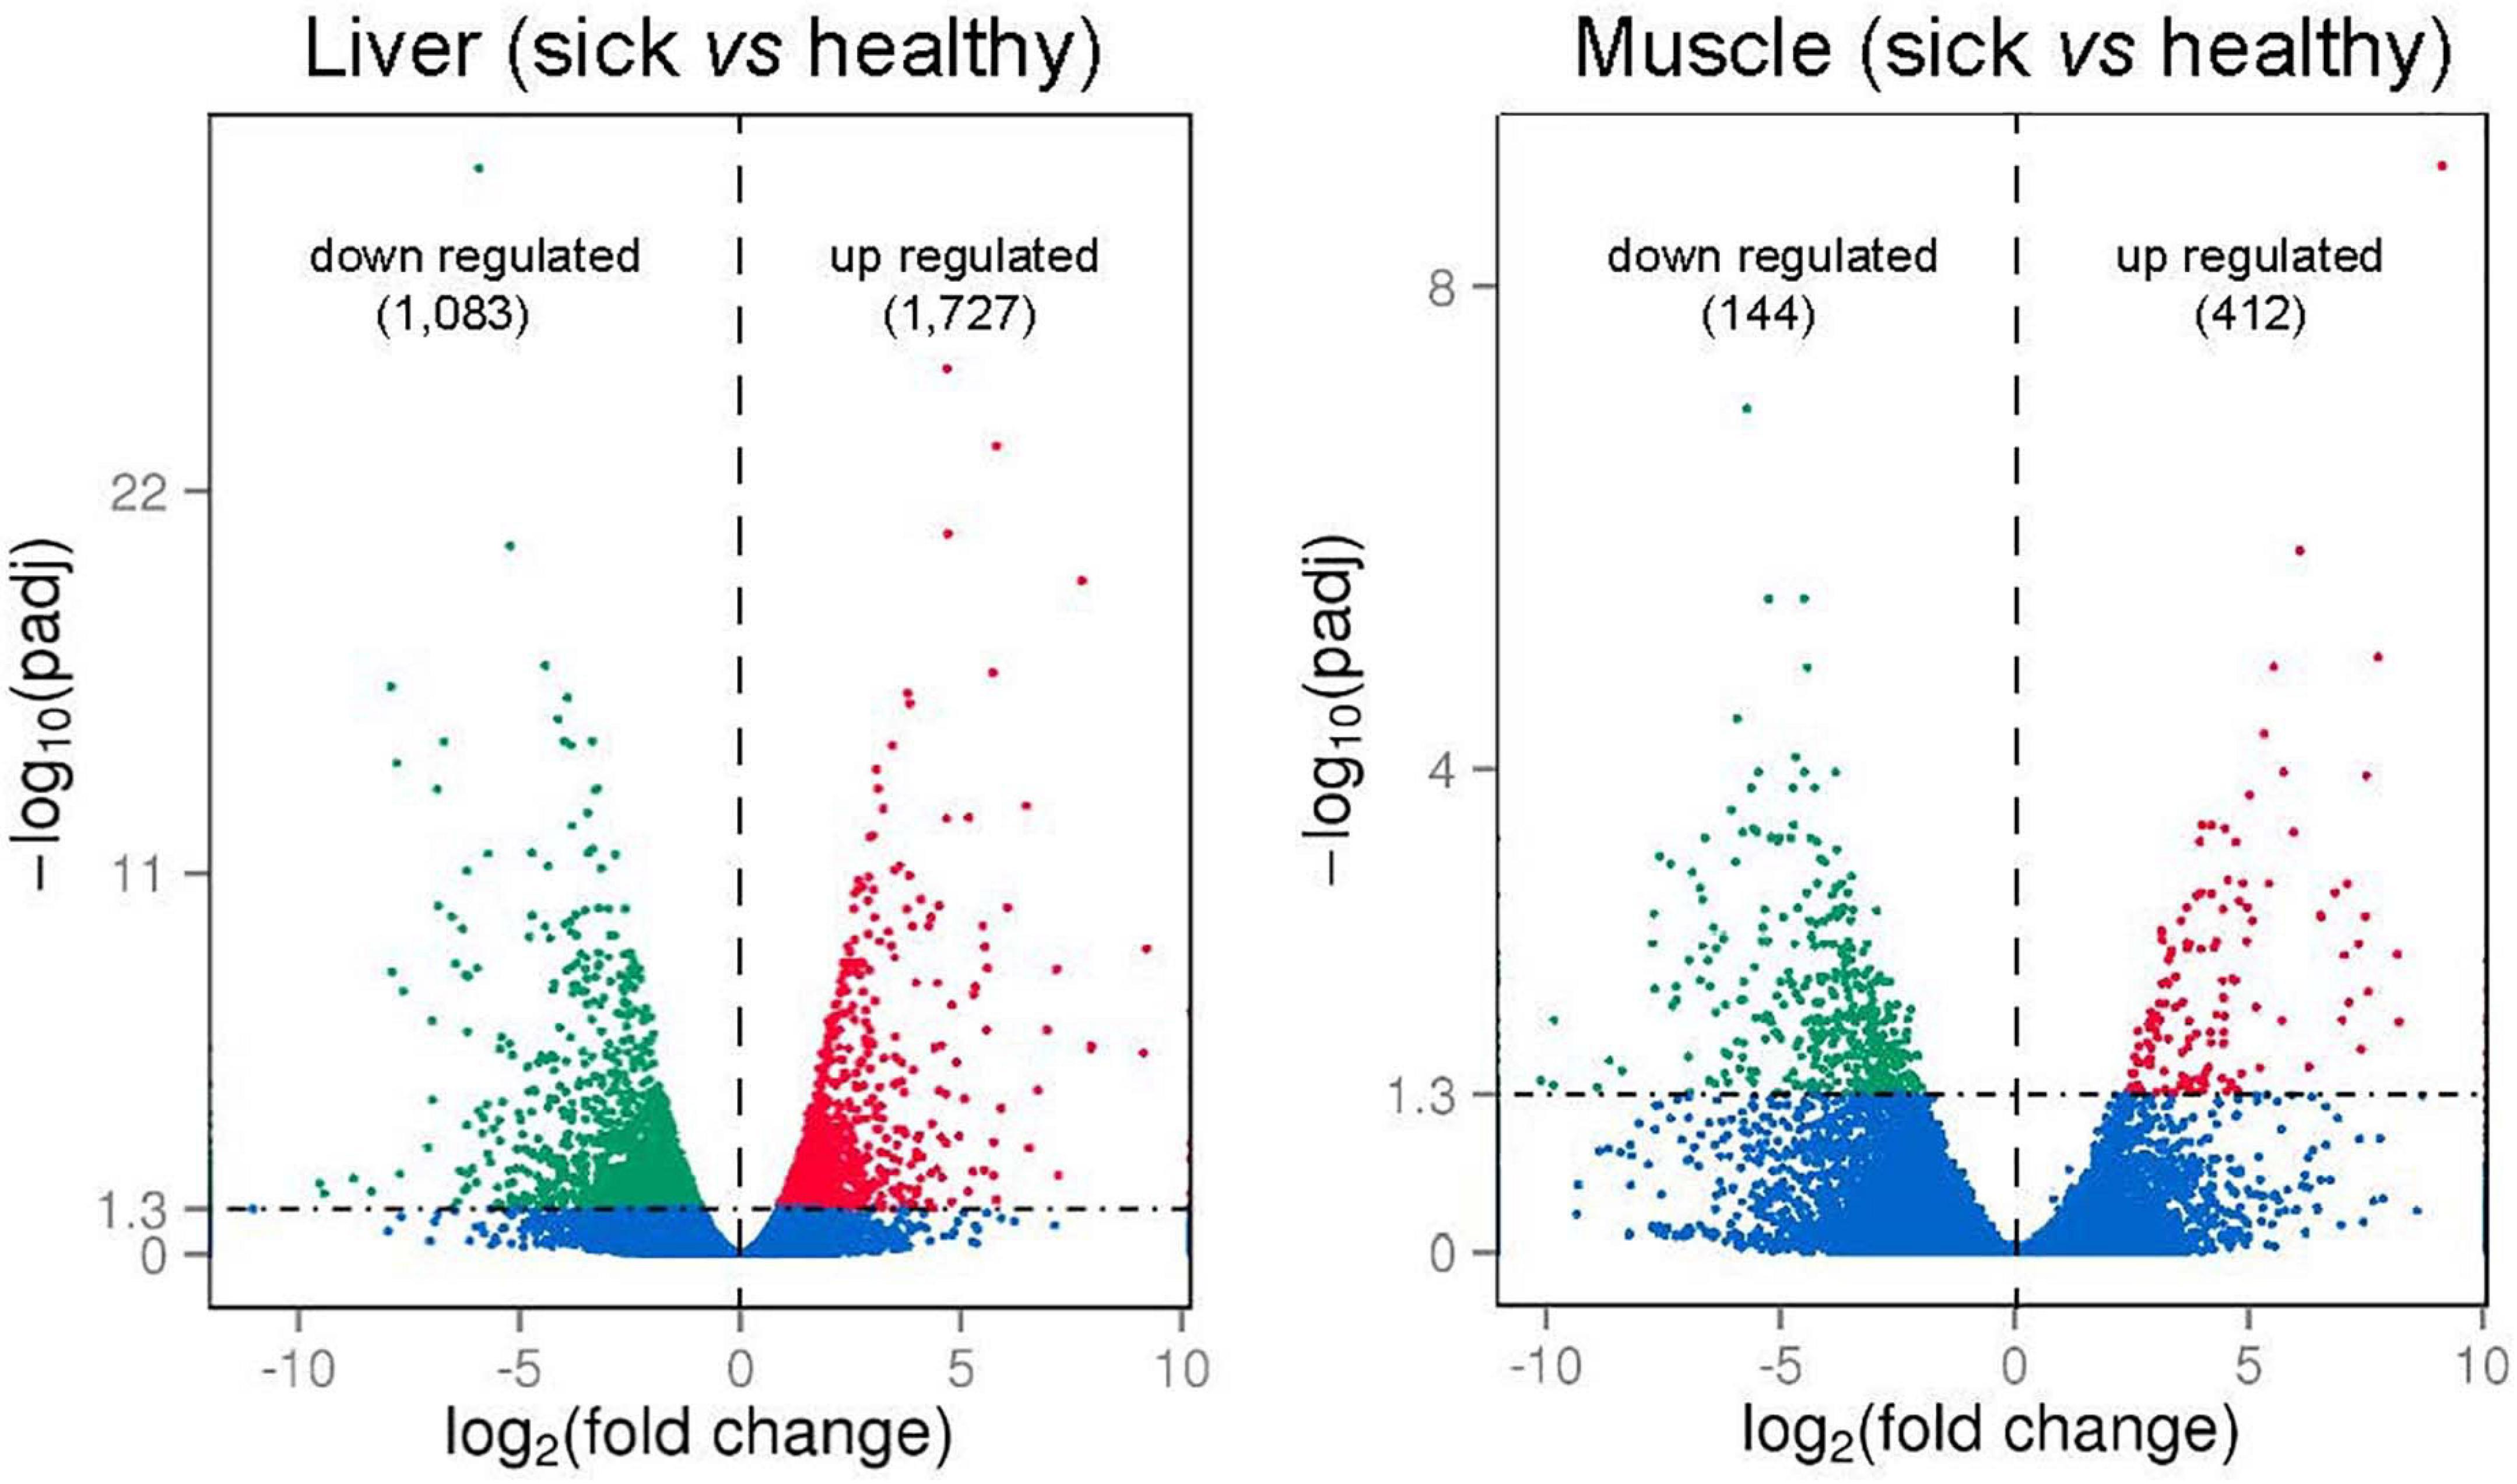
Figure 5. Volcano plots of differently expressed genes (DEGs; numbers up- or downregulated in brackets) in liver and muscle of sick vs. healthy barramundi. x-axis represents log2-transformed fold change and the y-axis indicates –log10-transformed adjusted significance. Each dot indicates an individual gene that was significantly upregulated (red), downregulated (green), and non-differentially regulated (blue). The horizontal line represents adjusted P-value (P < 0.05 cutoff).
The top 20 significantly up− or downregulated DEGs identified in liver and muscle are listed in Tables 2, 3, respectively. A number of these genes were related to inflammatory and immune responses of juvenile barramundi to viral infections. Upregulated gene expression in liver of sick fish included interleukin-1 receptor type 2-like (il-1r2l), cytokine-like protein 1 (cytl1), toll-like receptor 13 (tlr13), hepatitis A virus cellular receptor 1 homolog (havcr-1), and leucine-rich repeat-containing protein 52-like (lrrc52), whereas the complement C1q-like protein 4 (c1ql4), complement C1q tumor necrosis factor-related protein 1-like (ctrp1), phospholipase A2-like (pla2s), and retinol-binding protein 2 (rbp2) were downregulated (Table 2). In muscle of sick fish, vital components of innate immunity, including toll-like receptor 13 (tlr13) and toll-like receptor 5 (tlr5), Fc receptor-like protein 5 (fcrl5), and interleukin-1 receptor type 2-like (il-1r2) were significantly upregulated. In contrast, interferon-induced protein 44-like (ifi44l), E3 ubiquitin-protein ligase TRIM21-like (trim21), complement C1q tumor necrosis factor-related protein 1-like (ctrp1), golgi-associated plant pathogenesis-related protein 1-like (gapr-1), and G protein-coupled receptor 17 (gpr17), associated to immune response were downregulated in the muscle of sick fish (Table 3).
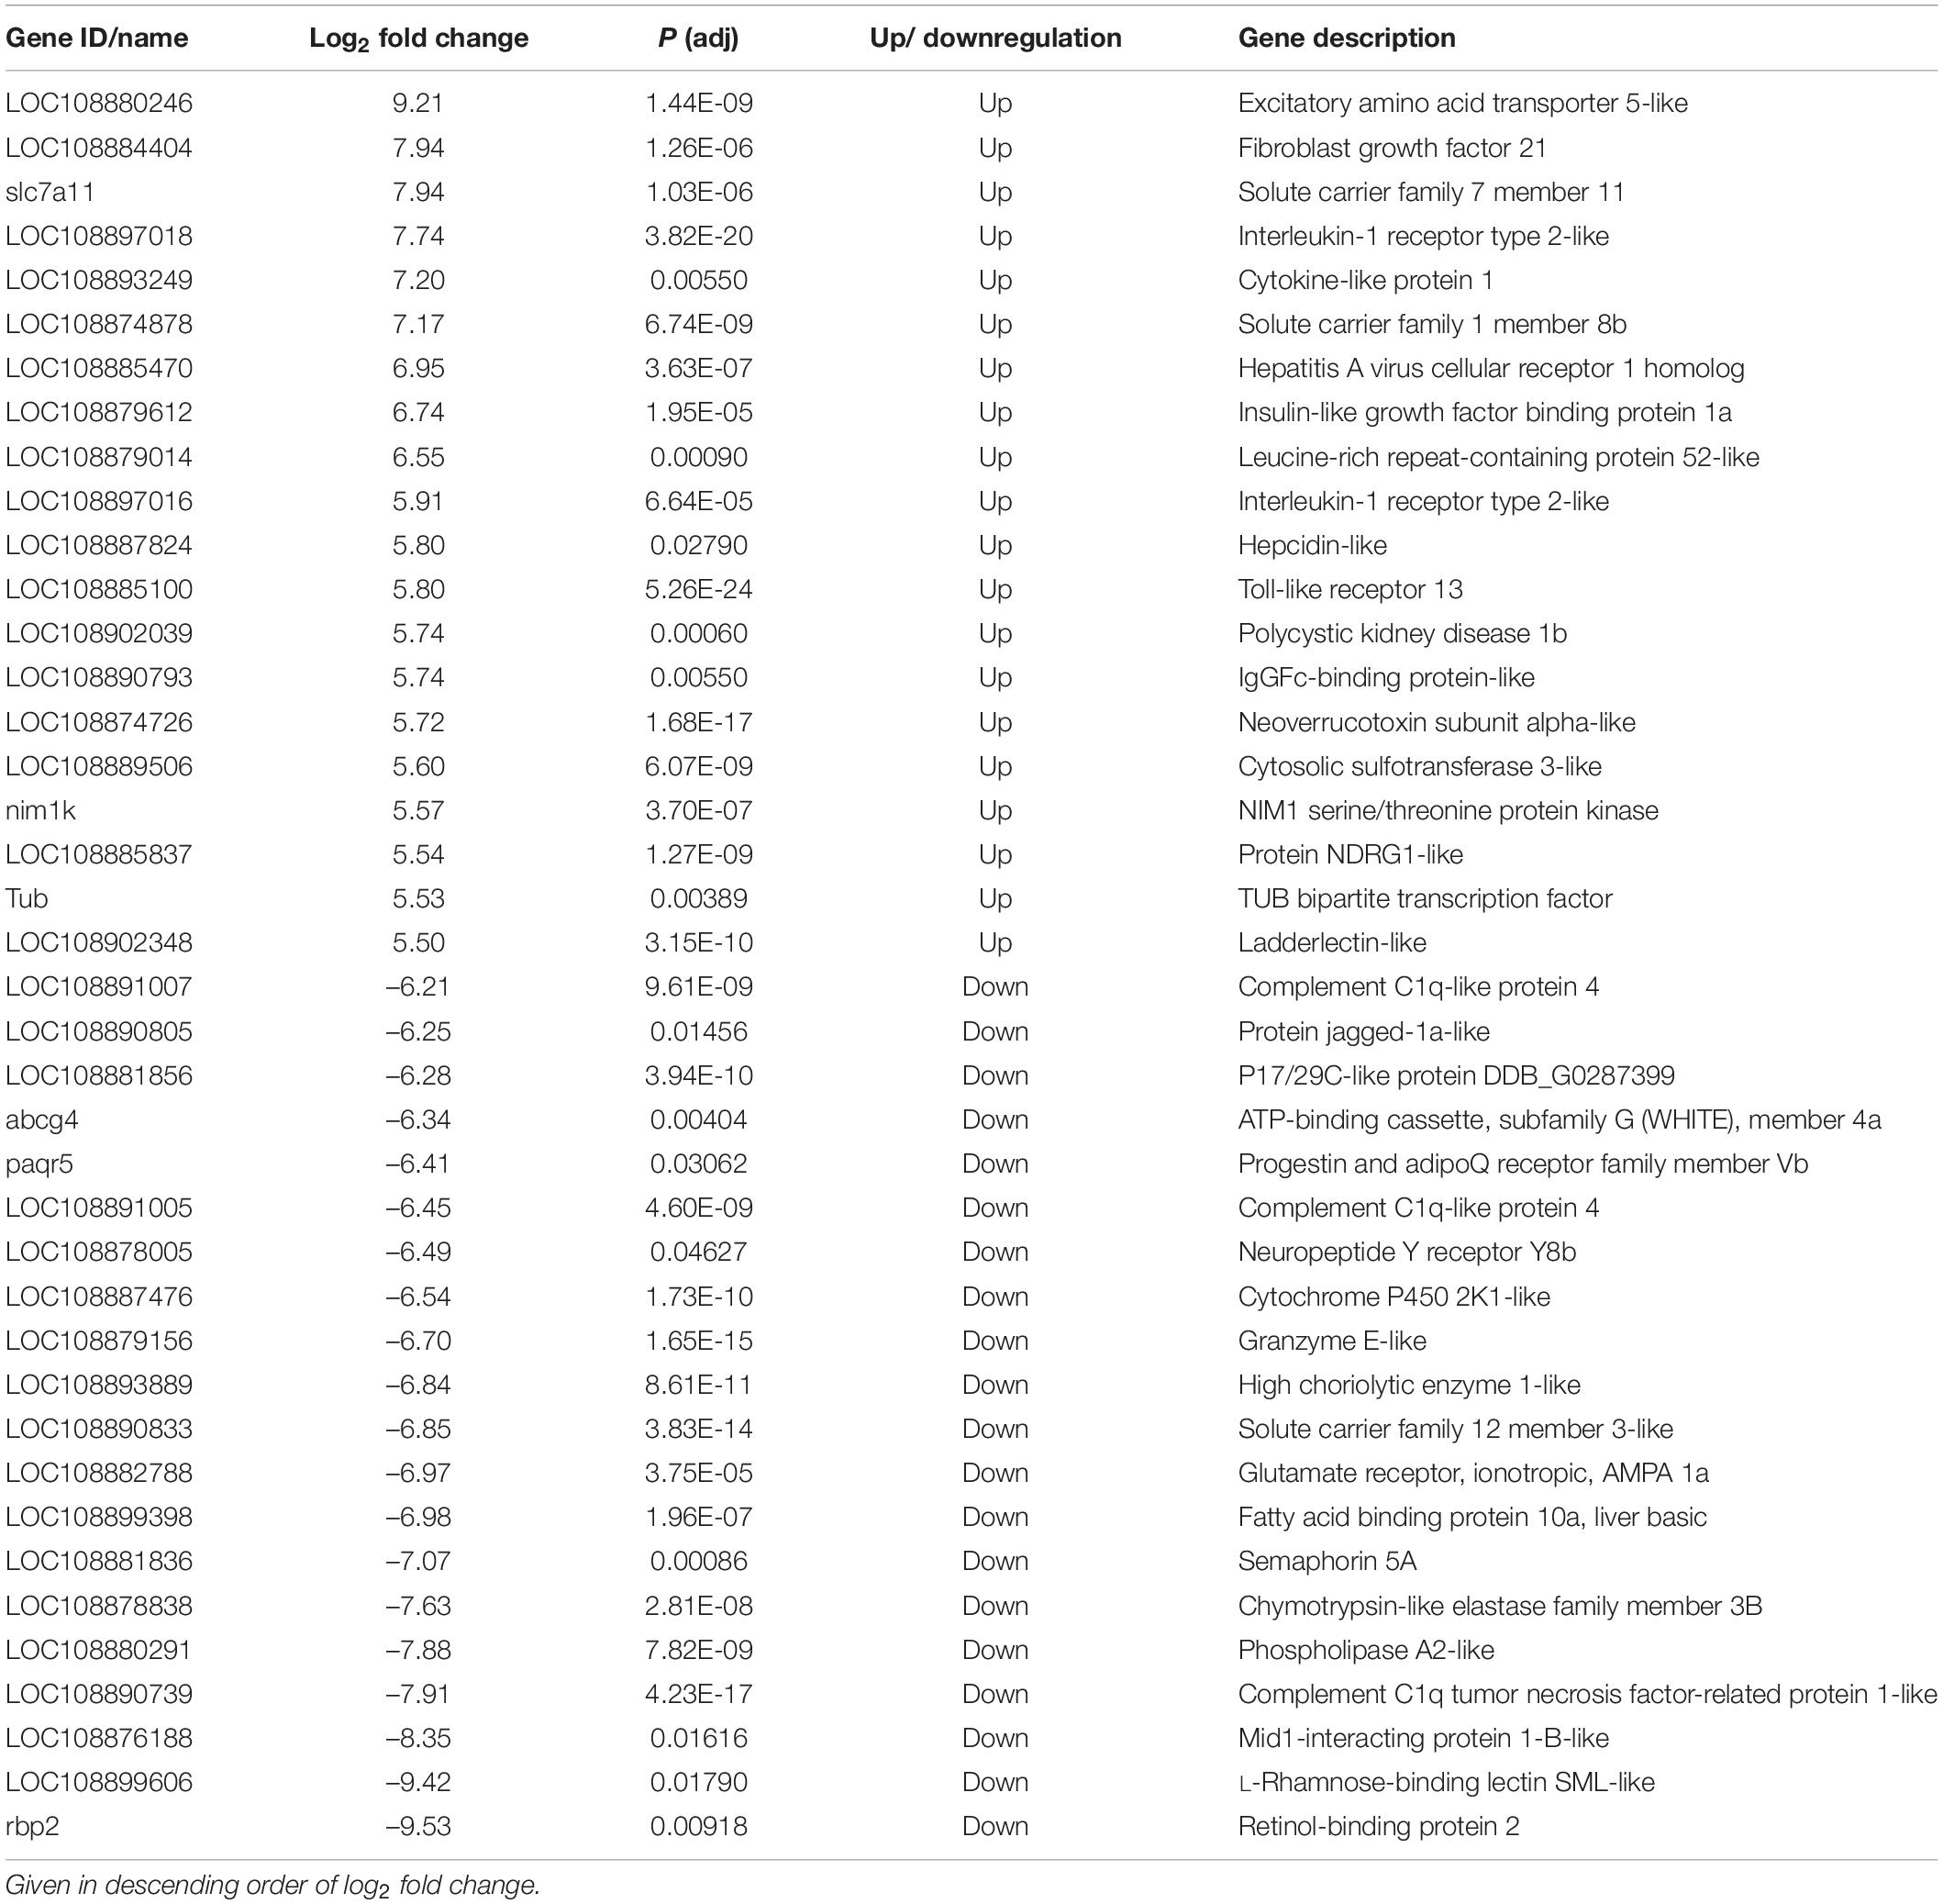
Table 2. The top 20 significantly up- or downregulated genes in liver of sick barramundi.

Table 3. The top 20 significantly up- or downregulated genes in muscle of sick barramundi.
Immune-Relevant Pathways Identified in Liver and Muscle of Farmed Barramundi
Based on the DEG findings in sick vs. healthy fish, we performed KEGG pathway classification and functional enrichment analysis. Liver DEGs were classified into a total of 141 pathways, whereby 42 pathways showed statistical significance (corrected P-value < 0.05) (Supplementary Table 6). Muscle DEGs were classified into 69 pathways, whereby four pathways were statistically significant (corrected P-value < 0.05) (Supplementary Table 7). The top 20 enriched KEGG pathways in the liver and muscle in relation to their rich factor (i.e., the ratio of DEG numbers to all gene numbers annotated in a pathway) are shown in Supplementary Figures 5, 6, respectively.
Furthermore, a total of 27 pathways relevant to innate and adaptive immunity function were identified based on 525 DEGs in the liver, whereby 10 pathways were significantly enriched. Out of those 27 immune-related pathways, 22 were also shared by 127 DEGs in the muscle, whereby four of those pathways were significantly enriched (Table 4). Based on the significance value, the phagosome was the most enriched pathway in the liver, whereas the shared ECM-receptor interaction was the most enriched pathway in the muscle. Most of these immune relevant pathways (16) were classified under environmental information processing, including cytokine-cytokine receptor interaction, calcium signaling pathway, ECM-receptor interaction, cell adhesion molecules (CAMs), neuroactive ligand-receptor interaction, and MAPK signaling pathways. According to the KEGG organismal immune system, five pathways were identified: intestinal immune network for IgA production, Toll-like receptor, cytosolic DNA-sensing, NOD-like receptor, and RIG-I-like receptor signaling pathways. In addition, DEGs were also classified under the broader pathways of endocrine and metabolic disease, infectious diseases (viral and bacterial), cell growth and death, and xenobiotics biodegradation and metabolism (Table 4).
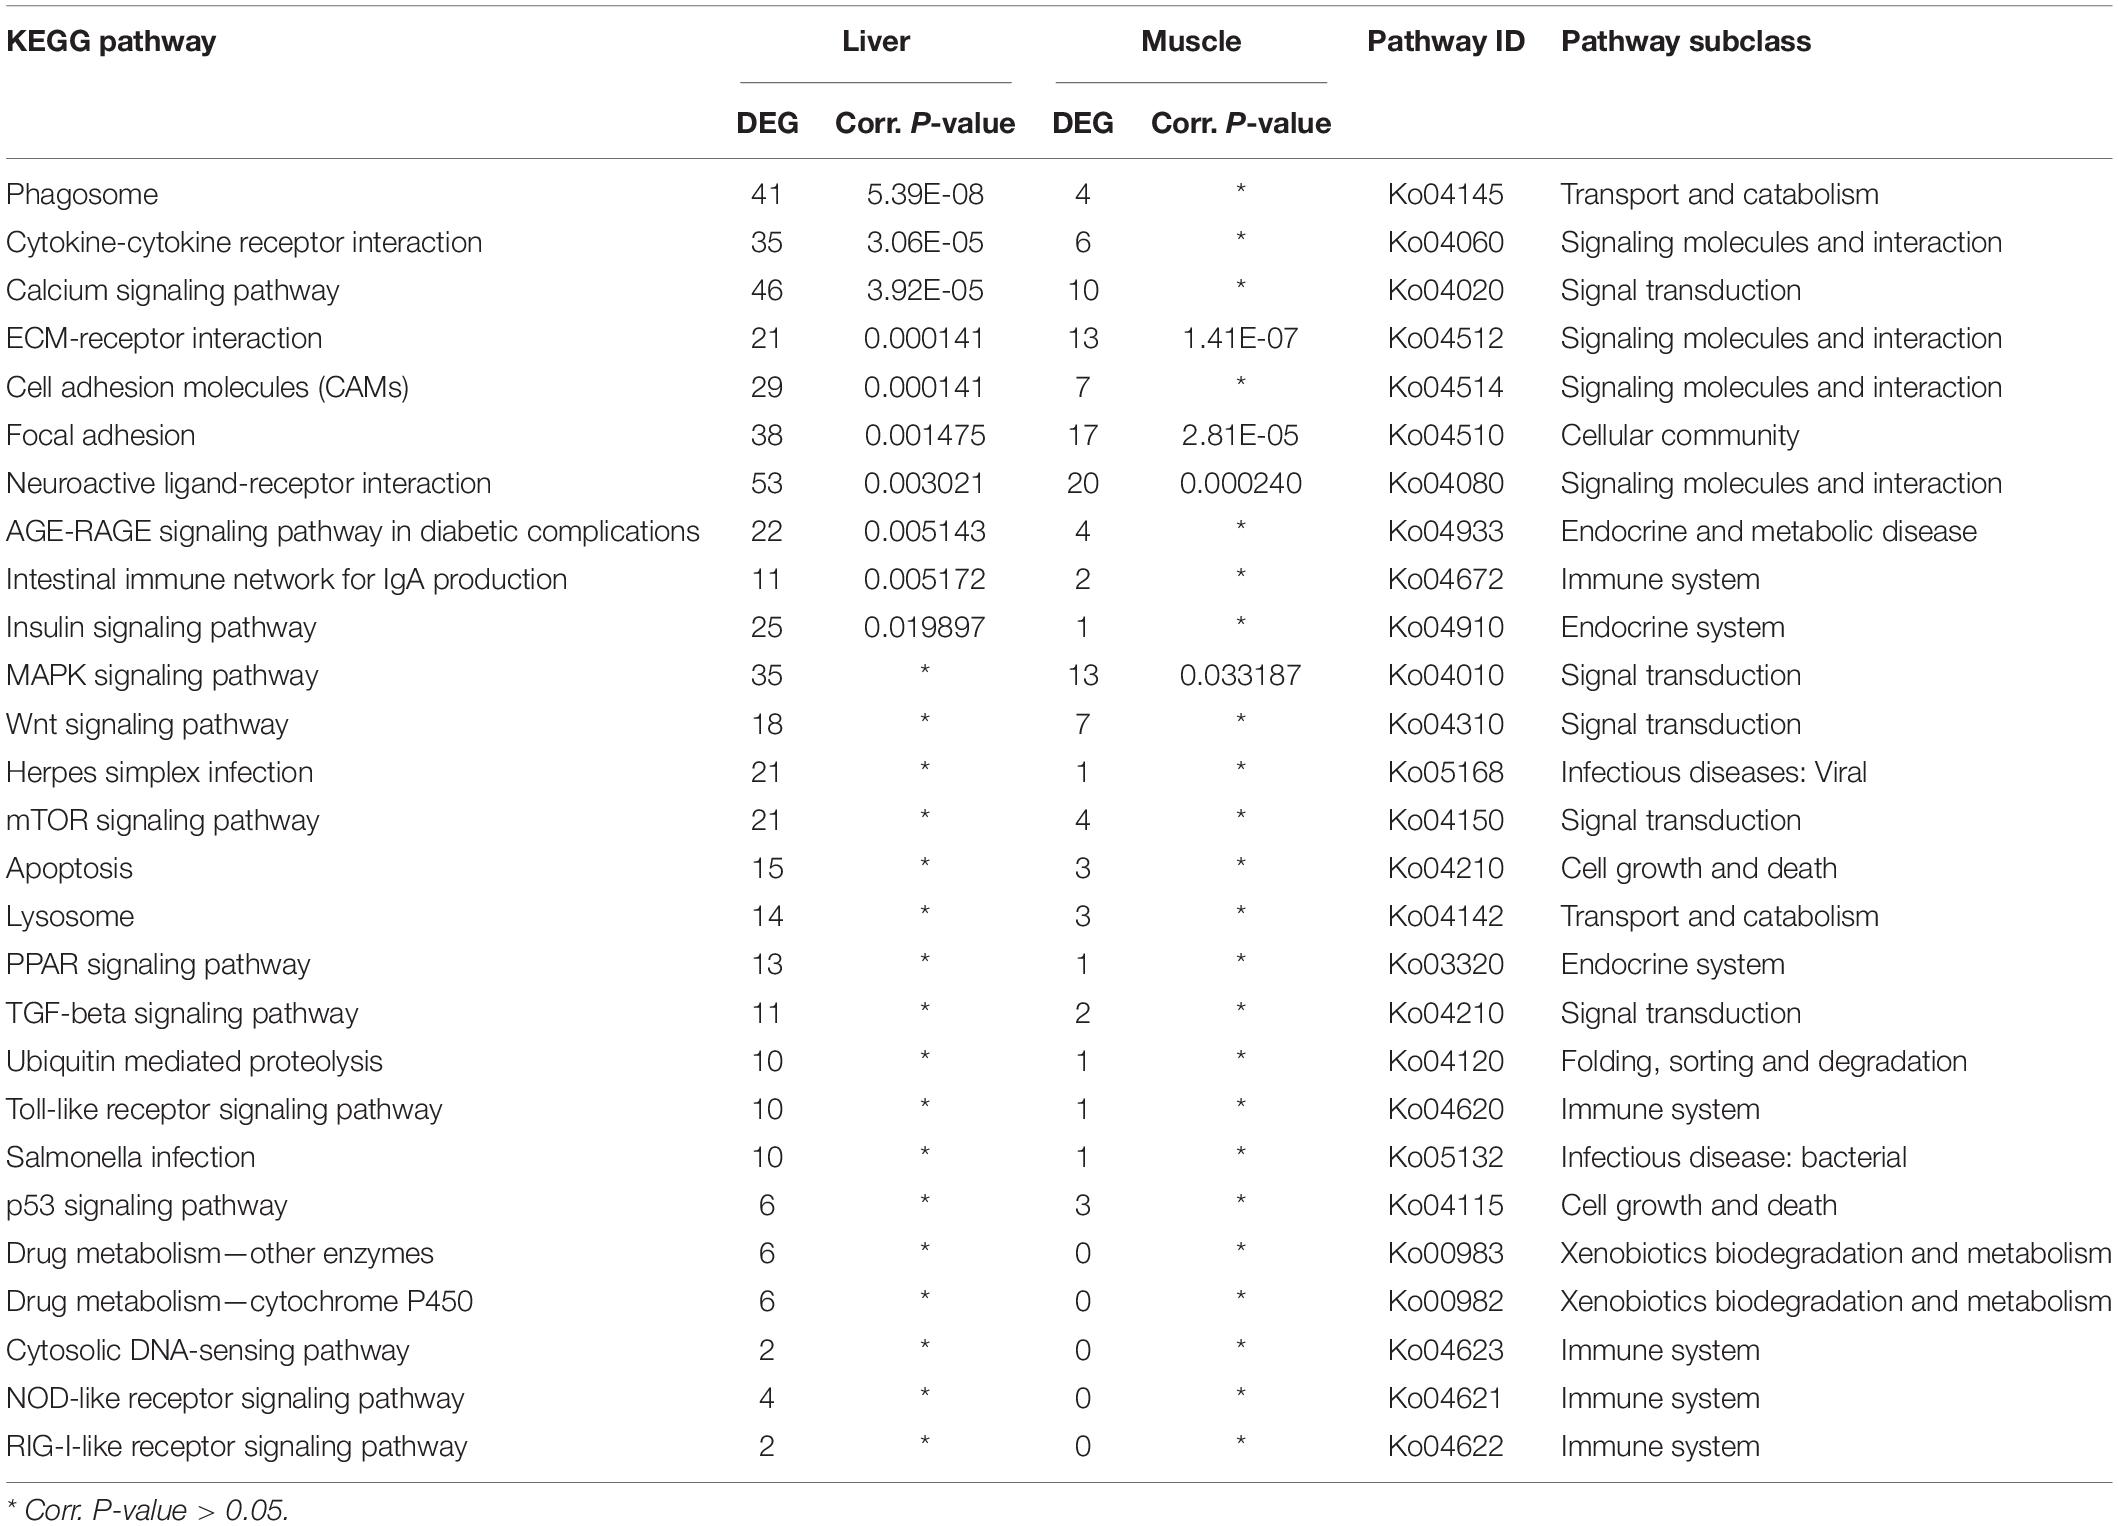
Table 4. Distribution of the differentially expressed genes in immune-relevant pathways in sick (vs. healthy) barramundi.
Key DEGs Related to Immune Responses Are Mostly Downregulated in Liver and Muscle of Sick Barramundi
DEGs associated to immune-relevant pathways are listed in Supplementary Table 8 (liver) and Supplementary Table 7 (muscle), whereas DEGs, further classified by immune relevant gene families, are presented in Table 5. About 65 and 89% of these DEGs were downregulated in the liver and in the muscle, respectively. Most genes in Table 5 are related to innate immunity: pattern recognition receptors (PRRs) including Toll-like receptors (tlr5, tlr13) and C-type lectin receptors (cl-11l, colec12, and selp); inflammatory cytokines and receptors including interleukins (il-1β, irak4, and il11a) and interleukin receptors (il13rα1, il17ra, and il1r1l), TNF including (tnfrsf11a, tnfaip3, tnfsf10l, and tnfsf12); chemokines (ccl4, ccl25b, and c-x-cl12a) and chemokines receptors (ccr7, cxcr3l, ccr6b, and ackr3b); complement factors (C3l and C1q); collagen (col4a5, col6a6, col6a3, col1a1a, col1a1b, and col2a1b); and myd88 as innate immune signal transduction adaptor CD molecules. In addition, gene families related to the adaptive immune response, identified only in the liver, such as B cell receptor CD22-like (down), and T cell tcirg1 (up) and nfatc1 (down), and major histocompatibility complex (MHC) such as h2-aa, h2-eb1, and hla-dap1 were significantly downregulated (except for tcirg1) in sick barramundi.
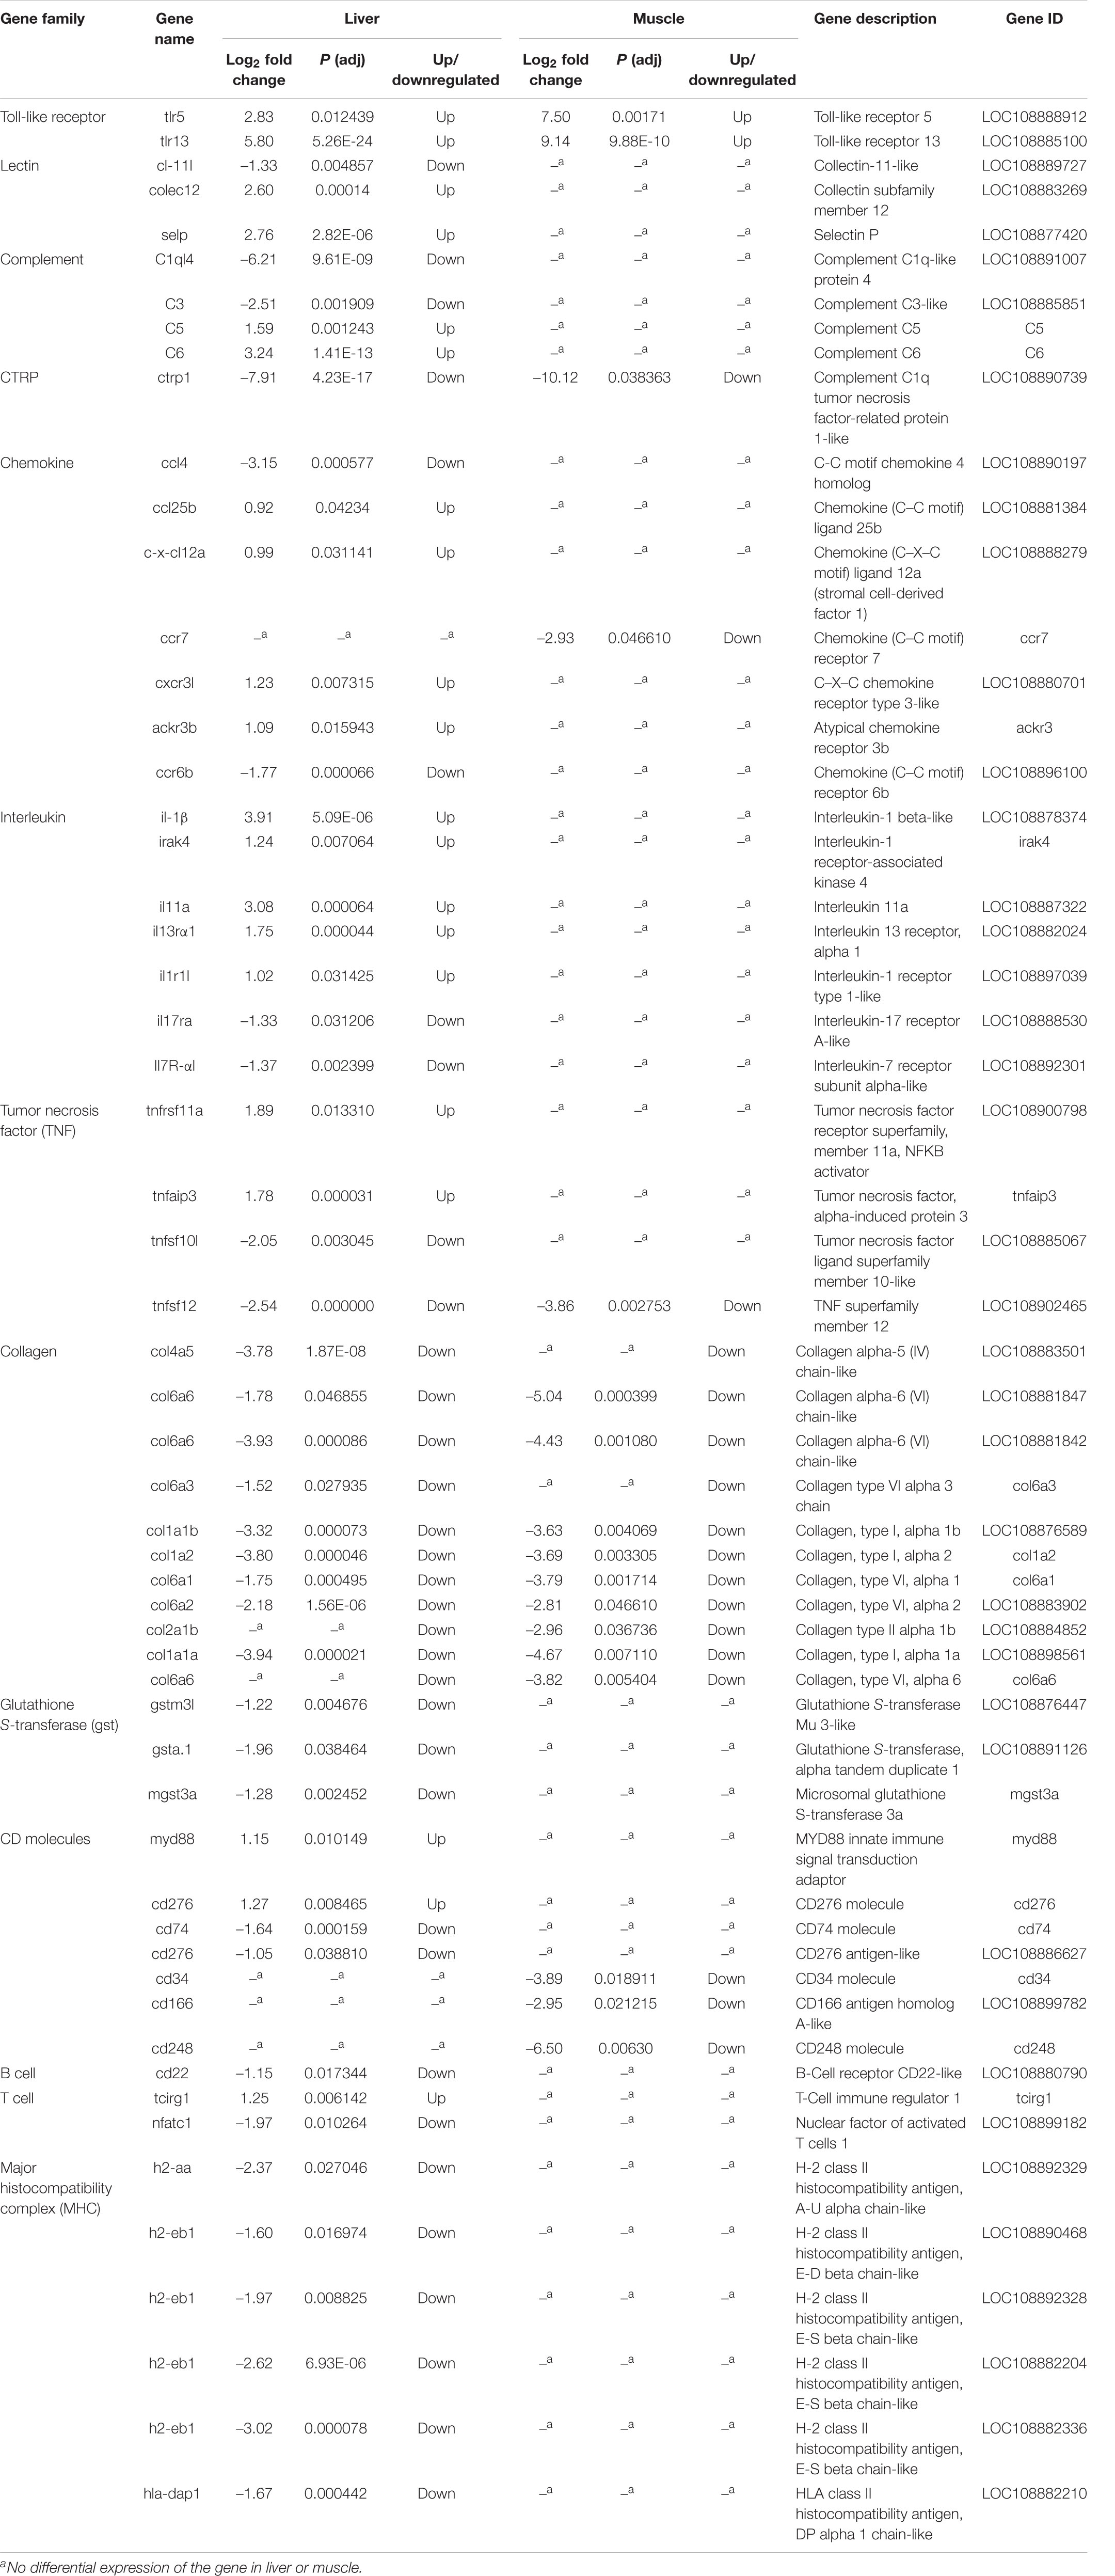
Table 5. Summary of immune-relevant genes characterized from sick (vs. healthy) barramundi based on KEGG functional analysis.
Discussion
Barramundi farming in Southeast Asia has been severely affected by disease outbreaks. In Singapore, where this particular study has taken place, farmers have reported mass mortalities of juveniles during the transition between nursery phases (∼50 to 500 g) and the final grow out period as a recurring phenomenon over the last few years. Although several novel viral pathogens (SDDV, LCHV, LCBV) affecting barramundi have been first reported and identified in Singaporean farms (Gibson-Kueh et al., 2012; de Groof et al., 2015; Chang et al., 2018; Chen et al., 2019), their occurrence is now known to extend throughout Southeast Asia (Senapin et al., 2019; Nurliyana et al., 2020; Meemetta et al., 2020), affecting the industry as a whole. To better understand what is happening to the biology of barramundi in commercial farming conditions during one such disease outbreak, the presence of five putative pathogens was investigated using a comparative RNAseq and histological approach targeting multiple organs of affected and non-affected juveniles. This study for the first time identified a concurrent infection of SDDV and LCHV in all barramundi samples (including all those apparently healthy), while ruling out infection of Megalocytivirus ISKNV/RSIV and two bacteria, T. maritimum and Vh-SDMN, which were associated with scale drop and muscle necrosis disease events in Vietnam (Dong et al., 2017b). Although lower LCHV detection in all samples were indicative of an underlying herpes viral coinfection, LCHV presence, or loading was not associated to any of the histopathological findings, or to clinical disease expression (sick/healthy groups) in the PCA. In contrast, kidney and liver SDDV loads were strongly associated with the severity of histopathological alterations observed in several organs, and sick individuals. Clinical disease, severity of pathology observed in the kidney and spleen, and viral loads support the diagnosis of primary scale drop disease, whereby apparently healthy fish were in subclinical stages while sick fish were in advanced disease stages of SDD. Furthermore, this study unveiled 2,810 and 556 differentially expressed genes in the liver and muscle respectively of sick and healthy fish, and importantly, identified immune-related pathways and genes which where predominantly downregulated in sick juveniles, thus contributing to broaden our understanding of the effects of SDD in barramundi farmed under commercial culture conditions.
The severity of tissue inflammation and necrosis in spleen and kidney of sick fish may explain why the RNA extracted from these organs were too degraded for further transcriptomic analyses. Severe and extensive tissue necrosis during the later clinical phase of SDD progression is expected to cause disruption of cellular, tissue, and organ functions. RNA is highly susceptible to degradation by reactive oxygen species (ROS), and oxidative RNA damage has been recently found to be involved in the pathogenesis of several chronic degenerative diseases (Fimognari, 2015). Barramundi spleen was the most affected organ by SDDV (and where RNA was most degraded in sick fish), followed by the kidney, liver, and muscle. In addition, histological observations from apparently healthy, but subclinically infected fish indicated that spleens are likely the first organ to be compromised by SDDV. The spleen stores erythrocytes (red pulp) and lymphocytes (white pulp) (Noga, 2006). The importance of spleen in modulating barramundi immune response and the severe damage observed in this organ may somewhat explain the inability of barramundi to fight against SDD and high mortality rates observed in farmed animals. Vaccination trials in barramundi against S. iniae revealed that spleen (but not the kidney) responded transcriptomically at 25–29 h postchallenge to activate NFK-B, chemokine, and toll-like receptor genes, whereby vaccinated fish had increased survival and reduced pathogen shedding (Jiang et al., 2014). Occlusion of splenic arteries from chronic obliterative endarteritis and subsequent multifocal splenic necrosis from infarcts are further evidence of strong non-specific innate inflammatory response and failure to control the SDDV infection. Pathology observed suggests that SDD is a chronic viral disease that develops over time (potentially weeks), before presenting as clinically diseased fish. The severe necrotizing glomerulonephritis in sick fish may be directly as a result of prolonged inflammation because of release of chemokines, interleukins, and tumor necrosis factors (TNF).
In this study, the KEGG metabolic pathway was the most enriched and significant pathway with 208 DEGs. Insulin signaling and AGE-RAGE signaling pathway in diabetic complications (among 27 immune-relevant pathways) were identified based on DEGs in sick vs. healthy fish, suggesting a disease-induced endocrine and metabolic disorder. In barramundi subjected to various stressors (LPS, V. harveyi, high salinity and fasting), DEGs associated with metabolic pathways were also notably downregulated (Xia et al., 2013). It is expected that genes associated with cellular processes and/or homeostasis will be affected by severe tissue damage during the advance stages of disease. It is likely that SDDV and underlying LCHV infections contributed to depletion of energy stores in liver from disease, when fish are stressed and stop feeding. Cortisol is known to cause insulin resistance which disrupts glucose metabolism (Kamba et al., 2016), and stress-related cortisol spikes are well described in fish (Sadoul and Geffroy, 2019). Starvation stage can cause abnormal fat accumulation in liver, from a disorder of glucose metabolism and energy for processing fat (Rui, 2014). There was consistently abnormal accumulation of fat macrovesicles in the liver (lipidosis) in all sick fish, in which functional hepatic genes (e.g., insulin-like growth factor binding protein 1a; progestin and adipoQ receptor family member Vb; glutamate receptor, ionotropic, AMPA 1a; fatty acid-binding protein 10a; phospholipase A2-like; etc.) were differentially expressed. Dietary fat is processed in the livers of fish very similarly to that in mammals, via lipoprotein conjugation and subsequent storage in adipose tissues throughout the body (Yan et al., 2015). In fact, ctrp1, a C1q/TNF-related adipokine strongly implicated in pathogenesis of non-alcoholic fatty liver disease (NAFLD), a human chronic liver disease associated with several metabolic-related disorders including insulin resistance (diabetes) and inflammation (Shabani et al., 2017), was one of the most significantly downregulated genes both in the liver and in the muscle of sick animals.
Genes associated with the adaptive immune system, in particular those involved in immune effector process, such as T cells, B cells, and the major histocompatibility complex (MHC) were also predominantly downregulated in SDD barramundi. SDDV differs from other systemic iridoviral disease, where infected cells are filled with large numbers of virions in crystalline array (Gibson-Kueh et al., 2003). In contrast, few mature virions are observed in fish with SDD using transmission electron microscopy (TEM), suggesting that SDDV infection results in the continual release of mature viral particles (Gibson-Kueh et al., 2012). It is also likely that continual viral shedding results in a prolonged inflammatory host immune response that causes severe tissue damage but fails to overcome SDDV infections. This is consistent with the observed involvement of a number of cytokines (e.g., chemokines, interleukins, and TNFs) and toll-like receptors, predominantly upregulated in SDD fish, which suggest an ongoing strong response by the innate immune system of fish in advance stages of SDD. Cytokines such as interleukins stimulate T cells, and TNF activates macrophages (Uribe et al., 2011). Toll-like receptors recognize viral infections and trigger the release of cytokines and chemokines (Xagorari and Chlichlia, 2008), a general mechanism which has also been previously observed in transcriptomic studies of barramundi infected by other pathogens such as V. harveyi (Xia et al., 2013), S. iniae (Jiang et al., 2014), and NNV (Liu et al., 2016). In the giant grouper (Epinephelus lanceolatus) infected with Vibrio alginolyticus, upregulation of the tlr5 gene leading to cytokine regulation has been suggested to induce proinflammatory and/or chemotactic effects (Wang et al., 2016). Here, tlr5 and tlr13 were significantly upregulated in both liver (8- and 33-fold) and muscle (56- and 83-fold) of sick fish, respectively. Similarly to what was observed in our study, tlr5 was upregulated by over 150-fold in spleen of barramundi challenged with S. iniae but not in vaccinated challenged fish (Jiang et al., 2014). Moreover, TLR signaling pathway has been shown ubiquitously upregulated in the intestines of barramundi after exposure to LPS, V. harveyi challenge, high salinity, and fasting (Xia et al., 2013). Taken together, these studies suggest that there is a coordinated response among several organs upregulating the TLR signaling pathway in response to pathogens, whereby our study suggests that tlr5 and tlr13 are key markers in SDD barramundi.
Lectins such as ladderlectin, L-rhamnose-binding lectin, and collectins were among the most differentially expressed genes in the livers of SDD barramundi. Lectins were identified as part of the barramundi immune response to foreign antigens (LPS) as early as 35 days posthatch (Xia and Yue, 2010). Lectins are assumed to mediate pathogen recognition, cell adhesion, the activation of complement pathway, and facilitate pathogen clearance by phagocytosis, thus playing an important role in innate immunity and disease resistance in fish (Elumalai et al., 2019). While the phagosome was the most enriched immune-related pathway in the livers of SDD barramundi, there was an overall downregulation of C3 and C1q, key complement proinflammatory genes in sick fish. Differential regulation of complement genes was observed in barramundi intestine, whereby LPS challenge upregulated C3 and downregulated C1q; the latter also downregulated at 40 h post-V. harveyi challenge (Xia et al., 2013). Complement genes coordinate the communication between the innate and the adaptive immune system (Bergman, 2011). Their activity is tightly regulated to avoid immune dysregulation and tissue damage as a consequence of excessive expression and inflammation (Wasiak et al., 2017). In giant grouper, V. alginolyticus challenge had time-dependent effects on several genes related to the complement pathway, with expression levels of most genes (including C3 and C1q) peaking between 4 and 8 h postinfection and returning to basal (preinfection) levels at 48 h postinfection (Wang et al., 2014). It is hypothesized here that the observed downregulation of C1q and C3 genes in SDD barramundi might be due to the fact that organs had already reached advanced inflammatory stages thus precluding further activation, which is not the case of apparently healthy, but subclinically SDDV- and LCHV-coinfected fish. However, the observed upregulation of C5 and C6 genes in sick fish might indicate that complement genes may be differentially activated in different phases in the animal’s immune response and disease progression.
Like in humans and other animals, collagen plays an important role in strengthening skin and its elasticity in the fish. If downregulation of collagen gene clusters in both liver and muscle of sick fish would also occur in skin tissue (not assessed in this study), it might possibly explain the observed damage in the epidermis and reduction of scale adhesion, which results in obvious scale detachment in clinically sick fish (for which SDD is known for). Systemic iridoviruses of fish target fibroblasts in connective tissues surrounding blood vessels (Gibson-Kueh et al., 2003). The inflammation in skeletal muscles involved mainly the connective tissues and not muscles, with the occasional presence of viral inclusion bodies. This is consistent with the lower number of DEGs, lower Pearson R2 values, and less evident heatmap clustering of muscle samples when compared with liver tissues between clinically sick and healthy L. calcarifer. This is also consistent with tissue predilection of systemic iridoviruses, targeting fibroblasts of mesothelial origin in all organs (Gibson-Kueh et al., 2003). The inflammation in dermis of skin is centered on the fibroblastic connective tissues of tunica adventitia of blood vessels. The marked occlusion of blood vessels would further explain infarct of epidermis of skin and scale loss characteristic of SDD, and the multifocal infarcts in spleen (Gibson-Kueh et al., 2012).
Finally, it is important to note that the transcriptomic comparison (and DEGs) between the healthy and sick fish groups evaluated in this field outbreak would likely be different if the comparison were made between the sick group and an “uninfected control group.” Such comparison would likely reveal more immune genes be identified as differentially regulated between sick and uninfected groups. Further studies investigating transcriptome of uninfected fish under laboratory conditions may be required to clarify this uncertainty. However, the data provided in this study might be an indication that SDDV (and LCHV) is currently endemic in sea-caged farmed barramundi juveniles within this site, which should also be confirmed by follow-up epidemiological surveys. This is not unlikely because in recent years, all batches farmed in the area get ubiquitously affected with SDD mortalities during the juvenile stages, whereby some animals get clinically sick and succumb to the disease, whereas others with mild infection and which look “apparently healthy” survive. Therefore, also of importance, future studies should evaluate when animals become infected after stocking, with time-series sampling plan over the course of multiple outbreaks (e.g., prior, during, and after) to better understand transcriptomic responses over the progression of disease.
In conclusion, SDDV infection (and to a lesser but unknown extent of LCHV coinfection) resulted in upregulation of genes associated with innate immunity, downregulation of genes associated with adaptive immunity and homeostatic regulation of cellular and tissue function, and severe inflammatory response that resulted in destruction of spleen followed by the kidney. Research to understand why SDD viral infection is not brought under control by the host immunity may be key to developing effective vaccines and/or immunostimulants to alleviate the effects of SDD in farmed barramundi.
Data Availability Statement
The datasets presented in this study can be found in online repositories. The names of the repository/repositories and accession number(s) can be found below: NCBI SRA (Accession: PRJNA713978).”
Ethics Statement
The animal study was reviewed and approved by the James Cook University Singapore, Animal Ethics Committee (Approval No. 2019-A07).
Author Contributions
JD and DJ contributed to conception and design of the study. CT and MT collected specimens and organized the database. SS and HD performed the molecular diagnostics. XS and JD performed the RNAseq statistical analysis. SG-K performed the histopathology analysis. JD wrote the first draft of the manuscript. All authors contributed to manuscript writing, revision, read, and approved the submitted version.
Funding
This study was funded by the Singapore Food Agency project Breeding for scale drop resistance in Barramundi Lates calcarifer—Understanding the genetic architecture of resistance to enable efficient breeding programs.
Conflict of Interest
The authors declare that the research was conducted in the absence of any commercial or financial relationships that could be construed as a potential conflict of interest.
Supplementary Material
The Supplementary Material for this article can be found online at: https://www.frontiersin.org/articles/10.3389/fgene.2021.666897/full#supplementary-material
Footnotes
- ^ https://www.ncbi.nlm.nih.gov/genome/annotation_euk/Lates_calcarifer/100/
- ^ http://www.genome.jp/kegg/
References
Anders, S., Pyl, P. T., and Huber, W. (2015). HTSeq—a python framework to work with high-throughput sequencing data. Bioinformatics 31, 166–169. doi: 10.1093/bioinformatics/btu638
Bastos Gomes, G., Hutson, K. S., Domingos, J. A., Infante Villamil, S., Huerlimann, R., Miller, T. L., et al. (2019). Parasitic protozoan interactions with bacterial microbiome in a tropical fish farm. Aquaculture 502, 196–201.
Bergman, I. M. (2011). Toll-like receptors (TLRs) and mannan-binding lectin (MBL): on constant alert in a hostile environment. Ups. J. Med. Sci. 116, 90–99.
Chang, S. F., Ng, K. S., Grisez, L., de Groof, A., Vogels, W., van der Hoek, L., et al. (2018). Novel Fish Pathogenic Virus. International publication number WO 2018/029301 A1. Geneva: World Intellectual Property Organization International Bureau.
Chen, J., Toh, X., Ong, J., Wang, Y., Teo, X.-H., Lee, B., et al. (2019). Detection and characterization of a novel marine birnavirus isolated from Asian seabass in Singapore. Virol. J. 16:71. doi: 10.1186/s12985-019-1174-0
de Groof, A., Guelen, L., Deijs, M., van der Wal, Y., Miyata, M., Ng, K. S., et al. (2015). A novel virus causes scale drop disease in lates calcarifer. PLoS Pathog. 11:e1005074. doi: 10.1371/journal.ppat.1005074
Domingos, J., Zenger, K., and Jerry, D. (2015). Whole-genome shotgun sequence assembly enables rapid gene characterization in the tropical fish barramundi, Lates calcarifer. Anim. Genet. 46, 468–469. doi: 10.1111/age.12312
Domingos, J. A., Budd, A. M., Banh, Q. Q., Goldsbury, J. A., Zenger, K. R., and Jerry, D. R. (2018). Sex-specific dmrt1 and cyp19a1 methylation and alternative splicing in gonads of the protandrous hermaphrodite barramundi. PLoS One 13:e0204182. doi: 10.1371/journal.pone.0204182
Domingos, J. A., Goldsbury, J. A., Bastos Gomes, G., Smith, B. G., Tomlinson, C., Bade, T., et al. (2021). Genotype by environment interactions of harvest growth traits for barramundi (Lates calcarifer) commercially farmed in marine vs. freshwater conditions. Aquaculture 532:735989. doi: 10.1016/j.aquaculture.2020.735989
Domingos, J. A., Smith-Keune, C., Harrison, P., and Jerry, D. R. (2014a). Early prediction of long-term family growth performance based on cellular processes — a tool to expedite the establishment of superior foundation broodstock in breeding programs. Aquaculture 428–429, 88–96. doi: 10.1016/j.aquaculture.2014.02.037
Domingos, J. A., Smith-Keune, C., and Jerry, D. R. (2014b). Fate of genetic diversity within and between generations and implications for DNA parentage analysis in selective breeding of mass spawners: a case study of commercially farmed barramundi, Lates calcarifer. Aquaculture 424–425, 174–182. doi: 10.1016/j.aquaculture.2014.01.004
Domingos, J. A., Smith-Keune, C., Robinson, N., Loughnan, S., Harrison, P., and Jerry, D. R. (2013). Heritability of harvest growth traits and genotype–environment interactions in barramundi, Lates calcarifer (Bloch). Aquaculture 402–403, 66–75. doi: 10.1016/j.aquaculture.2013.03.029
Dong, H., Jitrakorn, S., Kayansamruaj, P., Pirarat, N., Rodkhum, C., Rattanarojpong, T., et al. (2017a). Infectious spleen and kidney necrosis disease (ISKND) outbreaks in farmed barramundi (Lates calcarifer) in Vietnam. Fish Shellfish Immunol. 68, 65–73. doi: 10.1016/j.fsi.2017.06.054
Dong, H. T., Nguyen, V. V., Le, H. D., Sangsuriya, P., Jitrakorn, S., Saksmerprome, V., et al. (2015). Naturally concurrent infections of bacterial and viral pathogens in disease outbreaks in cultured Nile tilapia (Oreochromis niloticus) farms. Aquaculture 448, 427–435. doi: 10.1016/j.aquaculture.2015.06.027
Dong, H. T., Taengphu, S., Sangsuriya, P., Charoensapsri, W., Phiwsaiya, K., Sornwatana, T., et al. (2017b). Recovery of Vibrio harveyi from scale drop and muscle necrosis disease in farmed barramundi, Lates calcarifer in Vietnam. Aquaculture 473, 89–96. doi: 10.1016/j.aquaculture.2017.02.005
Elumalai, P., Rubeena, A. S., Arockiaraj, J., Wongpanya, R., Cammarata, M., Ringø, E., et al. (2019). The role of lectins in finfish: a review. Rev. Fish. Sci. Aquac. 27, 152–169. doi: 10.1080/23308249.2018.1520191
Fimognari, C. (2015). Role of oxidative RNA damage in chronic-degenerative diseases. Oxid. Med. Cell. Longev. 2015:358713. doi: 10.1155/2015/358713
Fu, G., Bai, Z., Xia, J., Liu, X., Liu, F., Wan, Z., et al. (2014). Characterization of the LECT2 gene and its associations with resistance to the big belly disease in Asian seabass. Fish Shellfish Immunol. 37, 131–138. doi: 10.1016/j.fsi.2014.01.019
Fu, G. H., Bai, Z. Y., Xia, J. H., Liu, F., Liu, P., and Yue, G. H. (2013). Analysis of two lysozyme genes and antimicrobial functions of their recombinant proteins in asian seabass. PLoS One 8:e79743. doi: 10.1371/journal.pone.0079743
Gias, E., Johnston, C., Keeling, S., Spence, R., and McDonald, W. (2011). Development of real-time PCR assays for detection of megalocytiviruses in imported ornamental fish. J. Fish Dis. 34, 609–618. doi: 10.1111/j.1365-2761.2011.01274.x
Gibson-Kueh, S., Chee, D., Chen, J., Wang, Y. H., Tay, S., Leong, L. N., et al. (2012). The pathology of ‘scale drop syndrome’ in Asian seabass, Lates calcarifer Bloch, a first description. J. Fish Dis. 35, 19–27. doi: 10.1111/j.1365-2761.2011.01319.x
Gibson-Kueh, S., Netto, P., Ngoh-Lim, G. H., Chang, S. F., Ho, L. L., Qin, Q. W., et al. (2003). The pathology of systemic iridoviral disease in fish. J. Comp. Pathol. 129, 111–119. doi: 10.1016/s0021-9975(03)00010-0
Girisha, S. K., Puneeth, T. G., Nithin, M. S., Naveen Kumar, B. T., Ajay, S. K., Vinay, T. N., et al. (2020). Red sea bream iridovirus disease (RSIVD) outbreak in Asian seabass (Lates calcarifer) cultured in open estuarine cages along the west coast of India: first report. Aquaculture 520:734712. doi: 10.1016/j.aquaculture.2019.734712
Hook, S. E., Kroon, F. J., Greenfield, P. A., Warne, M. S. J., Smith, R. A., and Turner, R. D. (2017). Hepatic transcriptomic profiles from barramundi, Lates calcarifer, as a means of assessing organism health and identifying stressors in rivers in northern Queensland. Mar. Environ. Res. 129, 166–179. doi: 10.1016/j.marenvres.2017.05.006
Ivanova, N., Zemlak, T., Hanner, R., Hebert, P., Ivanova, N. V., Zemlak, T. S., et al. (2007). Universal primer cocktails for fish DNA barcoding. Mol. Ecol. Notes 7, 544–548. doi: 10.1111/j.1471-8286.2007.01748.x
Jerry, D. R. (2013). Biology and Culture of Asian Seabass Lates Calcarifer. Baton Rouge, LA: Taylor & Francis Group, 326.
Jiang, J., Miyata, M., Chan, C., Ngoh, S. Y., Liew, W. C., Saju, J. M., et al. (2014). Differential transcriptomic response in the spleen and head kidney following vaccination and infection of asian seabass with Streptococcus iniae. PLoS One 9:e99128. doi: 10.1371/journal.pone.0099128
Kamba, A., Daimon, M., Murakami, H., Otaka, H., Matsuki, K., Sato, E., et al. (2016). Association between higher serum cortisol levels and decreased insulin secretion in a general population. PLoS One 11:e0166077. doi: 10.1371/journal.pone.0166077
Kerddee, P., Dong, H. T., Chokmangmeepisarn, P., Rodkhum, C., Srisapoome, P., Areechon, N., et al. (2020). Simultaneous detection of scale drop disease virus and Flavobacterium columnare from diseased freshwater-reared barramundi Lates calcarifer. Dis. Aquat. Org. 140, 119–128. doi: 10.3354/dao03500
Kim, D., Pertea, G., Trapnell, C., Pimentel, H., Kelley, R., and Salzberg, S. L. (2013). TopHat2: accurate alignment of transcriptomes in the presence of insertions, deletions and gene fusions. Genome Biol. 14:R36. doi: 10.1186/gb-2013-14-4-r36
Langmead, B., and Salzberg, S. L. (2012). Fast gapped-read alignment with Bowtie 2. Nat. Methods 9, 357–359. doi: 10.1038/nmeth.1923
Liu, P., Wang, L., Kwang, J., Yue, G. H., and Wong, S.-M. (2016). Transcriptome analysis of genes responding to NNV infection in Asian seabass epithelial cells. Fish Shellfish Immunol. 54, 342–352. doi: 10.1016/j.fsi.2016.04.029
Loughnan, S. R., Domingos, J. A., Smith-Keune, C., Forrester, J. P., Jerry, D. R., Beheregaray, L. B., et al. (2013). Broodstock contribution after mass spawning and size grading in barramundi (Lates calcarifer, Bloch). Aquaculture 404–405, 139–149. doi: 10.1016/j.aquaculture.2013.04.014
Loughnan, S. R., Smith-Keune, C., Beheregaray, L. B., Robinson, N. A., and Jerry, D. R. (2019). Population genetic structure of barramundi (Lates calcarifer) across the natural distribution range in Australia informs fishery management and aquaculture practices. Mar. Freshw. Res. 70, 1533–1542. doi: 10.1071/MF18330
Loughnan, S. R., Smith-Keune, C., Jerry, D. R., Beheregaray, L. B., and Robinson, N. A. (2016). Genetic diversity and relatedness estimates for captive barramundi (Lates calcarifer, Bloch) broodstock informs efforts to form a base population for selective breeding. Aquac. Res. 47, 3570–3584. doi: 10.1111/are.12807
Ma, Z., Zheng, X., Fu, Z., Lin, S., Yu, G., and Qin, J. (2020). Transcriptional analysis reveals physiological response to acute acidification stress of barramundi Lates calcarifer (Bloch) in coastal areas. Fish Physiol. Biochem. 46, 1729–1741. doi: 10.1007/s10695-020-00824-6
Mao, X., Cai, T., Olyarchuk, J. G., and Wei, L. (2005). Automated genome annotation and pathway identification using the KEGG Orthology (KO) as a controlled vocabulary. Bioinformatics 21, 3787–3793. doi: 10.1093/bioinformatics/bti430
Meemetta, W., Domingos, J. A., Dong, H. T., and Senapin, S. (2020). Development of a SYBR Green quantitative PCR assay for detection of Lates calcarifer herpesvirus (LCHV) in farmed barramundi. J. Virol. Methods 285:113920. doi: 10.1016/j.jviromet.2020.113920
Newton, J. R., Zenger, K. R., and Jerry, D. R. (2013). Next-generation transcriptome profiling reveals insights into genetic factors contributing to growth differences and temperature adaptation in Australian populations of barramundi (Lates calcarifer). Mar. Genomics 11, 45–52. doi: 10.1016/j.margen.2013.07.002
Ngoh, S. Y., Tan, D., Shen, X., Kathiresan, P., Jiang, J., Liew, W. C., et al. (2015). Nutrigenomic and nutritional analyses reveal the effects of pelleted feeds on Asian Seabass (Lates calcarifer). PLoS One 10:e0145456. doi: 10.1371/journal.pone.0145456
Nguyen, V. V., Rodkhum, C., Senapin, S., and Dong, H. T. (2019). Retrospective diagnosis of archived marine fish experienced unexplained mortality reveals dual infections of Nocardia seriolae and Streptococcus iniae. Aquac. Int. 27, 1503–1512. doi: 10.1007/s10499-019-00403-4
Noga, E. J. (2006). “Spleen, thymus, reticulo-endothelial system, blood,” in Systemic Pathology of Fish: A Text and Atlas of Normal Tissues in Teleosts and Their Responses in Disease, ed. H. W. Ferguson (London: Scotian Press), 120–139. 366p.
Nurliyana, M., Lukman, B., Ina-Salwany, M. Y., Zamri-Saad, M., Annas, S., Dong, H. T., et al. (2020). First evidence of scale drop disease virus in farmed Asian seabass (Lates calcarifer) in Malaysia. Aquaculture 528:735600. doi: 10.1016/j.aquaculture.2020.735600
Ravi, P., Jiang, J., Liew, W. C., and Orbán, L. (2014). Small-scale transcriptomics reveals differences among gonadal stages in Asian seabass (Lates calcarifer). Reprod. Biol. Endocrinol. 12:5. doi: 10.1186/1477-7827-12-5
Rui, L. (2014). Energy metabolism in the liver. Compr. Physiol. 4, 177–197. doi: 10.1002/cphy.c130024
Sadoul, B., and Geffroy, B. (2019). Measuring cortisol, the major stress hormone in fishes. J. Fish Biol. 94, 540–555. doi: 10.1111/jfb.13904
Senapin, S., Dong, H. T., Meemetta, W., Gangnonngiw, W., Sangsuriya, P., Vanichviriyakit, R., et al. (2019). Mortality from scale drop disease in farmed Lates calcarifer in Southeast Asia. J. Fish Dis. 42, 119–127. doi: 10.1111/jfd.12915
Shabani, P., Emamgholipour, S., and Doosti, M. (2017). CTRP1 in liver disease. Adv. Clin. Chem. 79, 1–23. doi: 10.1016/bs.acc.2016.10.002
Sriisan, S., Boonchird, C., Thitamadee, S., Sonthi, M., Thanh Dong, H., and Senapin, S. (2020). A sensitive and specific SYBR Green-based qPCR assay for detecting scale drop disease virus (SDDV) in Asian sea bass. Dis. Aquat. Organ. 139, 131–137. doi: 10.3354/dao03484
Sudhagar, A., Kumar, G., and El-Matbouli, M. (2018). Transcriptome analysis based on RNA-Seq in understanding pathogenic mechanisms of diseases and the immune system of fish: a comprehensive review. Int. J. Mol. Sci. 19:245. doi: 10.3390/ijms19010245
Sun, F., Wen, Y., Wang, L., and Yue, G. H. (2020). An indel in the Suv39h1 gene is associated with resistance to iridovirus in the Asian seabass. Aquaculture 529:735611. doi: 10.1016/j.aquaculture.2020.735611
Thevasagayam, N. M., Sridatta, P. S. R., Jiang, J., Tong, A., Saju, J. M., Kathiresan, P., et al. (2015). Transcriptome survey of a marine food fish: Asian Seabass (Lates calcarifer). J. Mar. Sci. Eng. 3, 382–400. doi: 10.3390/jmse3020382
Toyama, T., Kita-Tsukamoto, K., and Wakabayashi, H. (1996). Identification of Flexibacter maritimus, Flavobacterium branchiophilum and Cytophaga columnaris by PCR targeted 16S ribosomal DNA. Fish Pathol. 31, 25–31. doi: 10.3147/jsfp.31.25
Uribe, C., Folch, H., Enríquez, R., and Moran, G. (2011). Innate and adaptive immunity in teleost fish: a review. Vet. Med. 56, 486–503. doi: 10.17221/3294-VETMED
Vij, S., Kuhl, H., Kuznetsova, I. S., Komissarov, A., Yurchenko, A. A., Van Heusden, P., et al. (2016). Correction: chromosomal-level assembly of the Asian seabass genome using long sequence reads and multi-layered scaffolding. PLoS Genet. 12:e1005954. doi: 10.1371/journal.pgen.1005954
Vij, S., Purushothaman, K., Sridatta, P. S., and Jerry, D. R. (2020). Transcriptomic analysis of gill and kidney from Asian seabass (Lates calcarifer) acclimated to different salinities reveals pathways involved with euryhalinity. Genes 11:733. doi: 10.3390/genes11070733
Wang, L., Bai, B., Huang, S., Liu, P., Wan, Z. Y., Ye, B., et al. (2017a). QTL mapping for resistance to iridovirus in Asian seabass using genotyping-by-sequencing. Mar. Biotechnol. 19, 517–527. doi: 10.1007/s10126-017-9770-8
Wang, L., Bai, B., Liu, P., Huang, S. Q., Wan, Z. Y., Chua, E., et al. (2017b). Construction of high-resolution recombination maps in Asian seabass. BMC Genomics 18:63. doi: 10.1186/s12864-016-3462-z
Wang, L., Feng, Z., Wang, X., Wang, X., and Zhang, X. (2010). DEGseq: an R package for identifying differentially expressed genes from RNA-seq data. Bioinformatics 26, 136–138. doi: 10.1093/bioinformatics/btp612
Wang, L., Huang, S. Q., Xia, J. H., Liu, P., Wan, Z. Y., and Yue, G. H. (2015a). Genome-wide discovery of gene-related SNPs in Barramundi Lates calcarifer. Conserv. Genet. Resour. 7, 605–608. doi: 10.1007/s12686-015-0444-4
Wang, L., Wan, Z. Y., Bai, B., Huang, S. Q., Chua, E., Lee, M., et al. (2015b). Construction of a high-density linkage map and fine mapping of QTL for growth in Asian seabass. Sci. Rep. 5:16358. doi: 10.1038/srep16358
Wang, Y. D., Huang, S. J., Chou, H. N., Liao, W. L., Gong, H. Y., and Chen, J. Y. (2014). Transcriptome analysis of the effect of Vibrio alginolyticus infection on the innate immunity-related complement pathway in Epinephelus coioides. BMC Genomics 15:1102. doi: 10.1186/1471-2164-15-1102
Wang, Y. D., Wang, Y. H., Hui, C. F., and Chen, J. Y. (2016). Transcriptome analysis of the effect of Vibrio alginolyticus infection on the innate immunity-related TLR5-mediated induction of cytokines in Epinephelus lanceolatus. Fish Shellfish Immunol. 52, 31–43. doi: 10.1016/j.fsi.2016.03.013
Wasiak, S., Gilham, D., Tsujikawa, L. M., Halliday, C., Calosing, C., Jahagirdar, R., et al. (2017). Downregulation of the complement cascade in vitro, in mice and in patients with cardiovascular disease by the BET protein inhibitor apabetalone (RVX-208). J. Cardiovasc. Transl. Res. 10, 337–347. doi: 10.1007/s12265-017-9755-z
Wu, Y. C., Kai, Y. H., and Chi, S. C. (2013). Persistently betanodavirus-infected barramundi (Lates calcarifer) exhibit resistances to red sea bream iridovirus infection. Dev. Comp. Immunol. 41, 666–674. doi: 10.1016/j.dci.2013.06.011
Xagorari, A., and Chlichlia, K. (2008). Toll-like receptors and viruses: induction of innate antiviral immune responses. Open Microbiol. J. 2, 49–59. doi: 10.2174/1874285800802010049
Xia, J. H., He, X. P., Bai, Z. Y., Lin, G., and Yue, G. H. (2011). Analysis of the Asian seabass transcriptome based on expressed sequence tags. DNA Res. 18, 513–522. doi: 10.1093/dnares/dsr036
Xia, J. H., Liu, P., Liu, F., Lin, G., Sun, F., Tu, R., et al. (2013). Analysis of stress-responsive transcriptome in the intestine of Asian seabass (Lates calcarifer) using RNA-seq. DNA Res. 20, 449–460. doi: 10.1093/dnares/dst022
Xia, J. H., and Yue, G. H. (2010). Identification and analysis of immune-related transcriptome in Asian seabass Lates calcarifer. BMC Genomics 11:356. doi: 10.1186/1471-2164-11-356
Yan, J., Liao, K., Wang, T., Mai, K., Xu, W., and Ai, Q. (2015). Dietary lipid levels influence lipid deposition in the liver of large yellow croaker (Larimichthys crocea) by regulating lipoprotein receptors, fatty acid uptake and triacylglycerol synthesis and catabolism at the transcriptional level. PLoS One 10:e0129937. doi: 10.1371/journal.pone.0129937
Young, M. D., Wakefield, M. J., Smyth, G. K., and Oshlack, A. (2010). Gene ontology analysis for RNA-seq: accounting for selection bias. Genome Biol. 11:R14. doi: 10.1186/gb-2010-11-2-r14
Yue, G. H., Zhu, Z., Lo, L., Wang, C., Lin, G., Feng, F., et al. (2009). Genetic variation and population structure of Asian seabass (Lates calcarifer) in the Asia-Pacific region. Aquaculture 293, 22–28. doi: 10.1016/j.aquaculture.2009.03.053
Zhu, Z. Y., Lin, G., Lo, L. C., Xu, Y. X., Feng, F., Chou, R., et al. (2006a). Genetic analyses of Asian seabass stocks using novel polymorphic microsatellites. Aquaculture 256, 167–173. doi: 10.1016/j.aquaculture.2006.02.033
Keywords: transcriptome (RNA-seq), Lates calcarifer herpes virus, immunity, disease outbreak, scale drop disease virus, Asian sea bass (Lates calcarifer)
Citation: Domingos JA, Shen X, Terence C, Senapin S, Dong HT, Tan MR, Gibson-Kueh S and Jerry DR (2021) Scale Drop Disease Virus (SDDV) and Lates calcarifer Herpes Virus (LCHV) Coinfection Downregulate Immune-Relevant Pathways and Cause Splenic and Kidney Necrosis in Barramundi Under Commercial Farming Conditions. Front. Genet. 12:666897. doi: 10.3389/fgene.2021.666897
Received: 11 February 2021; Accepted: 19 May 2021;
Published: 18 June 2021.
Edited by:
Peng Xu, Xiamen University, ChinaReviewed by:
Channarong Rodkhum, Chulalongkorn University, ThailandShengfeng Huang, Sun Yat-sen University, China
Copyright © 2021 Domingos, Shen, Terence, Senapin, Dong, Tan, Gibson-Kueh and Jerry. This is an open-access article distributed under the terms of the Creative Commons Attribution License (CC BY). The use, distribution or reproduction in other forums is permitted, provided the original author(s) and the copyright owner(s) are credited and that the original publication in this journal is cited, in accordance with accepted academic practice. No use, distribution or reproduction is permitted which does not comply with these terms.
*Correspondence: Jose A. Domingos, am9zZS5kb21pbmdvczFAamN1LmVkdS5hdQ==