 Xiaoping Xu
 Zhenglan Zhong
 Yongxiang Shao1
 Yong Yi
- 1Department of Neurosurgery, The Second People’s Hospital of Yibin, Yibin, China
- 2Department of Health Examination, The Second People’s Hospital of Yibin, Yibin, China
Accumulating evidence has revealed that dysregulated lncRNA expression contributes to the onset and progression of cancer. However, the mechanistic role of lncRNA in glioma progression and tumor immunology remains largely unknown. This study aimed to evaluate the significance of maternally expressed gene 3 (MEG3) in the prognosis of and its immune-related roles in gliomas. The expression levels of MEG3 were analyzed using Oncomine and TIMER database. As an important imprinted gene, the copy number variation (CNV) of MEG3 in both glioblastoma multiforme (GBM) and low-grade glioma (LGG) were analyzed using GSCALite database, whereas its prognostic significance was assessed using PrognoScan and GEPIA databases. The relationship between MEG3 and tumor-infiltrated immune cells was analyzed using TIMER. Results showed that MEG3 expression was lower in most of the human cancer tissues than in the normal tissues. We also found that heterozygous deletion of MEG3 occurred more frequent than heterozygous amplification in gliomas, and mRNA expression of MEG3 was significantly positively correlated with its CNV in both the GBM and LGG group. Survival analysis showed that the CNV level of MEG3 had significant correlation with overall survival (OS) and progression-free survival (PFS) compared with wild type in LGG. Lower MEG3 expression was related with poor prognosis. Further analysis showed that in GBM, MEG3 expression level was significantly positively correlated with that of infiltrating CD8+ T cells and significantly negatively correlated with that of infiltrating dendritic cells. In LGG, MEG3 expression level was significantly negatively correlated with levels of infiltrating B cells, CD8+ T cells, CD4+ T cells, macrophages, neutrophils, and dendritic cells. Univariate Cox survival analysis demonstrated that only the level of infiltrating dendritic cells significantly affected the survival time of patients with GBM, while all six types of immune cells had a significant effect on the survival time of patients with LGG. Furthermore, MEG3 expression showed strong correlations with multiple immune markers in gliomas, especially in LGG. The current findings suggest that MEG3 expression might serve as a possible prognostic marker and potential immunotherapeutic target for gliomas.
Introduction
Glioma is the most common primary malignant tumor of the brain. Despite many breakthrough analyses deciphering the underlying molecular mechanisms of gliomas, comprehensive treatment options are still lacking and the long-term survival rate of glioma patients remains poor. The molecular complexity and unique microenvironment in the brain that lead to therapeutic resistance, disease progression, and tumor recurrence add to the challenges of glioma treatment. Efforts are under way to uncover key molecular mechanisms, which may lead to the development of new therapeutics for glioma patients.
Long non-coding RNA (lncRNA) is an RNA with a length of more than 200 nt. It is known to play an important role in carcinogenesis and cancer progression. Accumulating evidence has revealed that dysregulated lncRNA expression contributes to the development and metastasis of tumors (Pan et al., 2020). However, the mechanistic role of lncRNA in glioma progression and tumor immunology remains largely unknown. Maternally expressed gene 3 (MEG3), also known as gene-trap locus 2 (GTL2), is an imprinted gene. It is highly expressed in the brain, pituitary gland, placenta, and adrenal gland. MEG3 has been reported to participate in the regulation of a variety of diseases. The first evidences of the contribution of MEG3 in human cancers were obtained from pituitary non-functioning adenomas (Zhou et al., 2012). Several studies have shown downregulation of MEG3 in human cancers, such as breast cancer (Zhang et al., 2016), liver cancer (Zheng et al., 2018), gliomas (Zhang et al., 2017), lung cancer (Wu et al., 2018), squamous cell carcinoma (Sahin et al., 2017), and gastrointestinal cancer (Sun et al., 2014). It was found that MEG3 expression was significantly reduced or completely lost in 25% of neuroblastomas (Astuti et al., 2005), 81% of hepatocellular cancers (Braconi et al., 2011), and 82% of gliomas (Wang et al., 2012). A recent meta-analysis has also shown a correlation between MEG3 downregulation and poor patient outcomes (Binabaj et al., 2018).
The tumor microenvironment is now widely accepted as an important regulator of cancer progression and therapeutic response (Klemm et al., 2020). Previous studies have highlighted the association between immune cells and lncRNAs, which are responsible for differentiation, development, and activation of immune cells (Mumtaz et al., 2017). The role of lncRNAs as regulators in the immune modulation of cancer is emerging (Atianand et al., 2017; Denaro et al., 2019). Recent studies indicate that MEG3 is involved in the regulation of CD4+ T cell activation in aplastic anemia (Wang et al., 2019) and the expression level of PD-L1 in aggressive endometrial cancer (Xu et al., 2020). However, to the best of our knowledge, the immune-specific functions of MEG3 expression in gliomas have not yet been evaluated. The success of immunotherapies (Lim et al., 2018; Schalper et al., 2019) calls for the evaluation of the role of MEG3 in gliomas. Hence, we conducted the present bioinformatics study to detect the expression levels of MEG3 in gliomas using Oncomine and “Tumor Immune Estimation Resource (TIMER)” databases, analyze CNV using GSCALite database, and analyze its prognostic significance using PrognoScan and “Gene Expression Profiling Interactive Analysis (GEPIA)” databases. We further investigated the correlation between MEG3 expression and immune cell infiltration in gliomas by using the TIMER database.
Materials and Methods
Gene Expression Analysis
The gene expression level of MEG3 in various cancers was analyzed using Oncomine (Rhodes et al., 2004)1 and TIMER (Li et al., 2017)2 databases. The parameters were set as follows in the Oncomine database: P-value of 0.001, fold change of 2, and gene ranking of top 10%, six studies meeting the criteria were included for further analysis, including TCGA Brain, Sun Brain (Sun et al., 2006), Murat Brain (Murat et al., 2008), Bredel Brain2 (Bredel et al., 2005), Liang Brain (Liang et al., 2005), and Shai Brain (Shai et al., 2003). These studies reported a total of 955 cases, of which 932 are primary tumor samples, and 904 samples have MEG3 profile data. We further evaluated the expression level of MEG3 using TIMER (P < 0.05).
Copy Number Variation (CNV) Analysis
Monoallelic expression dependent on the parent of origin is a hallmark of imprinted genes; it is often lost in certain tumors (Lozano-Urena et al., 2021). We further analyzed the CNV of MEG3 in both GBM and LGG using GSCALite database (Liu et al., 2018)3, which consists of analytic modules for data from three major sources including multi-omics data from TCGA, Genomics of Drug Sensitivity in Cancer (GDSC) (Yang et al., 2013), and Cancer Therapeutics Response Portal (CTRP) (Basu et al., 2013), and normal tissue expression data from GTEx.
Prognostic Value Analysis
We further analyzed the correlation between MEG3 expression and clinical prognosis in various types of cancers using the PrognoScan database4, which is a powerful tool to investigate the prognostic value of genes (Mizuno et al., 2009). All survival values, such as overall survival (OS), relapse-free survival (RFS), disease-specific survival (DSS), disease-free survival (DFS), and distant metastasis-free survival (DMFS), were included in the present analysis. Only those studies with corrected P < 0.05 were included in further analyses. The GEPIA database (Tang et al., 2017)5 was used to generate survival curves, including OS, and RFS, based on gene expression using the log-rank test and Mantel–Cox test in both LGG and GBM.
Immune Infiltration Analysis
Tumor immune estimation resource (TIMER) is a comprehensive database designed for the analysis of immune cell infiltrates across different types of cancers (see text footnote 2) (Li et al., 2017). We initially analyzed the correlation of MEG3 expression with the abundance of six immune infiltrates, including B cells, CD4+ T cells, CD8+ T cells, neutrophils, macrophages, and dendritic cells, using the TIMER “gene” module. Furthermore, we used the Kaplan–Meier method to analyze the influence of MEG3 expression and immune cell infiltration on the prognosis of GBM and LGG patients; we also constructed a multivariate Cox proportional risk model. Lastly, the correlation of MEG3 expression with different immune infiltrating cell markers was also assessed through the correlation module. These immune infiltrating cells, including T cells, B cells, monocytes, tumor-associated macrophages (TAMs), macrophages, neutrophils, natural killer (NK) cells, dendritic cells, different T-helper cells, Tregs, and exhausted T cells, and the immune cell markers were referenced as described in the previous studies (Danaher et al., 2017; Zhang et al., 2019). The GEPIA database was used to confirm the gene correlations identified by TIMER analysis. The tumor tissue datasets were used for the analysis, and all default setting values were accepted.
Statistical Analysis
The results generated using the Oncomine and TIMER databases are shown with the P-value. Survival curves were generated using PrognoScan and Kaplan–Meier plots. The results of Kaplan–Meier plots and PrognoScan are accompanied with the hazard ratio (HR) and P or Cox P-values from a log-rank test. The correlation of gene expression was evaluated by Spearman’s correlation and a P < 0.05 was considered statistically significant.
Results
Analysis of MEG3 Expression Levels
MEG3 expression level in different human cancers and normal tissues were analyzed using Oncomine database. It was observed that MEG3 expression was lower in most tumor tissues than in normal tissues. In brain and CNS cancers, six studies reported the downregulation of MEG3, whereas no study reported its upregulation. A comprehensive analysis of 15 studies yielded a median rank = 793 and P = 6.29E-7, indicating that MEG3 was downregulated in glioma tissues (Figure 1A). Furthermore, we evaluated the MEG3 expression level through the TIMER database, finding that MEG3 expression was significantly lower in BLCA (bladder urothelial carcinoma), BRCA (breast invasive carcinoma), ESCA (esophageal carcinoma), GBM (glioblastoma multiforme), KICH (kidney chromophobe), KIRP (kidney renal papillary cell carcinoma), PRAD (prostate adenocarcinoma), UCEC (uterine corpus endometrial carcinoma), than in normal controls. By contrast, MEG3 expression was significantly higher in LUAD (lung adenocarcinoma) than in normal tissue (Figure 1B). We also further analyzed the expression of MEG3 in different grades of gliomas, finding that the expression level of MEG3 in grade 4 was significantly lower than that in other grades of gliomas and normal control, it decreased with the increasing of malignant degree of gliomas (Figure 1C). However, no significant difference was observed with respect to sex (Figure 1D). Finally, the expression of MEG3 showed a significant difference in LGG and GBM compared with that in normal control through the GEPIA database (Supplementary Figure 1). Taken together, these results were consistent with previous studies that MEG3 might serve as a tumor suppressor in most human cancers, including gliomas (Ghafouri-Fard and Taheri, 2019).
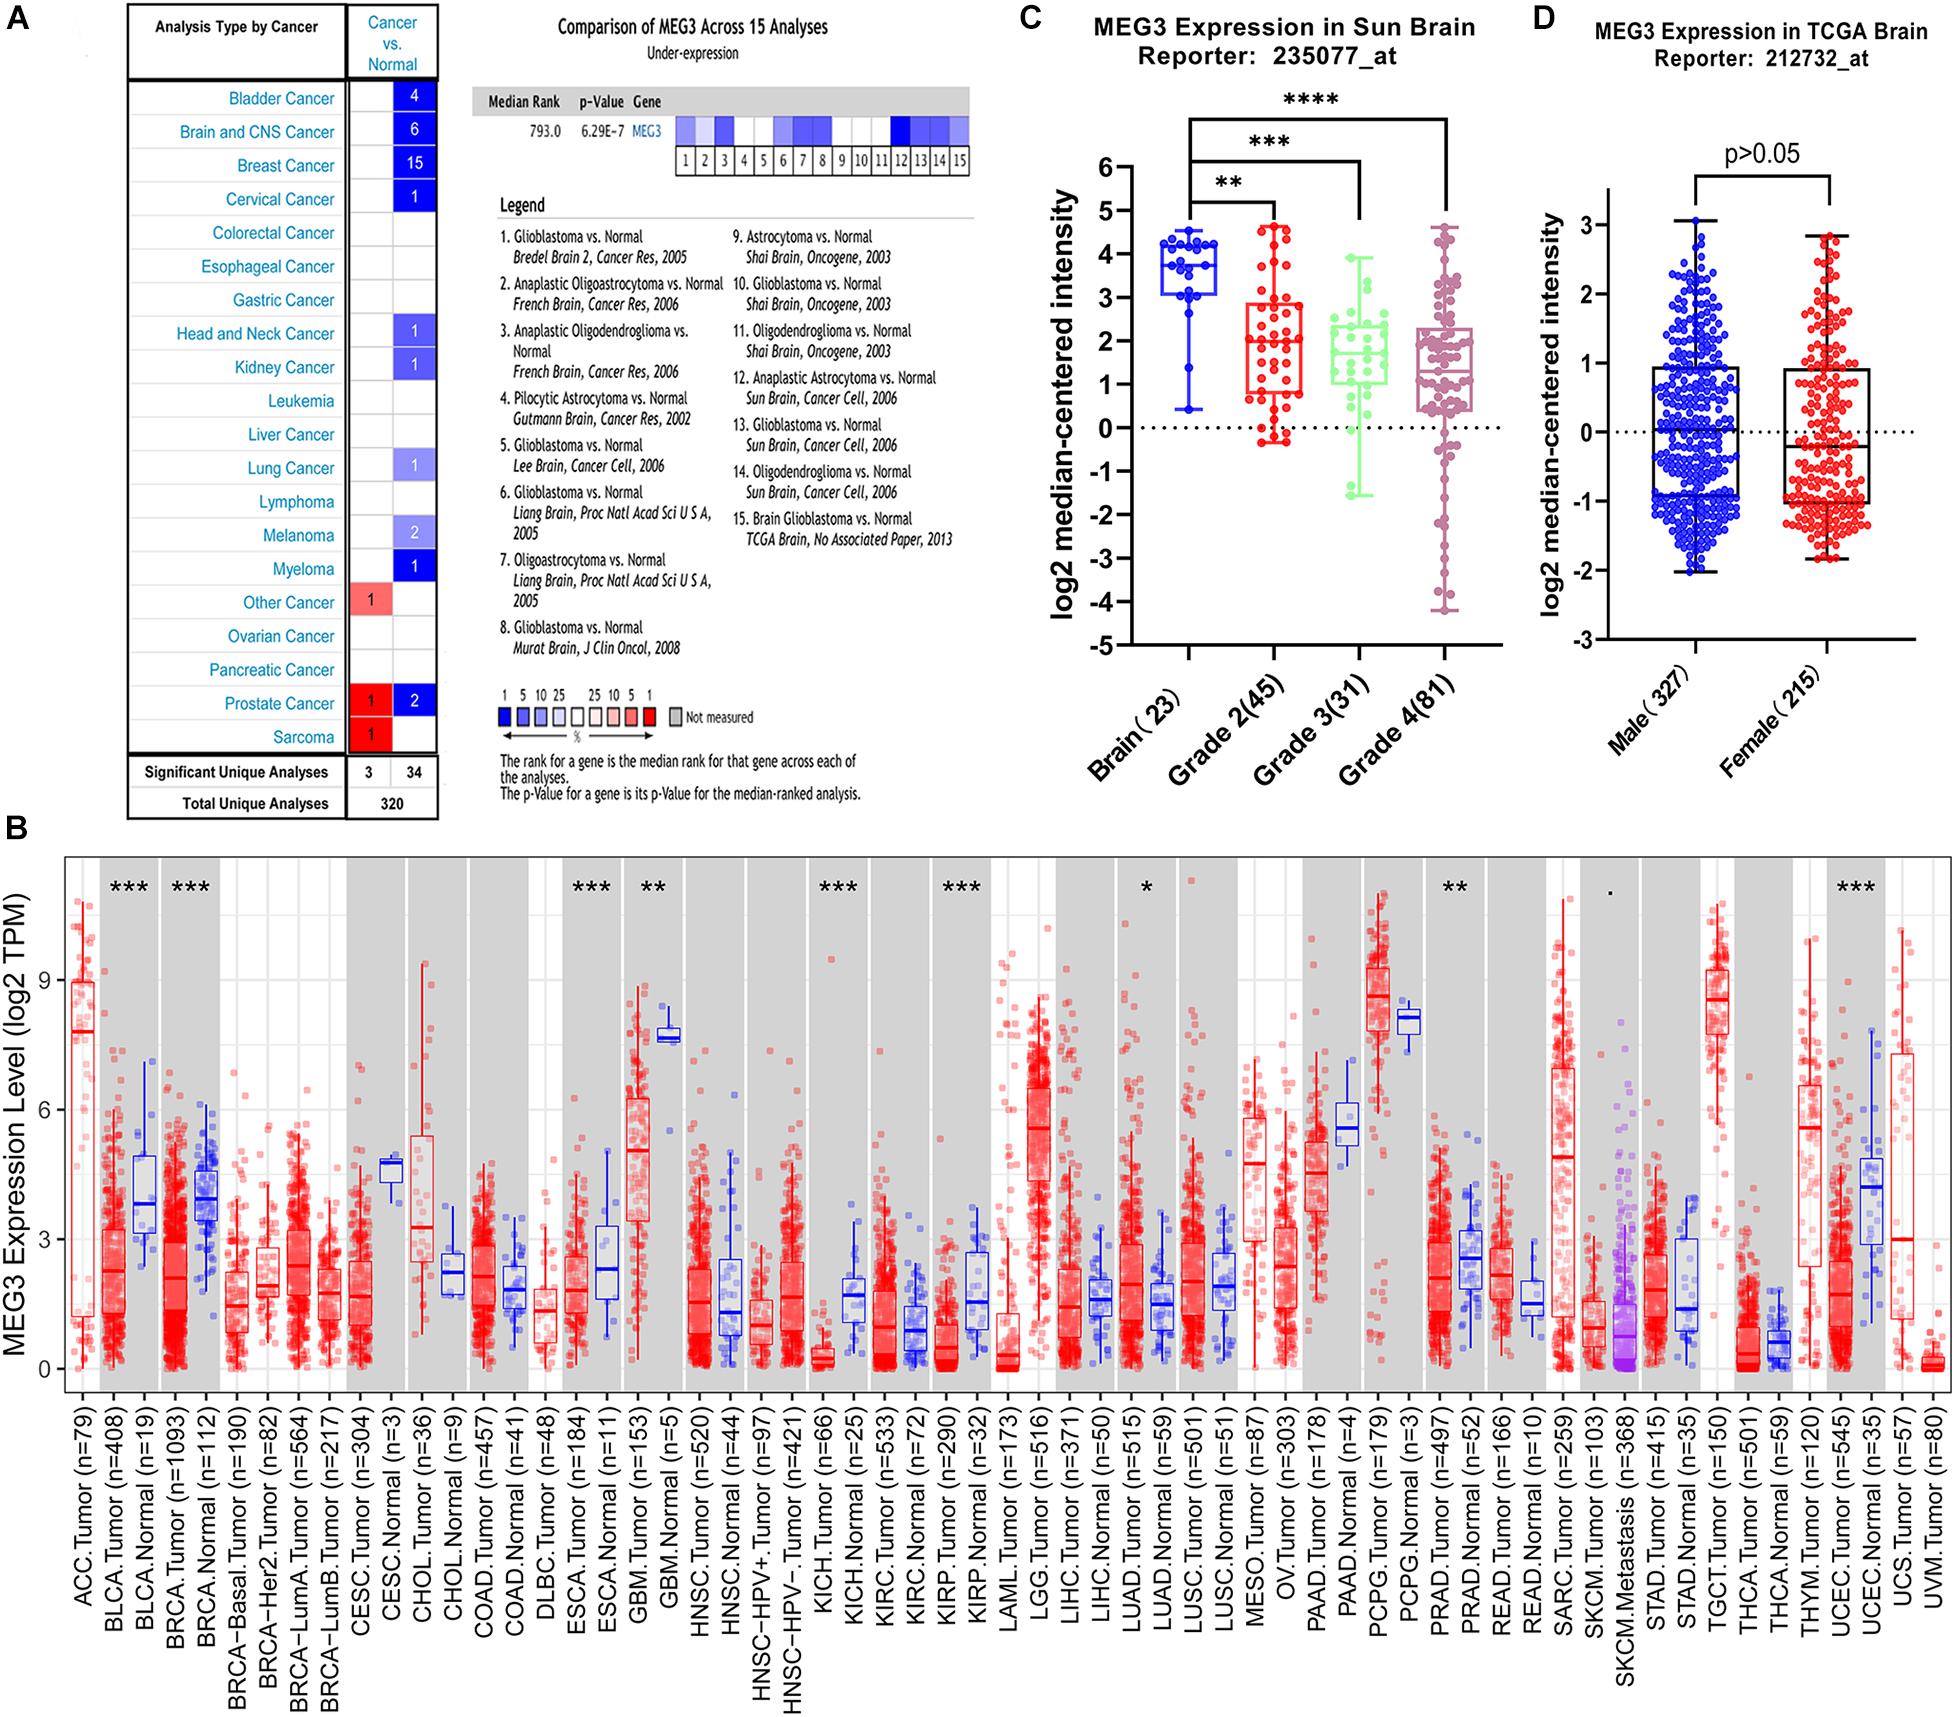
Figure 1. (A) MEG3 expression levels in different types of human cancers compared with normal tissues in the Oncomine database. (B) Human MEG3 expression levels in different tumor types from TCGA database were determined by TIMER (*P < 0.05, **P < 0.01, ***P < 0.001, ****P < 0.0001). (C) The expression of MEG3 decreased with increase of grade. (D) Comparison of the expression level of MEG3 in male and female.
Analysis of CNV of MEG3 Expression
Imprinted gene plays an important role in different biological processes, and loss of imprinting has been found in various cancers (Lozano-Urena et al., 2021). By analyzing GSCALite database, we found that the heterozygous deletion of MEG3 occurred in 27.73 and 20.08% of GBM and LGG, respectively (Figures 2A,C), and Pearson correlation analysis showed that mRNA expression of MEG3 was significantly positively correlated with its CNV in both GBM (r = 0.32, P < 0.05) and LGG group (r = 0.16, P < 0.05) (Figure 2B), which indicated that mRNA expression of MEG3 was significantly affected by CNV. Survival analysis showed that CNV level of MEG3 had significant correlation with OS and progression-free survival (PFS) compared with wild type in LGG, but not in GBM (Figure 2D).
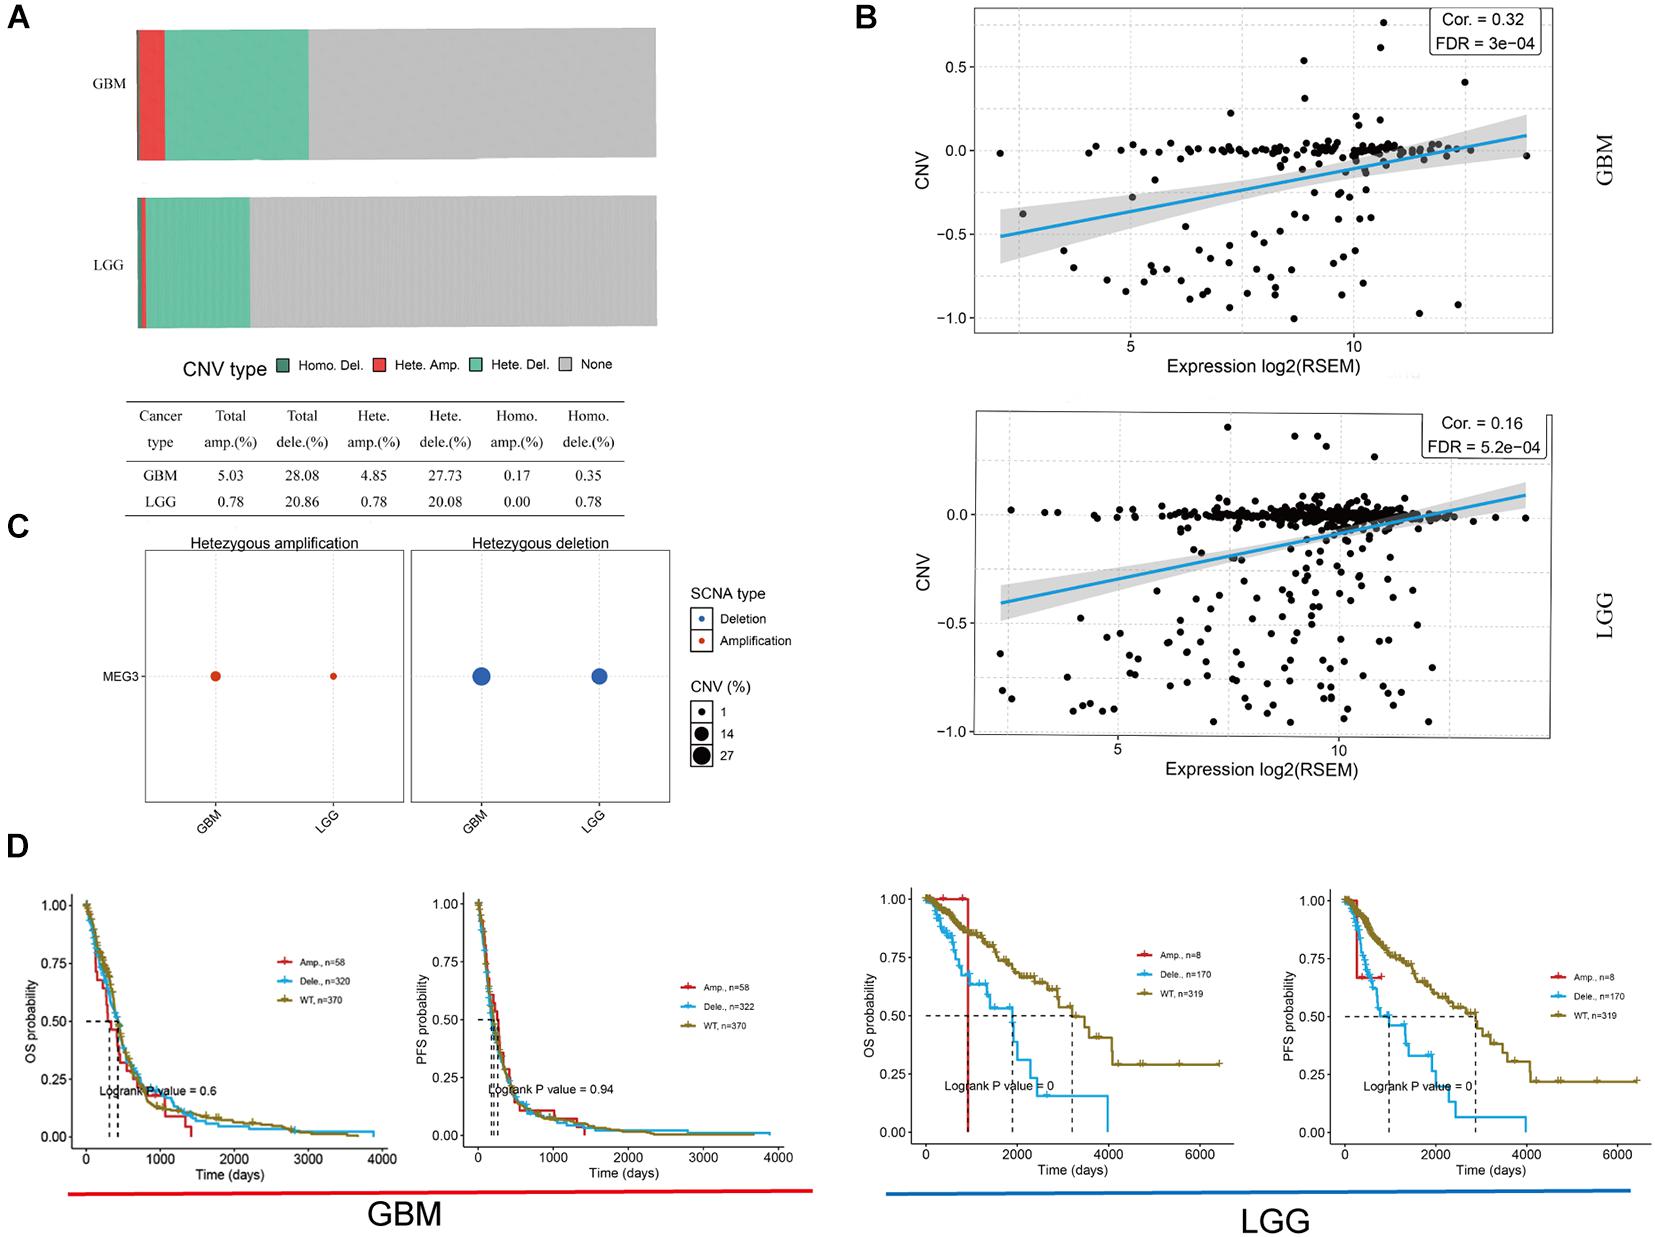
Figure 2. Copy number variation (CNV) of MEG3 expression in both GBM and LGG by using GSCALite database. (A) CNV distribution of MEG3 in GBM and LGG tumor samples. (B) Spearman correlation between MEG3 CNV and mRNA expression in GBM and LGG. (C) Heterozygous CNV in each cancer. (D) OS and PFS of MEG3 CNV in GBM and LGG.
Analysis of the Clinical Prognostic Impact of MEG3 Expression
PrognoScan was used to investigate the potential prognostic impact of MEG3 expression level in patients suffering from different types of cancer. The results are summarized in Figure 3. Notably, MEG3 expression was significantly correlated with the prognosis of a total of nine types of cancers, including bladder cancer, brain cancer, breast cancer, head and neck cancer, blood cancer, colorectal cancer, eye cancer, lung cancer, and ovarian cancer. We found that lower MEG3 expression was often associated with a poorer prognosis in these cancer patients.
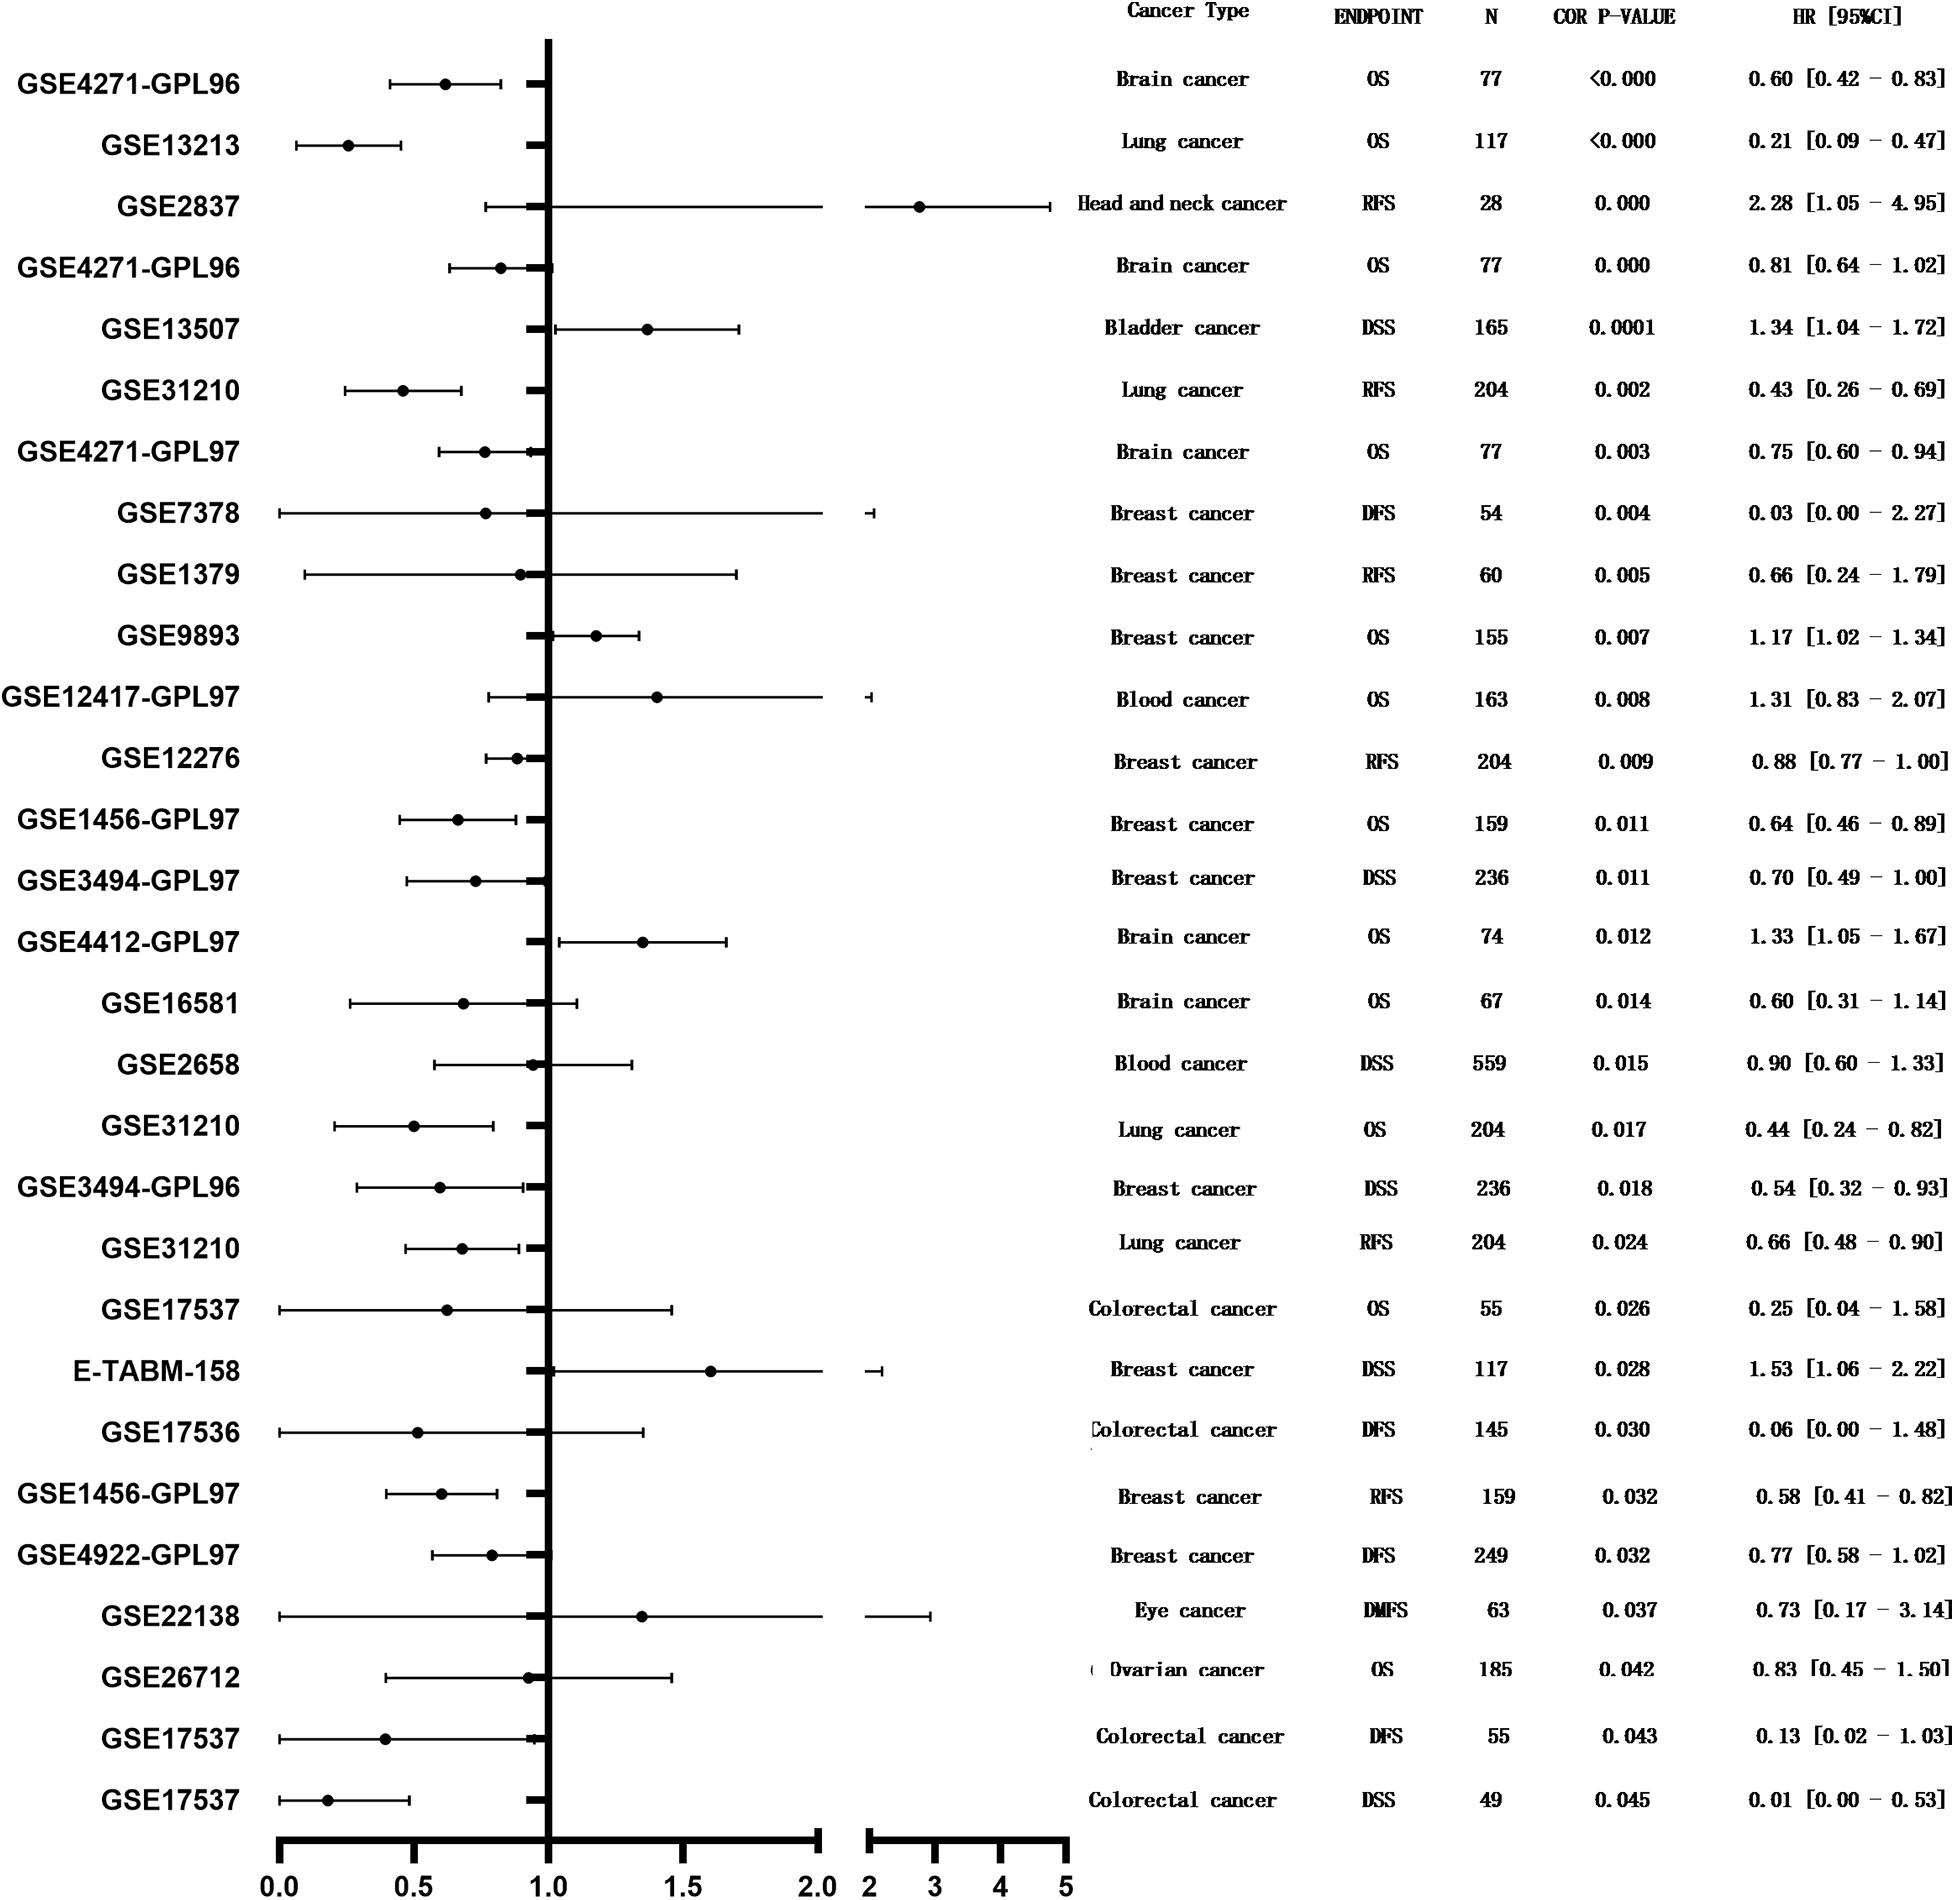
Figure 3. Forest plot displaying the prognostic results for MEG3 generated by using the PrognoScan database.
We further examined the potential impact of the MEG3 expression on survival rate in LGG and GBM patients using the GEPIA database. Interestingly, the results illustrated that MEG3 expression level had no significant correlation with OS and RFS in LGG and GBM (Supplementary Figure 2). These results confirmed the differential prognostic value of MEG3 in specific types of cancer.
Analysis of Immune Infiltration
“Tumor-infiltrating lymphocytes” are a key predictor of survival as well as response to immunotherapy in the cancer patients (Ohtani, 2007; Azimi et al., 2012). TIMER database was used to evaluate whether the expression of MEG3 in glioma is correlated with immune infiltration. Interestingly, we found that in GBM, the MEG3 expression level was significantly positively correlated with level of infiltrating CD8+ T cells (r = 0.206, P = 2.28e-05) and significantly negatively correlated with the level of infiltrating dendritic cells (r = –0.18, P = 2.17e-04). On the other hand, in LGG, the MEG3 expression level was significantly negatively correlated with levels of infiltrating B cells (r = –0.309, P = 5.22-12), CD8+ T cells (r = –0.299, P = 2.39e-11), CD4+ T cells (r = –0.243, P = 7.80e-08), macrophages (r = –0.297, P = 4.51e-11), neutrophils (r = –0.22, P = 1.35e-06), and dendritic cells (r = –0.326, P = 2.87e-13) (Figure 4 and Table 1). Next, to evaluate the correlation between immune cell infiltration and the prognosis of glioma patients, “Survival” module was used to generate Kaplan–Meier plots. Of note, we found that only dendritic cell infiltration was significantly correlated with GBM prognosis, while infiltration of all six types of immune cells showed significant correlation with LGG prognosis (Figure 5). Lastly, to explore the clinical relevance of immune cell subsets in gliomas, Cox proportional hazard model was constructed. It was observed that only dendritic cell infiltration was significantly associated with OS of patients with GBM as revealed by the univariate Cox survival analysis. Six types of immune cells significantly affected the survival time of patients with LGG; however, MEG3 expression did not significantly affect the survival time in these patients (Table 2). In addition, multivariate Cox survival analysis revealed age, macrophages, MEG3 expression, and neutrophils to be independent prognostic biomarkers for LGG (Table 3), and age and dendritic cells to be the independent prognostic biomarkers for GBM (Table 4). These findings suggest that MEG3 plays an important immune-related role in gliomas, particularly in LGG.
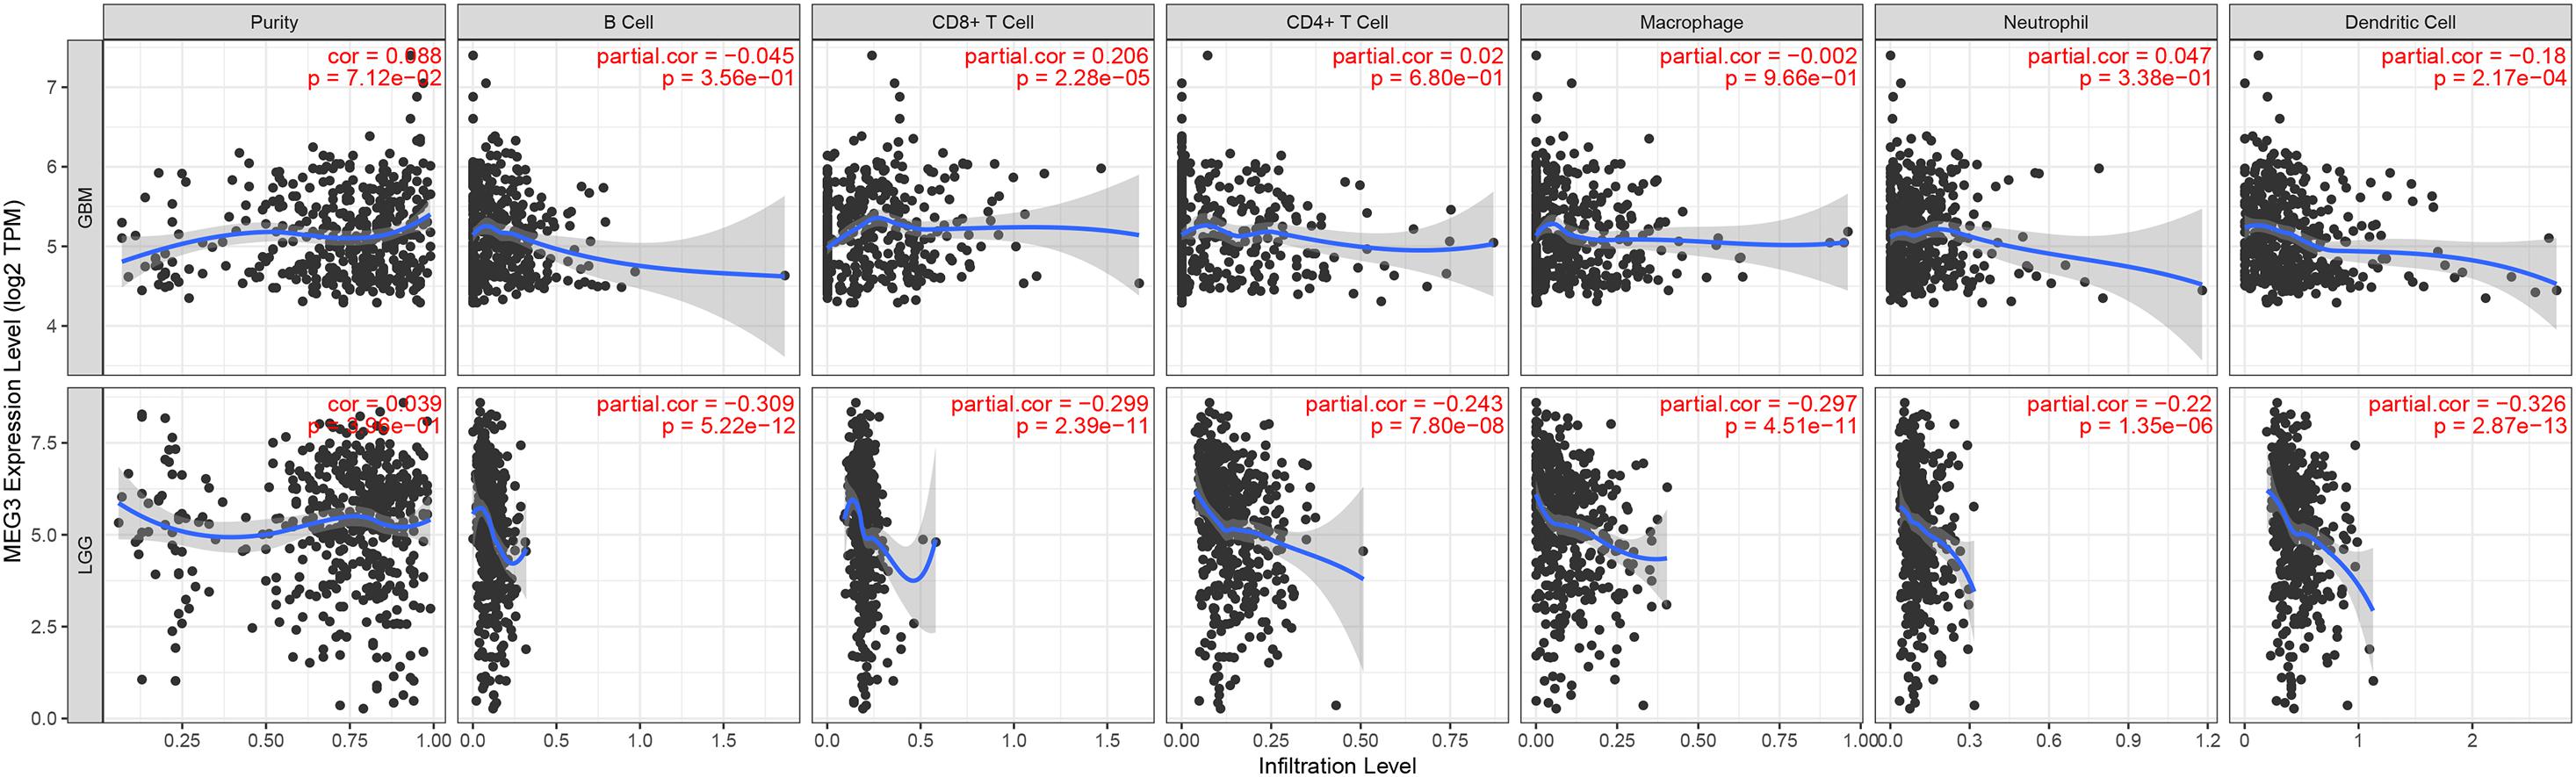
Figure 4. Correlation of MEG3 expression with immune infiltration level in GBM and LGG.
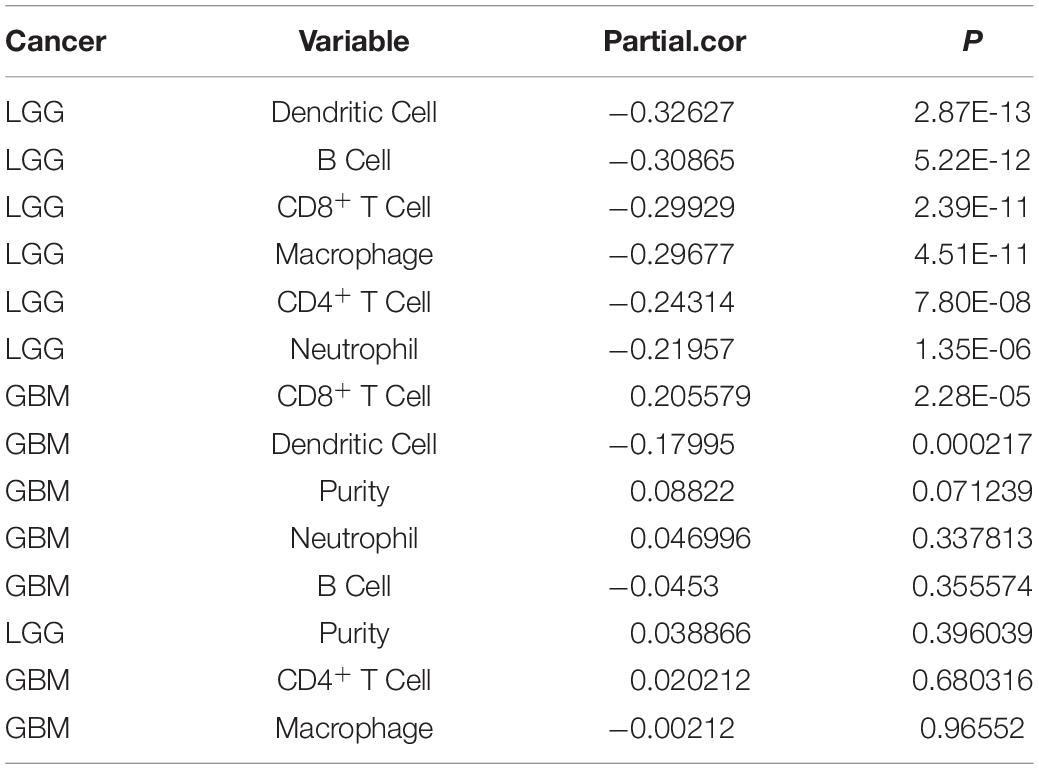
Table 1. MEG3 expression associated with immune infiltration level in GBM and LGG.
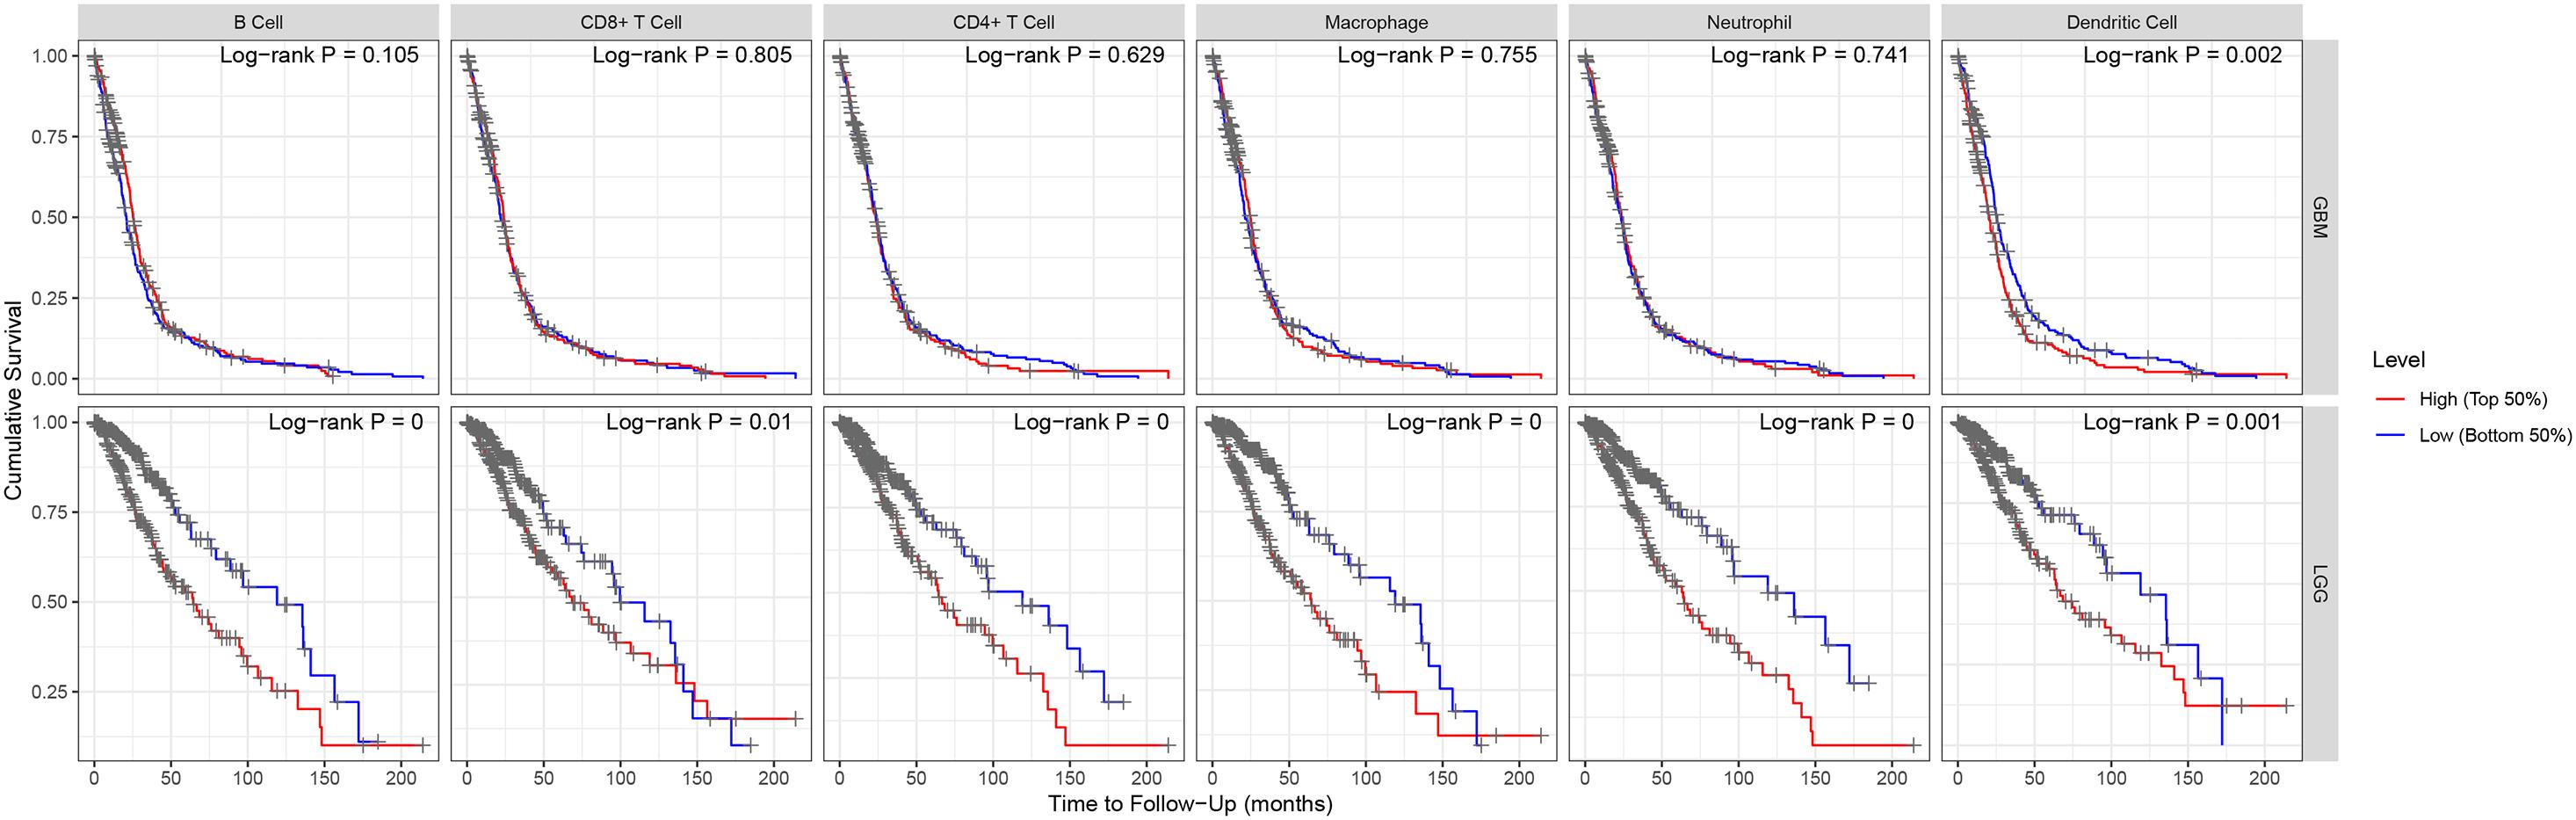
Figure 5. Kaplan–Meier plots of immune infiltration level in GBM and LGG.
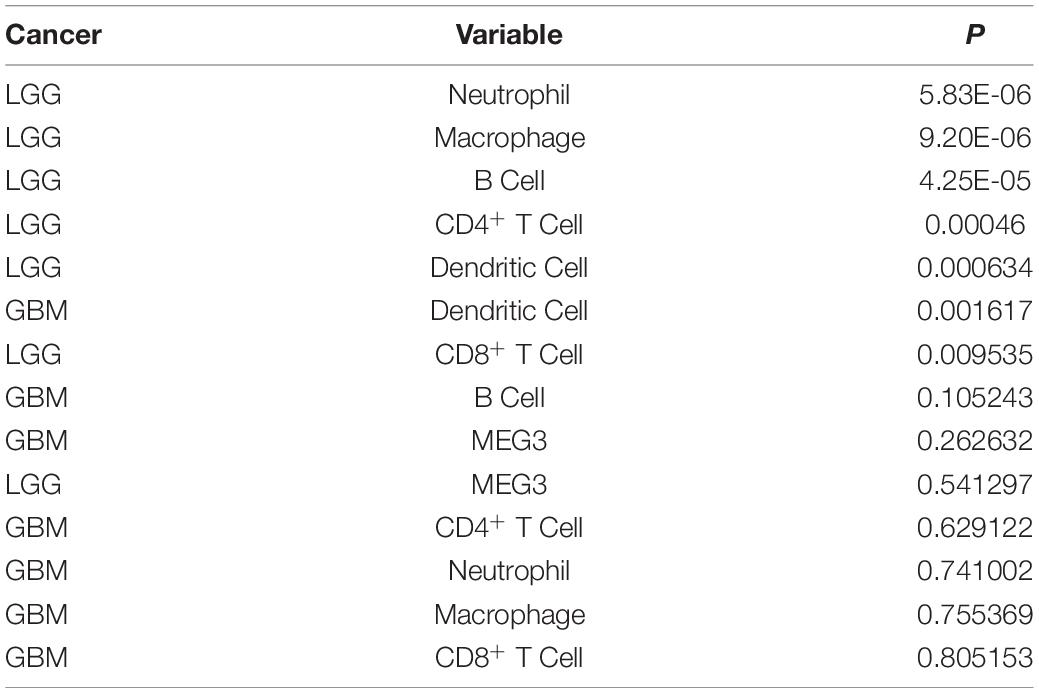
Table 2. Univariate analysis of the correlation of MEG3 expression and immune infiltrates with OS in glioma.
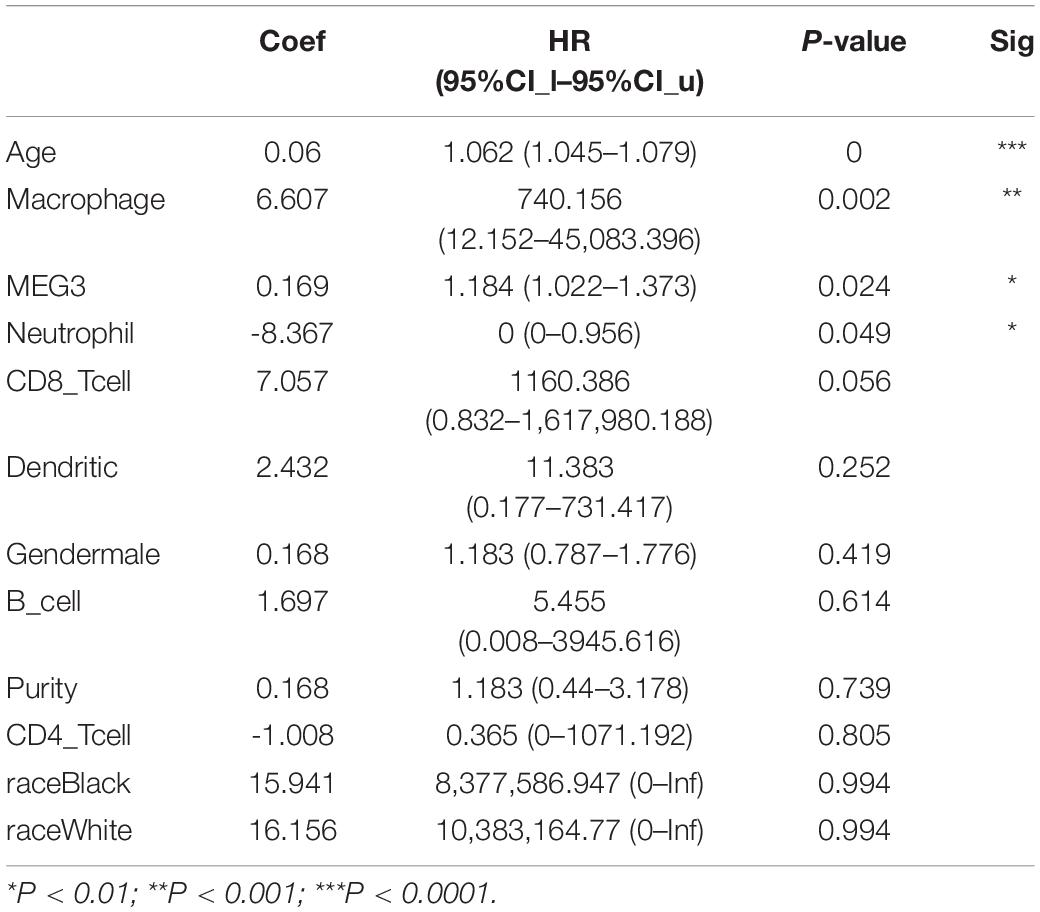
Table 3. Multivariate analysis of the correlation of MEG3 expression and immune infiltrates with OS in LGG.
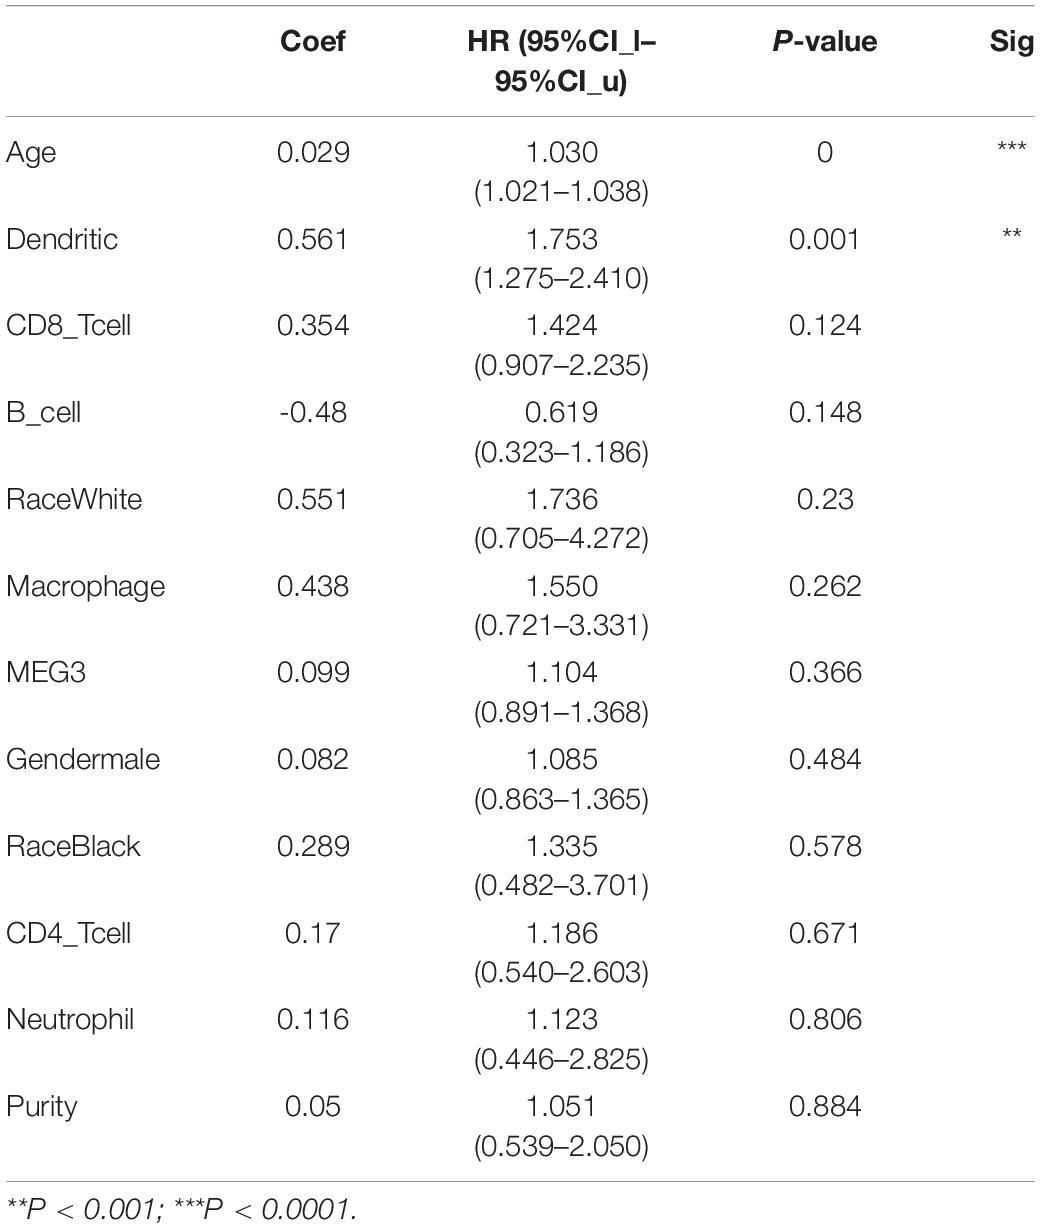
Table 4. Multivariate analysis of the correlation of MEG3 expression and immune infiltrates with OS in GBM.
Assessment of Correlation Between MEG3 and Immune Marker Expression
To further investigate the relationship between MEG3 and level of immune cell infiltration, we assessed the correlation between MEG3 expression and immune marker genes of various immune cells in glioma using TIMER and GEPIA databases. Different subsets of immune cells, including CD8+ T cells, T cells, B cells, monocytes, TAMs, M1 and M2 macrophages, neutrophils, NK cells, and dendritic cells, were analyzed in LGG and GBM, using GBM as the control group. Functional T cells, such as Th1 cells, Th2 cells, Tfh cells, Th17 cells, and Tregs, and exhausted T cells were also analyzed. The results showed that, after adjustment by purity, MEG3 expression level was significantly negatively correlated with most immune marker sets of various immune cells in LGG. However, interestingly, we found that only dendritic cell markers (HLA-DRA, CD11c) were significantly negatively correlated with MEG3 expression level in the GBM control group (Table 5). Similar results were also obtained while analyzing the correlation between MEG3 expression and the above-stated markers by using the GEPIA database (Table 6). Therefore, these results further confirm the findings that MEG3 is specifically correlated with immune infiltrating cells in gliomas, especially in LGG; this suggests that MEG3 plays a vital role in immune escape in the glioma microenvironment.
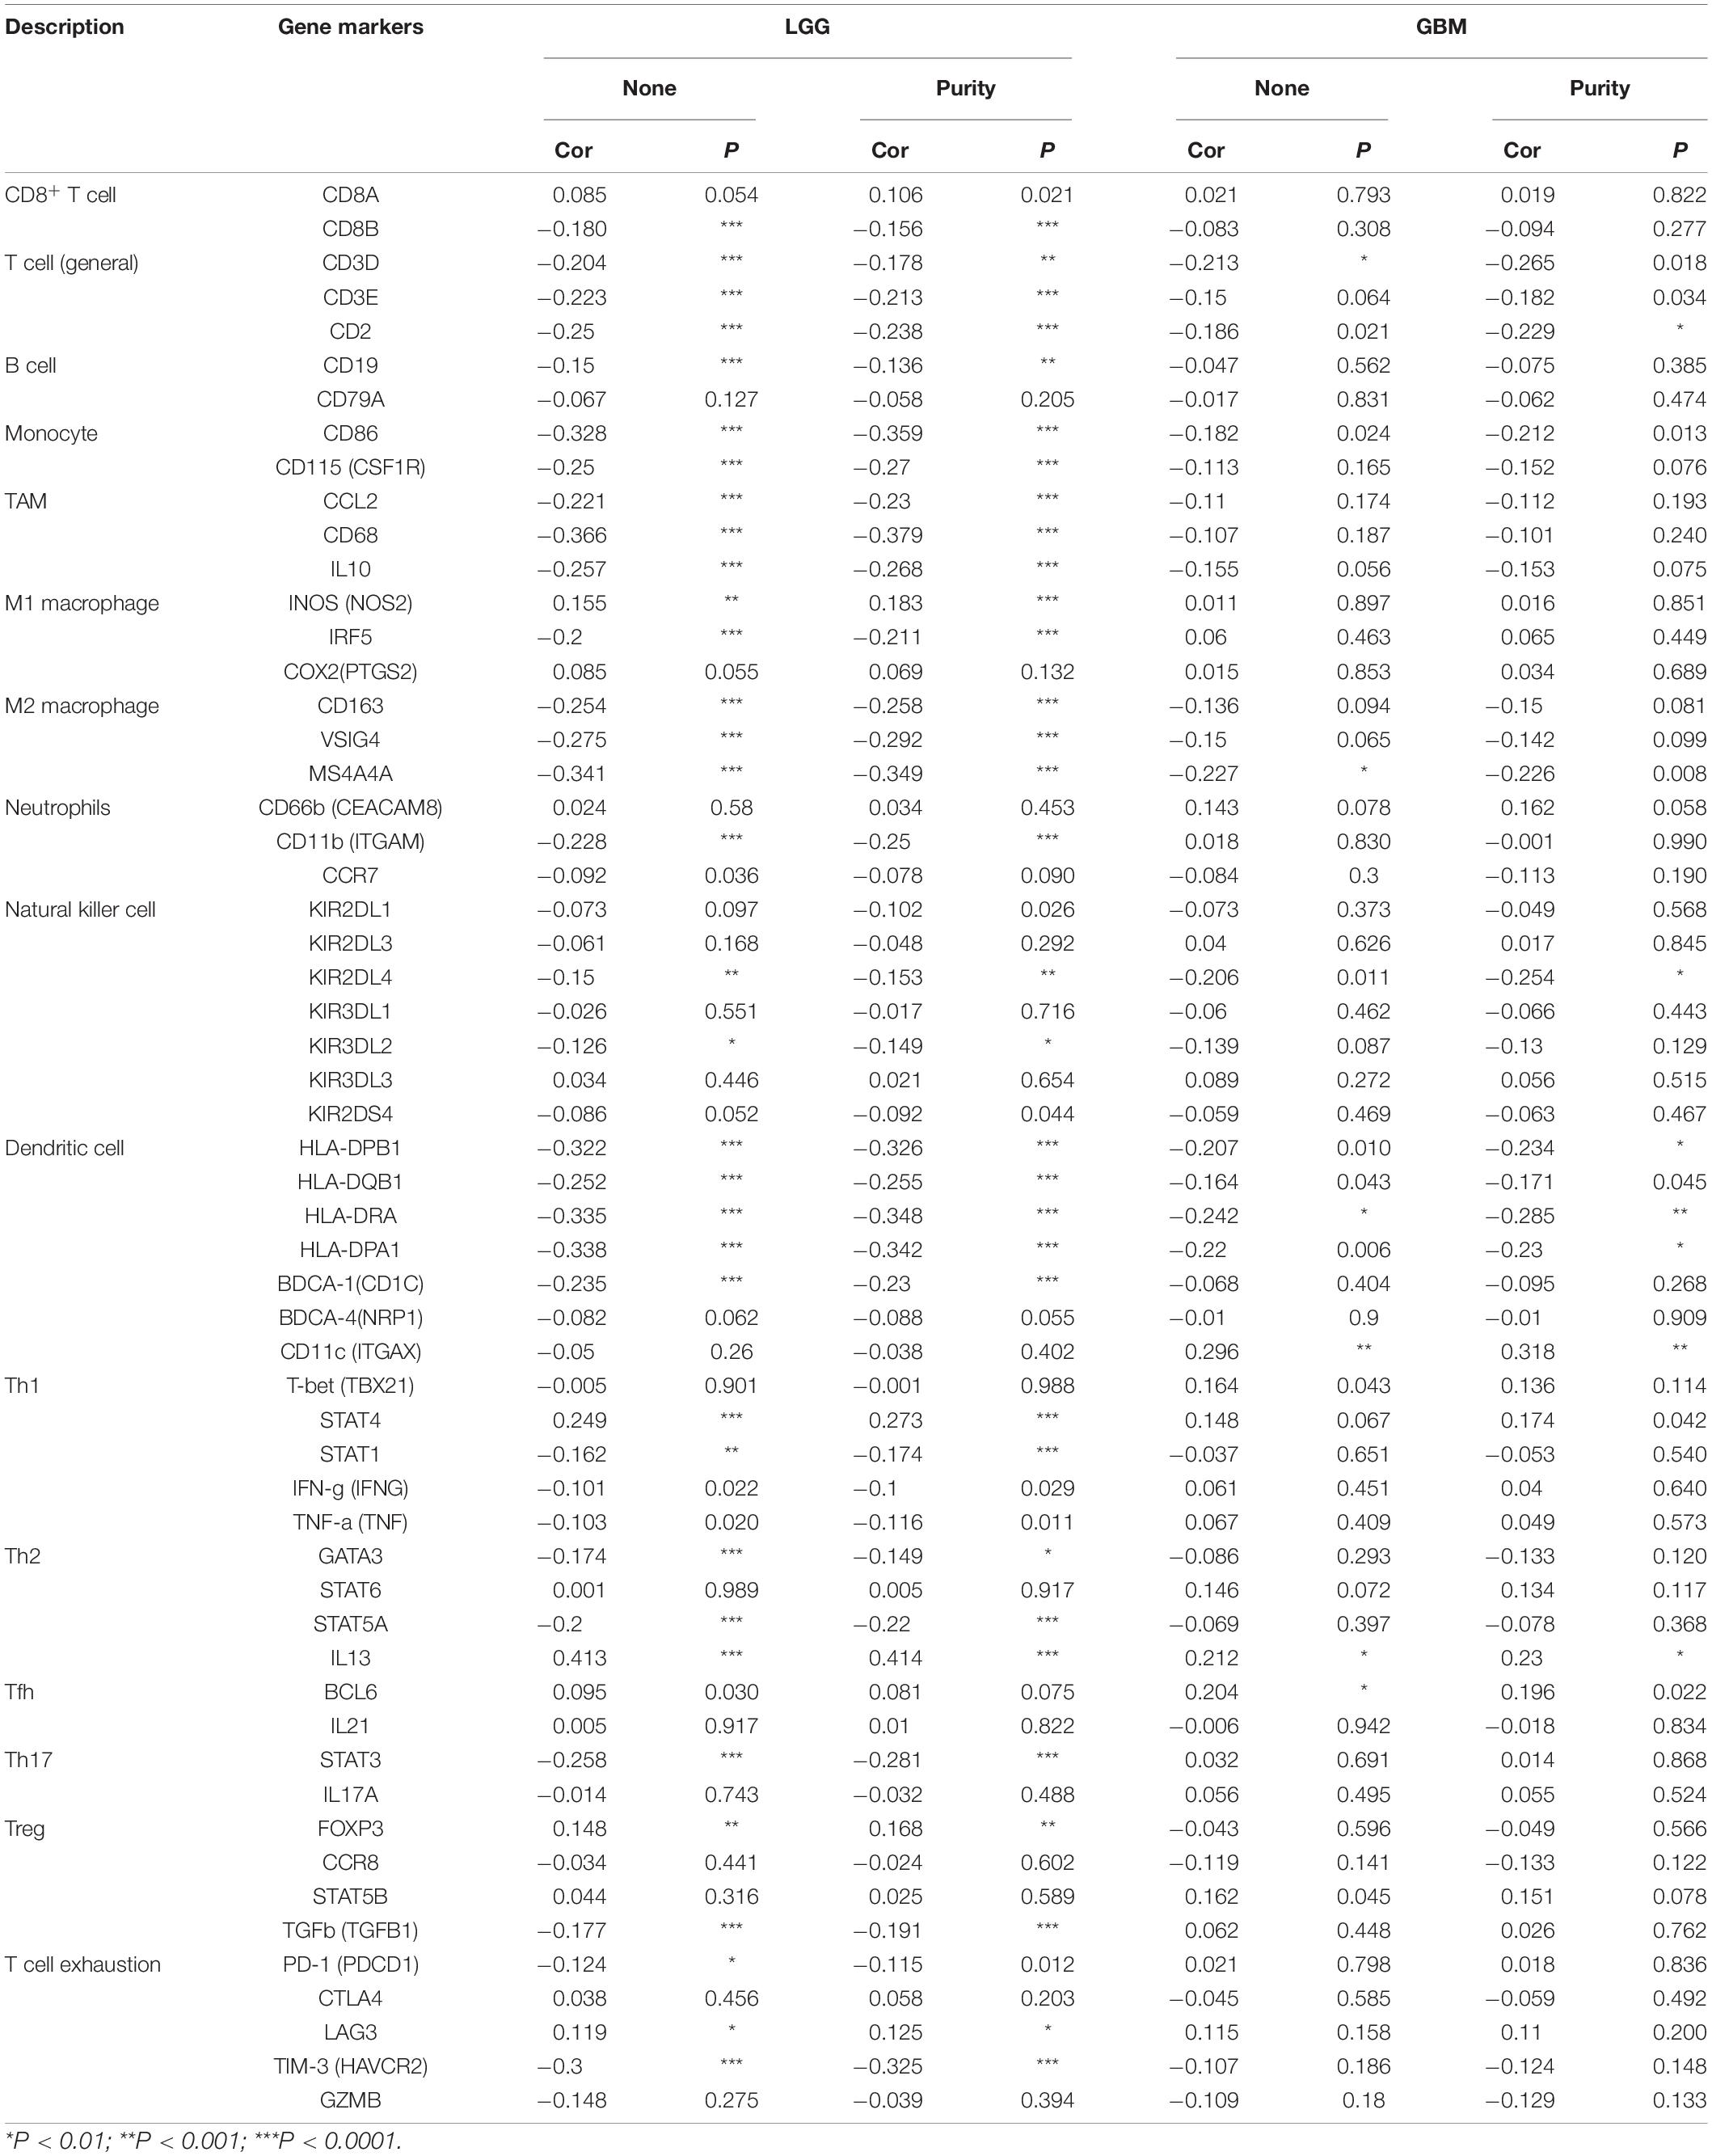
Table 5. Correlation analysis between MEG3 and relate genes and markers of immune cells in TIMER.
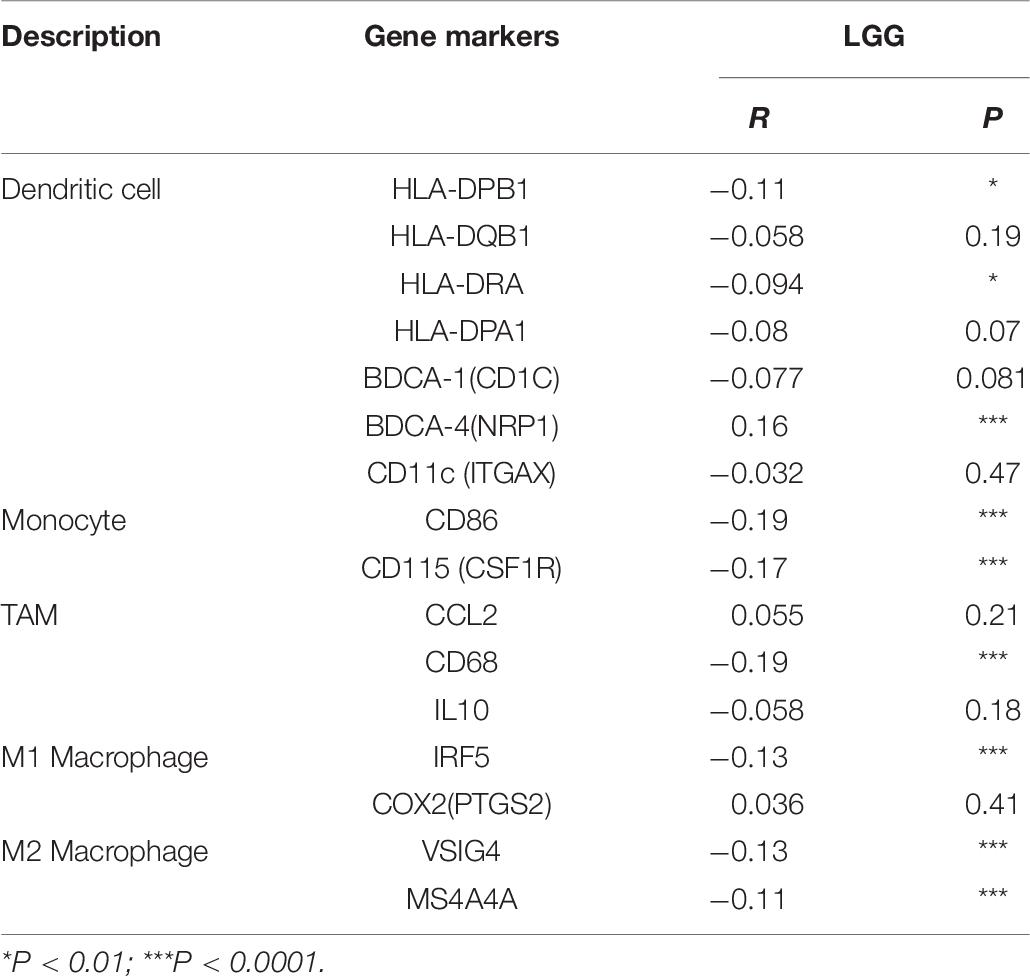
Table 6. Correlation analysis between MEG3 and relate genes and markers of dendritic cell, monocyte, TAM, and macrophages in GEPIA.
Discussion
In the present study, we analyzed the expression level of the lncRNA MEG3 in glioma and other tumors using the Oncomine database. The results showed that MEG3 was expressed at a lower level in most cancer types, including gliomas, than in normal tissues. This observation is consistent with the finding in the previous study reporting that MEG3 might have a tumor suppressive role in gliomas (Ghafouri-Fard and Taheri, 2019). We also found that heterozygous deletion of MEG3 occurred more frequent than heterozygous amplification in gliomas; mRNA expression of MEG3 was significantly positively correlated with its CNV in both GBM and LGG groups. Survival analysis showed that the CNV level of MEG3 had significant correlation with OS and PFS in LGG compared with wild type. Analysis pertaining to the prognostic impact showed that increased expression of MEG3 was correlated with improved survival in multiple types of human cancers. Through immune infiltration analysis, we found that MEG3 expression was positively correlated with the degree of CD8+ T cell and dendritic cell infiltration in GBM as well as with the degree of dendritic cell, B cell, CD8+ T cell, macrophage, CD4+ T cell, and neutrophil infiltration in LGG. We further found that infiltration of all these immune cells was significantly associated with LGG prognosis, while only dendritic cell infiltration was significantly associated with GBM prognosis. Furthermore, our analyses showed that levels of immune cell infiltration and diverse immune marker sets were correlated with the level of MEG3 expression in gliomas, especially in LGG.
The key finding of this study is that MEG3 expression is correlated with diverse immune cell infiltration levels in gliomas, particularly in LGG. Due to the restrictions imposed by the blood–brain barrier (BBB), the brain has long been considered as an immune privileged organ; nonetheless, the brain is now proposed to be an immunologically distinct organ (Rivest, 2003). Our understanding of the brain tumor microenvironment remains limited. Immune cells constitute an important component of the glioma microenvironments and they can reach up to 50% of the total cell mass in some tumors (Gargini et al., 2020). Gliomas are enriched in diverse immune cell types including neutrophils and myeloid-derived suppressor cells (Thorsson et al., 2018). On the other hand, brain metastases are enriched in lymphocytes and neutrophils. Moreover, brain metastases of different origin showed distinct immune landscape (Klemm et al., 2020). The different immunotherapeutic effects in certain tumors may be attributed to differences in the disease- and cell-type-specific tumor microenvironments. A previous study showed that downregulation of MEG3 promotes angiogenesis after ischemic brain injury (Liu et al., 2017). BBB disruption following stroke promotes inflammation by enabling leukocytes, T cells, and other immune cells to migrate across the BBB (Huang et al., 2020), which may indirectly explain the potential mechanism of the role of MEG3 in the immune microenvironment. The tumor immune microenvironment influences cancer immune escape, response to immunotherapy, and the survival rate of patients (Zhang et al., 2020). The observed correlation between MEG3 and the expression of certain immunological marker genes suggests that, in gliomas, MEG3 may interact with infiltrated immune cells within the tumor microenvironment. Of note, evidence that any therapeutic intervention administered to glioma patients has a major effect on survival is lacking. Our analysis would help in an efficient implementation of immunotherapy as a part of the standard care for patients with glioma.
Functional studies indicate that lncRNAs may act as oncogenes or tumor suppressors in various cancers (Shi et al., 2013). The results obtained from PrognoScan database analysis were consistent with the proposed tumor suppressor role for MEG3. Several studies have shown a correlation between MEG3 expression and patients’ survival. Low MEG3 expression level was correlated with poor prognosis (Zhao et al., 2018). A recent meta-analysis has verified that low expression of MEG3 is significantly associated with poor prognosis for patients with different types of cancer (Binabaj et al., 2018), although GEPIA database analysis showed that changes in MEG3 expression had no significant effect on the OS and DFS in both LGG and GBM. Our study showed that immune cell infiltration has close correlation with prognosis in glioma patients. The association between MEG3 expression and immune cell infiltration indirectly indicated that MEG3 may be a useful predictor of glioma patient survival. Furthermore, using the PrognoScan database, we observed that MEG3 expression was significantly correlated with the prognosis of a total of nine cancer types, including gliomas. These findings warrant validation in a larger cohort as previous sample size was limited. MEG3 inhibits cancer progression through several independent mechanisms, including regulation of the tumor suppressor genes p53 and Rb (Li et al., 2016; Lyu et al., 2017), inhibition of angiogenesis (Gordon et al., 2010), acting as a competitive endogenous (ce)RNA (Qin et al., 2017; Zhang et al., 2017; Zhang and Guo, 2019; Gong and Huang, 2020), and induction of EMT and invasion via autophagy (Gong and Huang, 2017; Yang et al., 2020). Although the role and prognostic value of the dysregulation of MEG3 in gliomas has not yet been fully evaluated, the current findings suggest that MEG3 may regulate tumor progression via immune-based mechanisms. Further studies are needed to establish its exact molecular mechanism in the progression of gliomas.
The tumor database-based studies have advantages of a larger sample size and higher reliability over traditional studies; such studies also provide a preliminary foundation for further studies. Although our study provides insights into understanding the potential role of MEG3 in tumor immunology and its use as a cancer biomarker, it is limited in terms of lack of in vitro and in vivo experiments to validate the relationship between MEG3 expression and infiltration of immune cells in gliomas. Therefore, further research is needed to verify the role of MEG3 in gliomas.
Conclusion
Taken together, the current findings suggest that the expression of MEG3 might serve as a possible prognostic biomarker and potential immunotherapeutic target for gliomas.
Data Availability Statement
The datasets presented in this study can be found in online repositories. The names of the repository/repositories and accession number(s) can be found in the article/Supplementary Material.
Author Contributions
XX analyzed the data and wrote the manuscript. YY reviewed the data and manuscript. ZZ and YS analyzed the data, edited the manuscript, and supervised the study. All authors contributed to the article and approved the final submitted version of the manuscript.
Funding
This study was supported in part by the Sichuan Science and Technology Program (Grant No. 2021YJ0164).
Conflict of Interest
The authors declare that the research was conducted in the absence of any commercial or financial relationships that could be construed as a potential conflict of interest.
Acknowledgments
We would like to thank Editage (www.editage.com) for English language editing.
Supplementary Material
The Supplementary Material for this article can be found online at: https://www.frontiersin.org/articles/10.3389/fgene.2021.679097/full#supplementary-material
Supplementary Figure 1 | MEG3 expression levels in GBM and LGG in the GEPIA database.
Supplementary Figure 2 | Kaplan-Meier survival curves comparing the low and high expression of MEG3 in LGG and GBM using the GEPIA database.
Footnotes
- ^ https://www.oncomine.org/resource/login.html
- ^ https://cistrome.shinyapps.io/timer/
- ^ http://bioinfo.life.hust.edu.cn/web/GSCALite/
- ^ www.prognoscan.org/
- ^ http://gepia.cancer-pku.cn/index.html
References
Astuti, D., Latif, F., Wagner, K., Gentle, D., Cooper, W. N., Catchpoole, D., et al. (2005). Epigenetic alteration at the DLK1-GTL2 imprinted domain in human neoplasia: analysis of neuroblastoma, phaeochromocytoma and Wilms’ tumour. Br. J. Cancer 92, 1574–1580. doi: 10.1038/sj.bjc.6602478
Atianand, M. K., Caffrey, D. R., and Fitzgerald, K. A. (2017). Immunobiology of Long Noncoding RNAs. Annu. Rev. Immunol. 35, 177–198. doi: 10.1146/annurev-immunol-041015-055459
Azimi, F., Scolyer, R. A., Rumcheva, P., Moncrieff, M., Murali, R., McCarthy, S. W., et al. (2012). Tumor-infiltrating lymphocyte grade is an independent predictor of sentinel lymph node status and survival in patients with cutaneous melanoma. J. Clin. Oncol. 30, 2678–2683. doi: 10.1200/JCO.2011.37.8539
Basu, A., Bodycombe, N. E., Cheah, J. H., Price, E. V., Liu, K., Schaefer, G. I., et al. (2013). An interactive resource to identify cancer genetic and lineage dependencies targeted by small molecules. Cell 154, 1151–1161. doi: 10.1016/j.cell.2013.08.003
Binabaj, M. M., Bahrami, A., Bahreyni, A., Shafiee, M., Rahmani, F., Khazaei, M., et al. (2018). The prognostic value of long noncoding RNA MEG3 expression in the survival of patients with cancer: a meta-analysis. J. Cell Biochem. 119, 9583–9590. doi: 10.1002/jcb.27276
Braconi, C., Kogure, T., Valeri, N., Huang, N., Nuovo, G., Costinean, S., et al. (2011). microRNA-29 can regulate expression of the long non-coding RNA gene MEG3 in hepatocellular cancer. Oncogene 30, 4750–4756. doi: 10.1038/onc.2011.193
Bredel, M., Bredel, C., Juric, D., Harsh, G. R., Vogel, H., Recht, L. D., et al. (2005). Functional network analysis reveals extended gliomagenesis pathway maps and three novel MYC-interacting genes in human gliomas. Cancer Res. 65, 8679–8689. doi: 10.1158/0008-5472.CAN-05-1204
Danaher, P., Warren, S., Dennis, L., D’Amico, L., White, A., Disis, M. L., et al. (2017). Gene expression markers of Tumor Infiltrating Leukocytes. J. Immunother. Cancer 5:18. doi: 10.1186/s40425-017-0215-8
Denaro, N., Merlano, M. C., and Lo Nigro, C. (2019). Long noncoding RNAs as regulators of cancer immunity. Mol. Oncol. 13, 61–73. doi: 10.1002/1878-0261.12413
Gargini, R., Segura-Collar, B., and Sanchez-Gomez, P. (2020). Cellular Plasticity and Tumor Microenvironment in Gliomas: the Struggle to Hit a Moving Target. Cancers 12:1622. doi: 10.3390/cancers12061622
Ghafouri-Fard, S., and Taheri, M. (2019). Maternally expressed gene 3 (MEG3): a tumor suppressor long non coding RNA. Biomed. Pharmacother. 118:109129. doi: 10.1016/j.biopha.2019.109129
Gong, X., and Huang, M. (2017). Long non-coding RNA MEG3 promotes the proliferation of glioma cells through targeting Wnt/beta-catenin signal pathway. Cancer Gene Ther. 24, 381–385. doi: 10.1038/cgt.2017.32
Gong, X., and Huang, M. Y. (2020). Tumor-Suppressive Function of lncRNA-MEG3 in Glioma Cells by Regulating miR-6088/SMARCB1 Axis. Biomed. Res. Int. 2020:4309161. doi: 10.1155/2020/4309161
Gordon, F. E., Nutt, C. L., Cheunsuchon, P., Nakayama, Y., Provencher, K. A., Rice, K. A., et al. (2010). Increased expression of angiogenic genes in the brains of mouse meg3-null embryos. Endocrinology 151, 2443–2452. doi: 10.1210/en.2009-1151
Huang, Y., Chen, S., Luo, Y., and Han, Z. (2020). Crosstalk between Inflammation and the BBB in Stroke. Curr. Neuropharmacol. 18, 1227–1236. doi: 10.2174/1570159X18666200620230321
Klemm, F., Maas, R. R., Bowman, R. L., Kornete, M., Soukup, K., Nassiri, S., et al. (2020). Interrogation of the Microenvironmental Landscape in Brain Tumors Reveals Disease-Specific Alterations of Immune Cells. Cell 181:e1617. doi: 10.1016/j.cell.2020.05.007
Li, J., Bian, E. B., He, X. J., Ma, C. C., Zong, G., Wang, H. L., et al. (2016). Epigenetic repression of long non-coding RNA MEG3 mediated by DNMT1 represses the p53 pathway in gliomas. Int. J. Oncol. 48, 723–733. doi: 10.3892/ijo.2015.3285
Li, T., Fan, J., Wang, B., Traugh, N., Chen, Q., Liu, J. S., et al. (2017). TIMER: a Web Server for Comprehensive Analysis of Tumor-Infiltrating Immune Cells. Cancer Res. 77, e108–e110. doi: 10.1158/0008-5472.CAN-17-0307
Liang, Y., Diehn, M., Watson, N., Bollen, A. W., Aldape, K. D., Nicholas, M. K., et al. (2005). Gene expression profiling reveals molecularly and clinically distinct subtypes of glioblastoma multiforme. Proc. Natl. Acad. Sci. U. S. A. 102, 5814–5819. doi: 10.1073/pnas.0402870102
Lim, M., Xia, Y., Bettegowda, C., and Weller, M. (2018). Current state of immunotherapy for glioblastoma. Nat. Rev. Clin. Oncol. 15, 422–442. doi: 10.1038/s41571-018-0003-5
Liu, C. J., Hu, F. F., Xia, M. X., Han, L., Zhang, Q., and Guo, A. Y. (2018). GSCALite: a web server for gene set cancer analysis. Bioinformatics 34, 3771–3772. doi: 10.1093/bioinformatics/bty411
Liu, J., Li, Q., Zhang, K. S., Hu, B., Niu, X., Zhou, S. M., et al. (2017). Downregulation of the Long Non-Coding RNA Meg3 Promotes Angiogenesis After Ischemic Brain Injury by Activating Notch Signaling. Mol. Neurobiol. 54, 8179–8190. doi: 10.1007/s12035-016-0270-z
Lozano-Urena, A., Jimenez-Villalba, E., Pinedo-Serrano, A., Jordan-Pla, A., Kirstein, M., and Ferron, S. R. (2021). Aberrations of Genomic Imprinting in Glioblastoma Formation. Front. Oncol. 11:630482. doi: 10.3389/fonc.2021.630482
Lyu, Y., Lou, J., Yang, Y., Feng, J., Hao, Y., Huang, S., et al. (2017). Dysfunction of the WT1-MEG3 signaling promotes AML leukemogenesis via p53-dependent and -independent pathways. Leukemia 31, 2543–2551. doi: 10.1038/leu.2017.116
Mizuno, H., Kitada, K., Nakai, K., and Sarai, A. (2009). PrognoScan: a new database for meta-analysis of the prognostic value of genes. BMC Med. Genomics 2:18. doi: 10.1186/1755-8794-2-18
Mumtaz, P. T., Bhat, S. A., Ahmad, S. M., Dar, M. A., Ahmed, R., Urwat, U., et al. (2017). LncRNAs and immunity: watchdogs for host pathogen interactions. Biol. Proced. Online 19:3. doi: 10.1186/s12575-017-0052-7
Murat, A., Migliavacca, E., Gorlia, T., Lambiv, W. L., Shay, T., Hamou, M. F., et al. (2008). Stem cell-related “self-renewal” signature and high epidermal growth factor receptor expression associated with resistance to concomitant chemoradiotherapy in glioblastoma. J. Clin. Oncol. 26, 3015–3024. doi: 10.1200/JCO.2007.15.7164
Ohtani, H. (2007). Focus on TILs: prognostic significance of tumor infiltrating lymphocytes in human colorectal cancer. Cancer Immun. 7:4.
Pan, L., Xiao, X., Zhao, Y., Yin, L., Fu, M., Zhang, X., et al. (2020). The functional roles of long noncoding RNA DANCR in Human Cancers. J. Cancer 11, 6970–6981. doi: 10.7150/jca.44384
Qin, N., Tong, G. F., Sun, L. W., and Xu, X. L. (2017). Long Noncoding RNA MEG3 Suppresses Glioma Cell Proliferation, Migration, and Invasion by Acting as a Competing Endogenous RNA of miR-19a. Oncol. Res. 25, 1471–1478. doi: 10.3727/096504017X14886689179993
Rhodes, D. R., Yu, J., Shanker, K., Deshpande, N., Varambally, R., Ghosh, D., et al. (2004). ONCOMINE: a cancer microarray database and integrated data-mining platform. Neoplasia 6, 1–6. doi: 10.1016/s1476-5586(04)80047-2
Rivest, S. (2003). Molecular insights on the cerebral innate immune system. Brain Behav. Immun. 17, 13–19. doi: 10.1016/s0889-1591(02)00055-7
Sahin, Y., Altan, Z., Arman, K., Bozgeyik, E., Koruk Ozer, M., and Arslan, A. (2017). Inhibition of miR-664a interferes with the migration of osteosarcoma cells via modulation of MEG3. Biochem. Biophys. Res. Commun. 490, 1100–1105. doi: 10.1016/j.bbrc.2017.06.174
Schalper, K. A., Rodriguez-Ruiz, M. E., Diez-Valle, R., Lopez-Janeiro, A., Porciuncula, A., Idoate, M. A., et al. (2019). Neoadjuvant nivolumab modifies the tumor immune microenvironment in resectable glioblastoma. Nat. Med. 25, 470–476. doi: 10.1038/s41591-018-0339-5
Shai, R., Shi, T., Kremen, T. J., Horvath, S., Liau, L. M., Cloughesy, T. F., et al. (2003). Gene expression profiling identifies molecular subtypes of gliomas. Oncogene 22, 4918–4923. doi: 10.1038/sj.onc.1206753
Shi, X., Sun, M., Liu, H., Yao, Y., and Song, Y. (2013). Long non-coding RNAs: a new frontier in the study of human diseases. Cancer Lett. 339, 159–166. doi: 10.1016/j.canlet.2013.06.013
Sun, L., Hui, A. M., Su, Q., Vortmeyer, A., Kotliarov, Y., Pastorino, S., et al. (2006). Neuronal and glioma-derived stem cell factor induces angiogenesis within the brain. Cancer Cell 9, 287–300. doi: 10.1016/j.ccr.2006.03.003
Sun, M., Xia, R., Jin, F., Xu, T., Liu, Z., De, W., et al. (2014). Downregulated long noncoding RNA MEG3 is associated with poor prognosis and promotes cell proliferation in gastric cancer. Tumour Biol. 35, 1065–1073. doi: 10.1007/s13277-013-1142-z
Tang, Z., Li, C., Kang, B., Gao, G., Li, C., and Zhang, Z. (2017). GEPIA: a web server for cancer and normal gene expression profiling and interactive analyses. Nucleic Acids Res. 45, W98–W102. doi: 10.1093/nar/gkx247
Thorsson, V., Gibbs, D. L., Brown, S. D., Wolf, D., Bortone, D. S., Ou Yang, T. H., et al. (2018). The Immune Landscape of Cancer. Immunity 48, 812–830.e14. doi: 10.1016/j.immuni.2018.03.023
Wang, J., Liu, X., Hao, C., Lu, Y., Duan, X., Liang, R., et al. (2019). MEG3 modulates TIGIT expression and CD4?+?T cell activation through absorbing miR-23a. Mol. Cell Biochem. 454, 67–76. doi: 10.1007/s11010-018-3453-2
Wang, P., Ren, Z., and Sun, P. (2012). Overexpression of the long non-coding RNA MEG3 impairs in vitro glioma cell proliferation. J. Cell Biochem. 113, 1868–1874. doi: 10.1002/jcb.24055
Wu, J. L., Meng, F. M., and Li, H. J. (2018). High expression of lncRNA MEG3 participates in non-small cell lung cancer by regulating microRNA-7-5p. Eur. Rev. Med. Pharmacol. Sci. 22, 5938–5945. doi: 10.26355/eurrev_201809_15923
Xu, D., Dong, P., Xiong, Y., Chen, R., Konno, Y., Ihira, K., et al. (2020). PD-L1 Is a Tumor Suppressor in Aggressive Endometrial Cancer Cells and Its Expression Is Regulated by miR-216a and lncRNA MEG3. Front. Cell Dev. Biol. 8:598205. doi: 10.3389/fcell.2020.598205
Yang, W., Soares, J., Greninger, P., Edelman, E. J., Lightfoot, H., Forbes, S., et al. (2013). Genomics of Drug Sensitivity in Cancer (GDSC): a resource for therapeutic biomarker discovery in cancer cells. Nucleic Acids Res. 41, D955–D961. doi: 10.1093/nar/gks1111
Yang, Z., Bian, E., Xu, Y., Ji, X., Tang, F., Ma, C., et al. (2020). Meg3 Induces EMT and Invasion of Glioma Cells via Autophagy. Onco Targets Ther. 13, 989–1000. doi: 10.2147/OTT.S239648
Zhang, J. J., Guo, S. H., and Jia, B. Q. (2016). Down-regulation of long non-coding RNA MEG3 serves as an unfavorable risk factor for survival of patients with breast cancer. Eur. Rev. Med. Pharmacol. Sci. 20, 5143–5147.
Zhang, L., Liang, X., and Li, Y. (2017). Long non-coding RNA MEG3 inhibits cell growth of gliomas by targeting miR-93 and inactivating PI3K/AKT pathway. Oncol. Rep. 38, 2408–2416. doi: 10.3892/or.2017.5871
Zhang, S., and Guo, W. (2019). Long noncoding RNA MEG3 suppresses the growth of glioma cells by regulating the miR965p/MTSS1 signaling pathway. Mol. Med. Rep. 20, 4215–4225. doi: 10.3892/mmr.2019.10659
Zhang, X., Lan, Y., Xu, J., Quan, F., Zhao, E., Deng, C., et al. (2019). CellMarker: a manually curated resource of cell markers in human and mouse. Nucleic Acids Res. 47, D721–D728. doi: 10.1093/nar/gky900
Zhang, Y., Liu, Q., and Liao, Q. (2020). Long noncoding RNA: a dazzling dancer in tumor immune microenvironment. J. Exp. Clin. Cancer Res. 39:231. doi: 10.1186/s13046-020-01727-3
Zhao, H., Wang, X., Feng, X., Li, X., Pan, L., Liu, J., et al. (2018). Long non-coding RNA MEG3 regulates proliferation, apoptosis, and autophagy and is associated with prognosis in glioma. J. Neurooncol. 140, 281–288. doi: 10.1007/s11060-018-2874-9
Zheng, Q., Lin, Z., Xu, J., Lu, Y., Meng, Q., Wang, C., et al. (2018). Long noncoding RNA MEG3 suppresses liver cancer cells growth through inhibiting beta-catenin by activating PKM2 and inactivating PTEN. Cell Death Dis. 9:253. doi: 10.1038/s41419-018-0305-7
Keywords: MEG3, glioma, immune infiltration, prognosis, biomarker
Citation: Xu X, Zhong Z, Shao Y and Yi Y (2021) Prognostic Value of MEG3 and Its Correlation With Immune Infiltrates in Gliomas. Front. Genet. 12:679097. doi: 10.3389/fgene.2021.679097
Received: 11 March 2021; Accepted: 10 May 2021;
Published: 16 June 2021.
Edited by:
Guohua Huang, Shaoyang University, ChinaReviewed by:
Luca Zammataro, Yale University, United StatesEnrique Medina-Acosta, State University of the North Fluminense Darcy Ribeiro, Brazil
Copyright © 2021 Xu, Zhong, Shao and Yi. This is an open-access article distributed under the terms of the Creative Commons Attribution License (CC BY). The use, distribution or reproduction in other forums is permitted, provided the original author(s) and the copyright owner(s) are credited and that the original publication in this journal is cited, in accordance with accepted academic practice. No use, distribution or reproduction is permitted which does not comply with these terms.
*Correspondence: Yong Yi, c3d5a3l5NDA2QDE2My5jb20=