- 1Department of Cardiology, First People's Hospital of Chengdu, Chengdu, China
- 2Department of Internal Medicine, Zhongnan Hospital of Wuhan University, Wuhan, China
Background: The studies of miRNAs are vibrant and remain at the forefront in the cardiovascular system. Emerging studies indicate that the genetic polymorphisms of the miRNA gene may affect lipid metabolism; this study aims to clarify the specific correlations between the rs2910164 and rs3746444 polymorphisms and lipid levels.
Methods and Results: A comprehensive search of literature was performed from December 31, 2020, to May 31, 2021, by searching of the PubMed and the Cochrane databases. The standardized mean difference (SMD) and 95% confidence interval (CI) were used to evaluate the differences in lipid levels between the genotypes. rs2910164, a functional polymorphism in the miRNA-146a gene, was associated with increased triglycerides (TG) (SMD = 0.35, 95% CI = 0.15–0.54, p < 0.001), total cholesterol (TC) (SMD = 0.43, 95% CI = 0.16–0.70, p < 0.001), and low-density lipoprotein cholesterol (LDL-C) (SMD = 0.37, 95% CI = 0.11–0.63, p = 0.01) as well as decreased high-density lipoprotein cholesterol (HDL-C) (SMD = −0.27, 95% CI = −0.47−0.07, p = 0.01) levels. rs3746444, a functional polymorphism in the miRNA-499a gene, was only correlated with decreased TG (SMD = −0.09, 95% CI = −0.17−0.01, P = 0.03) levels.
Conclusions: The miRNA-146a rs2910164 polymorphism is significantly associated with atherogenic dyslipidemia.
Introduction
MiRNAs play a central role in the posttranscriptional regulation of mRNA expression by binding to the 3′ untranslated region of mRNA, causing its destabilization, translational repression, or degradation.
Currently, a series of basic studies indicated that miRNA-146a and miRNA-499a may affect lipid metabolism. For instance, miRNA-146a knockout decreased the LDL-C levels (Cheng et al., 2017), while miRNA-146a overexpression induced severe dyslipidemia (Zhang et al., 2019). Moreover, macrophages transfected with miRNA-146a mimics reduced the intracellular LDL-C and oxLDL accumulation (Yang et al., 2011). However, transfection of HepG2 cells with the miRNA-499a inhibitor significantly increased the intracellular HDL-C levels (Chen et al., 2017). Together, it indicated that the expression levels of miRNA-146a and miRNA-499a may be closely linked to lipid metabolism.
The rs2910164 polymorphism is a function variant of miRNA-146a, formed by a nucleotide substitution from guanine (G) to cytosine (C). Studies showed that the C allele of the rs2910164 polymorphism largely increased the miRNA-146a protein levels (Shen et al., 2008; Ramkaran et al., 2014; Xiong et al., 2014). The rs3746444 polymorphism is a function variant of miRNA-499a, formed by a nucleotide substitution from adenine (A) to guanine (G). Evidence showed that the G allele of the rs3746444 polymorphism largely decreased the miRNA-499a protein levels (Chen et al., 2017). Therefore, the rs2910164 and rs3746444 polymorphisms may affect lipid levels by altering the expression levels of miRNA-146a and miRNA-499a. A series of meta-analyses (Labbaf et al., 2017; Liu et al., 2017; Zhou et al., 2017) showed that the subjects with rs2910164 and rs3746444 polymorphisms significantly increased the susceptibility to coronary artery disease (CAD). However, the underlying mechanisms remain elusive. Therefore, this study was required to clarify the mechanisms underlying the positive correlations between the rs2910164 and rs3746444 polymorphisms and CAD.
Materials and Methods
The present meta-analysis is in accordance with the Preferred Reporting Items for Systematic Reviews and Meta-analyses (PRISMA) (Liberati et al., 2009).
Literature Search
A comprehensive search of literature was performed from December 31, 2020, to May 31, 2021, by using seven databases including PubMed, Medline, Embase, Cochrane Library, Google Scholar, Foreign Medical Journal Service, and Excerpta Medica. The following keywords were used in the search: (“microRNA”, “miRNA”, “microRNA-146a”, “miRNA-146a”, “miR-146a”, “rs2910164”, “microRNA-499a”, “miRNA-499a”, “miR-499a”, or “rs3746444”), (“polymorphism”, “mutation”, “variation”, “mutant”, “variant”, “SNP”, or “single nucleotide polymorphism”), and (“lipids”, “circulating lipids”, “blood lipids”, “plasma lipids”, “serum lipids”, “triglycerides”, “total cholesterol”, “low-density lipoprotein cholesterol”, “high-density lipoprotein cholesterol”, “TG”, “TC”, “LDL-C”, or “HDL-C”). Additionally, the reference lists of all eligible studies were manually retrieved to obtain more literature.
Inclusion Criteria
The specific inclusion criteria were listed as follows. (1) The articles investigated the effects of miRNA-146a rs2910164 (G > C) polymorphism or miRNA-499a rs3746444 (A > G) polymorphism on lipid levels. (2) The articles at least provided one parameter in the lipid profile (TG, TC, LDL-C, and HDL-C). (3) The articles provided the genotype frequencies of rs2910164 and rs3746444 polymorphisms. (4) The articles offered the mean lipid levels with standard deviation (SD) or standard errors (SE) by genotypes. (5) The interventional articles provided pre-intervention data. (6) The language of eligible articles was restricted to English or Chinese.
Data Extraction
Two authors (SW and FL) extracted the data independently by using a standardized data extraction table. The discrepancy in data extracted was resolved by consensus or a discussion with the third author (ZL). If key data were absent, e-mail or telephone was used to contact the corresponding author to acquire these information.
One study conducted by Qiu et al. (2020) did not offer usable data in its original article; fortunately, they offered raw lipid data by the genotypes of rs2910164 and rs3746444 polymorphisms in its Supplementary Material. Therefore, we analysis and obtained these important data by performing SPSS software (version 23.0, Inc, Chicago, IL, USA).
The following data were extracted from each eligible article: the last name of the first author, year, country, gender, study population, ethnicity, genotype counts, genotyping methods, type of study, type of disease, total sample size, and mean lipid levels with SD or SE by genotypes.
Data Analysis
The units of TG, TC, LDL-C, and HDL-C were converted into mmol/L. All extracted data were expressed as mean ± SD. The Hardy–Weinberg equilibrium (HWE) of the populations was tested by χ2 test. Since most of the included studies presented data in a dominant model [(GC + CC) vs. GG for rs2910164; (AG + GG) vs. AA for rs3746444], a dominant model was adopted to ensure adequate statistical power. All the analyses were performed by STATA software (version 15.0, College Station, TX, USA). p < 0.05 was recognized as statistically significant. The standardized mean difference (SMD) and 95% confidence interval (CI) were used to evaluate the differences in lipid levels between the genotypes. The raw data downloaded from Qiu et al. (2020) Supplementary Material were analyzed using SPSS software (version 23.0, Inc, Chicago, IL, USA). If data follow normal distribution, ANOVA was adopted to calculate the results.
Heterogeneity Definition and Processing
Inevitably, there were differences between the included articles in a meta-analysis. The differences among participants, interventions, or inner authenticity variations in those articles were defined as “heterogeneity” (Higgins and Green, 2006). Heterogeneity was tested by I2 statistic and Cochran's χ2-based Q statistic. Galbraith plots were used to detect the potential sources of heterogeneity. If heterogeneity was significant (I2 > 50%, p ≤ 0.05), the random-effect model (DerSimonian–Laird method) was used to calculate the results (DerSimonian and Kacker, 2007). Otherwise, the fixed-effect model (Mantel–Haenszel method) would be adopted (I2 <50%, p > 0.05).
Risk-of-Bias Test
The risk of bias among the included studies was evaluated by the risk-of-bias plot (Savović et al., 2014), in which different colors represent different levels of risk of bias, e.g., green represents low risk of bias, while yellow refers to unclear risk of bias; however, red represents high risk of bias.
Publication Bias Test
The publication bias among the included studies was evaluated by Begg's funnel plot and Egger's linear regression test (Begg and Mazumdar, 1994). The funnel plots were asymmetric when there were publication biases and symmetric in case of no publication bias.
Subgroup Analysis
Subgroup analysis was carried out by ethnicity, female subjects, and cardiovascular disease (CVD) patients due to the limited number of studies. The ethnicity was divided into Caucasian and Asian. The subjects with CAD, ischemic stroke (IS), or hypertension were considered as CVD patients. In some studies, the subjects were divided into more than one subpopulation (e.g., the subjects with different types of disease, the subjects originated from different races, case and control subjects). Each subpopulation was regarded as an independent comparison in this study.
Sensitivity Analysis
Sensitivity analysis was conducted in this meta-analysis, in which the comparison was excluded one by one, and the analysis was performed again after omitting each comparison. If the synthetic results in any of the comparison changed substantially to alter the results from significant to non-significant or the other way around. The absence of such a phenomenon usually indicates the robustness and stableness of synthetic results.
Results
Study Selection
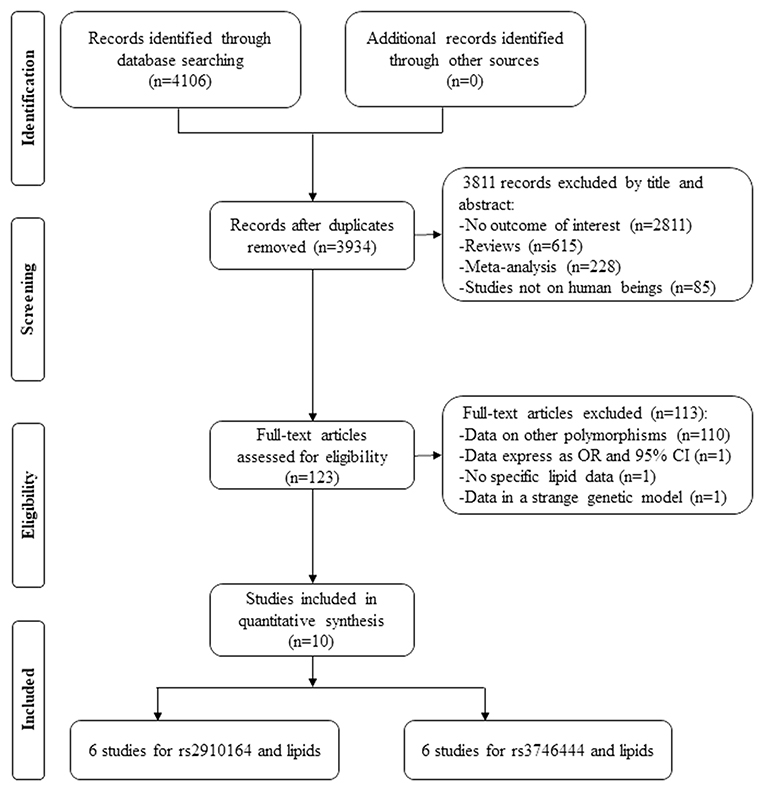
By searching relevant databases, 4,106 articles were identified; after the screening, 3,811 articles were excluded by its title and abstract. Next, 123 articles were further estimated by its contents, in which 110 articles provided data of other polymorphisms, one article conducted by Mir et al. (2020) did not provide the specific lipid levels by the genotypes of rs2910164, one article conducted by Huang et al. (2015) provided lipid levels by the genotypes of rs2910164 but expressed odds ratio (OR) and 95% CI, and 1 article conducted by Ibrahim et al. (2020) provided lipid levels by the genotypes of rs2910164 but in a strange genetic model [(CG + GG) vs. CC]. Therefore, 113 articles were further excluded. Despite that we carefully and repeatedly reviewed all the relevant literatures and tried our best to obtain more studies, only 10 studies (4,087 subjects) were included due to the limited number of eligible studies, in which, six studies (3,470 subjects) and six studies (3,227 subjects) were respectively included for lipid association analysis in rs2910164 and rs3746444 (Figure 1).
The references of the included studies are listed in Supplementary Material. The characteristics of the studies included in the meta-analysis are presented in Supplementary Table S1. The plasma lipid levels by the genotypes of miRNA-146a rs2910164 polymorphism are presented in Supplementary Table S2. The plasma lipid levels by the genotypes of miRNA-499a rs3746444 polymorphism are presented in Supplementary Table S3. The forest plot of the meta-analysis between miRNA-499a rs3746444 polymorphism and plasma lipid levels is presented in Supplementary Figures S1–S4. The sensitivity analysis between miRNA-499a rs3746444 polymorphism and plasma lipid levels is presented in Supplementary Figures S5–S7, S11. The sensitivity analysis between miRNA-146a rs2910164 polymorphism and plasma lipid levels is presented in Supplementary Figures S8–S10, S12. The risk-of-bias plot of the meta-analysis between miRNA-499a rs3746444 polymorphism and plasma lipid levels is presented in Supplementary Figure S13. The Begg's funnel plot of the association analysis between miRNA-146a rs2910164 polymorphism and plasma TC, LDL-C, and HDL-C levels is presented in Supplementary Figures S14–S16, respectively. The Begg's funnel plot of the association analysis between miRNA-499a rs3746444 polymorphism and plasma lipid levels is presented in Supplementary Figures S17–S20.
Associations of the rs2910164 Polymorphism With Lipid Levels
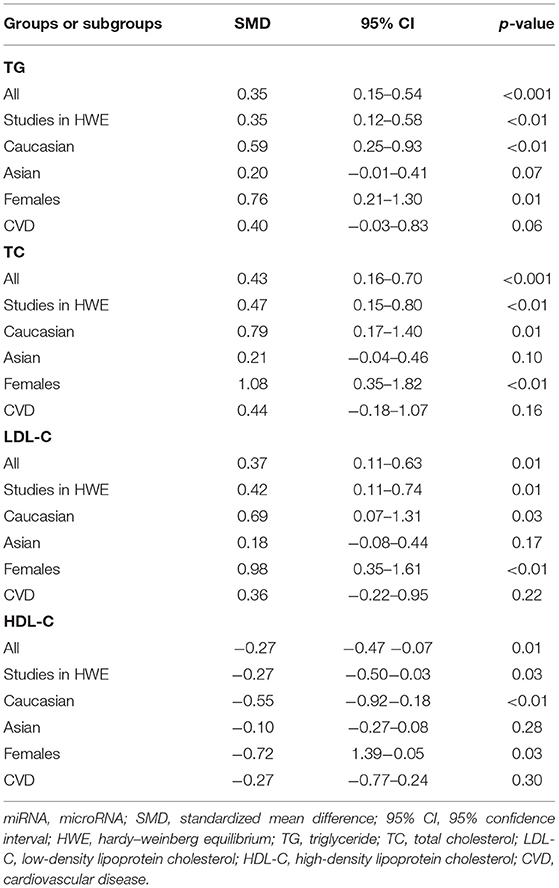
The rs2910164 polymorphism largely increased the TG (SMD = 0.35, 95% CI = 0.15–0.54, p < 0.001), TC (SMD = 0.43, 95% CI = 0.16–0.70, p < 0.001), and LDL-C (SMD = 0.37, 95% CI = 0.11–0.63, p = 0.01) levels and decreased the HDL-C level (SMD = –0.27, 95% CI = −0.47−0.07, p = 0.01) (Table 1; Figures 2–5). When the analysis was limited to the studies in HWE, the significant associations of the rs2910164 polymorphism with TG, TC, LDL-C, and HDL-C levels were also detected (Table 1).
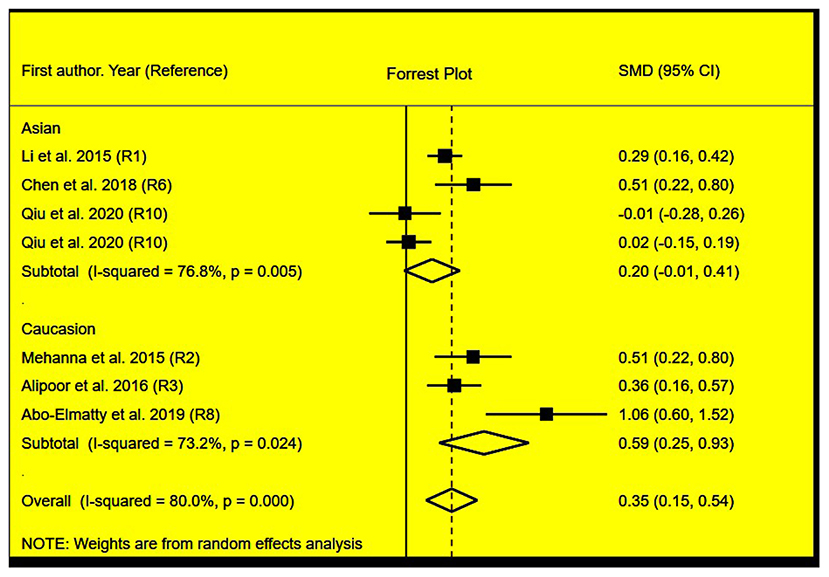
Figure 2. Forest plot of the meta-analysis between miRNA-146a rs2910164 polymorphism and plasma TG levels.
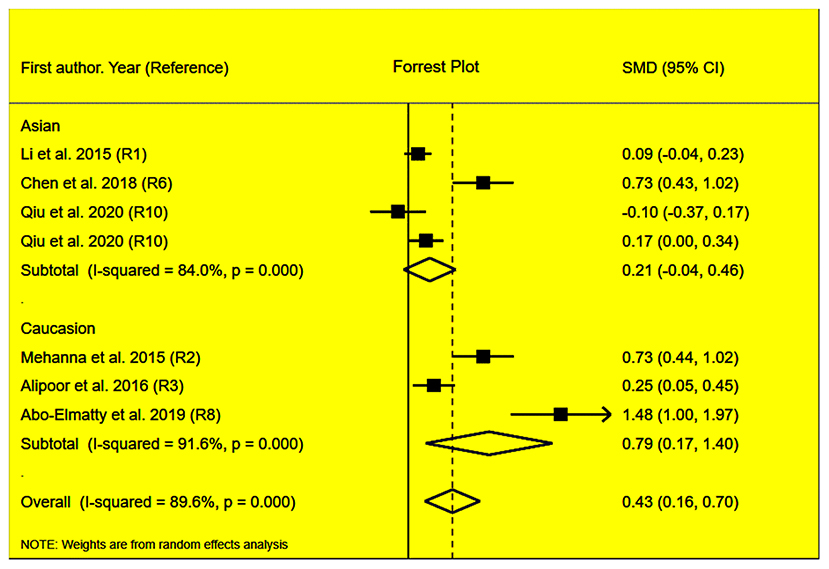
Figure 3. Forest plot of the meta-analysis between miRNA-146a rs2910164 polymorphism and plasma TC levels.
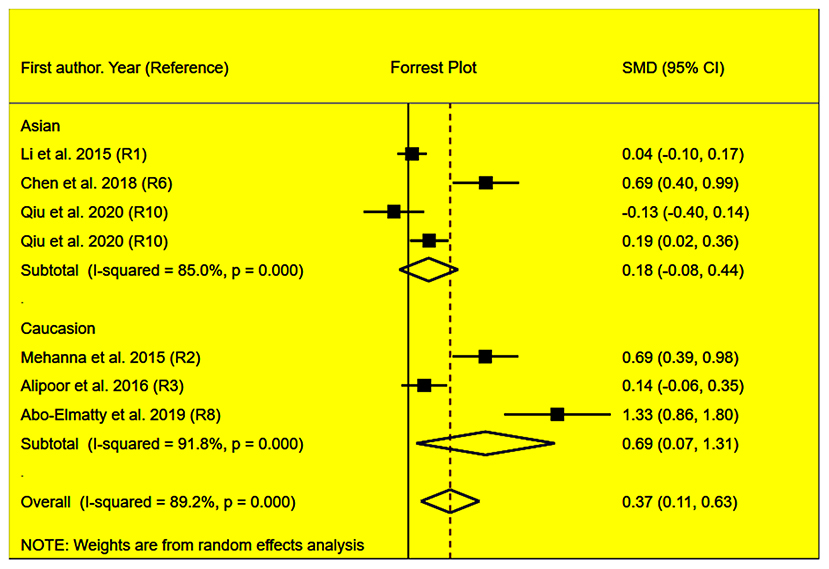
Figure 4. Forest plot of the meta-analysis between miRNA-146a rs2910164 polymorphism and plasma LDL-C levels.
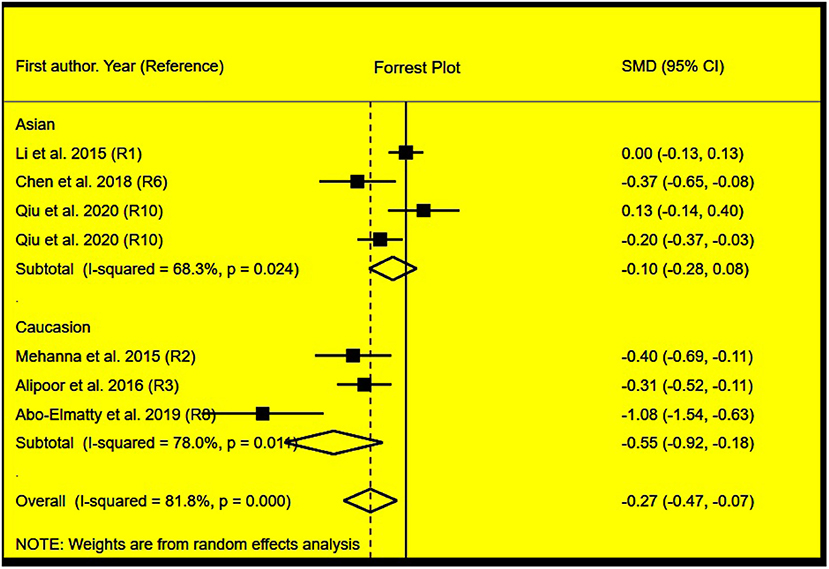
Figure 5. Forest plot of the meta-analysis between miRNA-146a rs2910164 polymorphism and plasma HDL-C levels.
Then, the subgroup analysis by the characteristics of the subjects (Table 1) showed that the significant associations of the rs2910164 polymorphism with TG, TC, LDL-C, and HDL-C levels were only observed in Caucasians and females (Table 1). In addition, a marginal significance was observed in patients with CVD in the association analysis between the rs2910164 polymorphism and TG levels (Table 1).
The analysis that excluded the studies with heterogeneity was also carried out (Table 2), and the analysis results showed that a significant association of the rs2910164 polymorphism with TG levels was observed in Caucasians, Asians, and CVD patients, while a significant association of the rs2910164 polymorphism with TC levels was only observed in Asians. Moreover, a significant association of the rs2910164 polymorphism with HDL-C levels was observed in Caucasians and Asians. However, only a marginal significance was observed in the analysis of the correlation between the rs2910164 polymorphism and LDL-C levels.
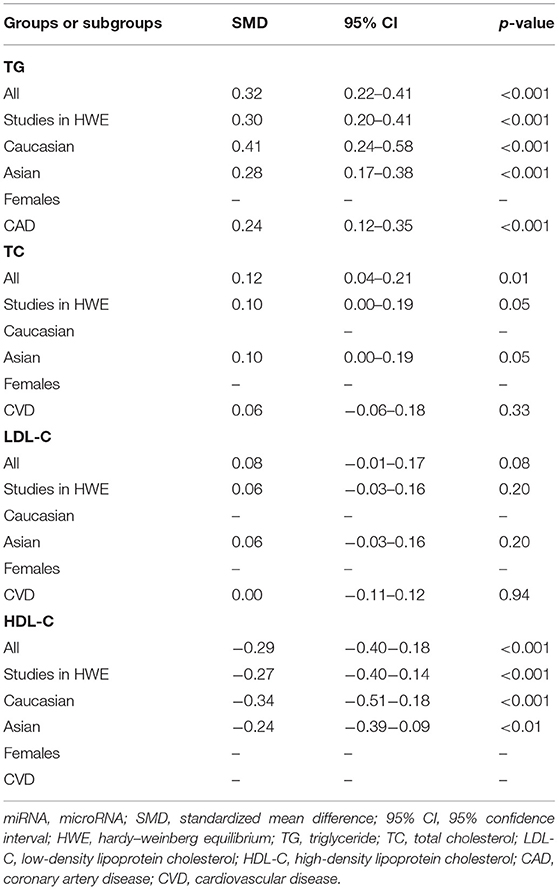
Table 2. Meta-analysis of the miRNA-146a rs2910164 polymorphism with lipid levels (after excluding the study with heterogeneity).
Associations of the rs3746444 Polymorphism With Lipid Levels
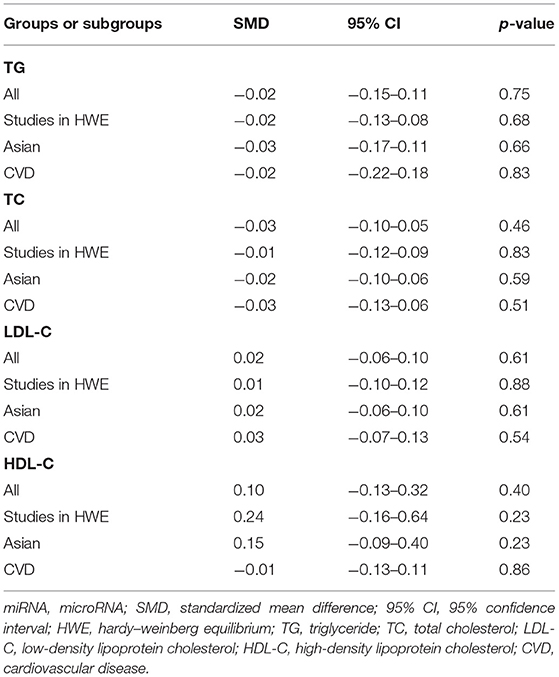
No statistical significance was observed in the analysis of associations of the rs3746444 polymorphism with TG (Supplementary Figure S1), TC (Supplementary Figure S2), LDL-C (Supplementary Figure S3), and HDL-C (Supplementary Figure S4) levels (Table 3). However, after excluding the studies with heterogeneity, the correlation between the rs3746444 polymorphism and TG levels showed statistical significance in Asians and CVD patients (see Table 4 for more details).
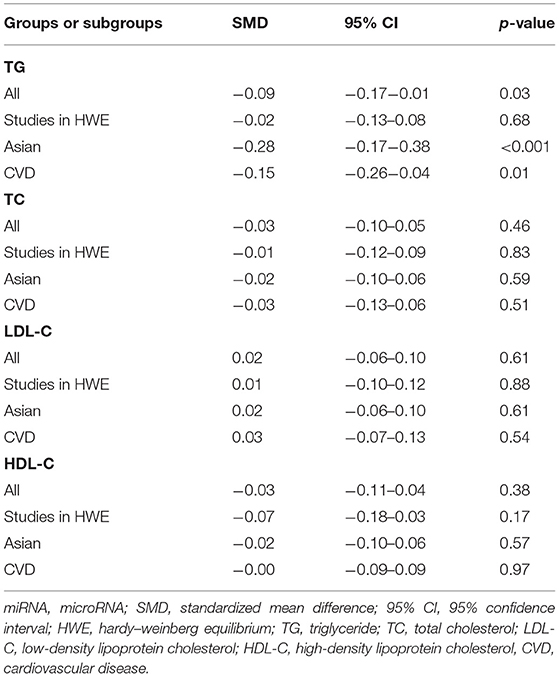
Table 4. Meta-analysis of the miRNA-499a rs3746444 polymorphism with lipid levels (after excluding the study with heterogeneity).
Evaluation of Heterogeneity
In the analysis of correlations between the rs2910164 polymorphism and lipid levels, significant heterogeneity was detected in TG, TC, LDL-C, and HDL-C (Table 1). Two (Abo-Elmatty and Mehanna, 2019; Qiu et al., 2020), three (Mehanna et al., 2015; Chen et al., 2018; Abo-Elmatty and Mehanna, 2019), three (Mehanna et al., 2015; Chen et al., 2018; Abo-Elmatty and Mehanna, 2019), and three (Li et al., 2015a; Abo-Elmatty and Mehanna, 2019; Qiu et al., 2020) comparisons were recognized as the main contributors to TG, TC, LDL-C, and HDL-C heterogeneity, respectively. SMD values and 95% CIs of TG, TC, and HDL-C did not change substantially after excluding these comparisons (Table 2). However, the SMD value and 95% CI of LDL-C (SMD = 0.08, 95% CI = −0.01–0.17, p = 0.08) changed significantly after excluding these outlier comparisons.
In the correlation analysis between the rs3746444 polymorphism and lipid levels, significant heterogeneity was detected in TG and HDL-C (Table 3). One comparison (Qiu et al., 2020) and one comparison (Chen et al., 2017) were recognized as the main contributors to TG and HDL-C heterogeneity, respectively. The SMD value and 95% CI of HDL-C did not change substantially after excluding this comparison (Chen et al., 2017). However, the SMD value and 95% CI of TG (SMD = −0.09, 95% CI = −0.17−0.01, p = 0.03) changed significantly after excluding this comparison (Qiu et al., 2020).
Sensitivity Analysis
Sensitivity analysis showed that no comparison may affect the associations of the rs3746444 polymorphism with the TC (Supplementary Figure S5), LDL-C (Supplementary Figure S6), and HDL-C (Supplementary Figure S7) levels. However, one comparison (Li et al., 2015a) may affect the significant associations of the rs2910164 polymorphism with the TC (Supplementary Figure S8), LDL-C (Supplementary Figure S9), and HDL-C (Supplementary Figure S10) levels as well as the significant correlation between the rs3746444 polymorphism and TG (Supplementary Figure S11) levels, while another comparison (Qiu et al., 2020) may affect the correlation between the rs2910164 polymorphism and TG (Supplementary Figure S12) levels.
The correlations between the rs2910164 and rs3746444 polymorphisms and lipid levels did not change substantially [rs2910164 and TG levels: (SMD = 0.41, 95% CI = 0.21–0.61, p <0.001); rs2910164 and TC levels: (SMD = 0.50, 95% CI = 0.17–0.84, p < 0.01); rs2910164 and LDL-C levels: (SMD = 0.45, 95% CI = 0.13–0.77, p = 0.01); rs2910164 on HDL-C levels: (SMD = −0.33, 95% CI = −0.55−0.10, p < 0.01); rs3746444 and TG levels: (SMD = 0.03, 95% CI = −0.07–0.13, p = 0.60)] after omitting above comparisons (Li et al., 2015a; Qiu et al., 2020). It indicated that the present analysis results were robust and stable.
Risk-of-Bias Test
In the association analysis between the rs3746444 polymorphism and lipid levels, some concerns were observed in the randomization process (33.3%) and measurement of the outcome (16.7%); however, the overall results showed a low risk of bias (66.7%) among the included studies (Supplementary Figure S13). It indicated that the studies included in the meta-analysis were of relatively high quality. In addition, there was no risk of bias in the analysis of association of the rs3746444 polymorphism with lipid levels in addition to some concerns (33.3%) in the randomization process (Figure 6).
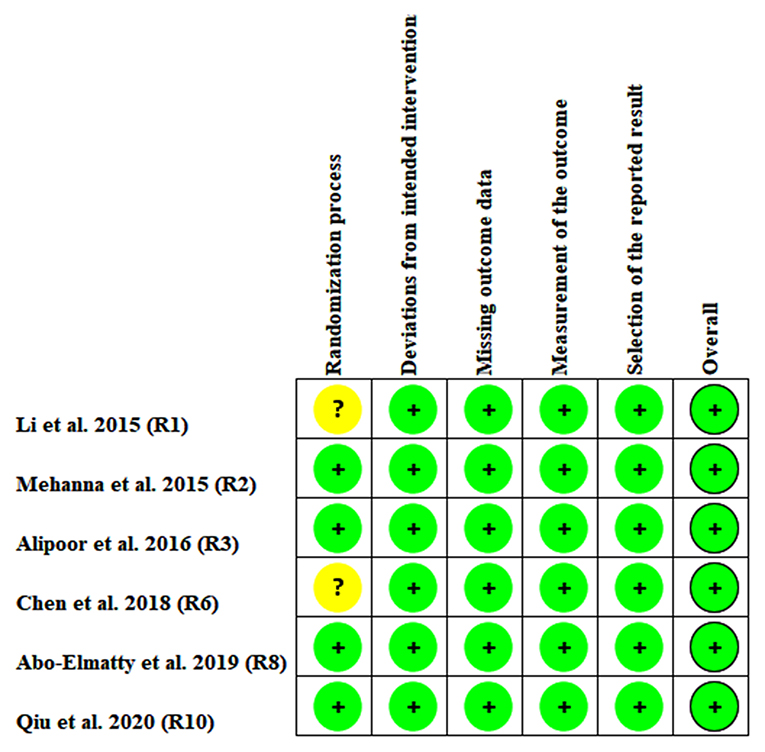
Figure 6. Risk bias plot of the meta-analysis between miRNA-146a rs2910164 polymorphism and plasma lipid levels (for assessment of each entry, green represents low risk of bias and yellow refers to unclear risk of bias).
Publication Bias Test
In the present study, all the funnel plots were symmetric visually (Figure 7; Supplementary Figures S14–S20). Begg's test did not find any publication bias in the analysis for the rs2910164 and rs3746444 polymorphisms, which was confirmed by Egger's regression test [p = 0.22 for rs2910164 and TG (Figure 7), p = 0.06 for rs2910164 and TC (Supplementary Figure S14), p = 0.06 for rs2910164 and LDL-C (Supplementary Figure S15), p = 0.07 for rs2910164 and HDL-C (Supplementary Figure S16), p = 0.34 for rs3746444 and TG (Supplementary Figure S17), p = 0.27 for rs3746444 and TC (Supplementary Figure S18), p = 0.10 for rs3746444 and LDL-C (Supplementary Figure S19), p = 0.18 for rs3746444 and HDL-C (Supplementary Figure S20)].
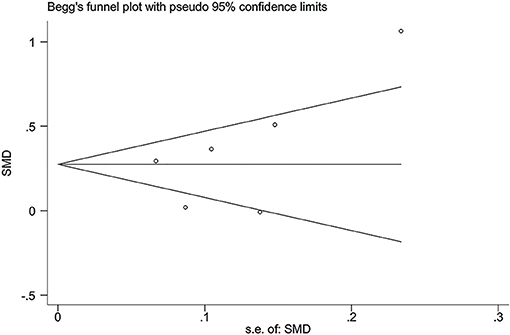
Figure 7. Begg's funnel plot of the association analysis between miRNA-146a rs2910164 polymorphism and plasma TG levels.
Discussion
The present study showed that the rs2910164 polymorphism of miRNA-146a was significantly associated with increased TG, TC, and LDL-C levels as well as decreased HDL-C levels in Caucasians and females. However, the rs3746444 polymorphism of miRNA-499a only decreased the TG levels in Asians and CVD patients.
The underlying mechanisms whereby the rs2910164 polymorphism of miRNA-146a affects lipid levels largely depended on the following pathways: (1) by attenuating toll-like receptor 4 (TLR4) counts. TLR4 is a known target of miRNA-146a and plays a key role in lipid uptake (Choi et al., 2009); the increase of miRNA-146a protein caused by the rs2910164 polymorphism (Shen et al., 2008; Ramkaran et al., 2014; Xiong et al., 2014) inhibits the expression of TLR4 (Shen et al., 2008), thus reducing lipid uptake and resulting in dyslipidemia. (2) By attenuating the sortilin-1 (Sort1) expression. Sort1 is a novel target of miRNA-146a and contributes to LDL-C degradation (Musunuru et al., 2010); the increase of miRNA-146a expression caused by the rs2910164 polymorphism (Shen et al., 2008; Ramkaran et al., 2014; Xiong et al., 2014) may inhibit the expression of Sort1 (Cheng et al., 2017), thus repressing the degradation of LDL-C in plasma. (3) By attenuating the expression of interleukin-1 receptor-associated kinase-1 (IRAK-1) and dysfunction of ATP-binding cassette transporter A1 (ABCA1)/ATP-binding cassette transporter G1 (ABCG1). IRAK-1 is a regulator of ABCA1/ABCG1 (Maitra et al., 2009); the increase of miRNA-146a expression caused by the rs2910164 polymorphism (Shen et al., 2008; Ramkaran et al., 2014; Xiong et al., 2014) may induce the dysfunction of ABCA1/ABCG1 by downregulating the expression of IRAK-1 (Li et al., 2015b). It is well-known that ABCA1/ABCG1 plays a central role in reverse cholesterol transport (RCT); the dysfunction of ABCA1/ABCG1 caused by the rs2910164 polymorphism may therefore result in dyslipidemia. The mechanisms underlying the rs3746444 polymorphism which reduced the TG levels have not been clarified yet. However, osbpl1a, a target of miRNA-499a (Chen et al., 2017), has been proved to play a crucial role in lipid metabolism regulation. The largely decreased miRNA-499a protein levels caused by the rs3746444 polymorphism (Chen et al., 2017) may increase the expression levels of osbpl1a, thus decreasing the TG levels.
Atherogenic dyslipidemia is characterized by increased levels of TG, TC, and LDL-C and/or decreased level of HDL-C in plasma. In the present study, the rs2910164 polymorphism significantly increased the plasma levels of TG, TC, and LDL-C and significantly decreased the plasma levels of HDL-C (Table 1). It indicated that the rs2910164 polymorphism of the miRNA-146a gene was significantly associated with atherogenic dyslipidemia, considering that atherogenic dyslipidemia is one of the most important risk factors for CAD and accounts for at least 50% of the population-attributable risk (Yusuf et al., 2004). It is not difficult to speculate that the positive correlation between the rs2910164 polymorphism and CAD (Liu et al., 2017; Zhou et al., 2017) was mediated, at least partly, by atherogenic dyslipidemia. Interestingly, this speculation was verified in our study whereby the largely increased TG levels caused by the rs2910164 polymorphism were observed in CAD patients (Table 2). More importantly, whereas the correlation between the rs2910164 polymorphism and atherogenic dyslipidemia was robust and strong (Tables 1, 2), it indicated that the rs2910164 polymorphism of the miRNA-146a gene may be a new therapeutic target for CAD.
Regarding the rs3746444 polymorphism, only decreased TG levels were observed (Table 4); therefore, the positive correlation between this polymorphism and increased CAD risk (Labbaf et al., 2017) could not be interpreted by its effect on lipid levels. Instead, our data indicated that the rs3746444 polymorphism may be a cardiovascular protective factor since this polymorphism significantly decreased the TG levels in CVD patients (Table 4).
Subgroup analyses by gender, ethnicity, and health status were performed since they might be important environmental factors to determine associative risk with lipid metabolism. For instance, the present meta-analysis indicated that gender might modulate the associations of the rs2910164 polymorphism with lipid levels since the significant associations were only observed in females (Table 1). Moreover, ethnicity might also modulate the associations of the rs2910164 polymorphism with lipid levels due to a stronger association which was observed in Caucasians, but not in Asians (Tables 1, 2).
According to the 2018 ACC/AHA (Grundy et al., 2019), the 2019 ESC/EAS (Mach et al., 2020), and the adult treatment panel III (ATP III) cholesterol guidelines (National Cholesterol Education Program (NCEP) Expert Panel on Detection, 2002), LDL-C was considered as the major cause of CAD and treated as the primary target for therapy, while other lipids were used as the secondary or supplementary therapeutic targets. In the present study, the rs2910164 polymorphism showed a relatively strong correlation with LDL-C levels in preliminary analysis (SMD = 0.37, 95% CI = 0.11–0.63, p = 0.01). In addition, sensitivity analysis further strengthened its effect on LDL-C levels (SMD = 0.45, 95% CI = 0.13–0.77, p = 0.01). It indicated that the rs2910164 polymorphism was robustly correlated with LDL-C levels. However, the correlation between the rs2910164 polymorphism and LDL-C levels only showed a marginal significance (SMD = 0.08, 95% CI = −0.01–0.17, p = 0.08) after excluding the studies with heterogeneity (Table 2). By using the Galbraith plot, the heterogeneity was primarily from two studies by Mehanna et al. (2015) and Abo-Elmatty and Mehanna (2019), in which the classification of populations was both Egyptian and females; it indicated that ethnicities and gender may contribute to the heterogeneity between the rs2910164 polymorphism and LDL-C levels. Together, our study showed that the rs2910164 polymorphism of the miRNA-146a gene was robustly associated with LDL-C levels; despite the heterogeneity, future population-based multicenter studies are needed to clarify or verify our findings.
Several limitations of the present meta-analysis should be noted. First of all, dyslipidemia is involved in a large number of genes as well as some environmental factors. However, the interactions of the rs2910164 polymorphism with other polymorphic loci or environmental factors on plasma lipid levels have not been investigated in this meta-analysis due to the lack of original data from the included studies. Secondly, a relatively small number of individuals were included in the lipid association analysis for rs2910164 and rs3746444 due to the limited number of studies that met the inclusion criteria, which may reduce the statistic power and even cause type I error (false-positive results). Thirdly, this meta-analysis only included the studies published in English and Chinese as it is very difficult to get the full papers published in various languages.
Conclusions
The miRNA-146a rs2910164 polymorphism is significantly associated with atherogenic dyslipidemia.
Data Availability Statement
The datasets presented in this study can be found in online repositories. The names of the repository/repositories and accession number(s) can be found in the article/Supplementary Material.
Author Contributions
ZL conceived and designed this study as well as drafted the manuscript. ZL, FL, and SW carried out the searches and collected the data. ZL and FL performed the statistical analyses. ZL and FL were responsible for revising the manuscript critically for important intellectual contents. All authors reviewed and approved the final manuscript.
Conflict of Interest
The authors declare that the research was conducted in the absence of any commercial or financial relationships that could be construed as a potential conflict of interest.
Publisher's Note
All claims expressed in this article are solely those of the authors and do not necessarily represent those of their affiliated organizations, or those of the publisher, the editors and the reviewers. Any product that may be evaluated in this article, or claim that may be made by its manufacturer, is not guaranteed or endorsed by the publisher.
Supplementary Material
The Supplementary Material for this article can be found online at: https://www.frontiersin.org/articles/10.3389/fgene.2021.746686/full#supplementary-material
References
Abo-Elmatty, D. M., and Mehanna, E. T. (2019). MIR146A rs2910164 (G/C) polymorphism is associated with incidence of preeclampsia in gestational diabetes patients. Biochem. Genet. 57, 222–233. doi: 10.1007/s10528-018-9886-1
Begg, C. B., and Mazumdar, M. (1994). Operating characteristics of a rank correlation test for publication bias. Biometrics 50, 1088–1101. doi: 10.2307/2533446
Chen, C. M., Dong, S. H., Li, H. M., Chen, T. T., Liu, H. D., and Xiong, W. (2018). The correlation of microRNA-146a gene polymorphism and acute coronary syndrome. Journal of Jilin Medicine. 39, 2045–2047. doi: 10.3969/j.issn.1004-0412.2018.11.019
Chen, L. B., Zheng, H. K., Zhang, L., An, Z., Wang, X. P., Shan, R. T., et al. (2017). A single nucleotide polymorphism located in microRNA-499a causes loss of function resulting in increased expression of osbpl1a and reduced serum HDL level. Oncol. Rep. 38, 3515–3521. doi: 10.3892/or.2017.6016
Cheng, H. S., Besla, R., Li, A., Chen, Z., Shikatani, E. A., Nazari-Jahantigh, M., et al. (2017). Paradoxical suppression of atherosclerosis in the absence of microRNA-146a. Circ. Res. 121, 354–367. doi: 10.1161/CIRCRESAHA.116.310529
Choi, S. H., Harkewicz, R., Lee, J. H., Boullier, A., Almazan, F., Li, A. C., et al. (2009). Lipoprotein accumulation in macrophages via toll-like receptor-4-dependent fluid phase uptake. Circ. Res. 104, 1355–1363. doi: 10.1161/CIRCRESAHA.108.192880
DerSimonian, R., and Kacker, R. (2007). Random-effects model for meta-analysis of clinical trials: an update. Contemp. Clin. Trials 28, 105–114. doi: 10.1016/j.cct.2006.04.004
Grundy, S. M., Stone, N. J., Bailey, A. L., Beam, C., Birtcher, K. K., Blumenthal, R. S., et al. (2019). 2018 AHA/ACC/ AACVPR/AAPA/ABC/ACPM/ADA/AGS/APhA/ASPC/NLA/PCNA guideline on the management of blood cholesterol: a report of the American college of cardiology/american heart association task force on clinical practice guidelines. Circulation 139, 1082–1143. doi: 10.1161/CIR.0000000000000700
Higgins, J. P. T., and Green, S. (eds)., (2006). Cochrane Handbook for Systematic Reviews of Interventions 4.2.6 [Updated September 2006]. The Cochrane Collaboration. Chichester: John Wiley & Sons, Ltd. 1–256.
Huang, S., Lv, Z., Deng, Q., Li, L., Yang, B., Feng, J., et al. (2015). A genetic variant in pre-miR-146a (rs2910164 C>G) is associated with the decreased risk of acute coronary syndrome in a Chinese population. Tohoku J. Exp. Med. 237, 227–233. doi: 10.1620/tjem.237.227
Ibrahim, R. R., Amer, R. A., Abozeid, A. A., Elsharaby, R. M., and Shafik, N. M. (2020). Micro RNA 146a gene variant / TNF-alpha / IL-6 / IL-1 beta; A cross-link axis inbetween oxidative stress, endothelial dysfunction and neuro-inflammation in acute ischemic stroke and chronic schizophrenic patients. Arch. Biochem. Biophys. 679:108193. doi: 10.1016/j.abb.2019.108193
Labbaf, A., Ghaedi, H., Alipoor, B., Omrani, M. D., Kazerouni, F., Shanaki, M., et al. (2017). The pre-mir-499 variant rs3746444 may contribute to coronary artery disease susceptibility: a case-control and meta-analysis study. Clin. Lab. 63, 587–595. doi: 10.7754/Clin.Lab.2016.161011
Li, Q., Chen, L., Chen, D., Wu, X., and Chen, M. (2015a). Influence of microRNA-related polymorphisms on clinical outcomes in coronary artery disease. Am J Transl Res. 7, 393–400. eCollection 2015.
Li, X., Ji, Z., Li, S., Sun, Y. N., Liu, J., Liu, Y., et al. (2015b). miR-146a-5p antagonized AGEs- and P.g-LPS-induced ABCA1 and ABCG1 dysregulation in macrophages via IRAK-1 downregulation. Inflammation 38, 1761–1768. doi: 10.1007/s10753-015-0153-x
Liberati, A., Altman, D. G., Tetzlaff, J., Mulrow, C., Gotzsche, P. C., Ioannidis, J. P. A., et al. (2009). The PRISMA statement for reporting systematic reviews and meta-analyses of studies that evaluate health care interventions: explanation and elaboration. J. Clin. Epidemiol. 62, 1–34. doi: 10.1016/j.jclinepi.2009.06.006
Liu, X., You, L., Zhou, R., and Zhang, J. (2017). Significant association between functional microRNA polymorphisms and coronary heart disease susceptibility: a comprehensive meta-analysis involving 16484 subjects. Oncotarget 8, 5692–5702. doi: 10.18632/oncotarget.14249
Mach, F., Baigent, C., Catapano, A. L., Koskinas, K. C., Casula, M., Badimon, L., et al. (2020). 2019 ESC/EAS Guidelines for the management of dyslipidaemias: lipid modification to reduce cardiovascular risk. Eur. Heart J. 41, 111–188. doi: 10.1093/eurheartj/ehz455
Maitra, U., Parks, J. S., and Li, L. (2009). An innate immunity signaling process suppresses macrophage ABCA1 expression through IRAK-1-mediated downregulation of retinoic acid receptor alpha and NFATc2. Mol. Cell Biol. 29, 5989–5997. doi: 10.1128/MCB.00541-09
Mehanna, E. T., Ghattas, M. H., Mesbah, N. M., Saleh, S. M., and Abo-Elmatty, D. M. (2015). Association of MicroRNA-146a rs2910164 gene polymorphism with metabolic syndrome. Folia Biol. (Praha). 61, 43–48. doi: 10.3109/07435800.2015.1066802
Mir, R., Elfaki, I., Jha, C., Javid, J., Rehman, S., Banu, S., et al. (2020). Molecular evaluation of MicroRNA-146 Gene Variability (rs2910164 C> G) and its association with increased susceptibility to coronary artery disease. Microrna. 9, 363–372. doi: 10.2174/2211536609666201209151130
Musunuru, K., Strong, A., Frank-Kamenetsky, M., Lee, N. E., Ahfeldt, T., Sachs, K. V., et al. (2010). From noncoding variant to phenotype via SORT1 at the 1p13 cholesterol locus. Nature 466, 714–719. doi: 10.1038/nature09266
National Cholesterol Education Program (NCEP) Expert Panel on Detection Evaluation, and Treatment of High Blood Cholesterol in Adults (Adult Treatment Panel III). (2002). Third report of the National Cholesterol Education Program (NCEP) expert panel on detection, evaluation, and treatment of high blood cholesterol in adults (adult treatment panel III) final report. Circulation 106, 3143–3421. doi: 10.1161/circ.106.25.3143
Qiu, H., Chen, Z., Lv, L., Tang, W., and Hu, R. (2020). Associations between microRNA polymorphisms and development of coronary artery disease: a case-control study. DNA Cell Biol. 39, 25–36. doi: 10.1089/dna.2019.4963
Ramkaran, P., Khan, S., Phulukdaree, A., Moodley, D., and Chuturgoon, A. A. (2014). miR-146a polymorphism influences levels of miR-146a, IRAK-1, and TRAF-6 in young patients with coronary artery disease. Cell Biochem. Biophys. 68, 259–266. doi: 10.1007/s12013-013-9704-7
Savović, J., Weeks, L., Sterne, J. A., Turner, L., Altman, D. G., Moher, D., et al. (2014). Evaluation of the cochrane collaboration's tool for assessing the risk of bias in randomized trials: focus groups, online survey, proposed recommendations and their implementation. Syst. Rev. 3:37. doi: 10.1186/2046-4053-3-37
Shen, J., Ambrosone, C. B., DiCioccio, R. A., Odunsi, K., Lele, S. B., and Zhao, H. (2008). A functional polymorphism in the miR-146a gene and age of familial breast/ovarian cancer diagnosis. Carcinogenesis 29, 1963–1966. doi: 10.1093/carcin/bgn172
Xiong, X. D., Cho, M., Cai, X. P., Cheng, J., Jing, X., Cen, J. M., et al. (2014). A common variant in pre-miR-146 is associated with coronary artery disease risk and its mature miRNA expression. Mutat. Res. 761, 15–20. doi: 10.1016/j.mrfmmm.2014.01.001
Yang, K., He, Y. S., Wang, X. Q., Lu, L., Chen, Q. J., Liu, J., et al. (2011). MiR-146a inhibits oxidized low-density lipoprotein-induced lipid accumulation and inflammatory response via targeting toll-like receptor 4. FEBS Lett. 585, 854–860. doi: 10.1016/j.febslet.2011.02.009
Yusuf, S., Hawken, S., Ounpuu, S., Dans, T., Avezum, A., Lanas, F., et al. (2004). Effect of potentially modifiable risk factors associated with myocardial infarction in 52 countries (the INTERHEART study): case-control study. Lancet 364, 937–952. doi: 10.1016/S0140-6736(04)17018-9
Zhang, Y. G., Song, Y., Guo, X. L., Miao, R. Y., Fu, Y. Q., Miao, C. F., et al. (2019). Exosomes derived from oxLDL-stimulated macrophages induce neutrophil extracellular traps to drive atherosclerosis. Cell Cycle 18, 2674–2684. doi: 10.1080/15384101.2019.1654797
Keywords: miRNA-146a, rs2910164, miRNA-499a, rs3746444, dyslipidemia
Citation: Liu F, Wang S and Luo Z (2021) Associations of the miRNA-146a rs2910164 and the miRNA-499a rs3746444 Polymorphisms With Plasma Lipid Levels: A Meta-Analysis. Front. Genet. 12:746686. doi: 10.3389/fgene.2021.746686
Received: 24 July 2021; Accepted: 24 August 2021;
Published: 27 September 2021.
Edited by:
Joaquim S. L. Vong, The Chinese University of Hong Kong, Hong Kong, SAR ChinaReviewed by:
Amit Kumar Dixit, Central Council for Research in Ayurvedic Science, IndiaWeichieh Lee, Kaohsiung Chang Gung Memorial Hospital, Taiwan
Copyright © 2021 Liu, Wang and Luo. This is an open-access article distributed under the terms of the Creative Commons Attribution License (CC BY). The use, distribution or reproduction in other forums is permitted, provided the original author(s) and the copyright owner(s) are credited and that the original publication in this journal is cited, in accordance with accepted academic practice. No use, distribution or reproduction is permitted which does not comply with these terms.
*Correspondence: Zhi Luo, ZHJ6aGlsdW9AZm94bWFpbC5jb20=
 Fuqiang Liu1
 Zhi Luo