 Agnes Omire
 Johnstone Neondo
 Nancy L. M. Budambula
 Laura Wangai4
- 1Department of Botany, School of Biological Sciences, Jomo Kenyatta University of Agriculture and Technology, Nairobi, Kenya
- 2Institute for Biotechnology Research (IBR), Jomo Kenyatta University of Agriculture and Technology, Nairobi, Kenya
- 3Department of Biological Sciences, School of Pure and Applied Sciences, University of Embu, Embu, Kenya
- 4Department of Biomedical Sciences, School of Health Sciences, Kirinyaga University, Kerugoya, Kenya
Doum palm (Hyphaene compressa) is a perennial economic plant primarily growing in Kenya’s Arid and Semi-Arid Lands (ASALs). It is heavily relied upon for food, animal feed, construction materials and medicine, making it an ideal plant for resource sustainability. However, the limited information on its genetic resources has hindered its breeding and conservation studies. This study used the genotyping by sequencing approach to identify Single Nucleotide Polymorphisms. These SNPs were further used to assess the genetic diversity and population structure of 96 H. compressa accessions from Coastal, Northern and Eastern ASAL regions of Kenya using two approaches; reference-based and de novo-based assemblies. STRUCTURE analysis grouped the sampled accessions into two genetic clusters (Cluster 1 and Cluster 2). Cluster 1 included accessions from the Northern region, whereas Cluster 2 included all accessions from Eastern and Coastal regions. Accessions from Kwale (Coastal) had mixed ancestry from both Cluster 1 and Cluster 2. These STRUCTURE findings were further supported by principal components analysis, discriminant analysis of principal components and phylogenetic analysis. Analysis of molecular variance indicated greater genetic variation within populations (92.7%) than among populations (7.3%). An overall FST of 0.074 was observed, signifying moderate genetic differentiation among populations. The results of this study will provide information useful in breeding, marker-assisted selection and conservation management of H. compressa.
Introduction
Hyphaene compressa H. Wendl., also known as the East African doum palm, is a member of the Arecaceae family. It is integral in the agroforestry system of coastal and riverine parts of Africa (Amwatta, 2004; Uhl and Moore, 2019). The doum palm also grows in the arid and semi-arid lands (ASALs) of Kenya (Maundu and Tengnas, 2005). It is a valuable source of food, animal feed, medicine for headaches and worms, as well as non-wood products for construction and weaving. Thus, it is a substantial income-generating plant, particularly for women in ASALs who derive their livelihoods from the sale of woven leaf products (Amwatta, 2004; Maundu and Tengnas, 2005; Omire et al., 2020a). The ability to withstand waterlogging, drought and salinity makes the doum palm a reliable economic plant with ability to avert natural calamities including drought in such areas (Amwatta, 2004; Omire et al., 2020a).
In Kenyan ASALs, non-timber products are restricted to a few plant species such as H. compressa, subsequently threatening its existence. Thus, H. compressa is classified as a threatened and a national priority species in the ASALs of Kenya with a high potential for genetic erosion due to overexploitation by the rural communities (Kigomo, 2001). However, the International Union for Conservation of Nature (IUCN) considers it a species of least concern with an unknown population trend due to its wide geographical distribution throughout East Africa (Cosiaux et al., 2017). Whereas species might exist as large populations they could be regionally threatened. Hyphaene. compressa resources are known to be strained and overexploited in the Eastern part of Kenya (Omire et al., 2020a). Despite this knowledge on the status, there are no known interventions to reverse the current trend (Kigomo, 2001). This could exacerbate the risk of extinction of such species (Cosiaux et al., 2018).
Threats to H. compressa include human interference as well as biotic and abiotic stress (Omire et al., 2020a). Overgrazing by pastoralist communities, particularly along the riverine areas, is a significant threat to this palm since livestock graze and browse on H. compressa (Kigomo, 2001). The strain on H. compressa resources has been aggravated by the sedentarization of the nomadic pastoralists (Amwatta, 2004). Sedentarization leads to the assemblage of pastoralists around limited resources and ultimately to land degradation (Johnson, 1993). Another source of pressure on H. compressa is overharvesting and harvesting of immature sword leaves. These leaf pressures have been shown to cause dwarfing in a sister palm, Hyphaene thebaica (Kahn and Luxereau, 2008). Other selection pressures on H. compressa include logging, burning and wine tapping from the apical meristem. These pressures collectively lead to genetic drift through the loss of specific genotypes, which might eventually affect the H. compressa gene pool (Kigomo, 2001).
There is scanty information on the genetic diversity of doum palm which limits access to its important traits and thus hinders its improvement. Previous diversity studies on H. compressa focussed on accessing the variability of its morphological traits (Omire et al., 2020b). The study identified five morphotypes with accessions from the Kenyan Coastal area being the most heterogeneous. However, this cannot be used to adequately delineate the doum palm since morphological markers may also be affected by the environment, are limited in number, unstable, slow and some appear late in plant development making them difficult to score (Andersen and Lubberstedt, 2003; Mokhtar et al., 2016). Furthermore, using a single marker like morphology is not adequate to assess diversity (Khan et al., 2012). Overall, genetic markers are superior to morphological markers (Ganie et al., 2015) and may or may not agree with phenotypic expression of a genomic trait.
For non-model plants like doum palm with no reference genome, sequencing the whole genome to mine the SNPs would be ideal. There are other methods like Genotyping by Sequencing (GBS) that are able to acquire in depth data on parts of the genome and are as effective but less costly compared to whole genome sequencing (Wallace and Mitchell, 2017). GBS is a method that provides reduced libraries for Illumina next generation sequencing (NGS) by targeting the subsets with restriction enzymes followed by ligation of DNA barcoded adapters (Elshire et al., 2011). PCR amplification and high throughput NGS of the genomic subsets on a single lane of flow cells is then done (Elshire et al., 2011; He et al., 2014; Burghardt, et al., 2017). GBS is simple, rapid and highly reproducible (Davey et al., 2011; Burghardt et al., 2017). These features make GBS highly attractive for several genetic applications, including genetic diversity, phylogeny, genome-wide association studies, association maps, genomic selection, physical and linkage maps (Burghardt et al., 2017). GBS is an ideal tool for genetic diversity studies with the advantage of being able to identify SNPs, insertions, deletions and microsatellites (Elshire et al., 2011) even in non-model organisms with no prior genome information (Taranto et al., 2016). Diversity studies can be combined with phylogenetic studies to provide more information on the origin and domestication of the germplasm for conservation purposes (Burghardt et al., 2017). Earlier studies have alluded to the fact that the evolution of a population is guided by its local interactions in the environment (Klimova et al., 2018). Gene flow has a tendency to homogenize populations and reduce genetic variability (Brunet et al., 2012). However, there needs to be enough gene pool on which selection can take place for effective speciation.
Thus far, the genetic diversity of H. compressa remains unknown despite its economic and subsistence role in Africa’s ASALs. There were no H. compressa or other palms in the genus Hyphaene with assembled genomes at the time of this study. Due to the scanty genetic information coupled with the pressure already demonstrated on this palm, there is a need to decipher its genetics. This study assumes that the different accessions of H. compressa growing in Kenya are diverse. The present study aimed to identify genome-wide SNPs, assess the level of genetic diversity, determine the population structure and estimate gene flow between H. compressa accessions collected from four ASAL regions of Kenya using GBS approach. The data obtained from this study will be an important genomic resource that will be used to inform the conservation, management, breeding and propagation of H. compressa.
Materials and Methods
H. compressa Plant Materials
A total of 96 H. compressa accessions collected between February and August of 2018 were used in this study. These accessions were collected from different ASALs of Kenya; Eastern (Tharaka Nithi County), Northern (Turkana County), Coastal (Kwale and Tana River counties) as shown in Figure 1 and Supplementary Table S1. Leaf samples of the selected plants were collected using sterile blades and placed in sterile tubes containing 10 g of silica gel for DNA extraction. Accessions within approximately the same age group and located as distantly as possible from each other were sampled.
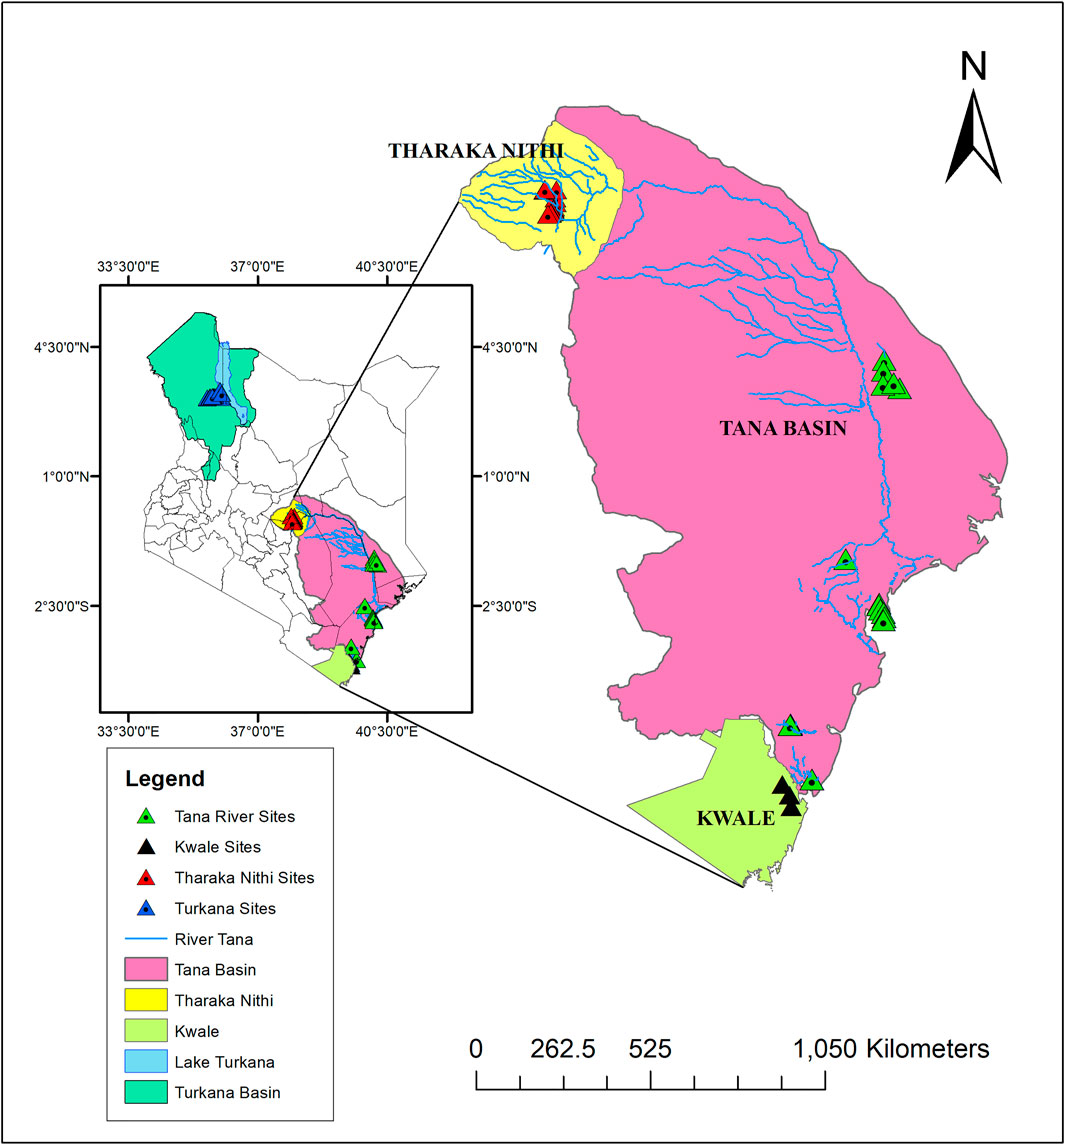
FIGURE 1. Map illustrating H. compressa sampling points along the Turkana and Tana basins. Map was created using ArcMap version 10.8.
Preparation of Libraries and Sequencing
Genomic DNA was isolated from H. compressa leaves using DNeasy® Plant Mini Kit (Qiagen, Germany). The purity and quantity of the DNA were determined using Qubit Fluorometer (Invitrogen) or microplate reader (DR-200B, Diatek), while a 1% agarose gel was used to confirm its integrity. Commercial GBS sequencing was done at Beijing Genomics Institute (BGI, China). A total of 96 samples; Tharaka (27), Turkana (21), Tana River (20) and Kwale (28), passed the sample quality check (QC) and proceeded to library preparation.
Library preparation was done following the method previously described by Elshire et al. (2011). Essentially, the DNA samples were barcoded and adapter pairs plated. The restriction enzyme ApeK1 (GCWGC as the recognition site) was used, followed by adapter ligation to the DNA fragments. This was followed by pooling and purification. PCR was then performed using primers with adapter binding sites. Sample clean-up of the PCR products, fragment size selection and sequencing on a Hiseq X10 platform as paired-end 100 bp (Illumina PE 100) was done. Adapter sequences, sequences with low-quality reads, and those lacking barcodes were discarded from the raw reads.
The data was processed using the de_novo and reference-based approaches. In the de_novo assembly, ipyrad version 0.9.74 (Eaton and Overcast, 2020) was used to assemble sequences without a reference genome using the following parameters; assembly method de_novo, datatype pairgbs, mindepth_statistical 6, mindepth_majrule 6, min_samples_locus 4 and other parameters set to default. In the reference-based approach, paired read ends were mapped to the Phoenix dactylifera (date palm) genome (Hazzouri et al., 2019). A confamilial (same family) reference genome was used for SNP calling (Galla et al., 2019) since H. compressa had no assembled genome at the time of this study. These two palms belong to the same subfamily Coryphoideae. Phoenix dactylifera genome was the only available genome in this subfamily. Alignment of the sequence reads against the date palm reference genome was done using the Burrows-Wheeler Aligner (BWA) using the parameters ‘mem–t4 –k32 –M’ (Li and Durbin, 2009). SNP filtering was done using VCFtools version 0.1.16 (Danecek et al., 2011) with the following parameters; biallelic SNPs, min meanDp 2, removing indels, Minor Allele Frequency (MAF) 0.05, minDP 2, max-missing 0.8.
Data Analysis
The quality of the filtered VCF files were assessed using the R package tidyverse (Wickham et al., 2019). The read depth per site, heterozygosity, read depth per individual and read quality were determined.
Population Structure Analysis and Genetic Diversity
Population structure was determined by STRUCTURE software version 2.3.4 using the admixture model (Pritchard et al., 2000). Populations of K (K = 1–10) were run with three replications using a burn-in of 100, 000 generations and 100, 000 Markov Chain Monte Carlo (MCMC) iterations. The software STRUCTURE HARVESTER web Version 0.6.94 (Earl and VonHoldt, 2012) available at http://taylor0.biology.ucla.edu/structureHarvester/ was used to determine the optimal K value using the adhoc delta K (Evanno et al., 2005). To plot the structure results, the POPHELPER version 2.3.1 package in R was used (Francis, 2017). Genotypes that had ≥0.80 membership proportion and those with less than this value were assigned to pure and admixture populations, respectively (Nkhoma et al., 2020).
Discriminant Analysis of Principal Components (DAPC) was also used to evaluate the population structure of H. compressa using the package adegenet version 2.1.3 (Jombart, 2008) in R. To visualize each sample’s assignment, a composite stacked bar plot illustrating the probability of population membership on the Y-axis was generated. Principal component analysis (PCA) was constructed using the R software package SNPrelate (Zheng et al., 2012) to determine the genetic relationships of H. compressa accessions.
Observed heterozygosity (Ho), Expected heterozygosity (He) fixation index (FST), inbreeding coefficient (FIS), Analysis of Molecular Variance (AMOVA) and pairwise FST values of the population were determined using Arlequin version 3.5.2.2 (Excoffier and Lischer, 2010).
Phylogenetic Analysis
To construct a splitstree, the filtered VCF file was converted to a nexus file using vcf2phylip.py script (Ortiz, 2019). The nexus file was then used to generate an unrooted splitstree using the neighbor net method in SplitsTree software, version 4.17.0 (Huson and Bryant, 2006). An UPGMA distance tree was also constructed using R software to represent the genetic clustering of H. compressa accessions.
Migration Rates Between the Eastern and Coastal Populations Along the Tana Basin
To determine if the population structure observed along the Tana basin is influenced by seed dispersal along the river, gene flow was estimated using MIGRATE-n software version 3.6.11. A Bayesian inference strategy was used with constant mutation rates among all loci. Burn in was set at 5,000 iterations at each locus. Static heating at four different temperatures (1, 1.5, 3 and 6) was used to improve the MCMC searches. One gene flow model was designed with direct migration from Tharaka to Tana River and to Kwale. The drainage of the Tana basin was used to design this model. Turkana accessions were excluded from this model since structure analysis and PCA demonstrated little historical gene flow. To judge whether the runs converged on good answers, the histograms and the effective population sizes were checked.
Results
Paired-end sequencing of 96 H. compressa accessions yielded an average of 2.4 million reads per sample. The de_novo-based assembly using ipyrad software resulted in 3,941 raw loci. After filtering, a total of 2,096 SNPs with a mean depth of 35.7 (minimum 10.47, maximum 217.45) were retained using the de_novo based assembly. On the other hand, reference-based assembly using date palm as a reference genome resulted in 3.4 million loci. After filtering, 23,146 biallelic SNPs with a mean depth of 3.5 (minimum 2, maximum 47.49) were obtained using the reference-based assembly.
The SNPs obtained from de_novo based assembly had higher depths than the reference-based assembly, as shown by the individual sequencing depth and the mean depth. The proportion of missing data per accession was low for both the de_novo based and reference-based assemblies, with a maximum of 0.04 and 0.4, respectively. These VCF quality statistics, including the mean depth, observed heterozygosity, depth per individual and missing data per individual, are presented for both the de_novo based assembly (Supplementary Figure S1) and reference-based assembly (Supplementary Figure S2).
In the de_novo based assembly there were 1,283 (61.2%) transition SNPs and 813 (38.8%) transversion SNPs with the following types: A↔G type (651, 31.1%), C↔T type (632, 30.2%), A↔C type (192, 9.2%), A↔T type (174, 8.3%), C↔G type (222, 10.6%), G↔T type (225, 10.7%). There were 16,598 (70.9%) transition SNPs and 6,818 (29.1%) transversion SNPs with the following types: A↔G type (8,332, 35.6%), C↔T type (8,266, 35.3%), A↔C type (1,684, 7.2%), A↔T type (1825, 7.8%), C↔G type (1,636, 7%), and G↔T type (1,673, 7.1%) in the reference based assembly. The A↔G and C↔T transition SNPs had the highest counts for both assemblies (Supplementary Table S2). The transition SNPs versus transversion SNPs (Ts/Tv) ratio was 1.6 in the de_novo based assembly and 2.4 in the reference based assembly.
Population Structure and Genetic Diversity
The optimal delta K was detected at K = 2 for both the de_novo-based assembly (Supplementary Figure S3A) and reference-based assembly (Supplementary Figure S3B), which inferred two genetic clusters of H. compressa (Figure 2). Cluster 1 consisted of accessions from Turkana while cluster 2 consisted of accessions from Tharaka, Kwale and Tana River for both reference-based and de_novo-based assemblies. The accessions in Cluster 2 were sampled along the Tana basin and Kwale county as shown in Figure 1. The expected heterozygosity was lower for the de_novo-based assembly for cluster 1 (He = 0.14) than cluster 2 (He = 0.23). However, similar expected heterozygosity values were observed in the reference-based assembly for the two clusters (He = 0.30). The genetic variation among populations in Cluster 1 was higher (de_novo FST = 0.68 and reference-based FST = 0.17) than Cluster 2 (de_novo FST = 0.3 and Reference-based FST = 0.06). A total of seven accessions from Kwale had admixed ancestry between Cluster 1 and Cluster 2 using the reference based assembly (Table 1). There were no accessions in the de_novo assembly that had admixed ancestry values less than 88%. Structure results indicate that two gene pools best describe the population structure of H. compressa. However, a smaller peak observed at K = 3 might be another informative H. compressa population clustering (Supplementary Figures S3, S4). Similar grouping of accessions using PCA for the de_novo and reference-based assemblies was observed in this study (Figure 3). In both PCA plots, Tharaka Nithi, Kwale and Tana River accessions were closely clustered. PCA results were congruent with structure results.
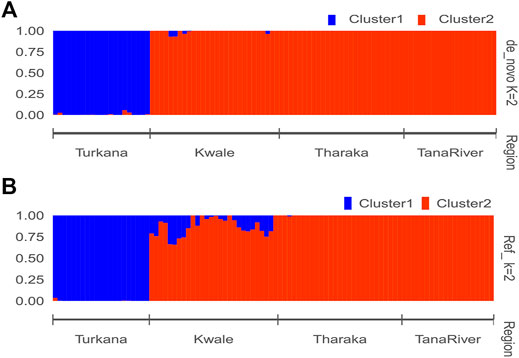
FIGURE 2. STRUCTURE bar plot of admixture model population assignment of 96 Hyphaene compressa accessions from Kenya based on 2,096 SNPs for the de_novo assembly (A) and 23,416 SNPs based on reference assembly (B). The accessions are divided into two clusters. A combination of different colors represents admixed populations.
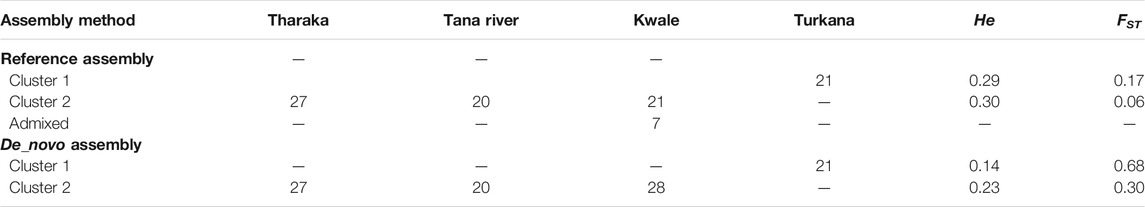
TABLE 1. STRUCTURE analysis of Hyphaene compressa from Kenya using reference-based and de_novo based assembly.
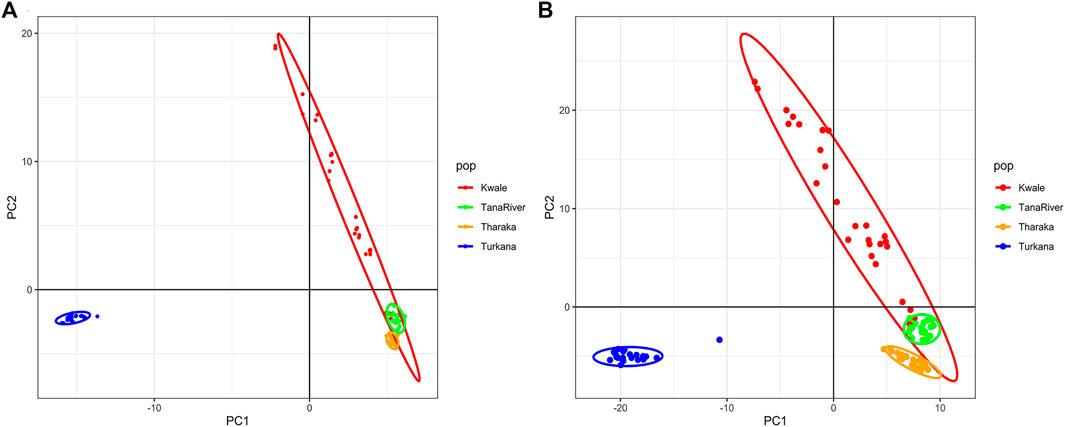
FIGURE 3. Principal Component Analysis (PCA) of Hyphaene compressa Kenyan accessions using 2096 SNPs obtained from the de novo assembly (A) and 23,416 SNPs obtained from the date palm reference based assembly (B).
DAPC analysis grouped H. compressa accessions into two clusters, with samples from Turkana falling to the right side of the DAPC vertical axis while the rest fell on the left side. There was moderate overlap between Kwale and Tana River accessions, while Tharaka accessions were distinctly separate (Figure 4). DAPC analysis, composite plot and genetic diversity results are shown for only the reference based assembly SNP data since both assembly methods had shown congruent results in structure and PCA analysis. Population membership assignment using DAPC composite plot confirmed structure and PCA results. All the accessions along the Tana basin exhibited admixture with profoundly shared ancestry between Tharaka and Tana River. Kwale had the highest level of admixture (Figure 5). DAPC results also confirmed no admixture between Turkana and accessions from the other regions.
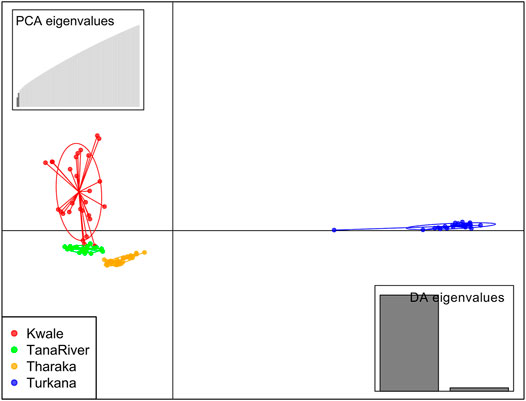
FIGURE 4. Discriminant analysis of principal components (DAPC) of 96 Hyphaene compressa Kenyan accessions using 23,416 SNPs derived from GBS analysis using reference-based assembly. Inertia ellipses represent clusters in different colors. Each dot on the circle represents an accession.
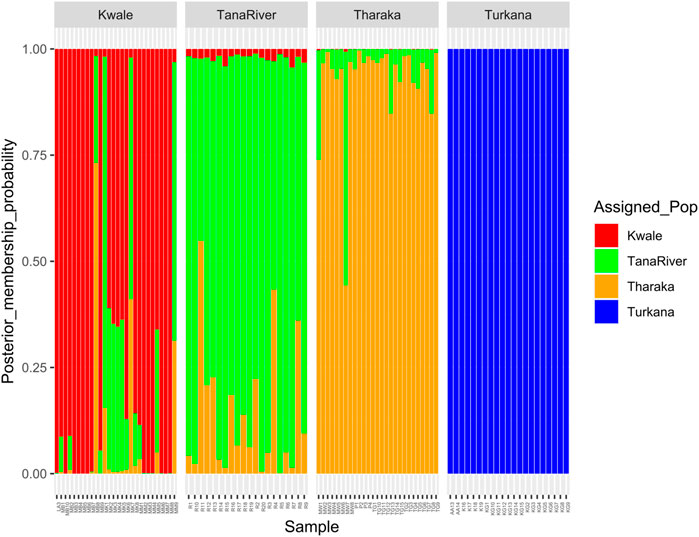
FIGURE 5. Composite plot of Hyphaene compressa Kenyan accessions using reference-based assembly showing mixed ancestry between Kwale, Tana River and Tharaka. Each accession is a stacked bar chart with populations shown in colors.
The four sampled regions of Tharaka, Tana River, Kwale and Turkana were assessed for the number of polymorphic sites, expected heterozygosity (He) or gene diversity, observed heterozygosity (Ho), FIS and FST. The genetic variation among the H. compressa populations was moderate (FST = 0.074, p ≤ 0.001). The observed heterozygosity was higher than the expected heterozygosity in all the populations (Table 2). Negative FIS values were obtained in all the populations, with Turkana having the lowest FIS value (−0.45). Kwale had the highest polymorphic sites (11,932) followed by Turkana (10,698) as shown in Table 2. Tana River had the lowest diversity (He = 0.23, Polymorphic sites = 8,370) of all the sampled regions (Table 2).
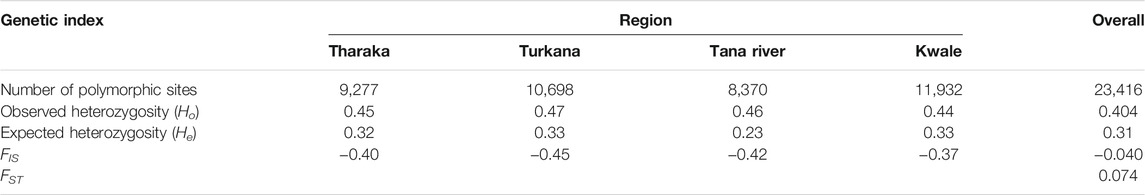
TABLE 2. Mean values of genetic diversity indices determined for Hyphaene compressa accessions in the sampled populations.
Pairwise FST values ranged between 0.025 (Tharaka and Tana River) and 0.105 (Turkana and Tana River). High pairwise FST was recorded among Turkana and Tana River samples (Table 3). The lowest pairwise FST was between Tharaka and Tana River, suggesting gene flow between the two regions. AMOVA showed that populations from each of the four regions of Turkana, Tharaka, Tana River and Kwale were slightly different from each other (p ≤ 0.001, Table 4). The variation within populations was higher (92.7%) than among populations (7.3%).
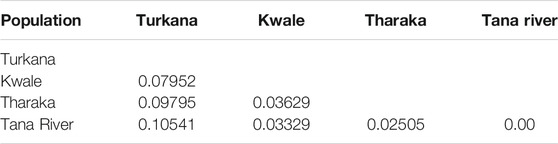
TABLE 3. Pairwise FST values of Kenyan populations of Hyphaene compressa.
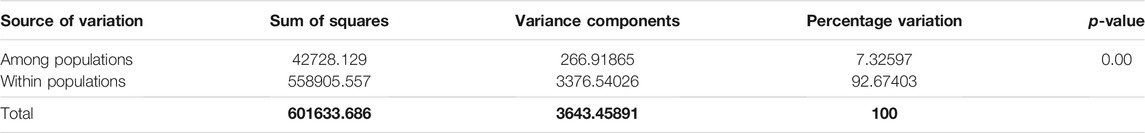
TABLE 4. Analysis of molecular variance (AMOVA) in genetic variation of Hyphaene compressa among and within populations of Kwale, Tharaka, Turkana and Tana River counties in Kenya.
Phylogenetic Analysis
The neighbor net network was able to group H. compressa accessions by region. Tana River, Kwale and Tharaka samples clustered closely compared to the Turkana, which was separated from the rest (Figure 6). Samples from Turkana clustered together. Some of the Kwale accessions clustered closely with Tana River while other Kwale accessions clustered more closely with Tharaka accessions. The UPGMA phylogenetic tree showed two main clusters with Turkana accessions clustering in one cluster and the rest of the accessions in the other cluster. Kwale populations also revealed reciprocal monophyly (Supplementary Figure S5).
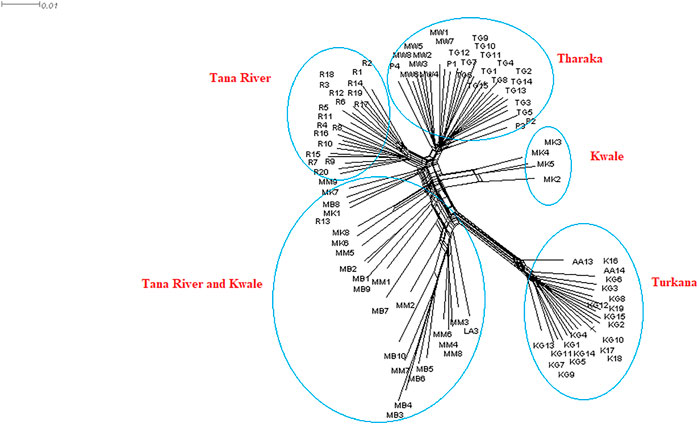
FIGURE 6. NeighbourNet network generated using 23,416 SNPs derived from reference-based GBS analysis of Kenyan Hyphaene compressa using SplitsTree version 4.17.0.
Migration Rates Among H. compressa Accessions Along the Tana Basin
The highest gene flow was observed from Tharaka and Tana River samples (m = 139.1), followed by Kwale to Tharaka (102.7), Tana River to Kwale (63.1), Tana River to Tharaka (59.9), Tharaka to Kwale (50.3) and Kwale to Tana River (57.7). These results indicate that the gene flow along the Tana basin was mostly asymmetrical (Supplementary Figure S6).
Discussion
This study is the first to report the use of SNPs through the GBS approach to characterize H. compressa accessions in Kenya. SNP markers are very stable, frequent and specific to regions of the genome which makes them ideal for use in marker assisted selection (MAS) and diversity studies to aid future germplasm conservation.
Two comparative methods (reference-based and de_novo-based approaches) were used to infer the population structure and genetic diversity of H. compressa. In the reference-based assembly, Phoenix dactylifera was used as a reference genome. This confamilial genome was used because H. compressa had no assembled genome at the time of this study. In the absence of a reference genome of the same species (conspecific) or genus (congeneric), a confamilial reference genome can be used to provide similar estimates of diversity (Brandies et al., 2019; Galla et al., 2019). Galla et al. (2019) further recommends using a confamilial reference genome as the most distant genome ideal for diversity studies. There were differences in the two methods concerning abundance, quality scores and the TS/TV ratios of the SNPs obtained. For example, the highest number of SNPs was observed from the reference-based assembly (23,416) compared to the de_novo-based assembly (2096). The reference-based assembly has also been previously demonstrated to outperform de_novo assembly in determining the number of SNPs in olive cultivars (D’Agostino et al., 2018). Elsewhere, it has been reported that parameters set during assembly and the type of assembly influence the number and depth of SNPs obtained (Bohling, 2020). Besides, more stringent parameters are normally used for de_novo assemblies. GBS of H. compressa accessions showed considerable SNP variations with transition SNPs (purine-purine or pyrimidine-pyrimidine) being the most frequent mutations. This high frequency in transition SNPs has also been observed in many plants such as Capsicum annuum, Vigna unguiculata, Elaeis guineensis, and Camelia sativa (Pootakham et al., 2015; Taranto et al., 2016; Xiong et al., 2016; Luo et al., 2019; Hyun et al., 2020), of which the C-T transitions are the most frequent (Edwards et al., 2007). However, low TS/TV ratio was observed in de_novo based assembly. This phenomenon has also been observed elsewhere and was attributed to the differences in the SNP calling methods (Shafer et al., 2017). Despite the difference between the two methods, structure analysis and PCA produced congruent results. A similar study that used a de_novo approach, a confamilial reference and a congeneric reference to determine the phylogenetic relationship of the Amaranthus genus, produced differing SNP counts but similar phylogenetic trees (Stetter and Schmid, 2017). Other studies have also reported differing SNP abundance between reference-based and de_novo assemblies but consistent population clustering (D’Agostino et al., 2018; Shafer et al., 2017; Stetter and Schmid, 2017).
STRUCTURE analysis grouped the H. compressa accessions into two gene pools. PCA and DAPC were consistent with these structure results. Accessions from Turkana (Northern Kenya) were pooled into cluster 1. Cluster 2 had the highest number of genotypes that included accessions collected along the Tana basin sites (Tharaka Nithi and Tana River) and Kwale. In addition, an admixture of accessions was reported for accessions from Kwale that showed mixed ancestry from Tharaka Nithi and Tana River. This admixture may be due to genetic exchange between Kwale, Tharaka Nithi and Tana river. These accessions also exhibited reciprocal monophyly based on phylogenetic analysis. This corroborates the phenotypic diversity studies on H. compressa where accessions from Kwale exhibited the highest phenotypic diversity compared to other regions (Omire et al., 2020b).
The fixation index (FST) is an informative method for measuring population differentiation among populations (Nassiry et al., 2009). An overall FST value of 0.074 was reported for H. compressa populations in this study. According to Nassiry et al. (2009), an FST of 0–0.05 is considered small, 0.05–0.15 is moderate and 0.15 and above is considered very high. Therefore, H. compressa accessions had moderate genetic differentiation. However, FST, values obtained from STRUCTURE population clustering indicate high genetic differentiation within cluster 1 (accessions from the northern part of Kenya) than cluster 2 (accessions along the Tana Basin). On the other hand, cluster two had higher levels of heterozygosity (He) compared to cluster 1. This indicates high diversity in accessions along the Tana basin. The high heterozygosity and lower genetic differentiation between H. compressa accessions along the Tana Basin (cluster 2) might be due to genetic exchange arising from gene flow. Although Tharaka Nithi is found approximately 163 and 391 miles away from Tana River and Kwale respectively, gene flow between these three counties seems high. This could be due to the flow of the River Tana (Figure 1), which traverses both Tharaka and Tana River counties and possibly serves as means of germplasm dispersion. This could explain why Tharaka samples are close to the Tana River accessions on the PCA and the high mixed ancestry as demonstrated by DAPC and STRUCTURE analysis. River Tana is the longest river and the most important drainage basin in Kenya. The river drains from the Kenyan highlands to the Eastern ASAL plateaus and coastal Kenya (Kitheka and Ongwenyi, 2002). Since H. compressa grows in riverine areas, seed dispersal through the river is an important factor influencing the population structure of H. compressa at the Kenyan Coast. Seed dispersal is essential for biodiversity conservation by driving plant gene flow, population dynamics and functional connectivity between regions (Traveset and Rodríguez-Pérez, 2018). Systematic seed dispersal favours gene flow, increases genetic diversity and lowers the genetic differentiation among populations (Paschoa et al., 2018). Migration rates using MIGRATE-n indicate that there is asymmetrical gene flow along the Tana basin. This supports the hypothesis that seed dispersal along the Tana River drives the population structure of H. compressa along the Coast. In addition, high migration rates were observed between Kwale and Tharaka an observation that is confirmed by phylogenetic analysis whereby some Kwale accessions clustered with Tharaka accessions.
There is restricted gene flow into or out of Turkana, which may cause differentiation of its population from the other populations. This was supported by STRUCTURE analysis, PCA, DAPC and neighbor net network, which clustered Turkana distinctly from the rest of the populations. This differentiation may be attributed to the physical distance between Turkana and the other populations. Isolation of Turkana populations inhibits them from mating with the other populations. Turkana is found in the far-flung northern part of Kenya and is considered 100% dryland with scarce rain fed agriculture (Barrow and Mogaka, 2007). In addition, the selection pressures in Turkana differ from those present in the other regions.
The negative FIS values obtained for H. compressa populations indicate low levels of inbreeding, high diversity and moderate connectivity between the populations. This may be influenced by the mating system. Hyphaene compressa is a dioecious plant (Stauffer et al., 2014), a condition that favors obligate cross pollination which inturn increases intrapopulation genetic diversity (Paschoa et al., 2018; Muyle et al., 2020). Dioecy is one of the adaptations in plants that promote outbreeding (Charlesworth, 2006). High genetic diversity and low inbreeding in H. compressa was also supported by AMOVA results which showed higher (92.7%) within population diversity than among population diversity (7.3%).
The understanding of the genetic diversity and population structure within H. compressa provides useful information for future selection and appropriate conservation strategies. High priority should be given to the conservation of all populations with high genetic diversity. The conservation of H. compressa must consider the two identified clusters to ensure that the high diversity within populations is retained. This can be achieved by maximum collection and ex situ conservation of germplasm especially for cluster 2 which had the most diversity.
Conclusion
This study was able to show the genetic diversity and population structure of H. compressa using the GBS approach. Hyphaene compressa in Kenyan ASALs is delineated into two gene pools. Cluster 1 comprising accessions in the north of Kenya while cluster 2 comprising accessions found along the River Tana basin. Further, accessions from the Tana basin are more diverse than those found in the northern part of Kenya. In addition, the results indicate that H. compressa accessions are interconnected with high gene flow and moderate genetic differentiation, evidenced by high within-population variation than among population variation. The high within population diversity can be harnessed for future breeding and improvement programs for various adaptive traits in H. compressa.
Data Availability Statement
The sequence data generated from this study are archived in the NCBI SRA under BioProject accession number PRJNA756042 (https://www.ncbi.nlm.nih.gov/bioproject/PRJNA756042/)
Author Contributions
CM, JN, NB, and LW conceived the study, CM, JN, NB, SO, and AO designed the analysis, AO, CM, JN, and NB collected the data, CM, AO, SO, NB, and JN analyzed the data, AO drafted the manuscript with significant contributions from all the authors. All authors contributed to data interpretation and approval of the paper.
Funding
This work was supported by a grant from The National Research Fund (NRF) Kenya, Grant Number NRF\1\MMC\285.
Conflict of Interest
The authors declare that the research was conducted in the absence of any commercial or financial relationships that could be construed as a potential conflict of interest.
Publisher’s Note
All claims expressed in this article are solely those of the authors and do not necessarily represent those of their affiliated organizations, or those of the publisher, the editors and the reviewers. Any product that may be evaluated in this article, or claim that may be made by its manufacturer, is not guaranteed or endorsed by the publisher.
Acknowledgments
Special gratitude goes to Kenya Forestry Service, National Museums of Kenya, Nuts and Oil Crops Directorate and Anglican Development Services in Lodwar Kenya for their guidance during sampling.
Supplementary Material
The Supplementary Material for this article can be found online at: https://www.frontiersin.org/articles/10.3389/fgene.2022.762202/full#supplementary-material
Supplementary Figure S1 Single Nucleotide Polymorphism (SNP) qualities after filtering the VCF file obtained from de_novo-based assembly of GBS data showing the depth per individual. (A), observed heterozygosity (B), Mean depth (C) and frequency of missing data per individual (D) for Hyphaene compressa accessions from Kenya.
Supplementary Figure S2 Single Nucleotide Polymorphism (SNP) qualities after filtering the VCF file obtained from reference-based assembly of GBS data showing the depth per individual. (A), observed heterozygosity (B), Mean depth (C) and frequency of missing data per individual (D) for Hyphaene compressa accessions from Kenya.
Supplementary Figure S3 Optimal Delta k values for different k values inferred during STRUCTURE analysis of Kenyan Hyphaene compressa showing the optimal delta k at k = 2 for the reference-based assembly (A) and the de_novo based assembly (B).
Supplementary Figure S4 STRUCTURE bar plot of admixture model population assignment of 96 Hyphaene compressa accessions from Kenya showing three clusters based on 2096 Single Nucleotide Polymorphisms (SNPs) for the de-novo assembly (A) and 23416 SNPs based on reference assembly (B). A combination of different colors represents admixed populations. In these structure plots, Tharaka and Tana River accessions have been placed in one cluster.
Supplementary Figure S5 Unrooted UPGMA distance tree inferred using 23416 SNPs based on the reference based assembly of H. compressa accessions.
Supplementary Figure S6 Migration rates between Tharaka, Tana River and Kwale using MIGRATE-n software. The direction of the arrow indicate the direction of gene flow.
References
Amwatta, C. J. M. (2004). Diversity of Use of Doum (Hyphaene Compressa) in Kenya. Palms 48 (4), 184–190.
Andersen, J. R., and Lübberstedt, T. (2003). Functional Markers in Plants. Trends Plant Sci. 8 (11), 554–560. doi:10.1016/j.tplants.2003.09.010
Barrow, E., and Mogaka, H. (2007). Kenya’s Drylands - Wastelands or an Undervalued National Economic Resource. Available at: https://www.iucn.org/sites/dev/files/import/downloads/kenya_dryland_value_2007.pdf (Accessed June 24, 2021).
Bohling, J. (2020). Evaluating the effect of reference genome divergence on the analysis of empirical RADseq datasets. Ecol. Evol. 10, 7585–7601. doi:10.1002/ece3.6483
Brandies, P., Peel, E., Hogg, C. J., and Belov, K. (2019). The Value of Reference Genomes in the Conservation of Threatened Species. Genes (Basel) 10, 846. doi:10.3390/genes10110846
Brunet, J., Larson-Rabin, Z., and Stewart, C. M. (2012). The Distribution of Genetic Diversity within and Among Populations of the Rocky Mountain Columbine: The Impact of Gene Flow, Pollinators, and Mating System. Int. J. Plant Sci. 173 (5), 484–494. doi:10.1086/665263
Burghardt, L. T., Young, N. D., and Tiffin, P. (2017). A Guide to Genome-wide Association Mapping in Plants. Curr. Protoc. Plant Biol. 2, 22–38. doi:10.1002/cppb.20041
Charlesworth, D. (2006). Evolution of Plant Breeding Systems. Curr. Biol. 16 (17), R726–R735. doi:10.1016/j.cub.2006.07.068
Cosiaux, A., Gardiner, L., and Couvreur, T. L. (2017). Hyphaene Compressa, the IUCN Red List of Threatened Species. IUCN Red List. Available at: https://doi.org/10.2305/IUCN.UK.2017-3.RLTS.T95317478A95317481.en (Accessed September 2, 2017).
Cosiaux, A., Gardiner, L. M., Stauffer, F. W., Bachman, S. P., Sonké, B., Baker, W. J., et al. (2018). Low Extinction Risk for an Important Plant Resource: Conservation Assessments of continental African Palms (Arecaceae/Palmae). Biol. Conservation 221, 323–333. doi:10.1016/j.biocon.2018.02.025
D’Agostino, N., Taranto, F., Camposeo, S., Mangini, G., Fanelli, V., Gadaleta, S., et al. (2018). GBS-derived SNP catalogue unveiled wide genetic variability and geographical relationships of Italian olive cultivars. Sci. Rep. 10, 1–13. doi:10.1038/s41598-018-34207-y
Danecek, P., Auton, A., Abecasis, G., Albers, C. A., Banks, E., DePristo, M. A., et al. (2011). The Variant Call Format and VCFtools. Bioinformatics 27 (15), 2156–2158. doi:10.1093/bioinformatics/btr330
Davey, J. W., Hohenlohe, P. A., Etter, P. D., Boone, J. Q., Catchen, J. M., and Blaxter, M. L. (2011). Genome-wide Genetic Marker Discovery and Genotyping Using Next-Generation Sequencing. Nat. Rev. Genet. 12 (7), 499–510. doi:10.1038/nrg3012
Earl, D. A., and VonHoldt, B. M. (2012). STRUCTURE HARVESTER: A Website and Program for Visualizing STRUCTURE Output and Implementing the Evanno Method. Conservation Genet. Resour. 4, 359–361. doi:10.1007/s12686-011-9548-7
Eaton, D. A. R., and Overcast, I. (2020). Ipyrad: Interactive Assembly and Analysis of RADseq Datasets. Bioinformatics 36 (8), 2592–2594. doi:10.1093/bioinformatics/btz966
Edwards, D., Forster, J. W., Chagné, D., and Batley, J. (2007). “What Are SNPs,” in Association Mapping in Plants. Editors N. Oraguzie, E. Rikkerink, S. Gardiner, and H. de Silva (New York: Springer), 41–52. doi:10.1007/978-0-387-36011-9_3
Elshire, R. J., Glaubitz, J. C., Sun, Q., Poland, J. A., Kawamoto, K., Buckler, E. S., et al. (2011). A Robust, Simple Genotyping-By-Sequencing (GBS) Approach for High Diversity Species. Plos One 6 (5), e19379. doi:10.1371/journal.pone.0019379
Evanno, G., Regnaut, S., and Goudet, J. (2005). Detecting the Number of Clusters of Individuals Using the Software STRUCTURE: A Simulation Study. Mol. Ecol. 14 (8), 2611–2620. doi:10.1111/j.1365-294X.2005.02553.x
Excoffier, L., and Lischer, H. E. L. (2010). Arlequin Suite Ver 3.5: A New Series of Programs to Perform Population Genetics Analyses under Linux and Windows. Mol. Ecol. Resour. 10, 564–567. doi:10.1111/j.1755-0998.2010.02847.x
Francis, R. M. (2017). Pophelper: an R Package and Web App to Analyse and Visualize Population Structure. Mol. Ecol. Resour. 17 (1), 27–32. doi:10.1111/1755-0998.12509
Galla, S. J., Forsdick, N. J., Brown, L., Hoeppner, M., Knapp, M., Maloney, R. F., et al. (2019). Reference Genomes from Distantly Related Species Can Be Used for Discovery of Single Nucleotide Polymorphisms to Inform Conservation Management. Genes 10 (9), 9. doi:10.3390/genes10010009
Ganie, S. H., Upadhyay, P., Das, S., and Prasad Sharma, M. (2015). Authentication of Medicinal Plants by DNA Markers. Plant Gene 4, 83–99. doi:10.1016/j.plgene.2015.10.002
Hazzouri, K. M., Gros-Balthazard, M., Flowers, J. M., Copetti, D., Lemansour, A., Lebrun, M., et al. (2019). Genome-wide Association Mapping of Date palm Fruit Traits. Nat. Commun. 10, 1–14. doi:10.1038/s41467-019-12604-9
He, J., Zhao, X., Laroche, A., Lu, Z.-X., Liu, H., and Li, Z. (2014). Genotyping-by-sequencing (GBS), an Ultimate Marker-Assisted Selection (MAS) Tool to Accelerate Plant Breeding. Front. Plant Sci. 5 (484), 1–8. doi:10.3389/fpls.2014.00484
Huson, D. H., and Bryant, D. (2006). Application of Phylogenetic Networks in Evolutionary Studies. Mol. Biol. Evol. 23 (2), 254–267. doi:10.1093/molbev/msj030
Hyun, D. Y., Sebastin, R., Lee, K. J., Lee, G.-A., Shin, M.-J., Kim, S. H., et al. (2020). Genotyping-by-Sequencing Derived Single Nucleotide Polymorphisms Provide the First Well-Resolved Phylogeny for the Genus Triticum (Poaceae). Front. Plant Sci. 11 (688), 1–15. doi:10.3389/fpls.2020.00688
Johnson, D. L. (1993). Nomadism and Desertification in Africa and the Middle East. GeoJournal 31 (1), 51–66. doi:10.1007/bf00815903
Jombart, T. (2008). Adegenet: a R Package for the Multivariate Analysis of Genetic Markers. Bioinformatics 24 (11), 1403–1405. doi:10.1093/bioinformatics/btn129
Kahn, F., and Luxereau, A. (2008). Doum palm Habit and Leaf Collecting Practices in Niger. Palms 52 (1), 23–29.
Khan, S., Al-qurainy, F., and Nadeem, M. (2012). Biotechnological Approaches for Conservation and Improvement of Rare and Endangered Plants of Saudi Arabia. Saudi J. Biol. Sci. 19 (1), 1–11. doi:10.1016/j.sjbs.2011.11.001
Kigomo, N. (2001). “State of forest Genetic Resources in Kenya,” in Forest Genetic Resources Working Papers FGR/18E; Issue The sub-regional workshop FAO/IPGRI/ICRAF on the conservation, management, sustainable utilization and enhancement of forest genetic resources in Sahelian and North-Sudanian Africa, Ouagadougou, Burkina Faso, 22-24 September 1998. Available at: http://www.fao.org/3/ab396e/ab396e.pdf.
Kitheka, J. U., and Ongwenyi, G. S. (2002). “The Tana River Basin and the Opportunity for Research on the Land-Ocean Interaction in the Tana Delta,” in Aquadocs. Nairobi, Kenya: University of Nairobi. Available at: http://hdl.handle.net/1834/7842.
Klimova, A., Ortega-Rubio, A., Vendrami, D. L. J., and Hoffman, J. I. (2018). Genotyping by Sequencing Reveals Contrasting Patterns of Population Structure, Ecologically Mediated Divergence, and Long-Distance Dispersal in North American Palms. Ecol. Evol. 8 (11), 5873–5890. doi:10.1002/ece3.4125
Li, H., and Durbin, R. (2009). Fast and Accurate Short Read Alignment with Burrows-Wheeler Transform. Bioinformatics 25 (14), 1754–1760. doi:10.1093/bioinformatics/btp324
Luo, Z., Brock, J., Dyer, J. M., Kutchan, T., Schachtman, D., Augustin, M., et al. (2019). Genetic Diversity and Population Structure of a Camelina Sativa spring Panel. Front. Plant Sci. 10 (February), 1–12. doi:10.3389/fpls.2019.00184
Maundu, P., and Tengnas, B. (2005). “Useful Trees and Shrubs for Kenya,” in Technical Handbook Number 35 (Nairobi, Kenya: World Agroforestry Centre- Eastern and Central Africa Regional Programme).
Mokhtar, M. M., Adawy, S. S., El-assal, S. E.-D. S., and Hussein, E. H. A. (2016). Genic and Intergenic SSR Database Generation, SNPs Determination and Pathway Annotations, in Date Palm (Phoenix Dactylifera L.). Plos One 11 (7), e0159268. doi:10.1371/journal.pone.0159268
Muyle, A., Martin, H., Zemp, N., Mollion, M., Gallina, S., Tavares, R., et al. (2020). Dioecy Is Associated with High Genetic Diversity and Adaptation Rates in the Plant Genus Silene. Mol. Biol. Evol. 38 (3), 805–818. doi:10.1093/molbev/msaa229
Nassiry, M. R., Javanmard, A., and Tohidi, R. (2009). Application of Statistical Procedures for Analysis of Genetic Diversity in Domestic Animal Populations. Am. J. Anim. Vet. Sci. 4 (4), 136–141. doi:10.3844/ajavsp.2009.136.141
Nkhoma, N., Shimelis, H., Laing, M. D., Shayanowako, A., and Mathew, I. (2020). Assessing the Genetic Diversity of Cowpea [Vigna Unguiculata (L.) Walp.] Germplasm Collections Using Phenotypic Traits and SNP Markers. BMC Genet. 21 (110), 1–16. doi:10.1186/s12863-020-00914-7
Omire, A., Budambula, N. L. M., Neondo, J., Gituru, R., and Mweu, C. (2020a). Phenotypic Diversity of Doum Palm (Hyphaene Compressa), a Semi‐Domesticated Palm in the Arid and Semi‐Arid Regions of Kenya. Scientifica 2020, 1–13. doi:10.1155/2020/4920830
Omire, A., Neondo, J., Budambula, N. L., Gituru, R., and Mweu, C. (2020b). Hyphaene Compressa, an Important palm in the Arid and Semi-arid Regions of Kenya. Eth Res. Appl. 20, 1–15. doi:10.32859/era.20.4.1-15
Ortiz, E. M. (2019). vcf2phylipV. 2.0: Convert a VCF Matrix into Several Matrix Formats for Phylogenetic Analysis. doi:10.5281/zenodo.2540861
Paschoa, R. P. d., Christ, J. A., Valente, C. S., Ferreira, M. F. d. S., Miranda, F. D. d., Garbin, M. L., et al. (2018). Genetic Diversity of Populations of the Dioecious Myrsine Coriacea (Primulaceae) in the atlantic forest. Acta Bot. Bras. 32, 376–385. doi:10.1590/0102-33062017abb0355
Pootakham, W., Jomchai, N., Ruang-areerate, P., Shearman, J. R., Sonthirod, C., Sangsrakru, D., et al. (2015). Genome-wide SNP Discovery and Identification of QTL Associated with Agronomic Traits in Oil palm Using Genotyping-By-Sequencing (GBS). Genomics 105 (5–6), 288–295. doi:10.1016/j.ygeno.2015.02.002
Pritchard, J. K., Stephens, M., and Donnelly, P. (2000). Inference of Population Structure Using Multilocus Genotype Data. Genetics 155 (2), 945–959. doi:10.1007/s10681-008-9788-010.1093/genetics/155.2.945
Shafer, A. B. A., Peart, C. R., Tusso, S., Maayan, I., Brelsford, A., Wheat, C. W., et al. (2017). Bioinformatic Processing of RAD‐seq Data Dramatically Impacts Downstream Population Genetic Inference. Methods Ecol. Evol. 8, 907–917. doi:10.1111/2041-210X.12700
Stauffer, F., Ouattara, D., and Stork, A. (2014). Monocotyledons 2 (Anthericaceae - Palmae). Tropical African Flowering Plants: ecology and distribution 8 (1), 326–354.
Stetter, M. G., and Schmid, K. J. (2017). Analysis of phylogenetic relationships and genome size evolution of the Amaranthus genus using GBS indicates the ancestors of an ancient crop. Methods Phylogenet. Evol. 109, 80–92. doi:10.1016/j.ympev.2016.12.029
Taranto, F., D’Agostino, N., Greco, B., Cardi, T., and Tripodi, P. (2016). Genome-wide SNP Discovery and Population Structure Analysis in Pepper (Capsicum Annuum) Using Genotyping by Sequencing. BMC Genomics 17 (1), 1–13. doi:10.1186/s12864-016-3297-7
Traveset, A., and Rodríguez-Pérez, J. (2019). “Seed Dispersal,” in Encyclopedia of Ecology. Editor B. Fath. 2nd ed. (New York: Elsevier), 592–599. Issue October 2017. doi:10.1016/B978-0-12-409548-9.10950-9
Uhl, N. W., and Moore, H. (2019). palm. Encyclopedia Britanica. Available at: https://www.britannica.com/plant/palm-tree (Accessed July 27, 2021).
Wallace, J. G., and Mitchell, S. E. (2017). Genotyping‐by‐Sequencing. Curr. Protoc. Plant Biol. 2 (March), 64–77. doi:10.1002/cppb.20042
Wickham, H., Averick, M., Bryan, J., Chang, W., McGowan, L., François, R., et al. (2019). Welcome to the Tidyverse. Joss 4 (43), 1686. doi:10.21105/joss.01686
Xiong, H., Shi, A., Mou, B., Qin, J., Motes, D., Lu, W., et al. (2016). Genetic Diversity and Population Structure of Cowpea (Vigna Unguiculata L. Walp). PLoS ONE 11 (8), e0160941. doi:10.1371/journal.pone.0160941
Keywords: genetic diversity, GBS, single nucleotide polymorphisms, population structure, Hyphaene compressa, doum palm
Citation: Omire A, Neondo J, Budambula NLM, Wangai L, Ogada S and Mweu C (2022) Genetic Diversity and Population Structure of Doum Palm (Hyphaene compressa) Using Genotyping by Sequencing. Front. Genet. 13:762202. doi: 10.3389/fgene.2022.762202
Received: 21 August 2021; Accepted: 03 January 2022;
Published: 04 February 2022.
Edited by:
Rana Dajani, Hashemite University, JordanReviewed by:
Lizandra Jaqueline Robe, Federal University of Santa Maria, BrazilMukesh Choudhary, ICAR-Indian Institute of Maize Research, India
Amol N. Nankar, Center of Plant Systems Biology and Biotechnology, Bulgaria
Aleksandra Dimitrijevic, Institute of Field and Vegetable Crops, Serbia
Copyright © 2022 Omire, Neondo, Budambula, Wangai, Ogada and Mweu. This is an open-access article distributed under the terms of the Creative Commons Attribution License (CC BY). The use, distribution or reproduction in other forums is permitted, provided the original author(s) and the copyright owner(s) are credited and that the original publication in this journal is cited, in accordance with accepted academic practice. No use, distribution or reproduction is permitted which does not comply with these terms.
*Correspondence: Cecilia Mweu, Y213ZXVAamt1YXQuYWMua2U=