 Ling Yu1
 Hongling Zhang2Tongzhang Zheng3Juan Liu1Xingjie Fang1Shuting Cao1
 Wei Xia1Shunqing Xu1
 Yuanyuan Li1*
- 1Key Laboratory of Environment and Health, Ministry of Education and Ministry of Environmental Protection, State Key Laboratory of Environmental Health, School of Public Health, Tongji Medical College, Huazhong University of Science and Technology, Wuhan, China
- 2School of Health and Nursing, Wuchang University of Technology, Wuhan, China
- 3Department of Epidemiology, Brown University, Providence, RI, United States
Background: The PPARα gene may be crucial to the neurotoxic effect of phthalates. However, epidemiological studies considering the neurodevelopmental influence of phthalates interacting with genetic susceptibility are limited. We hypothesized phthalates could interact with the PPARα gene, synergistically affecting neurocognitive development.
Methods: A total of 961 mother-infant pairs were involved in this study. The concentrations of phthalate metabolites in maternal urine during pregnancy were detected. Children’s neurocognitive development was estimated with the Bailey Infant Development Inventory (BSID). Genetic variations in PPARα were genotyped with the Illumina Asian Screening Array. We applied generalized linear regression models to estimate genotypes and phthalate metabolites’ association with children’s neurocognitive development.
Results: After adjusting for potential confounders, the mono-n-butyl phthalate (MnBP) concentration was negatively associated with Psychomotor Development Index (PDI) (β = −0.86, 95% CI: −1.67, −0.04). The associations between MnBP and neurocognitive development might be modified by PPARα rs1800246. Compared with low-MnBP individuals carrying rs1800246 GG genotypes, high-MnBP individuals with the AG + AA genotype had a higher risk of neurocognitive developmental delay, with the odds ratio of 2.76 (95% CI:1.14, 6.24).
Conclusions: Our current study revealed that prenatal exposure to MnBP was negatively correlated with children’s neurocognitive development, and PPARα rs1800246 might modify the association.
Introduction
As a group of synthetic chemical plasticizers, phthalates are extensively used in many industrial products, such as toys, stationery, packaging materials, and even cosmetics (Lyche et al., 2009). Phthalates can be slowly released from different industrial materials and accumulated in different environments, including the atmosphere, water, sediments, and soil. Therefore, the pathways of human exposure to phthalates are diverse, including gastrointestinal ingestion, respiratory inhalation, and dermal absorption (Heudorf et al., 2007).
Exposure to phthalates is a considerable threat to health worldwide (Heudorf et al., 2007; Lyche et al., 2009; Zhang et al., 2009; Ejaredar et al., 2015; Olesen et al., 2018). Developing fetuses are likely susceptible to environmental exposure owing to the rapid speed of fetal organ formation and development (Wilcox, 2010). Prenatal exposure to phthalates is neurotoxic to offspring, which has been indicated by increasing animal experiments (Miodovnik et al., 2014; Barakat et al., 2018; Hatcher et al., 2019). Recently, increasing epidemiological research explored the correlation between phthalate exposure during pregnancy and neurocognitive development in infants. However, the findings were inconsistent (Braun et al., 2014; Ejaredar et al., 2015; Bornehag et al., 2018; Engel et al., 2018; Olesen et al., 2018). Although the specific molecular mechanism of prenatal phthalate exposure affecting neurocognitive development is poorly understood, gene-environment interactions in the complex process of brain development may partly explain the inconsistency (Lai et al., 2014). It is widely acknowledged that neurodevelopment is influenced by complex interactions between genes and the environment (Lauby et al., 2021). Plastic product chemicals (PPC) were found to induce epigenetic change, which may lead to adverse offspring neurodevelopment (Ponsonby et al., 2016). Perinatal BPA exposure impaired memory in mice by inhibiting the NMDAR subunits expression (Xu et al., 2010; Xu et al., 2011). Nevertheless, studies considering genetic factors when exploring the association between phthalate exposure and neurocognitive development are limited.
Peroxisome proliferator-activated receptor α (PPARα) is a group of nuclear receptors, which plays a crucial part in adjusting fatty acid distribution and metabolism (Han et al., 2017). Prior studies have shown that phthalates can interfere with the PPARα (Hurst and Waxman, 2003; Lampen et al., 2003), which was considered part of phthalates’ neurotoxic mechanism (Miodovnik et al., 2014). PPARα has been proven to be activated in vitro by several phthalate diesters and monoesters (Hurst and Waxman, 2003). Besides, PPARα has also been suggested to be involved in phthalates’ developmental and reproductive toxicity (Peters et al., 1997; Ward et al., 1998; Hayashi et al., 2011; Wang et al., 2017). Therefore, we hypothesized that variants in the PPARα gene interact with phthalate exposure to influence neurocognitive development.
In the present study, we focused on evaluating the correlations between prenatal phthalate exposure and children’s neurocognitive development and exploring whether the phthalate exposure and the PPARα genetic polymorphism have interaction effects on the relationship therein based on a birth cohort study.
Material and Methods
Study Participants
Participants in this study were drawn from a prospective cohort study in Wuhan, China. The criteria for enrollment of pregnant women were as follows: 1) carrying singleton; 2) Wuhan residents; 3) Gestational weeks less than 16; 4) willing to give birth in the research hospital. The research protocol was approved by the ethics committees of the Tongji Medical College, Huazhong University of Science and Technology, and the Wuhan Maternal and Child Healthcare Hospital. Between October 2013 and March 2015, a total of 1,656 women donated urine samples during the first trimesters (13.0 ± 1.2 weeks) and completed the determination of urine phthalate metabolites. Then, 1,105 children accomplished the Bayley Scales of Infant Development (BSID) tests. Finally, 114 children were excluded because of the lack of results of genotyping measurement, leaving 961 mother-infant pairs for the study.
Data Collection
Basic demographic characteristics (e.g., maternal age, education, and household income) and lifestyle factors (e.g., folic acid supplement and passive smoking during pregnancy) were obtained through face-to-face interviews using standardized and structured questionnaires. The pre-pregnancy body mass index (BMI) was calculated according to pre-pregnancy weight and height obtained from the hospital records. The information about mothers’ pregnancy history and the data of newborns (including gestational weight gain, gestational age, birth weight, and gender) were abstracted from the medical records. The gestational weight gain (GWG) (kg) was obtained by subtracting pre-pregnancy body weight (kg) from the weight (kg) at delivery. According to the Institute of Medicine and National Research Council (IOM) of the United States, the recommended total GWGs for underweight (<18.5 kg/m2), normal-weight (18.5–24.9 kg/m2), overweight (25.0–29.9 kg/m2), and obese (≥30.0 kg/m2) women are 12.5–18, 11.5–16, 7–11.5, and 5–9 kg, respectively (Medicine IO, 2009). The GWGs below this recommended range are identified as inadequate total GWG, within this recommended range are identified as adequate total GWG, and beyond this recommended range are identified as excessive total GWG.
Measurement of Neurocognitive Development
The neurocognitive development of children was tested by three certified pediatricians using the Bayley Scales of Infant Development of China Revision (BSID-CR) in the study hospital. All study testers were unaware of the exposure information. The processes of tests were preserved via video recording. Quality control was performed through reviewing video evaluations. Two neurocognitive development indices were generated, the mental development index (MDI) and the psychomotor development index (PDI). After normalization, the mean is 100, and the standard deviation is 15. The neurocognitive developmental delay was defined as one SD or more below the mean of the scores (MDI< 85 or PDI <85) of the children in this study.
Detection of Phthalate Metabolites
During the first trimester of pregnancy, spot urine samples were collected in 5 ml polypropylene tubes and saved at −20°C until detection. The analysis methods and instruments for phthalate metabolite measurements were described previously (Li et al., 2019). Briefly, the urine sample was hydrolyzed overnight at 37°C after adding ß-glucuronidase. Liquid-liquid extraction was applied three times. Then following instrumental analysis was conducted on an Ultimate 3000 UHPLC system (Dionex, Sunnyvale, CA, United States). Eight phthalate metabolites were measured including monoethyl phthalate (MEP), mono-(2-ethyl-5-carboxypentyl) phthalate (MECPP), mono-(2-ethyl-5-hydroxyhexyl) phthalate (MEHHP), mono-(2-ethyl-5-oxohexyl) phthalate (MEOHP), mono-isobutyl phthalate (MiBP), mono-n-butyl phthalate (MnBP), mono-benzyl phthalate (MBzP), and mono-(2-ethylhexyl) phthalate (MEHP). ∑DEHP was calculated as the sum of molar concentrations of DEHP metabolites (MEHP, MEHHP, MEOHP, and MECPP). ∑DBP was calculated as the sum of molar concentrations of DBP metabolites (MnBP and MiBP). The sum of the molar concentrations of MEP, MnBP, and MiBP is numerically equal to ∑LMW. Besides, the sum of the molar concentrations of MBzP, MEHP, MEHHP, MEOHP, and MECPP is numerically equal to ∑HMW.
For further analysis, we replaced values lower than the limit of detection (LOD) with values equal to half LOD. The urinary dilution was corrected as the following formula: Pc = P [(SGm − 1)/(SG − 1)], where Pc means the SG-adjusted concentration (ng/ml), P means the measured concentration (ng/ml), SG is the specific gravity of sample and SGm means the median SG level.
DNA Extraction, Genotyping, and Single Nucleotide Polymorphism (SNP) Selection
Umbilical cord blood was collected immediately after delivery and transferred to vacuum blood vessels coated with EDTA. The blood samples were then centrifuged and instantly saved at −80°C until analysis. According to the standard scheme, total DNA was extracted from umbilical cord leukocytes using Wizard® Genomic DNA Purification (Promega Corporation, Madison, WI, United States). According to the manufacturer’s protocol, DNA samples were genotyped using the Illumina Infinium Asian Screening Array v1.0 BeadChip (Illumina Inc., San Diego, CA, United States). The single nucleotide polymorphisms (SNPs) in PPARα (chr22:46546429-46639652, GRCh37/hg19 by Entrez Gene) were filtered out according to the criteria as follows: 1) genotype call rate <95%; 2) Hardy-Weinberg equilibrium (HWE)-P < 1 × 10⁻⁶; 3) minor allele count < 1Hardy-Weinberg equilibrium (HWE)-P < 1 × 10⁻⁶. Then imputation was performed on Michigan Imputation Server (Das et al., 2016). The reference panel was the 1,000 Genomes Project phase 3. After imputation, SNP that did not meet the following requirements was excluded: 1) minor allele frequency (MAF) > 0.05; 2) imputation quality score R2 > 0.3. Finally, 61 SNPs in the PPARα gene were viable for further analysis.
Statistical Analysis
The SG-adjusted phthalate metabolite levels were ln-transformed due to the skewed distribution. Descriptive statistics were conducted to describe the distributions of phthalate metabolite concentrations, neurocognitive measures, and participant characteristics. Spearman correlation coefficients were applied to summarize pairwise correlations among phthalate metabolites.
The general linear model was used to evaluate the relationships of phthalate metabolites’ concentrations with MDI or PDI. According to the previous literature (Bai et al., 2020), the coefficient β means that each 1% change in urinary concentrations of phthalate metabolite leads to a β% difference in PDI or MDI. We modeled phthalate metabolites data as quartiles (Q1-Q4) to explore the potential non-linear association. The lowest quartile (Q1) was used as the reference to estimated percent differences between quartiles. Linear trends across quartiles were calculated by modeling the median values as continuous variables. A ″2-step” approach was applied in the following gene-environment interaction analyses (Gauderman et al., 2017). Step 1: the dominant, recessive, and additive models were used to explore the associations between SNPs and neurocognitive development in the general linear models with potential confounders adjusted. Step 2: the SNPs significantly related to PDI or MDI were selected to analyze their interaction with phthalate metabolites on neurocognitive developmental delay. In order to generate hypotheses for future research, p-values in both steps were relaxed to 0.05. Adjustment factors were selected if they altered the main effect estimates by more than 10% or related to phthalates and children’s neurocognitive ability in the previous literature (Wehby and Murray, 2008; Téllez-Rojo et al., 2013; Botton et al., 2016). A directed acyclic graph depicts the selection of potential confounders (Supplementary Figure S1). The final models included maternal age (<25, 25-34, ≥34 years) and education (< high school degree or ≥ high school degree), gestational weight gain (inadequate, adequate, and excessive), passive smoking, and folic acid supplement during pregnancy (yes or no), parity (primiparous or multiparous), gestational age (<37 or ≥37 weeks), child gender (boys or girls), and birth weight (≤2,500, 2,500-3,999, ≥4,000 g).
All statistical analyses were performed using R, version 4.1.0. The statistical significance level was 0.05 for a two-tailed test.
Results
The General Characteristics of Participants
As shown in Table 1, the mean maternal age (±SD) was 29.03 ± 3.33 years. Most of the participating women were primiparous (87.30%), and approximately 66.29% of them had a pre-pregnancy BMI in the range of 18.5–23.9 kg/m2. The majority of the women (80.75%) had an educational background as high school or above, reported no exposure to passive smoking (66.49%), and took folic acid supplements (81.48%). The mean gestational age (±SD) was 39.34 ± 1.25 weeks. Among the children, boys accounted for 52.44%. Most children had a birth weight in the range of 2500–3999 g (93.1%). The mean MDI and PDI (±SD) for two-year-old children were 103.72 ± 22.91 and 103.77 ± 18.76, respectively.
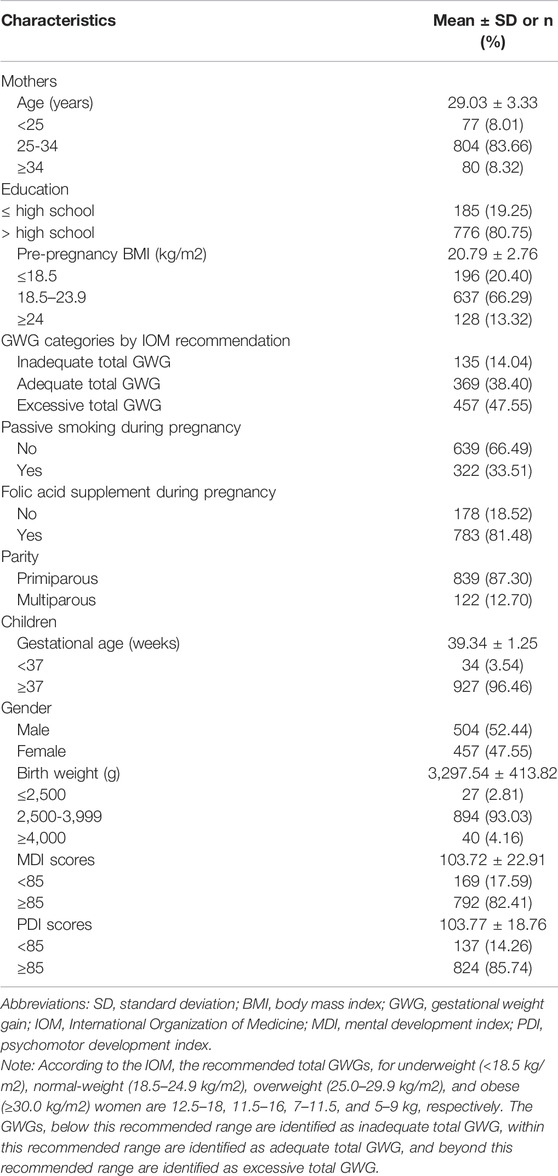
TABLE 1. General characteristics of the participants (n = 961).
Concentrations of Urinary Phthalate Metabolites
The distribution of urinary phthalate metabolite concentrations is shown in Table 2. All eight phthalate metabolites were detected in at least 84.9% of urine samples. MnBP had the highest concentration (geometric mean = 54.28 ng/ml), while the lowest concentration of phthalate metabolites was MBzP (geometric mean = 0.09 ng/ml). The concentration of ∑DEHP was equal to ∑HMW same as 0.09 nmol/ml, considerably lower than ∑DBP (0.36 nmol/ml) and ∑LMW (0.47 nmol/ml). Metabolite pairwise correlation coefficients varied from 0.19 to 1.00 (Supplementary Table S2).
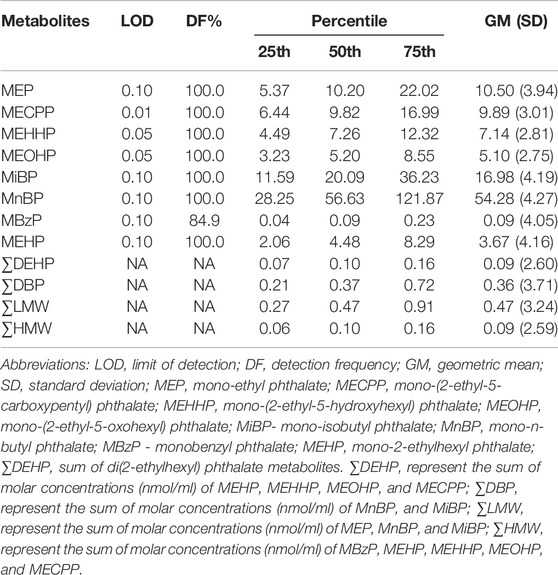
TABLE 2. Distributions of urinary phthalate metabolite concentrations (ng/ml).
Associations Between Urinary Phthalate Metabolites and Neurocognitive Development
After adjusting for potential confounders, MnBP was found to be negatively associated with PDI (Table 3). The regression coefficients in Table 3 indicated that PDI averagely decreased 0.86% (95% CI: −1.67, −0.04) with a 1% increase in urinary concentration of MnBP. We found no significant association between MDI and phthalate metabolites. Although on-linear associations were explored, we did not find significant non-linear associations (Supplementary Table S3). Thus, MnBP was selected to analyze their interaction with PPARα variants.
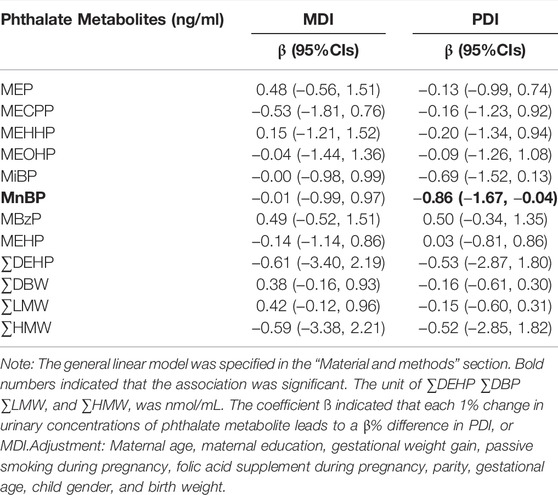
TABLE 3. Associations between phthalate metabolite concentrations and neurocognitive development.
Associations of PPARα Variants With Neurocognitive Development
In Table 4, it was shown that rs75525202-G and rs1800246-A were negatively associated with MDI in both additive and dominant manners (Padd = 0.027, 0.004, and Pdom = 0.032, 0.007). While, rs4823902-G, rs4253690-G and rs5766698-T were positively associated with MDI in both additive and dominant manners (Padd = 0.033, 0.042, 0.028, and Pdom = 0.010,0.022, 0.007). The rs12330015-G and rs115250492-T were positively related to MDI in dominant manner (rs12330015 GA + GG vs AA genotype, β = 3.291, Pdom = 0.040; rs115250492 TA + TT vs AA genotype, β = 3.453, Pdom = 0.041).
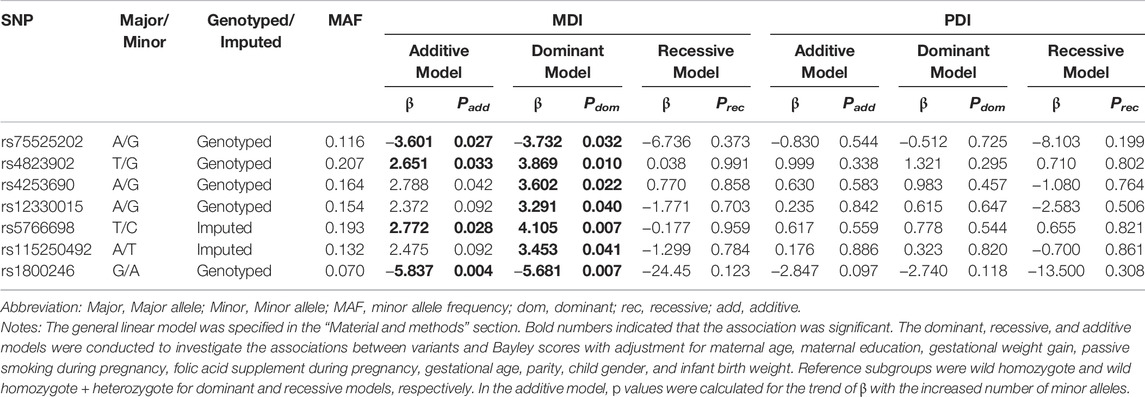
TABLE 4. Associations of the seven selected PPARα variants with neurocognitive development.
These seven SNPs were selected to further explore their interaction with MnBP exposure because they were the most likely to be related to neurocognitive development among the PPARα variants.
Effects of Interaction Between MnBP and SNPs in PPARα Gene
Table 5 presents the interaction between urinary MnBP concentration and seven candidate SNPs on neurocognitive developmental delay.
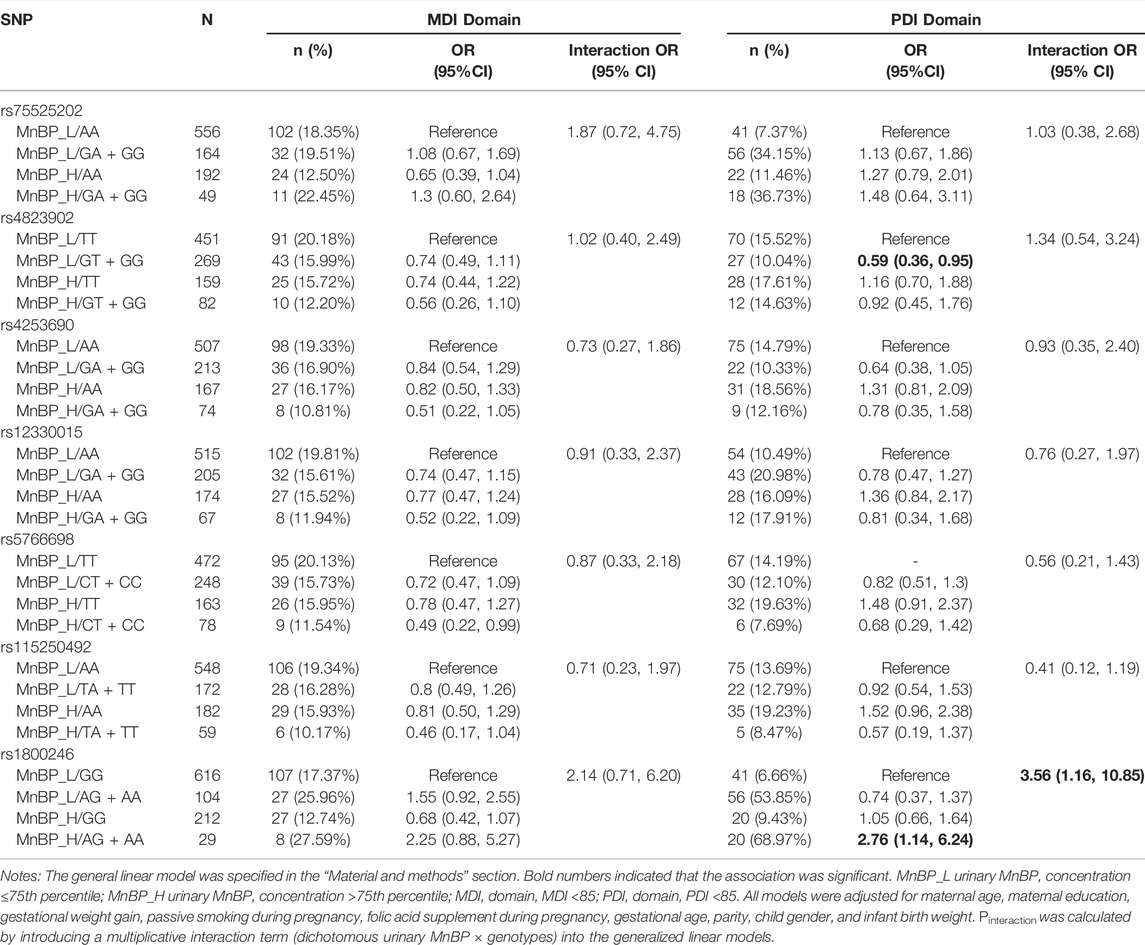
TABLE 5. Interaction between urinary MnBP and seven selected PPARα variants on neurocognitive developmental delay.
For the PDI domain, compared to subjects with low urinary MnBP (≤121.873 ng/ml) and carrying rs1800246 GG genotype, the subjects with high urinary MnBP (>121.873 ng/ml) and carrying rs1800246AG + AA genotype had a 2.76-fold risk for neurocognitive developmental delay (95% CI: 1.14,6.24). Modification effects on the relationship between urinary MnBP and neurocognitive developmental delay were found in rs1800246. Compared to subjects with low urinary MnBP and carrying rs4823902 TT genotype, the subjects with high urinary MnBP and rs4823902 GT + GG genotype had a 0.59-fold risk for neurocognitive developmental delay (95% CI: 0.36,0.95). However, rs4823902 was not found to modify the association between urinary MnBP and PDI. As for the MDI domain, no potential interaction between MnBP and selected SNPs in the PPARα gene was found.
Discussion
In this study, we investigated the associations of prenatal phthalate exposure with neurocognitive development in 2-year-old children. We found that MnBP in maternal urinary were negatively related to PDI, and genetic variations in the PPARα gene might have interaction effects with high MnBP on the neurocognitive developmental delay in children.
We tested urinary phthalate levels and found that phthalate metabolites were detectable in all study participants, suggesting that humans are extensively exposed to phthalates. Prior studies have also indicated that phthalates are ubiquitous in the environment because they are widely used in industrial products (Heudorf et al., 2007; Wittassek and Angerer, 2008; Miodovnik et al., 2014). Given the extensive adverse effects of phthalate on health, molecular studies are desperately needed to provide mechanistic insight into the health effects of phthalate.
A negative association was also found between prenatal urinary MnBP concentration and PDI, consistent with the previous studies (Kim et al., 2011; Polanska et al., 2014; Qian et al., 2019). A study conducted in New York City revealed the inverse association between MnBP concentrations in maternal urine samples during pregnancy and psychomotor development in 296 children (Whyatt et al., 2012). Another study also observed that concentrations (μg/g creatinine) of 3OH-MnBP were inversely associated with motor development in 150 children (Polanska et al., 2014). In animal experiments, DBP, the precursor of MnBP, has been shown to impair neurocognitive development in mice. Li et al. (2009) reported that high maternal exposure to DBP lead to delayed surface righting and shortened forepaw grip time in rat pups. Additionally, Lee et al. (2020) reported that perinatal DBP exposure significantly reduced the motor and memory abilities of puppies after delivery. Nevertheless, the specific mechanisms linking prenatal phthalate exposures to neurocognitive development remain unclear. A recent study reported that DBP might induce neurotoxicity in human neurons by disrupting the expression of estrogen receptors (Xu et al., 2020). In addition, interference with thyroid homeostasis, calcium signaling, lipid metabolism, and peroxisome proliferator-activated receptor (PPAR) activation may also be part of the neurotoxic mechanism (Miodovnik et al., 2014).
Neurocognitive development is a complex process accompanied by long-term interactions between genetic and environmental factors. Although phthalates may have adverse effects on development through multiple different molecular targets, there is considerable evidence that the toxicity of phthalates is partly driven by the effect of PPARα. (Hurst and Waxman, 2003; Lampen et al., 2003; Bility et al., 2004; Corton and Lapinskas, 2005; Lapinskas et al., 2005; Kawano et al., 2014). PPARα is a critical receptor expressed in the human brain tissue and has extensive developmental effects (Abbott, 2009). Previous studies indicated that DBP was capable of activating PPARα in cells (Mandard et al., 2004; Corton and Lapinskas, 2005; Froment, 2008; Latini et al., 2008; Lau et al., 2010; Hayashi et al., 2011). Experiments on animals also demonstrated that hepatic PPARα was vital to the toxic effect of perinatal phthalate exposure in the offspring (Hayashi et al., 2011). In order to generate hypotheses for future research, p-values in both steps of the 2-step gene-by-environment approach were relaxed to 0.05 for a total alpha of 0.10. Although this 2-step approach did not yield any clear gene-by-environment interaction SNPs, seven PPARα variants were found to be associated with performance on the mental development index. Additionally, for one of these, rs1800246, there was evidence of potential interaction between urinary MnBP concentration on psychomotor index performance. The functional role of rs1800246 is not well documented in the literature. Nonetheless, the SNP functional annotations tool HaploReg v4.1 revealed that rs1800246, an intronic SNP, may affect the expression of the PPARα gene through cis-acting regulatory elements that positively control gene expressions, such as enhancers, silencers, insulators, and transcription factors. (Deng et al., 2017).
Although the mechanism is unclear, the study provides clues to the interaction between PPARα and phthalates in developing neurocognitive functions. Further research is required to investigate the potential interaction between environmental and genetic factors on children’s neurocognitive development.
Several advantages exist in the present research. Firstly, this study explored the association between phthalate exposure and PPARα gene polymorphisms with neurocognitive development based on a prospective cohort study. Since exposures were assessed before outcomes occurred, they were less biased. As far as we know, this is one of the few studies examining the interaction of urinary phthalate and genetic polymorphisms on neurocognitive development, which confirms the importance of environment-gene interactions on neurocognitive development and provides clues for the prevention of neurocognitive developmental delay. Nevertheless, some limitations in this study should be noticed. Firstly, the lack of correction for multiple testing and the cross-over of outcomes increased the chance of a false positive finding. Therefore, independently replicated cohort studies or in vitro experiments are required to verify the results and explore the potential mechanisms. Finally, although we had adjusted many confounders in this study, there may still be other potential or uncontrolled factors that affect the results.
Conclusion
Our present study provides evidence that prenatal phthalate exposure is related to worse neurocognitive development in children, which may be modified by PPARα polymorphisms. The results offered epidemiological evidence about the interaction between prenatal phthalate exposure and inherited factors on neurocognitive development in children and provided clues for preventing neurocognitive developmental delay in the early stage.
Data Availability Statement
The datasets generated and used during the current study are not publicly available due to the potential for individual and organizational privacy to be compromised. Requests to access the datasets should be directed to the corresponding author.
Ethics Statement
The studies involving human participants were reviewed and approved by The ethics committees of the Tongji Medical College, Huazhong University of Science and Technology, and the Wuhan Maternal and Child Healthcare Hospital. Written informed consent to participate in this study was provided by the participants’ legal guardian/next of kin.
Author Contributions
LY: investigation, data analysis, writing original draft and review; HZ and TZ: investigation, data analysis, and review; JL, XF, and SC: investigation, review, and editing; WX and SX: review and editing; YL: resources, review, and editing.
Funding
This work was supported by the National Natural Science Foundation of China (42077398), Program for HUST Academic Frontier Youth Team (2018QYTD12), and the National Institutes of Health R01ES029082.
Conflict of Interest
The authors declare that the research was conducted in the absence of any commercial or financial relationships that could be construed as a potential conflict of interest.
Publisher’s Note
All claims expressed in this article are solely those of the authors and do not necessarily represent those of their affiliated organizations, or those of the publisher, the editors and the reviewers. Any product that may be evaluated in this article, or claim that may be made by its manufacturer, is not guaranteed or endorsed by the publisher.
Supplementary Material
The Supplementary Material for this article can be found online at: https://www.frontiersin.org/articles/10.3389/fgene.2022.855544/full#supplementary-material
References
Abbott, B. D. (2009). Review of the Expression of Peroxisome Proliferator-Activated Receptors Alpha (PPARα), Beta (PPARβ), and Gamma (PPARγ) in Rodent and Human Development. Reprod. Toxicol. 27, 246–257. doi:10.1016/j.reprotox.2008.10.001
Bai, Y., Fu, W., Guan, X., Wu, X., Li, G., Wei, W., et al. (2020). Co-exposure to Multiple Metals, TERT-Clptm1l Variants, and Their Joint Influence on Leukocyte Telomere Length. Environ. Int. 140, 105762. doi:10.1016/j.envint.2020.105762
Barakat, R., Lin, P.-C., Park, C. J., Best-Popescu, C., Bakry, H. H., Abosalem, M. E., et al. (2018). Prenatal Exposure to DEHP Induces Neuronal Degeneration and Neurobehavioral Abnormalities in Adult Male Mice. Toxicol. Sci. 164, 439–452. doi:10.1093/toxsci/kfy103
Bility, M. T., Thompson, J. T., McKee, R. H., David, R. M., Butala, J. H., Vanden Heuvel, J. P., et al. (2004). Activation of Mouse and Human Peroxisome Proliferator-Activated Receptors (PPARs) by Phthalate Monoesters. Toxicol. Sci. 82, 170–182. doi:10.1093/toxsci/kfh253
Bornehag, C.-G., Lindh, C., Reichenberg, A., Wikström, S., Unenge Hallerback, M., Evans, S. F., et al. (2018). Association of Prenatal Phthalate Exposure with Language Development in Early Childhood. JAMA Pediatr. 172, 1169–1176. doi:10.1001/jamapediatrics.2018.3115
Botton, J., Philippat, C., Calafat, A. M., Carles, S., Charles, M.-A., Slama, R., et al. (2016). Phthalate Pregnancy Exposure and Male Offspring Growth from the Intra-uterine Period to Five Years of Age. Environ. Res. 151, 601–609. doi:10.1016/j.envres.2016.08.033
Braun, J. M., Kalkbrenner, A. E., Just, A. C., Yolton, K., Calafat, A. M., Sjödin, A., et al. (2014). Gestational Exposure to Endocrine-Disrupting Chemicals and Reciprocal Social, Repetitive, and Stereotypic Behaviors in 4- and 5-Year-Old Children: The HOME Study. Environ. Health Perspect. 122, 513–520. doi:10.1289/ehp.1307261
Corton, J. C., and Lapinskas, P. J. (2005). Peroxisome Proliferator-Activated Receptors: Mediators of Phthalate Ester-Induced Effects in the Male Reproductive Tract? Toxicol. Sci. 83, 4–17. doi:10.1093/toxsci/kfi011
Das, S., Forer, L., Schönherr, S., Sidore, C., Locke, A. E., Kwong, A., et al. (2016). Next-generation Genotype Imputation Service and Methods. Nat. Genet. 48, 1284–1287. doi:10.1038/ng.3656
Deng, N., Zhou, H., Fan, H., and Yuan, Y. (2017). Single Nucleotide Polymorphisms and Cancer Susceptibility. Oncotarget 8, 110635–110649. doi:10.18632/oncotarget.22372
Ejaredar, M., Nyanza, E. C., Ten Eycke, K., and Dewey, D. (2015). Phthalate Exposure and Childrens Neurodevelopment: a Systematic Review. Environ. Res. 142, 51–60. doi:10.1016/j.envres.2015.06.014
Engel, S. M., Villanger, G. D., Nethery, R. C., Thomsen, C., Sakhi, A. K., Drover, S. S. M., et al. (2018). Prenatal Phthalates, Maternal Thyroid Function, and Risk of Attention-Deficit Hyperactivity Disorder in the Norwegian Mother and Child Cohort. Environ. Health Perspect. 126, 057004. doi:10.1289/ehp2358
Froment, P. (2008). PPARs and RXRs in Male and Female Fertility and Reproduction. Nouzilly, France: Hindawi.
Gauderman, W. J., Mukherjee, B., Aschard, H., Hsu, L., Lewinger, J. P., Patel, C. J., et al. (2017). Update on the State of the Science for Analytical Methods for Gene-Environment Interactions. Am. J. Epidemiol. 186, 762–770. doi:10.1093/aje/kwx228
Han, L., Shen, W.-J., Bittner, S., Kraemer, F. B., and Azhar, S. (2017). PPARs: Regulators of Metabolism and as Therapeutic Targets in Cardiovascular Disease. Part II: PPAR-Β/δ and PPAR-γ. Future Cardiol. 13, 279–296. doi:10.2217/fca-2017-0019
Hatcher, K. M., Willing, J., Chiang, C., Rattan, S., Flaws, J. A., and Mahoney, M. M. (2019). Exposure to Di-(2-ethylhexyl) Phthalate Transgenerationally Alters Anxiety-like Behavior and Amygdala Gene Expression in Adult Male and Female Mice. Physiol. Behav. 207, 7–14. doi:10.1016/j.physbeh.2019.04.018
Hayashi, Y., Ito, Y., Yamagishi, N., Yanagiba, Y., Tamada, H., Wang, D., et al. (2011). Hepatic peroxisome proliferator-activated receptor α may have an important role in the toxic effects of di(2-ethylhexyl)phthalate on offspring of mice. Toxicology 289, 1–10. doi:10.1016/j.tox.2011.02.007
Heudorf, U., Mersch-Sundermann, V., and Angerer, J. (2007). Phthalates: Toxicology and Exposure. Int. J. Hyg. Environ. Health 210, 623–634. doi:10.1016/j.ijheh.2007.07.011
Hurst, C. H., and Waxman, D. J. (2003). Activation of PPAR and PPAR by Environmental Phthalate Monoesters. Toxicol. Sci. 74, 297–308. doi:10.1093/toxsci/kfg145
Kawano, M., Qin, X.-Y., Yoshida, M., Fukuda, T., Nansai, H., Hayashi, Y., et al. (2014). Peroxisome Proliferator-Activated Receptor α Mediates Di-(2-ethylhexyl) Phthalate Transgenerational Repression of Ovarian Esr1 Expression in Female Mice. Toxicol. Lett. 228, 235–240. doi:10.1016/j.toxlet.2014.04.019
Kim, Y., Ha, E. H., Kim, E. J., Park, H., Ha, M., Kim, J. H., et al. (2011). Prenatal Exposure to Phthalates and Infant Development at 6 Months: Prospective Mothers and Children's Environmental Health (MOCEH) Study. Environ. Health Perspect. 119, 1495–1500. doi:10.1289/ehp.1003178
Lai, M.-C., Lombardo, M. V., and Baron-Cohen, S. (2014). Autism. The Lancet 383, 896–910. doi:10.1016/s0140-6736(13)61539-1
Lampen, A., Zimnik, S., and Nau, H. (2003). Teratogenic Phthalate Esters and Metabolites Activate the Nuclear Receptors PPARs and Induce Differentiation of F9 Cells. Toxicol. Appl. Pharmacol. 188, 14–23. doi:10.1016/s0041-008x(03)00014-0
Lapinskas, P. J., Brown, S., Leesnitzer, L. M., Blanchard, S., Swanson, C., Cattley, R. C., et al. (2005). Role of PPARα in Mediating the Effects of Phthalates and Metabolites in the Liver. Toxicology 207, 149–163. doi:10.1016/j.tox.2004.09.008
Latini, G., Scoditti, E., Verrotti, A., De Felice, C., and Massaro, M. (2008). Peroxisome Proliferator-Activated Receptors as Mediators of Phthalate-Induced Effects in the Male and Female Reproductive Tract: Epidemiological and Experimental Evidence. PPAR Res. 2008, 359267. doi:10.1155/2008/359267
Lau, C., Abbott, B. D., Corton, J. C., and Cunningham, M. L. (2010). PPARs and Xenobiotic-Induced Adverse Effects: Relevance to Human Health. Durham, North Carolina, USA: Hindawi.
Lauby, S. C., Fleming, A. S., and McGowan, P. O. (2021). Beyond Maternal Care: The Effects of Extra-maternal Influences within the Maternal Environment on Offspring Neurodevelopment and Later-Life Behavior. Neurosci. Biobehavioral Rev. 127, 492. doi:10.1016/j.neubiorev.2021.04.021
Lee, S. M., Jeon, S., Jeong, H. J., Kim, B.-N., and Kim, Y. (2020). Dibutyl Phthalate Exposure during Gestation and Lactation in C57BL/6 Mice: Maternal Behavior and Neurodevelopment in Pups. Environ. Res. 182, 109025. doi:10.1016/j.envres.2019.109025
Li, J., Zhao, H., Xia, W., Zhou, Y., Xu, S., and Cai, Z. (2019). Nine Phthalate Metabolites in Human Urine for the Comparison of Health Risk between Population Groups with Different Water Consumptions. Sci. total Environ. 649, 1532–1540. doi:10.1016/j.scitotenv.2018.08.294
Li, Y., Zhuang, M., Li, T., and Shi, N. (2009). Neurobehavioral Toxicity Study of Dibutyl Phthalate on Rats Followingin Uteroand Lactational Exposure. J. Appl. Toxicol. 29, 603–611. doi:10.1002/jat.1447
Lyche, J. L., Gutleb, A. C., Bergman, Å., Eriksen, G. S., Murk, A. J., Ropstad, E., et al. (2009). Reproductive and Developmental Toxicity of Phthalates. J. Toxicol. Environ. Health B 12, 225–249. doi:10.1080/10937400903094091
Mandard, S., Muller, M., and Kersten, S. (2004). Peroxisome Proliferator-Activated Receptor a Target Genes. Cell Mol. Life Sci. CMLS 61, 393–416. doi:10.1007/s00018-003-3216-3
Medicine IO (2009). Weight Gain during Pregnancy: Reexamining the Guidelines. Washington (DC), USA: The National Academies Collection: Reports funded by National Institutes of.
Miodovnik, A., Edwards, A., Bellinger, D. C., and Hauser, R. (2014). Developmental Neurotoxicity of Ortho-Phthalate Diesters: Review of Human and Experimental Evidence. Neurotoxicology 41, 112–122. doi:10.1016/j.neuro.2014.01.007
Olesen, T. S., Bleses, D., Andersen, H. R., Grandjean, P., Frederiksen, H., Trecca, F., et al. (2018). Prenatal Phthalate Exposure and Language Development in Toddlers from the Odense Child Cohort. Neurotoxicology and teratology 65, 34–41. doi:10.1016/j.ntt.2017.11.004
Peters, J. M., Taubeneck, M. W., Keen, C. L., and Gonzalez, F. J. (1997). Di(2‐Ethylhexyl) Phthalate Induces a Functional Zinc Deficiency during Pregnancy and Teratogenesis that Is Independent of Peroxisome Proliferator‐activated Receptor‐α. Teratology 56, 311–316. doi:10.1002/(sici)1096-9926(199711)56:5<311::aid-tera4>3.0.co;2-#
Polanska, K., Ligocka, D., Sobala, W., and Hanke, W. (2014). Phthalate Exposure and Child Development: the Polish Mother and Child Cohort Study. Early Hum. Dev. 90, 477–485. doi:10.1016/j.earlhumdev.2014.06.006
Ponsonby, A.-L., Symeonides, C., Vuillermin, P., Mueller, J., Sly, P. D., and Saffery, R. (2016). Epigenetic Regulation of Neurodevelopmental Genes in Response to In Utero Exposure to Phthalate Plastic Chemicals: How Can We Delineate Causal Effects? Neurotoxicology 55, 92–101. doi:10.1016/j.neuro.2016.05.011
Qian, X., Li, J., Xu, S., Wan, Y., Li, Y., Jiang, Y., et al. (2019). Prenatal Exposure to Phthalates and Neurocognitive Development in Children at Two Years of Age. Environ. Int. 131, 105023. doi:10.1016/j.envint.2019.105023
Téllez-Rojo, M. M., Cantoral, A., Cantonwine, D. E., Schnaas, L., Peterson, K., Hu, H., et al. (2013). Prenatal Urinary Phthalate Metabolites Levels and Neurodevelopment in Children at Two and Three Years of Age. Sci. total Environ. 461-462, 386–390. doi:10.1016/j.scitotenv.2013.05.021
Wang, Y., Chen, B., Lin, T., Wu, S., and Wei, G. (2017). Protective effects of vitamin E against reproductive toxicity induced by di(2-ethylhexyl) phthalate via PPAR-dependent mechanisms. Toxicol. Mech. Methods 27, 551–559. doi:10.1080/15376516.2017.1333556
Ward, J. M., Peters, J. M., Perella, C. M., and Gonzalez, F. J. (1998). Receptor and Nonreceptor-Mediated Organ-specific Toxicity of Di(2-Ethylhexyl)phthalate (DEHP) in Peroxisome Proliferator-Activated Receptorα-Null Mice. Toxicol. Pathol. 26, 240–246. doi:10.1177/019262339802600208
Wehby, G. L., and Murray, J. C. (2008). The Effects of Prenatal Use of Folic Acid and Other Dietary Supplements on Early Child Development. Matern. Child. Health J. 12, 180–187. doi:10.1007/s10995-007-0230-3
Whyatt, R. M., Liu, X., Rauh, V. A., Calafat, A. M., Just, A. C., Hoepner, L., et al. (2012). Maternal Prenatal Urinary Phthalate Metabolite Concentrations and Child Mental, Psychomotor, and Behavioral Development at 3 Years of Age. Environ. Health Perspect. 120, 290–295. doi:10.1289/ehp.1103705
Wilcox, A. J. (2010). Fertility and Pregnancy: An Epidemiologic Perspective. Durham, USA: Oxford University Press.
Wittassek, M., and Angerer, J. (2008). Phthalates: Metabolism and Exposure. Int. J. Androl. 31, 131–138. doi:10.1111/j.1365-2605.2007.00837.x
Xu, S., Zhang, H., Pao, P.-C., Lee, A., Wang, J., Suen Chan, Y., et al. (2020). Exposure to Phthalates Impaired Neurodevelopment through Estrogenic Effects and Induced DNA Damage in Neurons. Aquat. Toxicol. 222, 105469. doi:10.1016/j.aquatox.2020.105469
Xu, X.-h., Zhang, J., Wang, Y.-m., Ye, Y.-p., and Luo, Q.-q. (2010). Perinatal Exposure to Bisphenol-A Impairs Learning-Memory by Concomitant Down-Regulation of N-Methyl-D-Aspartate Receptors of hippocampus in Male Offspring Mice. Horm. Behav. 58, 326–333. doi:10.1016/j.yhbeh.2010.02.012
Xu, X., Li, T., Luo, Q., Hong, X., Xie, L., and Tian, D. (2011). Bisphenol-A Rapidly Enhanced Passive Avoidance Memory and Phosphorylation of NMDA Receptor Subunits in hippocampus of Young Rats. Toxicol. Appl. Pharmacol. 255, 221–228. doi:10.1016/j.taap.2011.06.022
Keywords: phthalate metabolites, child neurodevelopment, PPARα, genetic variants, gene-environment interaction
Citation: Yu L, Zhang H, Zheng T, Liu J, Fang X, Cao S, Xia W, Xu S and Li Y (2022) Phthalate Exposure, PPARα Variants, and Neurocognitive Development of Children at Two Years. Front. Genet. 13:855544. doi: 10.3389/fgene.2022.855544
Received: 15 January 2022; Accepted: 09 March 2022;
Published: 06 April 2022.
Edited by:
Ke Hao, Icahn School of Medicine at Mount Sinai, United StatesReviewed by:
Robert Carter, Columbia University Irving Medical Center, United StatesJushan Zhang, Tongji University, China
Copyright © 2022 Yu, Zhang, Zheng, Liu, Fang, Cao, Xia, Xu and Li. This is an open-access article distributed under the terms of the Creative Commons Attribution License (CC BY). The use, distribution or reproduction in other forums is permitted, provided the original author(s) and the copyright owner(s) are credited and that the original publication in this journal is cited, in accordance with accepted academic practice. No use, distribution or reproduction is permitted which does not comply with these terms.
*Correspondence: Yuanyuan Li, bGl5dWFueXVhbkBodXN0LmVkdS5jbg==