 C. Bharadwaj1†*
 J. Jorben1†
 Apoorva Rao1
 Manish Roorkiwal2,3B. S. Patil1
 Jayalakshmi4S. Khayum Ahammed4D. R. Saxena5M. Yasin5J. E. Jahagirdar6P. L. Sontakke6M. S. Pithia7M. K. Chudasama7Indu Swarup8R. K. Singh8S. D. Nitesh9
 Annapurna Chitikineni2,10
 Sarvjeet Singh11
 Inderjit Singh11
 Aditya Pratap12
 G. P. Dixit12
 A. K. Srivastava12
 Rajeev K. Varshney2,10*
- 1Division of Genetics, ICAR- Indian Agricultural Research Institute, New Delhi, India
- 2Center of Excellence in Genomics and Systems Biology, International Crops Research Institute for the Semi-Arid Tropics (ICRISAT), Hyderabad, India
- 3Genomic Breeding Lead, Khalifa Center for Genetic Engineering and Biotechnology (KCGEB), UAE University, Al Ain, United Arab Emirates
- 4Regional Agricultural Research Station, Kurnool, India
- 5RAK College of Agriculture, RVSKVV, Sehore, India
- 6Agricultural Research Station, Badnapur, India
- 7Pulse Research Station, Gujarat Agriculture University, Junagadh, India
- 8AICRIP on Chickpea, College of Agriculture Indore, Indore, India
- 9Department of Plant Breeding and Genetics, CSAUAT, Kanpur, India
- 10State Agricultural Biotechnology Centre, Centre for Crop and Food Innovation, Food Futures Institute, Murdoch University, Murdoch, WA, Australia
- 11Department of Plant Breeding and Genetics, Punjab Agricultural University, Ludhiana, India
- 12Crop Protection Division, Indian Institute of Pulse Research, Kanpur, India
Pusa 391, a mega desi chickpea variety with medium maturity duration is extensively cultivated in the Central Zone of India. Of late, this variety has become susceptible to Fusarium wilt (FW), which has drastic impact on its yield. Presence of variability in the wilt causing pathogen, Fusarium oxysporum f.sp. ciceri (foc) across geographical locations necessitates the role of pyramiding for FW resistance for different races (foc 1,2,3,4 and 5). Subsequently, the introgression lines developed in Pusa 391 genetic background were subjected to foreground selection using three SSR markers (GA16, TA 27 and TA 96) while 48 SSR markers uniformly distributed on all chromosomes, were used for background selection to observe the recovery of recurrent parent genome (RPG). BC1F1 lines with 75–85% RPG recovery were used to generate BC2F1. The plants that showed more than 90% RPG recovery in BC2F1 were used for generating BC3F1. The plants that showed more than 96% RPG recovery were selected and selfed to generate BC3F3. Multi-location evaluation of advanced introgression lines (BC2F3) in six locations for grain yield (kg/ha), days to fifty percent flowering, days to maturity, 100 seed weight and disease incidence was done. In case of disease incidence, the genotype IL1 (BGM 20211) was highly resistant to FW in Junagarh, Indore, New Delhi, Badnapur and moderately resistant at Sehore and Nandyal. GGE biplot analysis revealed that IL1(BGM20211) was the most stable genotype at Junagadh, Sehore and Nandyal. GGE biplot analysis revealed that IL1(BGM 20211) and IL4(BGM 20212) were the top performers in yield and highly stable across six environments and were nominated for Advanced Varietal Trials (AVT) of AICRP (All India Coordinated Research Project on Chickpea) in 2018–19. BGM20211 and BGM 20212 recorded 29 and 28.5% average yield gain over the recurrent parent Pusa 391, in the AVT-1 and AVT-2 over five environments. Thus, BGM20211 was identified for release and notified as Pusa Manav/Pusa Chickpea 20211 for Madhya Pradesh, Gujarat and Maharashtra, Southern Rajasthan, Bundhelkhand region of Uttar Pradesh states by the Central Sub-Committees on Crop Standards, Notification and Release of Varieties of Agricultural Crops, Ministry of Agriculture and Farmers Welfare, Government of India, for commercial cultivation in India (Gazette notification number S.O.500 (E) dt. 29-1-2021).Such pyramided lines give resilience to multiple races of fusarium wilt with added yield advantage.
Introduction
Chickpea (Cicer arietinum L.) is a rich source of nutrition and is ranked second amongst food legumes after common bean (Bharadwaj et al., 2010). It is a self-pollinated diploid crop with genome size 740 Mbp (Varshney et al., 2013), 2n = 2x = 16 and is grown extensively in about 57 countries under varied environmental conditions. Globally it is grown in an area of 13.72 million hectares (M ha) with an annual production of 14.25 million tons (MT) (Faostat, 2020). South and South-East Asia dominate in chickpea production contributing 80% of global contribution. The largest share of chickpea production (65%, 9.0 MT) is by India followed by Australia (14%) (Merga and Haji, 2019). To attain self-sufficiency by 2050, the total pulse production in the country needs to reach 39 MT (Vision 2050; IIPR) and amongst all pulses, chickpea production alone needs to reach about 16–17.5 MT from a limited area of about 10.5 m ha with an average productivity of 15–17 q/ha (Dixit et al., 2019).
The productivity of chickpea has progressively increased from 1961, although its vulnerability to biotic and abiotic stresses has also steadily decreased, mostly because of the repeated cultivation of limited number of cultivars and use of only a few prominent donor parents in breeding programmes (Muehlbauer and Sarker, 2017). In case of biotic stresses, wilt caused by Fusarium oxysporum (Schlechtend.: Fr.) f. Sp. ciceris (Padwick) Matuo and K. Sato is a serious problem in most of the chickpea growing regions of India. The pathogen is a soil-borne, facultative fungus and leads to vascular wilting leading to an average annual yield loss of 10–30%, which can sometimes even cause complete yield loss (Sunkad et al., 2019).
Multi environmental trials are less effective to select stable genotypes across locations, especially under the effect of genotype X environment interaction (G x E x I), leading to the development of wide and specifically adaptable lines. This understanding is even more important owning to race complexity of FW in multiple-environmental trails. Management strategy for FW using chemical formulations as well as the biological control techniques is challenging as the pathogen is harbored in seed and soil. Also, cost involvement and the hazardous nature of chemicals make their use ineffective. Therefore, there is a need for cost effective management strategies which involve developing wilt resistant lines that are widely adapted (Haware and Nene, 1982; Sharma et al., 2005). Conventional breeding methodology takes a long time and is considered less effective to pyramid multiple genes conferring resistance against various races of same pathogen in a single variety. The availability of sufficient genomic information in terms of the physical map, genetic, and draft sequencing of kabuli chickpea genotype CDC Frontier has improved the marker-assisted backcrossing (MABC) breeding approach. Mapping studies revealed that all foc resistance genes (1, 3,4 and 5) are present on LG02, and tightly linked markers to these races have been identified (Millan et al., 2006; Gowda et al., 2009). Successful application of the MABC approach in chickpea for introgressing resistance/tolerance to drought (Bharadwaj et al., 2021), FW (Varshney et al., 2014a; Pratap et al., 2017), and Ascochyta blight (Varshney et al., 2014b) into popular chickpea varieties have immensely proved the application of MABC in developing elite varieties. Thus, MABC can quickly aid in developing wilt-resistant varieties and pyramid numerous genes in a single introgression line by using foreground and background selection using genome-wide SSR markers (Bharadwaj et al., 2021).This will help in developing multi-race resistant introgression lines that can be widely cultivated across the country.
Pusa 391, a mega variety that is widely grown in central India for its excellent grain quality, has become susceptible to FW since past few years and subsequently its yield had reduced drastically. Thus, in the present study, pyramiding of multiple races against foc 1,2,3,4 and 5 was undertaken at ICAR-Indian Agricultural Research Institute (IARI) in collaboration with International Crops Research Institute for the Semi-Arid Tropics (ICRISAT). We also report the release of Pusa Chickpea 20211, a variety developed by molecular breeding, which is highly resistant to FW and is superior to national check (JG 16).
Materials and Methods
Pusa 391, a high yielding desi chickpea variety with high grain quality and market preference, was released in 1997 for Central zone of India, was chosen as the recurrent parent for introgression of FW resistance by using WR 315 as donor parent, which harbors resistant genes foc1, 3, 4 and 5. It has a seed size of about 20–25 g per 100 seeds, matures in 110–120 days, and has an average yield of 17–18 Q/ha (http://farmer.gov. in/imagedefault/pestanddiseasescrops/pulses.pdf). Each introgression line was planted in two replications comprising two rows of 4 m length and planted at 30 × 10 cm spacing.
DNA Extraction and Marker Analysis
DNA was isolated from tender leaf tissues of 18–20 days old seedlings of parents, F1 and backcross generations, using the protocol described by Tapan et al. (2013). A total of six SSR markers, namely TA110, TA37, TR19, GA16, TA27, and TA96 reported to be in the cluster containing genes for conferring FW resistance on the linkage group CaLG02 (Millan et al., 2006) were subjected to parental polymorphism to identify polymorphic markers. PCR was carried out in the Chickpea Molecular Breeding Laboratory, Division of Genetics, ICAR-IARI using a G-STORM thermal cycler (Labtech, France). The PCR amplicons were resolved on a 1.2% agarose gel or with an ABI 3730 (Applied Biosystems). Polymorphic markers with donor and recipient cross-combinations from the hotspot region of the LG02 were used for foreground selection (Supplementary Table S1).
Based on previous studies, a panel of 365 highly polymorphic SSR markers (Thudi et al., 2011; Bharadwaj et al., 2021) were tested at the Centre of Excellence in Genomics and Systems Biology (CEGSB), ICRISAT for parental polymorphism between the donor and recurrent parents for potential use in background selection. Background selection was based on polymorphic markers identified for each donor and recipient parent cross-combination (Supplementary Table S1). Recurrent parent genome (RPG) recovery was calculated for selection using the formula suggested by Sundaram et al. (2008).
Phenotypic Screening for Fusarium Wilt Resistance at Multiple Locations
Ten advanced MABC lines (BC3F3 progenies) were sown in wilt sick plot, along with parent Pusa 391, resistant check (WR 315), susceptible check (JG 62) and National check (JG 16) in RCBD (randomized complete block design) with two replications in the years 2017–18 across six diverse locations viz., Indore (22.7196° N, 75.8577° E), Badnapur (19.8682° N, 75.7256° E), Junagadh (21.52° N, 70.45° E) Nandyal (15.47° N, 78.48° E), Sehore (23.2032° N, 77.0844° E) and IARI-New Delhi (28°70′N, 76°58′E) during 2017-18for morphological characters such as yield (per hectare), days to 50% flowering (DFF), days to maturity (DM), and hundred seed weight (HSW) (Table 1). There was sufficient inoculum load (spore concentration of 5–6 × 10⁶ conidia/ml/g of soil) in the wilt sick plot as manifested by the 100% mortality of susceptible check JG 62. Visual observations were taken at seedling to flowering stage of crop based on mortality rate as per the classification of Sharma et al. (2019), designated as highly resistant (less than 10% plant mortality), moderately resistant (10.1–20.0% plant mortality), susceptible (20.1–40.0% plant mortality), and highly susceptible (more than 40.0% plant mortality).The superior introgression lines (IL1, IL3 and IL4) having yield superiority and reaction to FW across locations were recommend for AICRP trials. BGM20211 (IL1) and BGM 20212 (IL4) were tested in AVT-1 and AVT-2 along with checks in 2018–2019 and 2019-2020, respectively, for adaptability and yield advantage and BGM 20213 (IL 3) was recommended for AVT-1 in 2019–20.
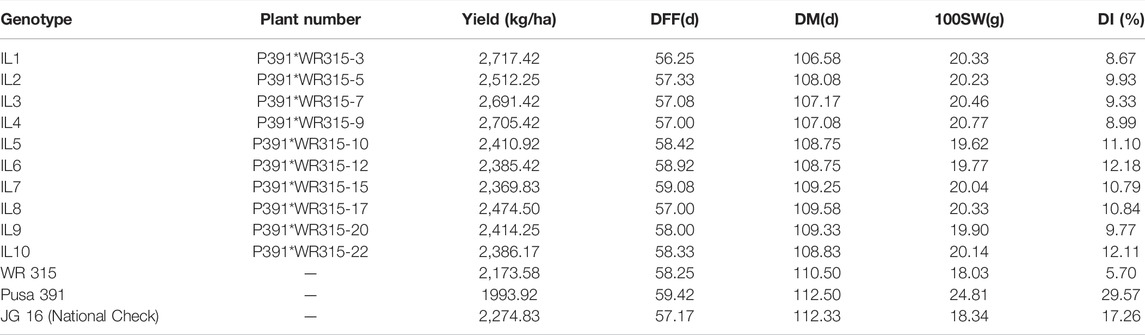
TABLE 1. Mean yield- Yield performance (Kg/ha), days to Fifty percent Flowering (DFF), days to maturity (DM), 100 Seed Weight (HSW) and disease Index (DI) of chickpea at six locations during 2017–2018.
% Disease incidence calculated as per Sharma et al. (2017) as,
Statistical Analysis
All analyses were performed in the R software. A preliminary variability study was conducted using TraitStats:R package, developed by Nitesh et al. (2021), while the GGE Biplots were performed with the metan: R package, developed by Olivoto and Lucio (2020).
Results
Analysis of Variance (ANOVA)
Joint ANOVA results revealed significant differences (p < 0.05) for all five traits among the genotypes under the study in each of the environments tested (E1, E2, E3, E4, E5, and E6) (Table 2).
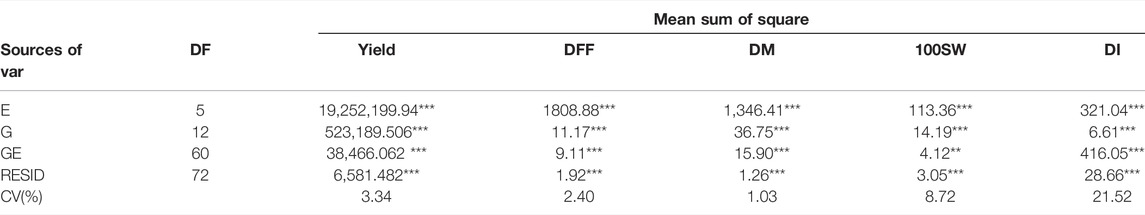
TABLE 2. Analysis of joint variance for the trait yield (Per hectare), days to fifty per cent flowering (DFF), days to maturity (DM), 100 seed weight (100SW) and disease incidence (DI) evaluated in 13 genotypes in a different environment (**, significant at p ≤ 0.01; ***, significant at p ≤ 0.001.)
Foreground and Background Marker Analysis
Based on parental polymorphism, three markers viz., GA16, TA27 and TA96 were polymorphic and used for foreground selection between Pusa 391 and WR 315. For background selection, among the 365 SSR markers analysed on both parents, 141 were observed to be polymorphic. 48 of these markers that covering the whole genome uniformly, so that each chromosome contains six polymorphic markers distributed evenly were identified for background selection.
Marker-Assisted Introgression
At ICAR-IARI, New Delhi and IARI-Regional Station, Dharwad, marker-assisted backcrossing was carried out during 2014–18. The detailed description used for introgression for FW resistance from WR 315 to Pusa 391 is provided in Figure 1. Crosses were carried out between Pusa 391 (recurrent parent) and WR 315 (donor) in crop season 2014-15 to develop F1s. A total of 44 F1s were obtained, out of which 40 germinated and 15 were confirmed as true hybrids using polymorphic foreground markers (TA27, TA96, GA16). These F1s were utilized to make backcross with Pusa 391, and 20 BC1F1 seeds were generated during the off-season in 2015–16 at Dharwad. Out of 20 BC1F1 seeds produced, eight positive plants for foreground marker and had the higher genome recovery of 75–85% were selected for backcrossing to generate 124 BC2F1 seeds during the main season IARI, New Delhi in 2015–16. From the 124 BC2F1 plants, 56 were heterozygous for foreground markers, of which ten plants with more than 90% genome recovery were used for generation of backcrossing at IARI regional station Dharwad to generate 134 BC3F1.Then upon foreground selection, 70 plants were observed to be heterozygous. These 70 plants were subjected for background selection using 48 SSR markers, and 24 BC3F1 plants showing more than 96% RPG recovery were selected and selfed. Finally, with two rounds of selfing, 28 best BC3F3 plants were analysed with foreground and background markers with 90–97% RPG recovery and showing agronomic superiority were selected. The top ten high yielding, highly disease resistant lines (<10% disease incidence) with plant type similar to Pusa 391 (recurrent parent) were evaluated at multiple locations.
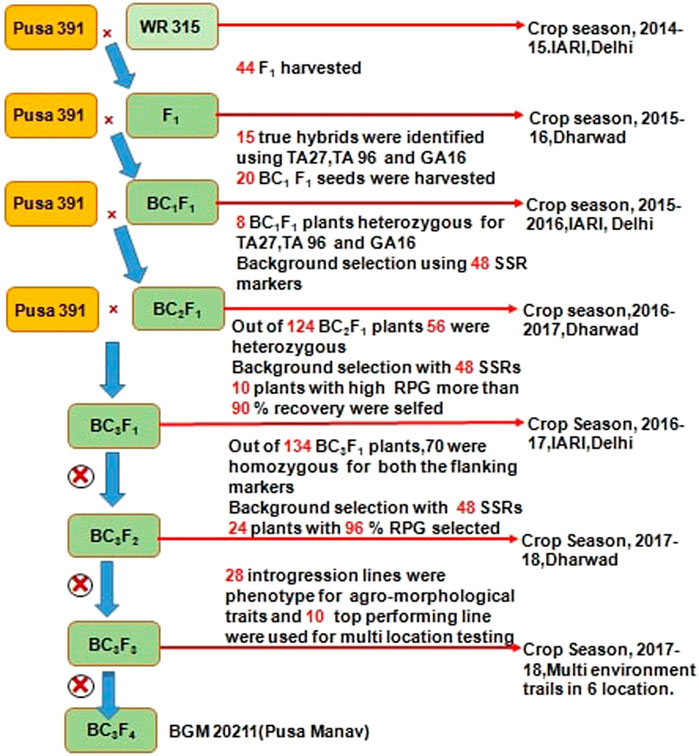
FIGURE 1. Detailed representation of marker assisted back cross bred lines of Chickpea for Fusarium wilt at ICAR-IARI.
Phenotypic Performance of Pusa 391 MABC Lines in Multi-Location Trails
Introgression lines (BC3F3) were phenotyped at six diverse environments, Indore, Badnapur, Junagadh, Nandyal, Sehore and IARI-New Delhi, in the crop season 2017–2018 and transgressive segregants were identified by morphological superiority and with high wilt resistance (Table 1). IL1, IL4, and IL3 were the top performers in the multi-location trial with a mean yield advantage of 20, 19 and 18%, respectively, over the national check JG 16 and mean yield gain of 36, 35 and 35% over recurrent parent Pusa 391. Disease incidence index over multiple locations of IL1, IL2, IL3, IL4, and IL 9 were 8.66, 9.93, 9.33, 8.99 and 9.76, respectively, which showed a highly resistant reaction. On the other hand, IL5, IL6, IL7, IL8 and IL10 were 11.1, 12.1, 10.8, 10.8 and 12.1 respectively, which showed moderately resistant reactions.
The hundred seed weight (HSW) of IL1 (BGM 2011) across locations was 20.33 g, IL4 (BGM 20212) was 20.77, and IL3 (BGM 20213) was 20.46, as compared to recurrent parent Pusa391, which recorded 24.81 g IL1 (BGM 20211) had early flowering (56 days) and early maturity (107days) compared to the parent Pusa 391 flowered in 59 days and matured in 112 days. Variation in genotype for different traits studied is presented as descriptive statistics in Table 3. IL1 (BGM 20211) and IL4 (BGM 20212) were the top two performers in multilocation trials conducted, and they were nominated for AICRP trials in 2018–19 (AVT-1) and 2019-20 (AVT-2). The next top performer, IL3 (BGM 20213), was nominated for AICRP trials in 2019–20 (AVT-1).
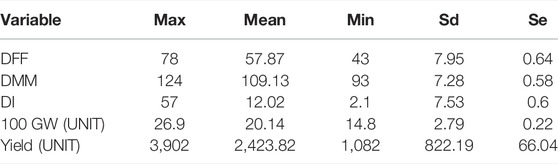
TABLE 3. Descriptive statistics involving Maximum (Max), Mean, Minimum (Min), standard deviation (Sd) and Standard error (Se).
National Advanced Varietal Trial Evaluation
Advanced varietal trial data of BGM 20211 and BGM 20212 indicated that they were early flowering (51 and 53 days, respectively) as well as early maturing (106 and 107 days, respectively) lines. Under ICAR-AICRP on chickpea, special trials were conducted in known as “Wilt resistance introgression lines” (WRIL) trials that can assess lines performance in multiple locations. There was a 23 and 35% overall weighted percentage increase in AVT-1 and AVT-2 respectively with overall mean of 29% over recurrent parent Pusa 391. In the case of IL2 (BGM 20212), the overall weighted percentage increased over the mean of 28.5%, with 24% in AVT1 and 33% in AVT 2, respectively, over the recurrent parent Pusa 391 (Tables 4, 5). Disease incidence in multiple locations as per AICRP trials are presented in Supplementary Table S2.
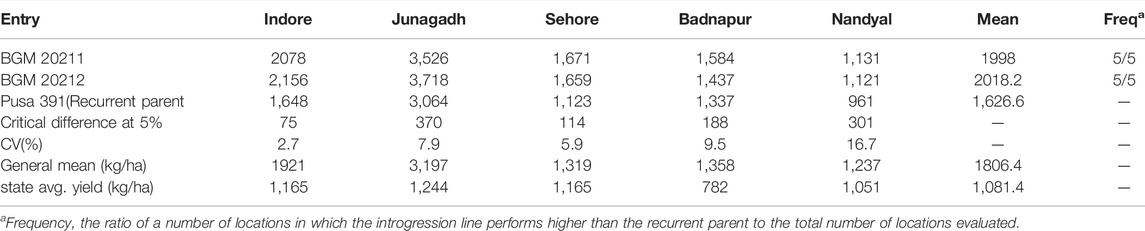
TABLE 4. AVT-1 Comparison of yield (kg ha−1) performance of BGM 20211 and BGM 20212 introgression line developed in the genetic background of Pusa 391, with the recurrent genotype at six locations in the Advanced Varietal Trials−1 of ICAR–All India Coordinated Research Project on Chickpea conducted during 2018–2019 (Source: AICRP Chickpea Annual Report 2018–2019).
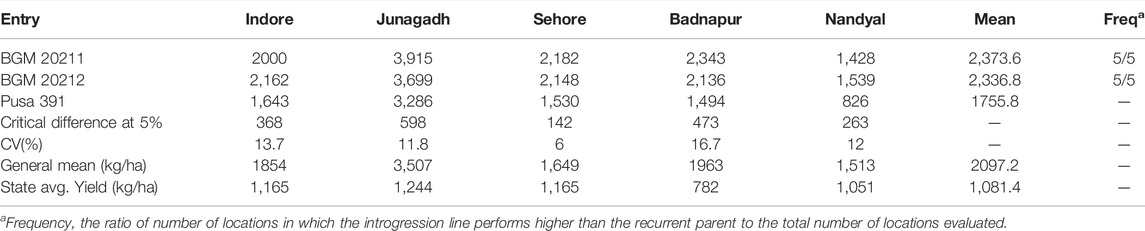
TABLE 5. AVT-2 Comparison of yield (kg ha−1) performance of BGM 20211 and BGM 20212 introgression line developed in the genetic background of Pusa 391, with the recurrent genotype at six locations in the Advanced Varietal Trials−2 of ICAR–All India Coordinated Research Project on Chickpea conducted during 2019–2020 (Source: AICRP Chickpea Annual Report 2019–2020).
GGE biplot analysis: GGE biplot analysis explained 66.11% of the total variation, where PC1 (wilt incidence) and PC2 (resistance stability) accounted for 51.64 and 14.47% variation, respectively.
1) Mean vs. Stability
As illustrated in Figure 2, GGE biplot analysis explained a total of 89.34% variation, the horizontal axis (PC1) accounted for 79.15% of the total variation. It represented the main effect of genotypes, whereas the vertical axis (PC2) accounted for 10.19% of total variation and showed the impact of G X E interaction (Yan and Kang, 2002). The average environment coordinate (AEC) axis is a single arrow line passed from the biplot origin to the average environment, depicted by a dotted circle. On the vertical axis, ILs located to the right of the AEC indicated higher yield than average yield and vice versa. Thus, the biplot organized the yield performance as IL1>IL4>IL3>IL2>IL8 in that order. However, the recurrent parent Pusa 391 and national check JG 16 showed a lower yield than ILs. The AEC vertical axis displayed the stability of genotype yield, which was considered stronger if the horizontal AEC axis line length was shorter (Lakew et al., 2014; Harish et al., 2020). The IL1, IL4 and IL3 were the most stable and high yielding as they were farthest from origin and shortest vector length.
2) Which-Won-Where pattern analysis
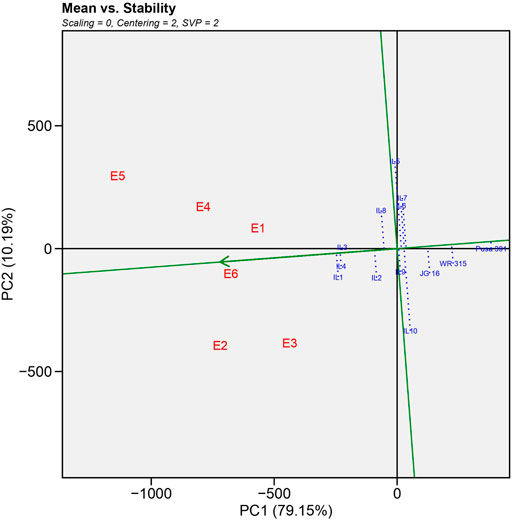
FIGURE 2. Average-environment coordination (AEC) view showing the mean yield performance and stability of different genotypes based on genotype and genotype interaction (GGE)-biplot analysis.
The polygon view was generated by interconnecting the markers of the ILs that were farthest from the biplot origin with straight lines, resulting in markers of all cultivars being contained in the polygon (Figure 3). To divide the biplot into various sectors, lines perpendicular to each side of the polygon or their extensions were drawn from the biplot origin. The peak cultivar in each sector was the top cultivar for traits found in that section; on the other hand, genotypes found inside the polygon and near the biplot’s origin were not sensitive to changing environmental conditions (Dimitrios et al., 2008).The genotypes positioned at the greatest distance from the biplot origin were the best or worst ILs in particular or every environment. IL1 performed superior under E2 (Junagadh), E3 (Sehore) and E6 (Nandyal) and IL3 performed superior in E1 (Indore), E4 (Badnapur) and E5 (New Delhi) from the which won where pattern analysis.
3) Evaluation of testing locations based on discrimination power vs. representativeness
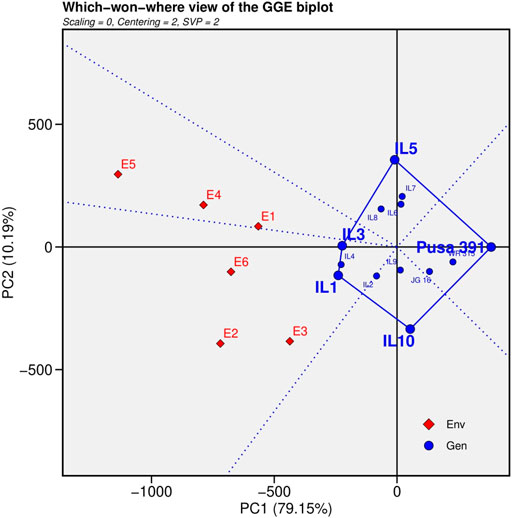
FIGURE 3. “Which-won-where” view for the primary component of interaction (PC1) and second principal component (PC 2).
An ideal location needs to be highly distinctive and represent the target location simultaneously (Yan, 2010). The ability of a place to maximise the diversity among potential cultivars in a study is referred to as discrimination (Blanche and Myers, 2006). The ability to represent, reveals that the study included an environment that was indicative of the conditions in the other locations (Mohammadi and Amri, 2012). An ideal environment will identify genotypes with high and stable yield. The small circle in the GGE-biplot display represents a perfect position determined by the mean coordinates of all testing locations (Figure 4). There was a positive association between the length of the location vector and the ability to discriminate between locations, but a negative correlation between the angle of the location vector with the ideal location and the location’s representativeness of the target environment (Yan, 2010). The observed angle between E1, E4, E5 and E2, E3, E6 was less than 900, indicating a positive correlation among environment sets, and similar results can be expected in these regions. Following analysis, it was observed that E5 (New Delhi)>E2>E3>E4>E6>E1 had the longest environmental vectors among the test environments, making it the most “discriminating location” with the potential to distinguish different genotypes. The ranking of environments in terms of being the best representative locations was E6>E1>E4>E2,E3, E5 were in the order, and thus E6 (Nandyal) can be considered the most representative environment.
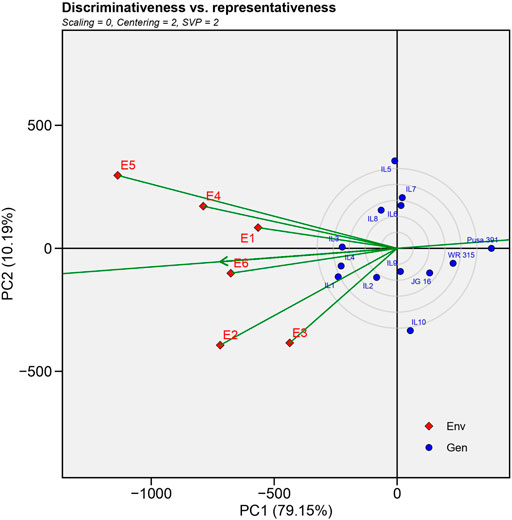
FIGURE 4. GGE-biplot environment view for yield that shows the correlation between test environments and correlation coefficient between any two environments is approximated by the cosine angle between their vectors.
Discussion
Fusarium wilt has been a widely distributed disease that can cause upto 100% yield loss based on varietal susceptibility and changing climatic conditions that have resulted in the shift of large chickpea growing area from cool long Northern India to warm short central and southern India (Patil et al., 2015). The presence of eight physiological races of foc (0,1A,1B/C, 2, 3, 4, 5 and 6) has been reported across different countries (Haware and Nene, 1982). FW is prevalent in dry and warm semi-arid tropic (SAT) regions of Asia, Africa and South America (Nene and Sheila, 1996). Race 1 is typical in Central and Peninsular India, race 2 in Northern India and 3 and 4 in Punjab and Haryana (Haware et al., 1992). Also, some of the cultivars are susceptible with time, which could be attributed to variability in wilt incidence and genetic differences among genotypes and genotype x environment interactions (Sharma et al., 2012).
The “5Gs” breeding technique (genome assembly, germplasm characterization, gene function identification, genomic breeding, and gene editing) has recently been proposed for obtaining precision and boosting crop improvement to satisfy future demands for nutritious food (Varshney et al., 2019). MABC using genome-wide SSR markers for foreground and background selection for recovery of recurrent parent genome is an environment-independent, precise, and rapid strategy for developing disease-resistant cultivars (Bharadwaj et al., 2021). Deploying resistant variety is one of the key sustainable strategies that breeders can adopt as it is most effective and environmentally safe for integrated disease management (Sharma et al., 2017).
Genetic inheritance studies reveal that resistance to race 0,1A,2 and 4 are either digenic or trigenic, but races 3 and 5 were monogenic (Tullu et al., 1999; Tekeoglu et al., 2000).Based on several inter- and intra-specific crosses, it was reported that wilt resistance genes foc1, foc3, foc 4 and foc 5 (Races 1, 3, 4 and 5) are mapped on two gene clusters, i.e., GA16 and TA96 (foc 1 and 4 clusters), TA 96 and TA 27 (foc 3 and 5 clusters) (Millan et al., 2006). However, resistance genes per se and proteins that were reported to be involved in pathogen defense were localized in between the region or in close vicinity of the gene cluster. Also, resistance loci ar1 and ar2a against Ascochyta blight were localized on LG02 and near foc gene clusters. Thus, LG02 is considered a hot spot for pathogen defense (Millan et al., 2006).
The major hindrance in chickpea breeding for FW is variation in pathogen races over multiple locations and their interaction with different weather conditions over space and time (Sharma et al., 2014). Stable high yielding lines with high disease resistance are required to develop widely adaptable varieties. (Srivastava et al., 2021). Thus, GGE Mean vs. Stability analysis recorded IL1>IL4>IL3 were most stable and high yielding introgression line in the order and the worst performing genotype was Pusa 391 > WR 315 > JG16. Which-won-where analysis revealed IL1 performed best under Junagadh, Sehore and Nandyal region and IL3 performed best in Indore, Badnapur and New Delhi from the which-won-where plot. The New Delhi environment was considered the most discriminating location because this location is subjected to distinct climatic conditions compared to other environments. Discrimination and representativeness analyses reveal that E6 (Nandyal) is the most representative location. The genotypes were highly stable in this location, as was reported by Sharma et al. (2019) while screening for wilt-resistant genotypes in wilt sick plot over ten locations. The top three best performing introgression lines (IL1, IL4 and IL3) with more than 30% yield advantage over recurrent parent Pusa 391 were nominated for AVT trials based on the multi-location studies.
MABC approach was used to pyramid races1, 2, 3,4 and 5 for FW and RPG recovery. In the current study, BC2F1 and BC3F1 generation achieved 90 and 96% RPG recovery for selected MABC lines in the genetic background of Pusa 391. Similar genome recovery was reported by Mannur et al., 2019and Bharadwaj et al., 2021 in chickpea. Thus, MABC reduces the time taken to develop a variety and such genome recovery is usually possible inBC4F1 and more generations in conventional breeding.
The introgression line IL1 (BGM 20211) is highly resistant to FW and moderately resistant to stunt, collar rot, dry root, pod borer and possesses excellent grain, colour and shape, as per AICRP report, 2020. The grain protein content was found to be 18.92%. In the case of 100 SW, parent Pusa 391 had a higher 100 SW than introgression line BGM 20211. Also, it is an early flowering and early maturing IL (57 days to flowering and 107 days to maturity), that can fit in the double cropping system and is ideal for the sustainability of the rice-wheat cropping system (Bharadwaj et al., 2021).Further, it can also escape heat stress at harvest in central India compared to Pusa 391, which matures in 112 days.
In the case of disease incidence, BGM 20211 was highly resistant for FW in Junagadh, Indore, IARI-New Delhi and found moderately resistant at Sehore and Nandyal. BGM 20212 was highly resistant in Junagarh and New Delhi and moderately resistant in Indore, Sehore and Nandyal. BGM 20213 was highly resistant in Junagarh, Indore, New Delhi and found to be moderately resistant at Sehore and Nandyal. National check (JG 16) was moderately resistant in Junagarh, Indore, New Delhi and Nandyal and susceptible in Sehore. Also, recurrent parent Pusa 391 was moderately resistant in Badnapur, susceptible in New Delhi, Nandyal, Junagarh and Indore, highly susceptible in Sehore. Superior performance across locations confirms the molecular basis of pyramiding with morphological and wilt sick studies.
In the case of FW, introgression for foc1 (Varshney et al., 2014a), foc2 (Pratap et al., 2017) and foc 4 (Mannur et al., 2019) were developed on the elite genetic background of C214, Pusa 256 and Annigeri, respectively. Mannur et al., 2019 reported a 125% mean yield advantage of superior introgression line over the recurrent parent JG 74 and Super Annigeri 1 reported a8% mean yield advantage over recurrent parent Annigeri 1. In our study, BGM 20211 outperformed parent Pusa 391 by 29% (average over five regions in AVT-1 and AVT-2) and national check (JG16) by 28% (average over 6 locations in multi-location trials), which include southern India (Nandyal), Central India (Badnapur, Indore and Junagarh) and North India (New Delhi).This variety profusely branches and possesses a large number of pods per unit area and has demonstrated an overall weighted mean yield of 2,186 kg/ha and the highest yield potential reported was 3,915 kg/ha in a wilt stress environment, compared to 1,691 kg/ha in case of recurrent parent Pusa 391.
This is the first report in pulses where FW genes are pyramided in recurrent parent background and released for commercial cultivation using the MABC approach.Marker assisted back cross breeding approach was utilized for pyramiding of FW resistance for different races (foc 1,2,3,4 and 5). Foreground selection was performed using three SSR markers (GA16, TA 27 and TA 96) and background selection for recovery (RPG) of recurrent parent genome was done using 48 SSR markers that were uniformly distributed on all chromosomes. Multi-location evaluation of advanced introgression lines (BC2F3) was done in six locations for grain yield parameters and wilt screening along with GGE biplot analysis. IL1 (BGM 20211) and IL4 (BGM 20212) were the top performers in yield and were highly stable across all environments and were nominated for Advanced Varietal Trials (AVT) of AICRP (All India Coordinated Research Project on Chickpea). BGM 20211 was identified for release and notified as Pusa Manav for Madhya Pradesh, Gujarat and Maharashtra states by the Central Sub-Committees on Crop Standards, Notification and Release of Varieties of Agricultural Crops, Ministry of Agriculture and Farmers Welfare, Government of India, for commercial cultivation in India. High yielding pyramided lines for FW are important to avoid economic losses and for improving Chickpea production across India.
Data Availability Statement
The original contributions presented in the study are included in the article/Supplementary Material, further inquiries can be directed to the corresponding authors.
Author Contributions
CB and JJ contributed to the analysis, interpretation of data, prepared the manuscript and conceived the study. AR, BP, JL, SA, DS, MY, JJ, PLS, MP, MC, IS, RS, SN, SS, IS, AP, GD, AS contributed to the coordinated evaluation of material. CB designs the study, reviewed and edited the manuscript. MR, AC provided feedback, and edited the manuscript. CB, SN, MR, RV contributed to the statistical analysis, interpretation of data. CB and RV reviewed and edited the manuscript. All the authors read and approved the manuscript.
Funding
The study was funded by ICAR-CRP (Code: 12-143D) collaborative project and the institutional fund from ICAR-IARI.
Conflict of Interest
The authors declare that the research was conducted in the absence of any commercial or financial relationships that could be construed as a potential conflict of interest.
Publisher’s Note
All claims expressed in this article are solely those of the authors and do not necessarily represent those of their affiliated organizations, or those of the publisher, the editors and the reviewers. Any product that may be evaluated in this article, or claim that may be made by its manufacturer, is not guaranteed or endorsed by the publisher.
Supplementary Material
The Supplementary Material for this article can be found online at: https://www.frontiersin.org/articles/10.3389/fgene.2022.924287/full#supplementary-material
References
Bharadwaj, C., Chauhan, S. K., Rajguru, G., Srivastava, R., Tara Satyavathi, C., Yadav, S., et al. (2010). Diversity Analysis of Chickpea (Cicer Arietinum) Cultivars Using STMS Markers. Indian J. Agric. Sci. 80 (11), 947. https://epubs.icar.org.in/index.php/IJAgS/article/view/1720.
Bharadwaj, C., Tripathi, S., Soren, K. R., Thudi, M., Singh, R. K., Sheoran, S., et al. (2021). Introgression of " QTL‐hotspot " Region Enhances Drought Tolerance and Grain Yield in Three Elite Chickpea Cultivars. Plant Genome 14 (1). doi:10.1002/tpg2.20076
Blanche, S. B., and Myers, G. O. (2006). Identifying Discriminating Locations for Cultivar Selection in Louisiana. Crop Sci. 46 (2), 946–949. doi:10.2135/cropsci2005.0279
Dimitrios, B., Christos, G., Jesus, R., and Eva, B. (2008). Separation of Cotton Cultivar Testing Sites Based on Representativeness and Discriminating Ability Using GGE Biplots. Agron. J. 100, 1230–1236.
Dixit, G. P., Srivastava, A. K., and Singh, N. P. (2019). Marching towards Self-Sufficiency in Chickpea. Curr. Sci. 116 (2), 239–242. doi:10.18520/cs/v116/i2/239-242
Faosatat, (2020). Crops. Retrieved from: https://www.fao.org/faostat/en/#data/QC/visualize
Gowda, S. J. M., Radhika, P., Kadoo, N. Y., Mhase, L. B., and Gupta, V. S. (2009). Molecular Mapping of Wilt Resistance Genes in Chickpea. Mol. Breed. 24 (2), 177–183. doi:10.1007/s11032-009-9282-y
Harish, D., Bharadwaj, C., Kumar, Tapan, Patil, B. S., Pal, Madan, Hegde, V. S., et al. (2020). Identification of Stable Drought Tolerant Landraces of Chickpea (Cicer Arietinum) under Multiple Environments. Indian J. Agric. Sci. 90 (8), 1575–1581.
Haware, M. P., Nene, Y. L., Pundir, R. P. S., and Rao, J. N. (1992). Screening of World Chickpea Germplasm for Resistance to fusarium Wilt. Field Crops Res. 30 (1-2), 147–154. doi:10.1016/0378-4290(92)90063-F
Haware, M. P., and Nene, Y. L. (1982). Races ofFusarium Oxysporumf. sp.Ciceri. Plant Dis. 66 (9), 809–810. doi:10.1094/PD-66-809
Lakew, T., Tariku, S., Alem, T., and Bitew, M. (2014). Agronomic Performances and Stability Analysis of Upland Rice Genotypes in North West Ethiopia. Int. J. Sci. Res. Publ. 4 (4), 1–9. https://www.ijsrp.org/research-paper-0414/ijsrp-p2838.pdf.
Mannur, D. M., Babbar, A., Thudi, M., Sabbavarapu, M. M., Roorkiwal, M., Yeri, S. B., et al. (2019). Super Annigeri 1 and Improved JG 74: Two Fusarium Wilt-Resistant Introgression Lines Developed Using Marker-Assisted Backcrossing Approach in Chickpea (Cicer Arietinum L.). Mol. Breed. 39 (1), 1–13. doi:10.1007/s11032-018-0908-9
Merga, B., and Haji, J. (2019). Economic Importance of Chickpea: Production, Value, and World Trade. Cogent Food & Agric. 5 (1), 1615718. doi:10.1080/23311932.2019.1615718
Millan, T., Clarke, H. J., Siddique, K. H. M., Buhariwalla, H. K., Gaur, P. M., Kumar, J., et al. (2006). Chickpea Molecular Breeding: New Tools and Concepts. Euphytica 147 (1), 81–103. doi:10.1007/s10681-006-4261-4
Mohammadi, R., and Amri, A. (2012). Analysis of Genotype × Environment Interaction in Rain-Fed Durum Wheat of Iran Using GGE-Biplot and Non-parametric Methods. Can. J. Plant Sci. 92 (4), 757–770. doi:10.4141/cjps2011-133
Muehlbauer, F. J., and Sarker, A. (2017). “Economic Importance of Chickpea: Production, Value, and World Trade,” in The Chickpea Genome (Cham: Springer), 5–12. doi:10.1007/978-3-319-66117-9_2
Nene, Y. L., and Sheila, V. K. (1996). A World List of Chickpea and Pigeonpea Pathogens. Patancheruvu: ICRISAT.
Nitesh, S. D., Patroti, P., and Parashuram, S. (2021). TraitStasts: Statistical Data Analysis for Randomized Block Design Experiments. R Package version 1.0.2. https://www.niteshgpb.in/TraitStats.pdf.
Olivoto, T., and Lúcio, A. D. C. (2020). Metan: An R Package for Multi‐environment Trial Analysis. Methods Ecol. Evol. 11 (6), 783–789. doi:10.1111/2041-210x.13384
Patil, M., Om, G., Pawar, M., and Chobe, D. R. (2015). Effect of Culture Media, pH and Temperature on the Mycelial Growth and Sporulation of Fusarium Oxysporum F. Sp. Ciceris Isolates of Chickpea from Central Zone of India. JNKVV Res. J. 49, 54–60. http://jnkvv.org/PDF/14022016112818Res%20Jour%2049-1.pdf.
Pratap, A., Chaturvedi, S. K., Tomar, R., Rajan, N., Malviya, N., Thudi, M., et al. (2017). Marker-assisted Introgression of Resistance to fusarium Wilt Race 2 in Pusa 256, an Elite Cultivar of Desi Chickpea. Mol. Genet. Genomics 292 (6), 1237–1245. doi:10.1007/s00438-017-1343-z
Sharma, K. D., Chen, W., and Muehlbauer, F. J. (2005). Genetics of Chickpea Resistance to Five Races of Fusarium Wilt and a Concise Set of Race Differentials for Fusarium Oxysporum F. Sp. Ciceris. Fusarium oxysporum F. Sp. cicerisPlant Dis. 89 (4), 385–390. doi:10.1094/PD-89-0385
Sharma, M., Ghosh, R., Tarafdar, A., Rathore, A., Chobe, D. R., Kumar, A. V., et al. (2019). Exploring the Genetic Cipher of Chickpea (Cicer Arietinum L.) through Identification and Multi-Environment Validation of Resistant Sources against Fusarium Wilt (Fusarium Oxysporum F. Sp. Ciceris). Front. Sustain. Food Syst. 3, 78. doi:10.3389/fsufs.2019.00078
Sharma, M., Kiran Babu, T., Gaur, P. M., Ghosh, R., Rameshwar, T., Chaudhary, R. G., et al. (2012). Identification and Multi-Environment Validation of Resistance to Fusarium Oxysporum F. Sp. Ciceris in Chickpea. Field Crops Res. 135, 82–88. doi:10.1016/j.fcr.2012.07.004
Sharma, M., Nagavardhini, A., Thudi, M., Ghosh, R., Pande, S., and Varshney, R. K. (2014). Development of DArT Markers and Assessment of Diversity in Fusarium Oxysporum F. Sp. Ciceris, Wilt Pathogen of Chickpea (Cicer Arietinum L.). BMC genomics 15 (1), 454–514. doi:10.1186/1471-2164-15-454
Sharma, M., Tarafdar, A., Ghosh, R., and Gopalakrishanan, S. (2017). “Biological Control as a Tool for Eco-Friendly Management of Plant Pathogens,” in Advances in Soil Microbiology: Recent Trends and Future Prospects (Singapore: Springer), 153–188. doi:10.1007/978-981-10-7380-9_8
Srivastava, A. K., Dixit, G. P., Dixit, G. P., Singh, N. P., Saxena, D. R., Saabale, P. R., et al. (2021). Evaluation of Chickpea (Cicer Arietinum L.) Accessions for Fusarium Wilt Resistance. Jeb 42 (1), 82–89. doi:10.22438/jeb/42/1/mrn-1475
Sundaram, R. M., Vishnupriya, M. R., Biradar, S. K., Laha, G. S., Reddy, G. A., Rani, N. S., et al. (2008). Marker Assisted Introgression of Bacterial Blight Resistance in Samba Mahsuri, an Elite Indica Rice Variety. Euphytica 160 (3), 411–422. doi:10.1007/s10681-007-9564-6
Sunkad, G., Deepa, H., Shruthi, T. H., and Singh, D. (2019). Chickpea Wilt: Status, Diagnostics and Management. Indian Phytopathol. 72 (4), 619–627. doi:10.1007/s42360-019-00154-5
Tapan, K., Bharadwaj, C., Satyavathi, C. T., and Jain, P. K. (2013). A High Throughput, Improved Rapid and Reliable Genomic DNA Extraction Protocol from Chickpea (Cicer Arietinum L.). Vegetos 26 (2), 185–190. doi:10.5958/j.2229-4473.26.2.073
Tekeoglu, M., Santra, D. K., Kaiser, W. J., and Muehlbauer, F. J. (2000). Ascochyta Blight Resistance Inheritance in Three Chickpea Recombinant Inbred Line Populations. Crop Sci. 40 (5), 1251–1256. doi:10.2135/cropsci2000.4051251x
Thudi, M., Bohra, A., Nayak, S. N., Varghese, N., Shah, T. M., Penmetsa, R. V., et al. (2011). Novel SSR Markers from BAC-End Sequences, DArT Arrays and a Comprehensive Genetic Map with 1,291 Marker Loci for Chickpea (Cicer Arietinum L.). PLoS One 6 (11), e27275. doi:10.1371/journal.pone.0027275
Tullu, A., Kaiser, W. J., Kraft, J. M., and Muehlbauer, F. J. (1999). A Second Gene for Resistance to Race 4 of Fusarium Wilt in Chickpea and Linkage with a RAPD Marker. Euphytica 109 (1), 43–50. doi:10.1023/a:1003604209476
Varshney, R. K., Mir, R. R., Bhatia, S., Thudi, M., Hu, Y., Azam, S., et al. (2014a). Integrated Physical, Genetic and Genome Map of Chickpea (Cicer Arietinum L.). Funct. Integr. Genomics 14 (1), 59–73. doi:10.1007/s10142-014-0363-6
Varshney, R. K., Mohan, S. M., Gaur, P. M., Chamarthi, S. K., Singh, V. K., Srinivasan, S., et al. (2014b). Marker-assisted Backcrossing to Introgress Resistance to Fusarium Wilt (FW) Race 1 and Ascochyta Blight (AB) in C 214, an Elite Cultivar of Chickpea. Plant Genome 7 (1), 1–11. doi:10.3835/plantgenome2013.10.0035
Varshney, R. K., Song, C., Saxena, R. K., Azam, S., Yu, S., Sharpe, A. G., et al. (2013). Draft Genome Sequence of Chickpea (Cicer Arietinum) Provides a Resource for Trait Improvement. Nat. Biotechnol. 31 (3), 240–246. doi:10.1038/nbt.2491
Varshney, R. K., Thudi, M., Roorkiwal, M., He, W., Upadhyaya, H. D., Yang, W., et al. (2019). Resequencing of 429 Chickpea Accessions from 45 Countries Provides Insights into Genome Diversity, Domestication and Agronomic Traits. Nat. Genet. 51, 857–864. doi:10.1038/s41588-019-0401-3
Yan, W., and Kang, M. S. (2002). GGE Biplot Analysis: A Graphical Tool for Breeders, Geneticists, and Agronomists. New York: CRC Press. doi:10.1201/9781420040371
Keywords: Fusarium Wilt, MABC, Pusa 391, GGE biplot analysis, recurrent parent genome recovery
Citation: Bharadwaj C, Jorben J, Rao A, Roorkiwal M, Patil BS, Jayalakshmi , Ahammed SK, Saxena DR, Yasin M, Jahagirdar JE, Sontakke PL, Pithia MS, Chudasama MK, Swarup I, Singh RK, Nitesh SD, Chitikineni A, Singh S, Singh I, Pratap A, Dixit GP, Srivastava AK and Varshney RK (2022) Development of High Yielding Fusarium Wilt Resistant Cultivar by Pyramiding of “Genes” Through Marker-Assisted Backcrossing in Chickpea (Cicer arietinum L.). Front. Genet. 13:924287. doi: 10.3389/fgene.2022.924287
Received: 20 April 2022; Accepted: 17 June 2022;
Published: 05 August 2022.
Edited by:
Aamir Raina, Aligarh Muslim University, IndiaCopyright © 2022 Bharadwaj, Jorben, Rao, Roorkiwal, Patil, Jayalakshmi, Ahammed, Saxena, Yasin, Jahagirdar, Sontakke, Pithia, Chudasama, Swarup, Singh, Nitesh, Chitikineni, Singh, Singh, Pratap, Dixit, Srivastava and Varshney. This is an open-access article distributed under the terms of the Creative Commons Attribution License (CC BY). The use, distribution or reproduction in other forums is permitted, provided the original author(s) and the copyright owner(s) are credited and that the original publication in this journal is cited, in accordance with accepted academic practice. No use, distribution or reproduction is permitted which does not comply with these terms.
*Correspondence: C. Bharadwaj, ZHJjaGJoYXJhZHdhakBnbWFpbC5jb20= Rajeev K. Varshney, UmFqZWV2LlZhcnNobmV5QG11cmRvY2guZWR1LmF1
†These authors have contributed equally to this work and share first authorship