 Zeyuan Wang
 Hong Gu
 Minghui Zhao1
 Dan Li
 Jia Wang
- 1Faculty of Electronic Information and Electrical Engineering, Dalian University of Technology, Dalian, Liaoning, China
- 2Department of Breast Surgery, Second Hospital of Dalian Medical University, Dalian, Liaoning, China
Many clustering techniques have been proposed to group genes based on gene expression data. Among these methods, semi-supervised clustering techniques aim to improve clustering performance by incorporating supervisory information in the form of pairwise constraints. However, noisy constraints inevitably exist in the constraint set obtained on the practical unlabeled dataset, which degenerates the performance of semi-supervised clustering. Moreover, multiple information sources are not integrated into multi-source constraints to improve clustering quality. To this end, the research proposes a new multi-objective semi-supervised clustering algorithm based on constraints selection and multi-source constraints (MSC-CSMC) for unlabeled gene expression data. The proposed method first uses the gene expression data and the gene ontology (GO) that describes gene annotation information to form multi-source constraints. Then, the multi-source constraints are applied to the clustering by improving the constraint violation penalty weight in the semi-supervised clustering objective function. Furthermore, the constraints selection and cluster prototypes are put into the multi-objective evolutionary framework by adopting a mixed chromosome encoding strategy, which can select pairwise constraints suitable for clustering tasks through synergistic optimization to reduce the negative influence of noisy constraints. The proposed MSC-CSMC algorithm is testified using five benchmark gene expression datasets, and the results show that the proposed algorithm achieves superior performance.
1 Introduction
The rapid development of microarray technology has generated a large amount of gene expression data and mining the inherent patterns in the massive gene expression data is a major challenge in the current bioinformatics field (Bandyopadhyay et al., 2007; Pirooznia et al., 2008). As an important unsupervised data mining method, clustering has become a powerful tool for gene expression data analysis. One of the main tasks of gene expression data clustering is to identify co-expressed genomes, which is a useful tool for further research on gene function (Bandyopadhyay et al., 2007; Chen et al., 2019). Compared with the unsupervised clustering methods, the semi-supervised clustering methods use prior information to guide the clustering process through data labels or pairwise constraints, which can effectively improve the performance of clustering (Wagstaff et al., 2001; Bilenko et al., 2004; Yin et al., 2010).
For semi-supervised clustering algorithms, the pairwise constraints are usually used to describe if two data belong to the same cluster. Specifically, the must-link constraint (ML) means that two data must be divided into the same cluster, and the cannot-link constraint (CL) means that two data must be divided into different clusters. The quality of the selected pairwise constraints is of vital importance, which significantly affects the performance of semi-supervised clustering algorithms (Grira et al., 2008; Vu et al., 2012; Masud et al., 2019; Abin and Vu, 2020). The pairwise constraints can be generated by directly using part of the known data labels (Lai et al., 2021) or by using an active learning method (Masud et al., 2019). In practical, most gene expression data are unlabeled, for which it is impossible to obtain pairwise constraints based on labels. Vu et al. (2012) indicated that the generation of the pairwise constraints should mainly focus on the data samples on the cluster boundaries, which are more likely to be misclassified. To this end, Basu et al. (2004) developed a farthest-first traversal scheme-based active learning method to obtain pairwise constraints. However, this method has been reported to be sensitive to noise (Davidson and Qi, 2008). Grira et al. (2008) proposed an active learning method to generate pairwise constraints by determining cluster boundary data using membership obtained by fuzzy clustering. Vu et al. (2012) identified data in sparse regions based on k-nearest neighbor graphs and constructed pairwise constraints. However, it was claimed that some pairwise constraints might not be generated by this method (Abin and Vu, 2020). Liu et al. (2018) proposed an entropy-based query strategy to select the most uncertain pairwise constraints. Abin (2018) proposed a random walk approach on the adjacency graph of data for querying informative constraints. Masud et al. (2019) used local density estimation to identify the most informative objects as pairwise constraints. Abin and Vu (2020) proposed a density tracking method which takes into account the density relationship between data, and uses the information about boundaries and skeleton of clusters to generate the pairwise constraints.
Although the above methods can automatically mine and learn the pairwise constraints of unlabeled datasets through different approaches, there are inevitably noisy constraints, i.e., constraints inconsistent with the ground-truth clusters, in the obtained pairwise constraints (Yin et al., 2010; Lai et al., 2021). However, the existing semi-supervised clustering algorithms are mostly based on the assumption that pairwise constraints conform to real cluster information, and usually susceptible to noisy constraints. Therefore, it is necessary to implement constraints selection, where noisy constraints are filtered out, and only pairwise constraints that are beneficial for semi-supervised clustering are retained. In addition, most of the pairwise-constraints-based semi-supervised clustering algorithms were developed for single-source constraints, i.e., the pairwise constraints are obtained only from the data itself. In real-world applications, many data also possess related domain information. For example, Gene Ontology (GO) (Ashburner et al., 2000), which describes gene products in terms of their associated biological processes, cellular components and molecular functions, can further provide gene annotation information for gene expression data. In this paper, the multi-source constraints are the pairwise constraints formed by the data itself and domain information. Apparently, compared with the single-source pairwise constraints based solely on gene expression data, the multi-source constraints formed by the fusion of gene ontology can provide more comprehensive information about the structure of gene clusters and help to guide semi-supervised clustering to obtain more accurate clustering results.
Aiming at the unlabeled gene expression data and from the perspective of reducing the negative impact of noisy constraints and integrating multi-source constraints, a method called multi-objective semi-supervised clustering algorithm based on constraints selection and multi-source constraints (MSC-CSMC) is proposed in this research. At first, the proposed algorithm uses gene expression data and GO information to generate multi-source pairwise constraints. Then, under the multi-objective optimization framework of Non-dominated Sorting Genetic Algorithm-II (NSGA-II), the constraints selection and the cluster prototypes are collaboratively optimized to realize the selection of pairwise constraints suitable for clustering with respect to the multi-source constraints and to improve the accuracy of semi-supervised clustering of gene expression data by reducing the negative impact of noisy constraints.
2 Methods
In this section, the details of our proposed MSC-CSMC algorithm are described. Our proposed method consists of two parts. Firstly, multi-source pairwise constraints are generated by integrating gene expression and gene ontology (GO) information. Then, by using the improved penalty weights as well as mixed chromosome encoding strategy of cluster prototype and constraints selection, multi-objective semi-supervised clustering based on constraints selection and multi-source constraints is performed to identify co-expressed gene groups. The workflow of MSC-CSMC is shown in Figure 1.
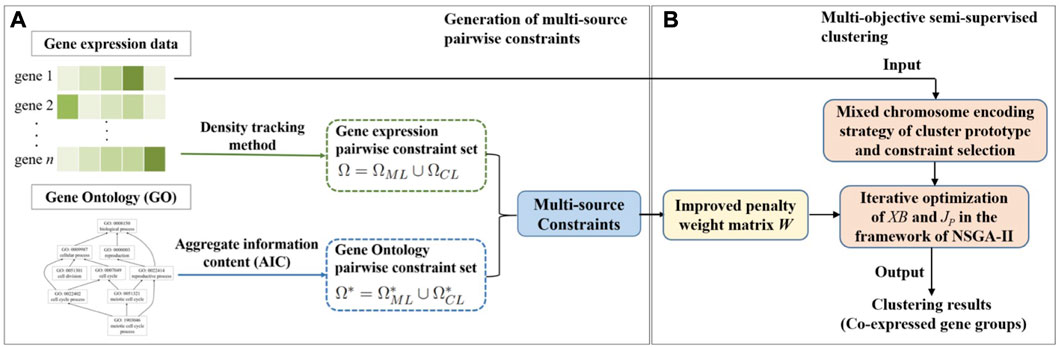
FIGURE 1. Workflow of MSC-CSMC. (A) Generation of multi-source pairwise constraints. (B) Multi-objective semi-supervised clustering.
2.1 Generation of multi-source pairwise constraints
Gene expression data and gene ontology (GO) describe gene-related information from the abundance of mRNA of genes and gene annotation. Compared with the method only using gene expression data, the combination of these two aspects of information can help to further improve the clustering accuracy of gene expression data (Giri and Saha, 2020; Li et al., 2022). In this paper, we use gene expression data and gene ontology information to generate multi-source pairwise constraints for semi-supervised clustering.
In view of the superior performance of the density tracking method (Abin and Vu, 2020), we use this method to generate the initial gene expression constraint set. The method consists of three steps: density estimation, density following, and constraints generation. Let
where Nb(xi) is the set of b nearest genes of gene xi;
with |Groups| being the total number of groups, S = {xi ∪ Nb(xi)}, Group(xj) being the group index of xj,
According to the density, impurity, density chain, and density group of the data, the density tracking method proposes three assumptions for mining informative pairwise constraints. Let Ω denote the pairwise constraint set, whose elements satisfy the following key assumptions: (1) providing feasible information about the boundary data of clusters; (2) providing feasible information about the boundary between various clusters; (3) providing feasible information about the skeleton of clusters. Among them, assumptions (1) and (3) are used to generate the must-link constraint set ΩML, assumption (2) is used to generate the cannot-link constraint set ΩCL. With the subsets ΩML and ΩCL, the penalization can be constructed for the cost function of the clustering. The workflow of density tracking method is given in Figure 2. The initial gene expression constraint set Ω = ΩML ∪ ΩCL is generated as follows.
1. For each gene xi, calculate its Density(xi) and Impurity(xi). Construct density chain Chains(xi) and density group Group(xi), get the centrality of density chain. Initialize ΩML = ∅, ΩCL = ∅;
2. Select gene xi in descending order of Impurity (xi), query the nearest neighbor gene xj that is not in its density group Group (xi), and add the pairwise constraint (xi, xj) into the cannot-link constraint set, i.e., ΩCL = ΩCL ∪ {(xi, xj)}.
3. Select gene xi in descending order of Impurity(xi), and find the next gene xj along its density chain Chains(xi). Let ɛ > 0 denote the density drop rate. If Density(xj) ≥ɛ× Density(xe), then add the pairwise constraint (xi, xj) to the must-link constraint set, i.e., ΩML = ΩML ∪ {(xi, xj)};
4. Select the density chain Chains(xi) in descending order of the centrality of the density chain, start from the starting gene xi, select the gene xj with an interval, and add the pairwise constraint (xi, xj) to the must-link constraint set, i.e., ΩML = ΩML ∪ {(xi, xj)}.

FIGURE 2. Workflow of density tracking method.
For a set of genes to be analyzed, each gene can be annotated with several GO terms. Thus, the functional similarity between genes can be deduced based on the term similarity. In the proposed MSC-CSMC algorithm, we adopt the aggregate information content (AIC) (Song et al., 2014) to measure the semantic similarity of GO terms t1 and t2:
with
Here, Tt is the set of ancestors of term t in the GO graph, p(t) is the frequency of the term appearing in the GO database, IC(t) = − log p(t) is the information content of term t. The higher the annotation frequency, the more general the information contained and the smaller the corresponding IC value. SW(t) normalizes the knowledge reflected by 1/IC(t), describing the semantic weight of term t. Consequently, the functional similarity of genes xi and xj can be obtained as follows:
where
is the similarity of gene xi and term t2. ann(xi) and ann(xj) represent the sets of GO terms that annotate the two genes, respectively. The cardinalities of ann(xi) and ann(xj) are denoted by |ann(xi)| and |ann(xj)|, respectively.
The gene function similarity obtained through GO can also reflect the pairwise constraint relationship between genes to a certain extent. In the proposed MSC-CSMC algorithm, gene pairs with a similarity of more than 0.9 constitute the GO must-link constraint set
2.2 Semi-supervised clustering objective functions based on multi-source constraints
At present, multi-objective optimization has gradually become a mainstream method for solving gene expression data clustering problems, which can achieve better clustering results on gene expression data compared with single-objective optimization methods. In the unsupervised multi-objective clustering problem of gene expression data, the cluster validity indices JFCM (Bezdek et al., 1981) and XB (Xie and Beni, 1991), which measure the intra-cluster compactness and inter-cluster separation respectively, are commonly used as objective functions to realize the evolution of decision variables based on two conflicting objectives (Bandyopadhyay et al., 2007; Maulik et al., 2009; Mukhopadhyay et al., 2013; Li et al., 2022). In this paper, the proposed MSC-CSMC algorithm uses XB and the function based on quadratic-regularized fuzzy c-means with constraint violation penalty, namely, JP (Mei, 2019), as the objective functions. Furthermore, the constraint violation penalty weights in JP are improved to achieve semi-supervised clustering of gene expression data based on the multi-source constraints in the NSGA-II framework. The objective functions of XB and JP are as follows:
Here,
is the cth cluster prototype. k is the number of clusters, parameters η and β control the level of fuzziness and the contribution of the penalty term during clustering, respectively. uic is the membership degree of the datum xi belonging to the cth cluster, obtained by
where wij ∈ W is the penalty weight for violating pairwise constraint
with θ > 0 being the GO action parameter. It can be seen that the improved penalty weights can effectively integrate the gene expression and Gene Ontology information, and provide reasonable violation penalty for pairwise constraints in semi-supervised clustering.
2.3 Mixed chromosome encoding strategy used in MSC-CSMC
For the purpose of co-optimizing the constraints selection and clustering in the process of multi-objective evolution, a mixed encoding strategy combining the constraints selection and cluster prototype is adopted, as shown in Figure 3. Let P denote the genetic population, N be the population size, and s be the number of pairwise constraints to be selected. Considering the existence of noisy constraints in the initial pairwise constraint set and to improve the search efficiency of the algorithm, 2s constraints are randomly selected from the initial pairwise constraint set to generate the candidate constraint set Ωp, and a serial number is assigned for each pairwise constraint. For a gene expression dataset with k clusters
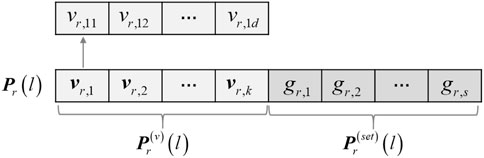
FIGURE 3. The mixed chromosome encoding strategy used in MSC-CSMC.
In the proposed algorithm, the two parts of the chromosomes are initialized separately. For the cluster prototype part, in order to ensure initialization quality and population diversity, half of the individuals are encoded as the k cluster prototypes obtained by the density peak method (Rodriguez and Laio, 2014), and the other half are encoded from the randomly generated cluster prototypes. For the constraints selection part of each individual, the components are initialized with non-repeated random integers in
2.4 Genetic operations
In the genetic evolution process of the MSC-CSMC algorithm, the roulette wheel strategy is first used to implement the selection. Since the NSGA-II algorithm tends to select individuals with lower non-domination ranks, for the rth individual
Here,
For the parent individuals
where
If repeated pairwise constraints appear after crossover, non-repeated pairwise constraints are randomly selected from the candidate constraint set Ωp as a replacement. For individual Pr(l), different mutation operators are adopted for the two parts. The polynomial mutation operator (Rousseeuw, 1987) is applied for
where, vu and vl are the upper and lower bounds of the cluster prototype, respectively. For normalized gene expression data, the bounds are set to 1 and 0. δ is determined as follows (Deb and Tiwari, 2008):
Here, ηm is the distribution index, randm is a random number in
Input: Gene expression dataset X, number of neighbors b, density drop rate ɛ, population size N, maximal number of generations Lmax, number of clusters k, fuzzy parameter η, penalty parameter β, constraint number s, GO action parameter θ, selection parameter α, crossover probability pc, mutation probability pm, and distribution index ηm.
Step 1: Generate gene expression pairwise constraint sets Ω based on density tracking method.
Step 2: Calculate the functional similarity of genes based on AIC, and generate the gene ontology pairwise constraint set Ω*. Then delete the contradictory constraints, and determine the penalty weight matrix W corresponding to the multi-source constraints based on Formula 10.
Step 3: Randomly select 2s pairwise constraints from the initial constraint set to construct the candidate constraint set Ωp, and initialize the population.
Step 4: When the genetic generation index is
Step 5: According to the individual fitness values, calculate the non-domination rank and crowding distance of each individual.
Step 6: Apply selection, crossover, and mutation based on Formulas 11-17, and update the individual fitness values according to Formulas 5-6.
Step 7: Merge the parent and offspring populations, and select the next-generation according to the elite retention strategy.
Step 8: If
Step 9: Set l = l + 1, repeat Steps 4-8 until the maximal number of generations Lmax is reached.
Output: The Pareto optimal solutions.
3 Results
3.1 Datasets
In this study, five benchmark gene expression datasets, namely, Yeast Galactose Metabolism, Yeast Cell Cycle, Yeast Sporulation, Serum, and Arabidopsis are used for the experiment.
The Yeast Galactose Metabolism dataset (Ideker et al., 2001) is composed of 205 genes whose expression patterns reflect four functional categories. The gene expression profiles were measured with four replicate assays across 20 time points. The Yeast Cell Cycle dataset (Cho et al., 1998) contains the expression levels of 384 genes involved in yeast cell cycle regulation at 17 time points, and these data are related with five phases of cell cycle. The Yeast sporulation dataset (Chu et al., 1998) contains the expression levels of more than 6,000 genes measured during the sporulation process of budding yeast across seven time points. The genes that showed no significant changes in expression during the harvesting were excluded, and the resulting set consists of 474 genes. The Serum dataset (Iyer et al., 1999) contains the expression levels of 517 human genes. The dataset has 13 dimensions corresponding to 12 time points and 1 unsynchronized sample. The Arabidopsis dataset (Reymond et al., 2000) consists of 138 Arabidopsis Thaliana genes. Each gene has eight expression values that correspond to eight time points. The details of the datasets are shown in Table 1.

TABLE 1. Description of datasets.
3.2 Model evaluation criteria and parameter assignment
In order to evaluate the effectiveness of the model, the silhouette index (Rousseeuw, 1987) is chosen as the evaluation criterion for the clustering results. For gene xi, the silhouette width is calculated as follows:
Here, a(i) is the average distance from gene xi to other genes in the same cluster, b(i) is the minimum average distance between gene xi and genes in the other clusters. The silhouette index SI of dataset X is the mean value of the silhouette widths of all genes, with
According to (Mei, 2019) and (Abin and Vu, 2020), the parameters of MSC-CSMC are assigned as follows: ɛ = 0.8, b = 10, η = 0.001, β = 0.1, N = 100, Lmax = 300, α = 0.3, ηm = 5, pc = 0.8, pm = 0.1. The number of pairwise constraints s is chosen as 0, 5, 10, 15, 20, and 25. In gene expression data analysis, the determination of the number of clusters k is an open problem. Generally, there are two approaches to determine the value of k; one is to directly set it as the true number of clusters (Yu et al., 2018; Zhao et al., 2021; Li et al., 2022; Liu et al., 2022; Wu and Ma, 2022); The other approach is applicable to the case where the true number of clusters is unknown, in which the variation range of k is determined firstly, and the k corresponding to the optimal value of an index (Silhouette index, Dunn index, Davies–Bouldin index, etc.) can be chosen as the optimal number of clusters (Gao et al., 2019; Acharya et al., 2020; López-Cortés et al., 2020; Zhang et al., 2022). In this paper, we adopt the first approach, and the number of clusters k is selected according to Table 1. In order to analyze the impact of the GO action parameter θ, we set θ from 0.1 to 0.9 at intervals of 0.1 under the condition that the number of the pairwise constraints is 15. The results are shown in Figure 4. It can be seen that the value of SI barely changes as θ increases, which means that the algorithm is not very sensitive to the value of θ. For Yeast Galactose Metabolism, Yeast Cell Cycle, Yeast Sporulation, Serum, and Arabidopsis, the θ values are respectively set to 0.4, 0.7, 0.6, 0.5, and 0.4, which lead to the optimal clustering performances.
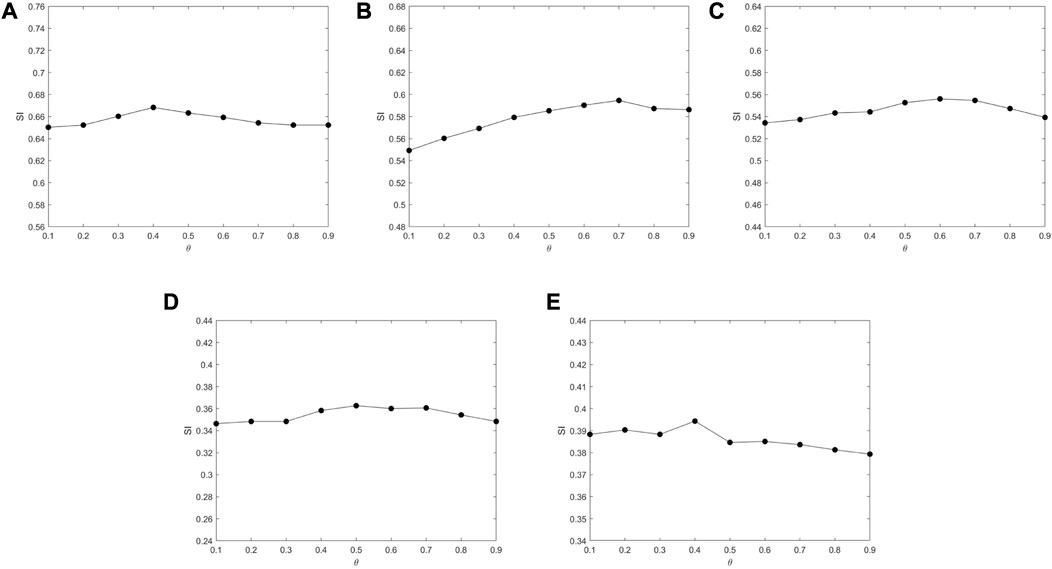
FIGURE 4. The impact of parameter θ on SI tested on different datasets. (A) Yeast Galactose Metabolism (B) Yeast Cell Cycle (C) Yeast Sporulation (D) Serum (E) Arabidopsis.
3.3 Result analysis and model comparison
For the purpose of inspecting the performance of the proposed MSC-CSMC algorithm, several advanced semi-supervised clustering algorithms based on single-source constraints, including COP-Kmeans (Wagstaff et al., 2001), PCKMeans (Basu et al., 2004), MPCKMeans (Bilenko et al., 2004), PCCA (Grira et al., 2008), PCFCMq (Mei, 2019) and MSC-CS (Zhao and Li, 2022), are used for comparison. Among them, the MSC-CS algorithm is the single-source constrained version of MSC-CSMC, which does not consider the annotation information provided by GO. In the above algorithms, the pairwise constraints are randomly selected from the initial gene expression constraint set Ω. To avoid the influence of randomness, each method is run for ten times under the same number of pairwise constraints, and the mean value of the clustering results is taken as the final result. The SI values of all seven algorithms applied to five datasets are shown in Tables 2–6, the optimal solutions in each row are highlighted in bold.
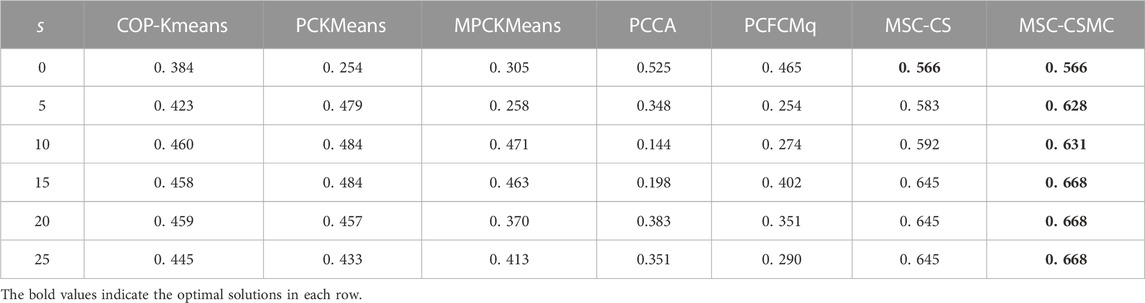
TABLE 2. SI values on Yeast Galactose Metabolism with different number of constraints.
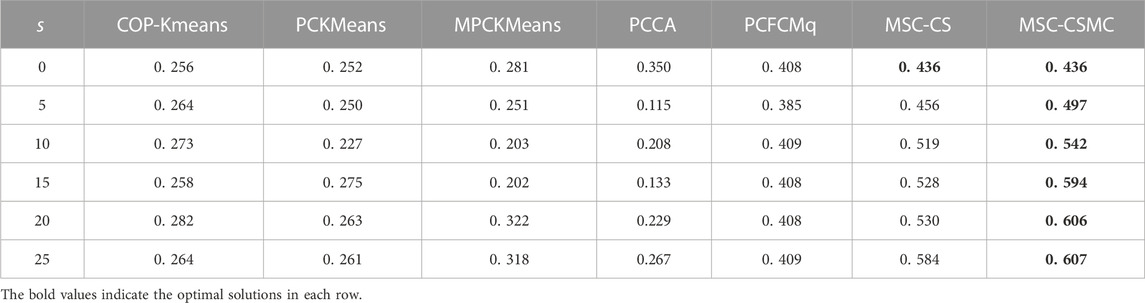
TABLE 3. SI values on Yeast Cell Cycle with different number of constraints.
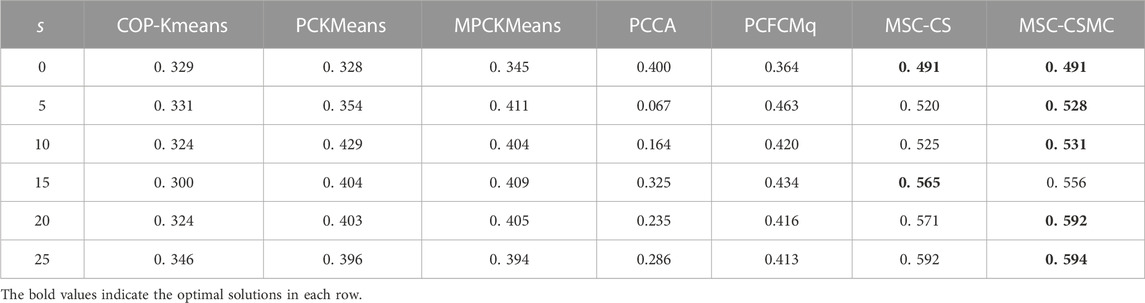
TABLE 4. SI values on Yeast Sporulation with different number of constraints.
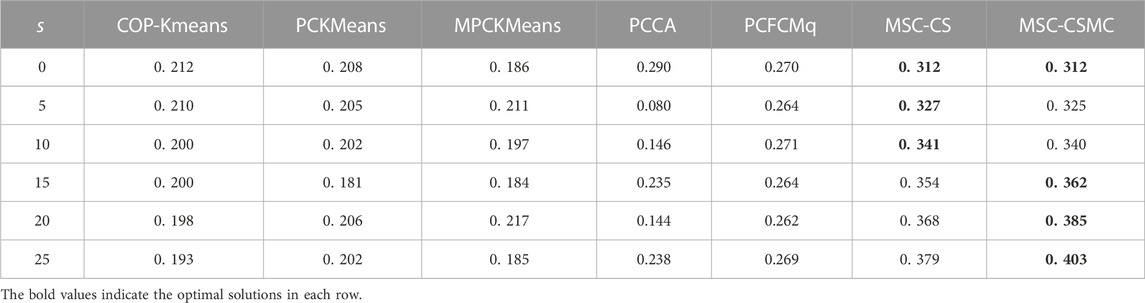
TABLE 5. SI values on Serum with different number of constraints.
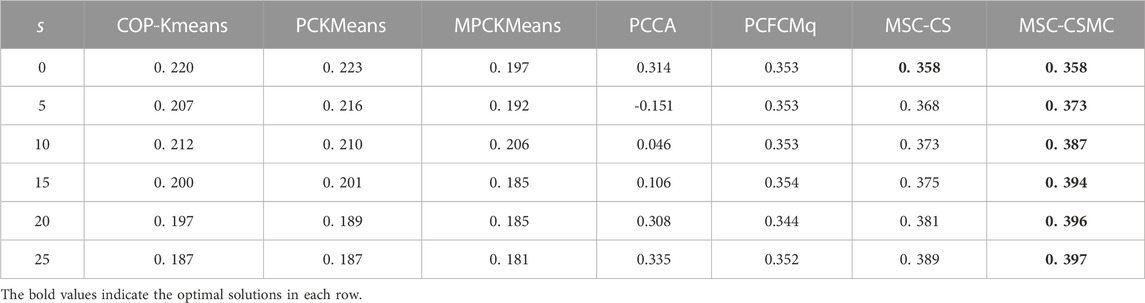
TABLE 6. SI values on Arabidopsis with different number of constraints.
According to Tables 2–6, it can be seen that the proposed MSC-CSMS algorithm and its single-source constraint version MSC-CS can always achieve optimal and suboptimal clustering results on five gene expression datasets, demonstrating the effectiveness of the constraints selection. The mixed chromosome encoding strategy combining the constraint selection and cluster prototype can find the pairwise constraints suitable for clustering in the co-evolution process and improve clustering accuracy, and the highly accurate clustering results can further improve the constraint selection ability of the algorithm in turn. Conversely, the algorithms for comparison are based on the assumption that the pairwise constraints conform to the real cluster information and are easily affected by noisy constraints. This is consistent with the analysis of the negative effects of noisy constraints by (Yin et al., 2010) and (Lai et al., 2021). In addition, the MSC-CSMC algorithm is better than MSC-CS in most cases, indicating that using multi-source constraints can improve the performance of semi-supervised clustering. The gene ontology used to generate multi-source pairwise constraints in our MSC-CSMC algorithm can explain gene expression profiles from the perspective of gene function. By effectively integrating the gene expression and Gene Ontology information, the proposed penalty weights can provide reasonable violation penalty for pairwise constraints.
In the case of s = 0, that is, there is no pairwise constraint, both MSC-CSMC and MSC-CS degenerate into unsupervised multi-objective clustering methods, turning out the same result. Compared with PCFCMq, which uses JP as the single objective function, the better performance of MSC-CSMC and MSC-CS shows the advantages of using multi-objective optimization in clustering gene expression data.
Among the comparison algorithms, the performance of the PCFCMq algorithm, which is based on fuzzy clustering, is generally better than the hard clustering-based COP-Kmeans, PCKMeans, and MPCKMeans algorithms. According to (Gasch and Eisen, 2002), genes may be co-expressed with different genomes under different measurement conditions, and there is usually overlap between gene clusters. Therefore, compared with hard clustering algorithms, fuzzy clustering algorithms are more suitable for analyzing gene expression data. Furthermore, due to the proposed constraints selection and multi-source constraint fusion strategy, the MSC-CSMC algorithm achieves better clustering results than the PCFCMq algorithm. In terms of the robustness of the clustering results, the performances of semi-supervised clustering algorithms for comparison fluctuate with the increase of pairwise constraints, which is mainly due to the quality of randomly selected pairwise constraints. As stated by Lai et al. (2021), even non-noisy constraints that conform to the real cluster information may have a negative impact on the clustering results, which further illustrates the necessity of constraints selection in semi-supervised clustering algorithms. The proposed MSC-CSMC algorithm can select pairwise constraints suitable for clustering based on the co-evolution of the cluster prototype and constraints selection, which guarantees both accuracy and stability of the clustering results.
To illustrate the consistency of the gene clusters obtained by the MSC-CSMC algorithm, the Eisen plots and cluster profile plots corresponding to the clustering results of five datasets are shown in Figure 5 and Figure 6. In the Eisen plots, each row corresponds to a gene, each column to a time point (sample), and each entry of the plot represents the expression level of a gene at a specific time point by coloring the corresponding cell. To illustrate more clearly the gene clusters obtained by MSC-CSMC, the genes partitioned into the same cluster are placed together. In the cluster profile plots, the X- and Y-axis represent the time points and gene expression values, respectively. The expression values of genes partitioned into the same cluster are plotted in the same subplot. In the subplots, each green line indicates the normalized expression values of a gene over all time points, and the black line represents the mean expression level of the genes in the corresponding cluster. It can be seen in the Eisen plots that the color patterns (expression levels) of genes in the same cluster are similar to each other, while genes in different clusters show different color patterns. According to Figure 6, the cluster profiles of different clusters are different from each other, and the cluster profiles within a cluster reveal consistency.
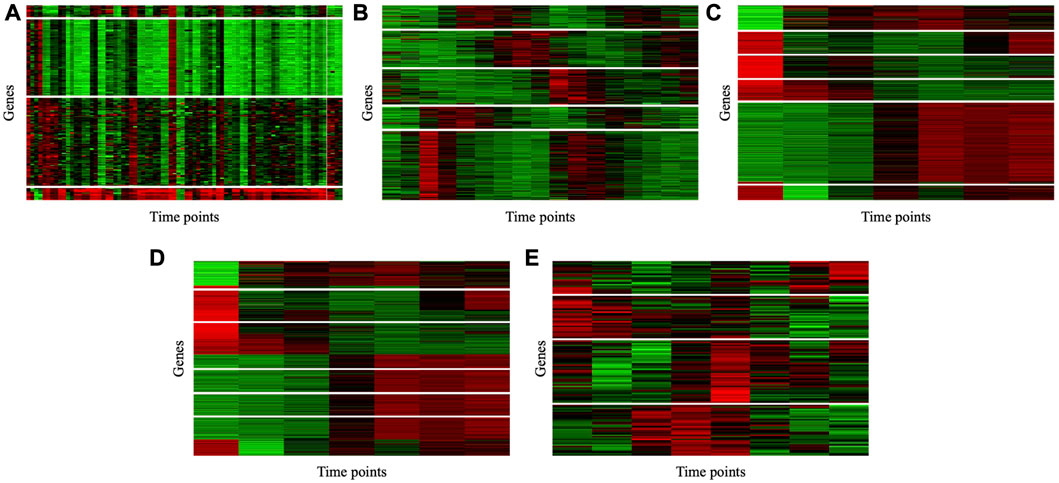
FIGURE 5. Eisen plots of the gene clusters obtianed by MSC-CSMC. (A) Yeast Galactose Metabolism with the number of constraints s =5 (B) Yeast Cell Cycle with the number of constraints s =10 (C) Yeast Sporulation with the number of constraints s =15 (D) Serum with the number of constraints s =20 (E) Arabidopsis with the number of constraints s =25.
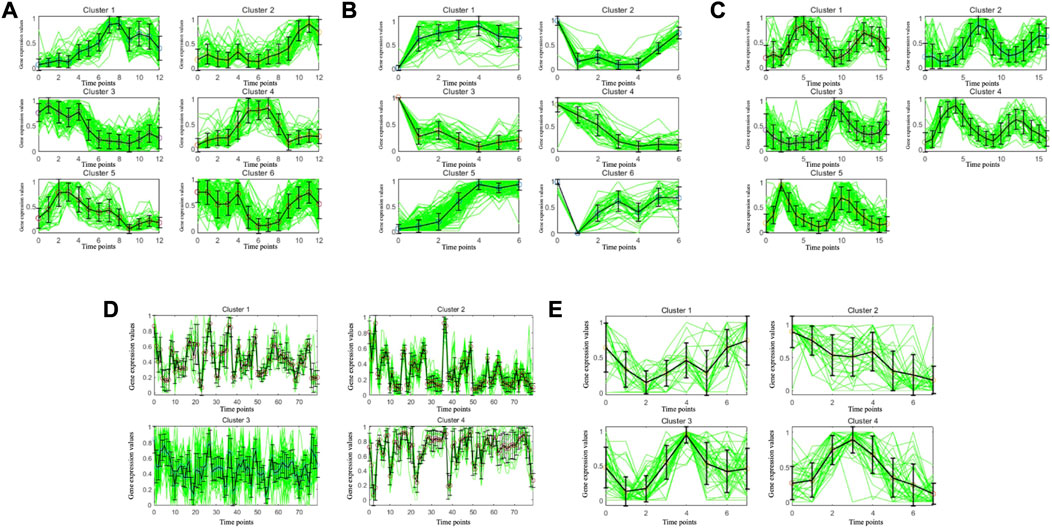
FIGURE 6. Cluster profile plots of the gene clusters obtianed by MSC-CSMC. (A) Yeast Galactose Metabolism with the number of constraints s =5 (B) Yeast Cell Cycle with the number of constraints s =10 (C) Yeast Sporulation with the number of constraints s =15 (D) Serum with the number of constraints s =20 (E) Arabidopsis with the number of constraints s =25.
In order to inspect the biological significance of the gene clusters obtained by the MSC-CSMC algorithm, enrichment analysis is carried out using the GO annotation database, which results in the significant GO terms shared by genes in each cluster and their corresponding p-values. Taking the case where the number of pairwise constraints in the Yeast Sporulation dataset is 15 as an example, we focus on the three most significant GO terms (corresponding to the three lowest p-values) in each of the six clusters obtained by each algorithm. Figure 7 shows the plot of the average p-values. To illustrate the difference significantly, the p-values are negative log-transformed and the clusters are sorted in descending order according to the transformed values. Table 7 reports the three most significant GO terms and the corresponding p-values in each cluster obtained by MSC-CSMC.
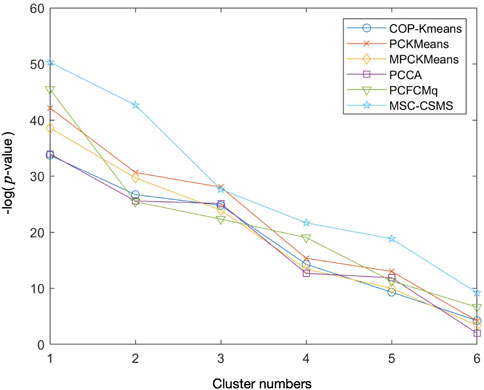
FIGURE 7. Average negative logarithmic p-values of the three most significant GO terms for each of the six clusters on Yeast Sporulation with the number of constraints s =15.
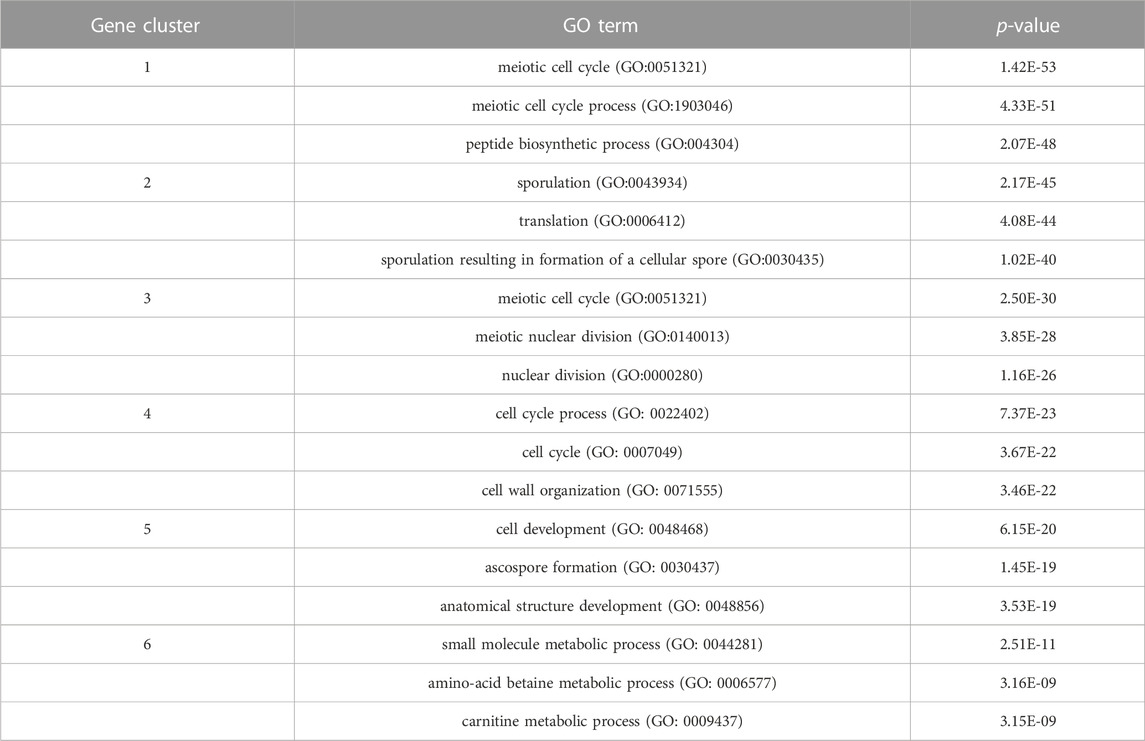
TABLE 7. The three most significant GO terms and the corresponding p-values for each of the six clusters obtained by MSC-CSMC on Yeast Sporulation.
From Figure 7, it can be seen that the curve corresponding to MSC-CSMC is higher than those of the other algorithms, indicating that MSC-CSMC gains the result with the highest biological significance. Moreover, all the p-values of the significant GO terms listed in Table 7 are far less than 0.01, indicating that the MSC-CSMC algorithm can identify biologically relevant gene clusters.
4 Conclusion
Aiming at the problem that current semi-supervised clustering methods based on pairwise constraints are easily affected by noisy constraints and do not take the fusion of multi-source constraints into account, in this paper, we propose a multi-objective semi-supervised clustering algorithm based on constraints selection and multi-source constraints (MSC-CSMC). The proposed algorithm uses gene expression data and GO information to generate multi-source pairwise constraints and applies the multi-source constraints to the semi-supervised clustering process through improved constraint violation penalty weights. On this basis, a collaborative multi-objective optimization framework for constraints selection and cluster prototypes is constructed, and the negative impact of the noisy constraints is reduced by selecting pairwise constraints suitable for clustering. Experimental results on multiple gene expression datasets show that the MSC-CSMC algorithm effectively improves the performance of semi-supervised clustering. The validity of the proposed method proposed is not limited to the cluster analysis of gene expression data. Other semi-supervised clustering studies with multi-source information or constrained selection requirements can also be enlightened.
The effectiveness of the algorithm in this paper has been verified in small and medium-sized gene expression datasets. With the increase in the data size, the augment in the number of decision variables in the process of multi-objective evolution will lead to a decrease in algorithm efficiency and optimization performance. Therefore, the next step is to use decision variable analysis and other methods to design a multi-objective evolution strategy of the algorithm so as to further improve the applicability of the algorithm in practical clustering problems. In addition, we will also try to use various evaluation indices and design a multi-objective optimization framework with variable coding length (Rodríguez-Méndez et al., 2019) to optimize the number of clusters for gene expression data.
Data availability statement
The original contributions presented in the study are included in the article, further inquiries can be directed to the corresponding authors.
Author contributions
DL proposed the idea. ZW and MZ did the experiment. ZW, JW, and DL summarized the results and finished the manuscript. All authors proofread the manuscript.
Conflict of interest
The authors declare that the research was conducted in the absence of any commercial or financial relationships that could be construed as a potential conflict of interest.
Publisher’s note
All claims expressed in this article are solely those of the authors and do not necessarily represent those of their affiliated organizations, or those of the publisher, the editors and the reviewers. Any product that may be evaluated in this article, or claim that may be made by its manufacturer, is not guaranteed or endorsed by the publisher.
References
Abin, A. A. (2018). A random walk approach to query informative constraints for clustering. IEEE Trans. Cybern. 48, 2272–2283. doi:10.1109/TCYB.2017.2731868
Abin, A. A., and Vu, V. (2020). A density-based approach for querying informative constraints for clustering. Expert Syst. Appl. 161, 113690. doi:10.1016/j.eswa.2020.113690
Acharya, S., Saha, S., and Pradhan, P. (2020). Multi-factored gene-gene proximity measures exploiting biological knowledge extracted from gene ontology: Application in gene clustering. IEEE/ACM Trans. Comput. Biol. Bioinforma. 17, 207–219. doi:10.1109/TCBB.2018.2849362
Ashburner, M., Ball, C. A., Blake, J. A., Botstein, D., Butler, H., Cherry, J. M., et al. (2000). Gene ontology: Tool for the unification of biology. The gene ontology consortium. Nat. Genet. 25, 25–29. doi:10.1038/75556
Bandyopadhyay, S., Mukhopadhyay, A., and Maulik, U. (2007). An improved algorithm for clustering gene expression data. Bioinformatics 23, 2859–2865. doi:10.1093/bioinformatics/btm418
Basu, S., Banerjee, A., and Mooney, R. J. (2004). “Active semi-supervision for pairwise constrained clustering,” in Proceedings of the 2004 SIAM International Conference on Data Mining (Philadelphia, Pennsylvania: SIAM), 333–344. doi:10.1137/1.9781611972740.31
Bezdek, J. C., Coray, C., Gunderson, R., and Watson, J. (1981). Detection and characterization of cluster substructure i. linear structure: Fuzzy c-lines. SIAM J. Appl. Math. 40, 339–357. doi:10.1137/0140029
Bilenko, M., Basu, S., and Mooney, R. J. (2004). “Integrating constraints and metric learning in semi-supervised clustering,” in Proceedings of the Twenty-First International Conference on Machine Learning (New York, NY, USA: Association for Computing Machinery), 11. doi:10.1145/1015330.1015360
Chen, X., Huang, J. Z., Wu, Q., and Yang, M. (2019). Subspace weighting co-clustering of gene expression data. IEEE/ACM Trans. Comput. Biol. Bioinforma. 16, 352–364. doi:10.1109/TCBB.2017.2705686
Cho, R. J., Campbell, M. J., Winzeler, E. A., Steinmetz, L., Conway, A., Wodicka, L., et al. (1998). A genome-wide transcriptional analysis of the mitotic cell cycle. Mol. Cell 2, 65–73. doi:10.1016/s1097-2765(00)80114-8
Chu, S., DeRisi, J., Eisen, M., Mulholland, J., Botstein, D., Brown, P. O., et al. (1998). The transcriptional program of sporulation in budding yeast. Science 282, 699–705. doi:10.1126/science.282.5389.699
Davidson, I., and Qi, Z. (2008). “Finding alternative clusterings using constraints,” in 2008 Eighth IEEE International Conference on Data Mining (Pisa, Italy: IEEE), 773–778. doi:10.1109/ICDM.2008.141
Deb, K., and Tiwari, S. (2008). Omni-optimizer: A generic evolutionary algorithm for single and multi-objective optimization. Eur. J. Operational Res. 185, 1062–1087. doi:10.1016/j.ejor.2006.06.042
Gao, Y., Zhou, X., and Zhang, W. (2019). An ensemble strategy to predict prognosis in ovarian cancer based on gene modules. Front. Genet. 10, 366. doi:10.3389/fgene.2019.00366
Gasch, A. P., and Eisen, M. B. (2002). Exploring the conditional coregulation of yeast gene expression through fuzzy k-means clustering. Genome Biol. 3, RESEARCH0059–22. doi:10.1186/gb-2002-3-11-research0059
Giri, S. J., and Saha, S. (2020). “Multi-view gene clustering using gene ontology and expression-based similarities,” in 2020 IEEE Congress on Evolutionary Computation (CEC) (Glasgow, UK: IEEE), 1–8. doi:10.1109/CEC48606.2020.9185885
Grira, N., Crucianu, M., and Boujemaa, N. (2008). Active semi-supervised fuzzy clustering. Pattern Recognit. 41, 1834–1844. doi:10.1016/j.patcog.2007.10.004
Ideker, T., Thorsson, V., Ranish, J. A., Christmas, R., Buhler, J., Eng, J. K., et al. (2001). Integrated genomic and proteomic analyses of a systematically perturbed metabolic network. Science 292, 929–934. doi:10.1126/science.292.5518.929
Iyer, V. R., Eisen, M. B., Ross, D. T., Schuler, G., Moore, T., Lee, J. C., et al. (1999). The transcriptional program in the response of human fibroblasts to serum. Science 283, 83–87. doi:10.1126/science.283.5398.83
Lai, Y., He, S., Lin, Z., Yang, F., Zhou, Q., and Zhou, X. (2021). An adaptive robust semi-supervised clustering framework using weighted consensus of random k k-means ensemble. IEEE Trans. Knowl. Data Eng. 33, 1877–1890.
Li, D., Gu, H., Chang, Q., Wang, J., and Qin, P. (2022). A joint optimization framework integrated with biological knowledge for clustering incomplete gene expression data. Soft Comput. 2022, 1–18. doi:10.1007/s00500-022-07180-y
Liu, Y., Li, H., Xu, Y., Liu, Y., Peng, X., and Wang, J. (2022). Isocell: An approach to enhance single cell clustering by integrating isoform-level expression through orthogonal projection. IEEE/ACM Trans. Comput. Biol. Bioinforma. 20, 1–475. doi:10.1109/TCBB.2022.3147193
Liu, Y., Liu, K., Zhang, C., Wang, X., Wang, S., and Xiao, Z. (2018). Entropy-based active sparse subspace clustering. Multimedia Tools Appl. 77, 22281–22297. doi:10.1007/s11042-018-5945-1
López-Cortés, X. A., Matamala, F., Maldonado, C., Mora-Poblete, F., and Scapim, C. A. (2020). A deep learning approach to population structure inference in inbred lines of maize. Front. Genet. 11, 543459. doi:10.3389/fgene.2020.543459
Masud, M. A., Huang, J. Z., Zhong, M., and Fu, X. (2019). Generate pairwise constraints from unlabeled data for semi-supervised clustering. Data and Knowl. Eng. 123, 101715. doi:10.1016/j.datak.2019.101715
Maulik, U., Mukhopadhyay, A., and Bandyopadhyay, S. (2009). Combining pareto-optimal clusters using supervised learning for identifying co-expressed genes. BMC Bioinforma. 10, 27–16. doi:10.1186/1471-2105-10-27
Mei, J. (2019). Semisupervised fuzzy clustering with partition information of subsets. IEEE Trans. Fuzzy Syst. 27, 1726–1737. doi:10.1109/tfuzz.2018.2889010
Mukhopadhyay, A., Maulik, U., and Bandyopadhyay, S. (2013). An interactive approach to multiobjective clustering of gene expression patterns. IEEE Trans. Biomed. Eng. 60, 35–41. doi:10.1109/TBME.2012.2220765
Pirooznia, M., Yang, J. Y., Yang, M. Q., and Deng, Y. (2008). A comparative study of different machine learning methods on microarray gene expression data. BMC Genomics 9, S13–S13. doi:10.1186/1471-2164-9-S1-S13
Reymond, P., Weber, H., Damond, M., and Farmer, E. E. (2000). Differential gene expression in response to mechanical wounding and insect feeding in arabidopsis. Plant Cell 12, 707–720. doi:10.1105/tpc.12.5.707
Rodriguez, A., and Laio, A. (2014). Machine learning. Clustering by fast search and find of density peaks. Science 344, 1492–1496. doi:10.1126/science.1242072
Rodríguez-Méndez, I. A., Ureña, R., and Herrera-Viedma, E. (2019). Fuzzy clustering approach for brain tumor tissue segmentation in magnetic resonance images. Soft Comput. 23, 10105–10117. doi:10.1007/s00500-018-3565-3
Rousseeuw, P. J. (1987). Silhouettes: A graphical aid to the interpretation and validation of cluster analysis. J. Comput. Appl. Math. 20, 53–65. doi:10.1016/0377-0427(87)90125-7
Saha, S., and Bandyopadhyay, S. (2013). A generalized automatic clustering algorithm in a multiobjective framework. Appl. Soft Comput. 13, 89–108. doi:10.1016/j.asoc.2012.08.005
Song, X., Li, L., Srimani, P. K., Philip, S. Y., and Wang, J. Z. (2014). Measure the semantic similarity of go terms using aggregate information content. IEEE/ACM Trans. Comput. Biol. Bioinforma. 11, 468–476. doi:10.1109/TCBB.2013.176
Vu, V., Labroche, N., and Bouchon-Meunier, B. (2012). Improving constrained clustering with active query selection. Pattern Recognit. 45, 1749–1758. doi:10.1016/j.patcog.2011.10.016
Wagstaff, K., Cardie, C., Rogers, S., and Schrödl, S. (2001). “Constrained k-means clustering with background knowledge,” in Proceedings of the Eighteenth International Conference on Machine Learning (Burlington, MA, USA: Morgan Kaufmann Publishers Inc.), 577–584. doi:10.5555/645530.655669
Wu, W., and Ma, X. (2022). Network-based structural learning nonnegative matrix factorization algorithm for clustering of scrna-seq data. IEEE/ACM Trans. Comput. Biol. Bioinforma. 20, 1–575. doi:10.1109/TCBB.2022.3161131
Xie, X. L., and Beni, G. (1991). A validity measure for fuzzy clustering. IEEE Trans. Pattern Analysis Mach. Intell. 13, 841–847. doi:10.1109/34.85677
Yin, X., Chen, S., Hu, E., and Zhang, D. (2010). Semi-supervised clustering with metric learning: An adaptive kernel method. Pattern Recognit. 43, 1320–1333. doi:10.1016/j.patcog.2009.11.005
Yu, Z., Luo, P., Liu, J., Wong, H., You, J., Han, G., et al. (2018). Semi-supervised ensemble clustering based on selected constraint projection. IEEE Trans. Knowl. Data Eng. 30, 2394–2407. doi:10.1109/tkde.2018.2818729
Zhang, G., Peng, Z., Yan, C., Wang, J., Luo, J., and Luo, H. (2022). Multigatae: A novel cancer subtype identification method based on multi-omics and attention mechanism. Front. Genet. 13, 855629. doi:10.3389/fgene.2022.855629
Zhang, M., Luo, W. J., and Wang, X. F. (2009). A normal distribution crossover for epsilon-moea. J. Softw. 20, 305–314. doi:10.3724/sp.j.1001.2009.00305
Zhao, M., and Li, D. (2022). “Multi-objective semi-supervised clustering algorithm based on constraint set optimization for gene expression data,” in 2022 41st Chinese Control Conference (CCC) (Hefei, China: IEEE), 6570–6575. doi:10.23919/CCC55666.2022.9902131
Zhao, Y., Fang, Z., Lin, C., Deng, C., Xu, Y., and Li, H. (2021). Rfcell: A gene selection approach for scrna-seq clustering based on permutation and random forest. Front. Genet. 27, 665843. doi:10.3389/fgene.2021.665843
Keywords: semi-supervised clustering, constraint selection, multi-source constraints, gene expression data, multi-objective optimization
Citation: Wang Z, Gu H, Zhao M, Li D and Wang J (2023) MSC-CSMC: A multi-objective semi-supervised clustering algorithm based on constraints selection and multi-source constraints for gene expression data. Front. Genet. 14:1135260. doi: 10.3389/fgene.2023.1135260
Received: 31 December 2022; Accepted: 16 February 2023;
Published: 27 February 2023.
Edited by:
Suyan Tian, Jilin University, ChinaReviewed by:
Guojun Liu, Xi’an University of Finance and Economics, ChinaChangjing Zhuge, Beijing University of Technology, China
Copyright © 2023 Wang, Gu, Zhao, Li and Wang. This is an open-access article distributed under the terms of the Creative Commons Attribution License (CC BY). The use, distribution or reproduction in other forums is permitted, provided the original author(s) and the copyright owner(s) are credited and that the original publication in this journal is cited, in accordance with accepted academic practice. No use, distribution or reproduction is permitted which does not comply with these terms.
*Correspondence: Dan Li, bGRhbkBkbHV0LmVkdS5jbg==; Jia Wang, d2FuZ2ppYTc3QGhvdG1haWwuY29t