 Yuanhua Nie1
 Longwen Xu1
 Zilong Bai1
 Yaoyao Liu2
 Shilong Wang1Qingnuo Zeng1
 Xuan Gao3,4
 Xuefeng Xia2Dongmin Chang1*
- 1Department of Surgical Oncology, The First Affiliated Hospital of Xi’an Jiaotong University, Xi’an, Shaanxi, China
- 2Geneplus-Beijing, Co., Ltd., Beijing, China
- 3State Key Laboratory of Microbial Resources, Institute of Microbiology, Chinese Academy of Sciences, Beijing, China
- 4GenePlus- Shenzhen Clinical Laboratory, Shenzhen, China
Background: Pancreatic cancer (PC) is a deadly disease. The tumor microenvironment (TME) participates in PC oncogenesis. This study focuses on the assessment of the prognostic and treatment utility of TME-associated genes in PC.
Methods: After obtaining the differentially expressed TME-related genes, univariate and multivariate Cox analyses and least absolute shrinkage and selection operator (LASSO) were performed to identify genes related to prognosis, and a risk model was established to evaluate risk scores, based on The Cancer Genome Atlas (TCGA) data set, and it was validated by external data sets from the Gene Expression Omnibus (GEO) and Clinical Proteomic Tumor Analysis Consortium (CPTAC). Multiomics analyses were adopted to explore the potential mechanisms, discover novel treatment targets, and assess the sensitivities of immunotherapy and chemotherapy.
Results: Five TME-associated genes, namely, FERMT1, CARD9, IL20RB, MET, and MMP3, were identified and a risk score formula constructed. Next, their mRNA expressions were verified in cancer and normal pancreatic cells. Multiple algorithms confirmed that the risk model displayed a reliable ability of prognosis prediction and was an independent prognostic factor, indicating that high-risk patients had poor outcomes. Immunocyte infiltration, gene set enrichment analysis (GSEA), and single-cell analysis all showed a strong relationship between immune mechanism and low-risk samples. The risk score could predict the sensitivity of immunotherapy and some chemotherapy regimens, which included oxaliplatin and irinotecan. Various latent treatment targets (LAG3, TIGIT, and ARID1A) were addressed by mutation landscape based on the risk model.
Conclusion: The risk model based on TME-related genes can reflect the prognosis of PC patients and functions as a novel set of biomarkers for PC therapy.
Introduction
Pancreatic cancer (PC) is one of the most common and lethal cancers worldwide (Kaźmierczak-Siedlecka et al., 2020). In developed countries, PC is the fourth leading cause of cancer-related deaths, and it is ranked the seventh around the world (Ducreux et al., 2015). Sadly, the incidence rate of PC is gradually accelerating, and it will rank as the second leading cause of cancer-related mortalities in 2030 (Hasan et al., 2019). The treatments for early stage PC are surgery and chemotherapy. The treatments for advanced PC are chemotherapy and radiotherapy (Ducreux et al., 2015). The most used and acknowledged chemotherapy regimens for all stages of PC constitute cytotoxic drugs, such as, FOLFIRINOX and gemcitabine plus nab-paclitaxel (Conroy et al., 2011; Von Hoff et al., 2013). Disappointedly, patients are often resistant to these treatments and tend to have a poor prognosis (Jiang et al., 2023). For the minority of early stage patients with local disease, the 5-year survival rate can reach 36%, and the rate decreases to 12% in patients with lymph-node metastasis. Most patients who suffer from distant spread have the lowest 5-year survival, with 3% (Poruk et al., 2013; Bray et al., 2018). Therefore, it is necessary to find a novel and potent method to perform risk assessment to recognize high-risk patients in the early stage and provide them with proper treatment to avoid cancer progression.
The tumor microenvironment (TME) is an immunosuppressive niche that is formed in the process of tumor cells hijacking the transcriptional mechanisms of the stroma cells (Kleeff et al., 2016). The main components of the TME are cancer-associated fibroblasts (CAFs), extracellular matrix (ECM), endothelial cells, stroma-associated pancreatic stellate cells (PSCs), adipose cells, neural cells, and some immune cells, such as myeloid-derived suppressor cells (MDSCs), tumor-associated macrophages (TAMs), and regulatory T cells (Tregs) (Feig et al., 2012; Wolfgang et al., 2013). PC is notorious for its dense TME, which is enriched with the stroma, MDSCs, TAMs, CAFs, and many other cells (Farrow et al., 2008). As immunosuppressive TME characteristics, MDSCs block immune responses and release interleukin-10 (IL-10) and transforming growth factor-β (TGF-β) to induce an anti-inflammatory environment in PC (Huang et al., 2006; Sinha et al., 2007; Ostrand-Rosenberg et al., 2012; Pinton et al., 2016). CAFs fulfill the bi-function in PC, which is mostly anti-immune and partial immunosuppression (Belle and DeNardo, 2019; Elyada et al., 2019; Das et al., 2020). By promoting the epithelial–mesenchymal transformation (EMT), interacting with cancer stem cells (CSCs), inducing the apoptosis of T cells, and breaking local immune surveillance, the TAMs boost PC, lead to resistance of treatment, and result in poor prognosis (Zhang et al., 2022). Treg cells eliminate effector T cells or acquire antigen-presenting cells which compete with effector T cells against immunology (Jang et al., 2017). However, there are still some immune cells that play anti-tumor roles and offer promising prospects for survival in PC. Tertiary lymphoid structures, organized by tumor-infiltrating lymphocytes (TILs), which are often observed in cancer tissue, are considered to participate in the immune response to suppress cancer and positively impact prognosis (Balch et al., 1990; Zhang et al., 2003; Hiraoka et al., 2015). Infiltration of CD8+ lymphocytes was an independent factor for longer disease-free survival (DFS) and overall survival (OS) in PC (Lohneis et al., 2017). The roles of the TME are complex: some can be used to foresee the prognosis, while some are indexes for the sensitivity of immunotherapy of PC (Nomi et al., 2007; Samstein et al., 2019). However, there are no immune markers that can solve well all the problems at one times. Therefore, we established a TME-related risk model to predict survival and to test drug sensitivity in PC.
In this study, the expression patterns of TME-related genes in PC were comprehensively revealed, and we established a new but robust risk model to predict the prognosis, identify therapy targets, and foresee the treatment sensitivity of PC patients.
Materials and methods
Gene expression and clinical data resources and processing
The workflow of our research is presented in Figure 1. To build and evaluate the risk model, PC data sets containing complete information of genome, prognosis, and clinical characteristics were included in this study. The FPKM-processed RNA sequencing data and clinical information of pancreatic adenocarcinoma (PAAD) patients were downloaded from The Cancer Genome Atlas (TCGA, https://tcga-data.nci.nih.gov/tcga/). The RMA-normalized data and clinical data of the PC cohort GSE57495 were obtained from the Gene Expression Omnibus (GEO, https://www.ncbi.nlm.nih.gov/geo/). The RSEM-standardized data from the Clinical Proteomic Tumor Analysis Consortium (CPTAC) were retrieved from the cBioPortal database (https://www.cbioportal.org/). After converting ensemble IDs, deleting the data that lacked survival features, and log2 transforming RNA sequencing, the data were corrected using the combat method (Johnson et al., 2007). The clinical information of TCGA-PAAD, GEO57495, and CPTAC is provided in Supplementary Table S1. The data of single-cell RNA sequencing were retrieved from the cohort GSE141017 via the GEO database. The TCGA-PAAD, GSE57495, CPTAC, and GSE141017 cohorts contained 181 (177 tumor and 4 normal) samples, 63 tumor samples, 135 tumor samples, and 1 tumor sample, respectively.
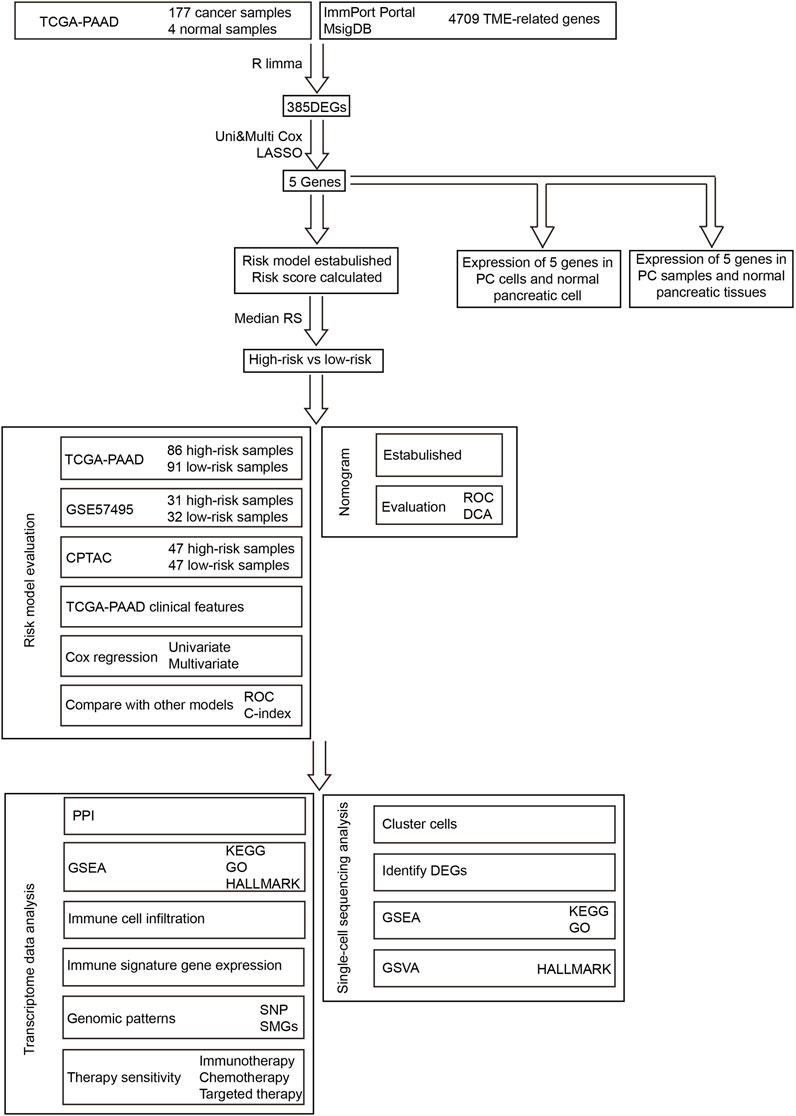
FIGURE 1. Workflow of this research.
To evaluate the mRNA expression of five genes in PC and normal pancreatic tissues, data sets containing the mRNA expression of the required genes in normal and cancer tissues were included. We downloaded the RMA-normalized gene expression data of cohorts GSE15471, GSE28735, and GSE62452 from the GEO database. GSE15471, GSE28735, and GSE62452 cohorts contain 78 (39 tumor and 39 normal) samples, 90 (45 tumor and 45 normal) samples, and 130 (65 tumor and 65 normal) samples, respectively. The landscape of data sets which were used in this study is summarized in Supplementary Table S1.
Identification of differential genes
In total, we collected 4,709 TME-related genes from the ImmPort Portal (https://www.immport.org/) and Molecular Signatures Database (MsigDB, http://www.gsea-msigdb.org/gsea/msigdb/index.jsp) (Supplementary Table S2). The criteria were set as |logFC| >1 and p < 0.05 for the expression of the differential genes which were selected by the R package “limma” in normal and cancer samples in TCGA-PAAD.
Establishment and validation of prognostic risk model
First, the TCGA-PAAD cohort was randomly assigned to train and test the data sets. A prognostic risk model was established based on the training set of the TCGA-PAAD cohort. Then, the univariate Cox regression analysis was used to identify the candidate TME-related genes that were closely correlated with the OS of PC patients, and 86 genes were selected for the next step (p < 0.05). To remove the overfit genes, the least absolute shrinkage and selection operator (LASSO) was fulfilled by the R package “glmnet” with a 20-fold cross-validation (Friedman et al., 2010). After LASSO, nine genes turned out to be more reliable nominees for building a prognostic risk model. Next, the Akaike information criterion (AIC) was calculated to assess potential genes. At last, the multivariate Cox regression with a bi-directional method was applied for choosing the best candidates for model construction which presents the minimum AIC. A prognostic risk score model based on the TME-related genes for PC patients was constructed, and the risk score was the sum of the mRNA expression of the gene multiplied by its multivariate Cox regression coefficient (Friedman et al., 2010; Wang et al., 2019). The risk score (RS) of each sample was calculated according to this formula. All samples from the TCGA-PAAD cohort were divided into high- and low-risk groups in accordance with the median value of RS of the TCGA-PAAD training set. Every external cohort was also split into two groups in terms of their median RS.
To evaluate the performance of the model, we used TCGA-PAAD as the internal validation and GSE57495 and CPTAC as the external validations by calculating the area under the curves (AUC) of the receiver operating characteristic (ROC) curve, analyzing the Kaplan–Meier curves (K-M curves), and assessing the Harrell’s concordance index (C-index). By analyzing the K-M curves in different clinical characteristics, TCGA-PAAD was employed in testing the adaptability of the model.
Establishment and evaluation of nomograms
In TCGA-PAAD, univariate and multivariate Cox regressions were used to select the independent prognostic factors. In light of these factors, we built the nomograms, which included age, sex, grade, distant metastasis, lymph node metastasis, and risk score. The ROC and decision curve analysis (DCA) were applied to estimate the nomograms.
Protein–protein interaction and gene set enrichment analysis
The interaction network of the protein encoded by the genes that constituted the formula of the risk score was analyzed by the STRING database (https://string-db.org/), with an interaction score >0.7. The interaction map was drawn by the Cytoscape package (version 3.9.1).
The Gene set enrichment analysis (GSEA) was performed to discover the latent enriched pathways in the low- and high-risk groups in TCGA-PAAD based on the Kyoto Encyclopedia of Genes and Genomes (KEGG), Gene Ontology (GO), and HALLMARK, in accordance with the methods by the R packages “GSEA” and “FGSEA” (Subramanian et al., 2005; Korotkevich et al., 2021). The criteria were set as |NES| > 1, false discovery rate (FDR, p adjusted) < 0.25, and p < 0.05.
Immune cell and immune-related signature
To evaluate the infiltration of immune cells in clusters, we utilized the multiple R package algorithms, which included “CIBERSORT,” “quanTIseq,” “TIMER,” “MCPcounter,” “EPIC,” and “ssGSEA,” and the immune cells included T cells, CD8+ T cells, B cells, cytotoxic lymphocytes (CTLs), endothelial cells, fibroblasts, monocytic lineage, myeloid dendritic cells (mDCs), neutrophils, natural killer (NK) cells, and other immune cells.
To excavate the potential novel immunotherapy target, the Wilcoxon signed-rank test was introduced to explore the well-known immune-related genes differently expressed between high- and low-risk groups, and the STRING database was used to find the relevant pathways about these genes (Thorsson et al., 2019).
Genomic profile
The mutation data were downloaded from the TCGA database. The “maftools” package was used to visualize the mutation data of the variant type, significantly mutated genes, substitution mutation, Catalogue of Somatic Mutations in Cancer (COSMIC) signature, and interaction of mutations in the high- and low-risk groups (TCGA-PAAD) (Mayakonda et al., 2018). The oncogenic pathways and alteration of copy number variations (CNVs) were also analyzed by R “maftools”.
Single-cell RNA sequencing characteristics
Cell clustering was achieved by the principal component analysis (PCA) and R “Seurat.” “TSNE” was used to visualize the clustering state, and the clusters were marked based on ductal cells (KRT19, KRT7, TSPAN8, and SLPI), stellate cells (RGS5, ACTA2, PDGFRB, and ADIRF), fibroblasts (LUM, DCN, COL1A1, and C1R), T cells (CD3D, CD3E, CD4, CD8A, CD8B, CD2, and CXCR4), and myeloid cells (AIF1, CD14, CD68, LILRA4, and CXCR3) (Peng et al., 2019). The differentially expressed genes between the high- and low-risk groups were identified by “Seurat” with the “FindMarkers” function. The enriched pathways in the two RS groups were determined by GSEA and GSVA. The setting for GSEA was both FDR and p values <0.05, while for GSVA, it was the correlation coefficient >1.
Chemotherapy and immunotherapy response
On the basis of clinical recommendations, the regimens, which included gemcitabine plus paclitaxel and FOLFIRINOX (5-fluorouracil, oxaliplatin, irinotecan, and leucovorin), were selected as the standard chemotherapy for PC patients. KRAS G12C inhibitor is a new drug targeted at KRAS mutation, which is one of the most common alterations in PC patients. To predict the sensitivity of these drugs, the Genomics of Drug Sensibility in Cancer Database (GDSC, https://www.cancerrxgene.org/) was applied to estimate the half-maximal inhibitory concentration (IC50) of the samples in the low- and high-risk groups (TCGA-PAAD).
To clarify the potential value of our model with respect to immunotherapy, we analyzed T-cell inflamed gene expression profile (GEP), cytotoxic activity (CYT), and the Tumor Immune Dysfunction and Exclusion (TIDE) and obtained relevant information from the immunotherapeutic cohort (IMvigor210) treated with the anti-PD-L1 agent atezolizumab and calculated the K-M curves of TCGA-PAAD (Cristescu et al., 2018; Jiang et al., 2018; Mariathasan et al., 2018). Based on the response evaluation criteria in solid tumors (RECIST), immunotherapy treatment in patients was identified as complete or partial response (CR/PR) and stable disease (SD) or progressive disease (PD). The relationship of the risk groups with the efficacy of treatment was analyzed by using the Fisher’s test.
Protein and mRNA expression
The immunohistochemical data of normal pancreatic and cancer tissues were acquired from the Human Protein Atlas (HPA, https://www.proteinatlas.org/) to evaluate the protein expressions of MET, FERMT1, MMP3, and CARD9. Based on the mRNA expression from the TCGA database, HPA analyzed the survival rate of approximately five genes in PC patients.
Cell lines and culture
Human PC cell lines, MIA PaCa-2, and the normal pancreatic cell line, hTRET-HPNE, were cultured in Dulbecco's modified Eagle medium (DMEM) (VivaCell, Germany), with 10% FBS (Evergreen, China) and 1% penicillin G (100 U/mL) (Beyotime Biotechnology, China). In addition, other PC cell lines, CAPAN-1 and CFPAC-1, were incubated in Iscove’s modified Dulbecco’s medium (IMDM) (VivaCell, Germany), supplied with 20% FEB, and 10% FBS (Evergreen, China) and 1% penicillin G (100 U/mL) (Beyotime Biotechnology, China). The cells were cultivated at 37°C with 5% CO2 and were collected at 80% confluence.
Quantitative reverse transcription PCR
The cells were harvested, and RNA was extracted by RNAiso Plus (Takara, Kusatsu, Japan). Following the instructions, RNA was reversely transcript into cDNA, using a PrimeScript™ RT reagent Kit with gDNA Eraser (Takara, Kusatsu, Japan). PCR was performed on Bio-Rad CFX (Bio-Rad, United States) with TB Green® Premix EX Taq™ II (Tli RNase H Plus) (Takara, Kusatsu, Japan). GAPDH was considered a housekeeping gene. The expression of five genes was analyzed using the 2−ΔΔCT [∆CT = CT (target gene), CT (housekeeping gene), ∆∆CT = ∆CT (cancer cell line), and ∆CT (normal cell line)]. The primer sequences are listed in Table 1. We compared every gene expression between each PC cell line and normal pancreatic cell line. All experiments were repeated thrice.

TABLE 1. Primer sequences of genes.
Statistical analysis
The statistical analysis and relevant figure drawings were performed by R (version 4.1.2). The comparison of continuous variables in the two groups was made by the Wilcoxon test and t-test. The significance of survival was calculated by K-M curves and Cox regression. The correlation analysis between groups was analyzed by the Fisher’s test, and the tables were drawn by using EXCEL. LASSO and univariate and multivariate Cox regressions were used for the analysis of prognosis-related genes. The univariate and multivariate Cox regressions were applied to assess the relationship between prognosis and clinical features and the risk score. p < 0.05 was considered statistically significant.
Results
Risk model
Identification of differentially expressed genes and building a prognostic risk model
The TME participates in the process of PC. To study the molecular signature of the TME in PC, we retrieved 4,709 TME-related genes from the ImmPort Portal and MsigDB in total and finally identified 385 genes which were differentially expressed between normal and cancer tissues (Figures 2A, B).
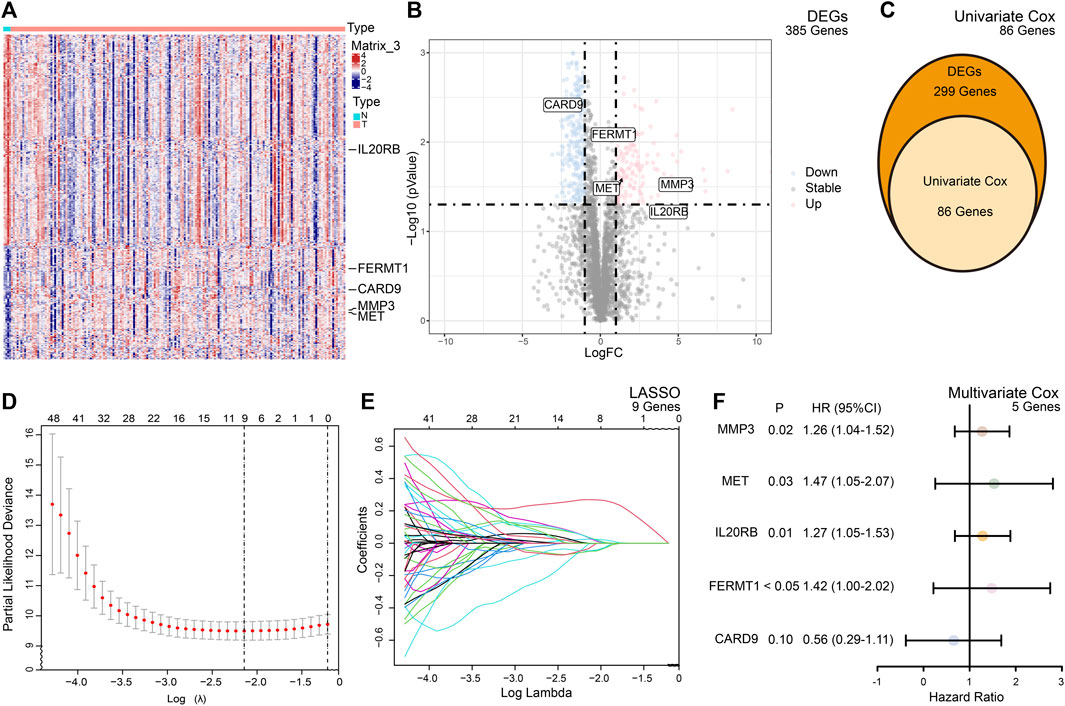
FIGURE 2. Summary of the differentially expressed genes (DEGs) and model building. (A) Heatmap of the expression of the DEGs between the normal and cancer tissues of PC. (B) Volcano plot of the expression of the DEGs between the normal and cancer tissues of PC. (C) Based on DEGs, univariate Cox analysis selected 86 candidate genes for risk model building. (D) Cross validation indicated minimum criteria for tuning parameter selection (λ) in the LASSO is nine. (E) LASSO coefficient profiles of the TME-related genes. (F) Multivariate Cox analysis of selected genes.
To predict the outcomes of PC patients, we built a prognostic risk model. After univariate and multivariate Cox and LASSO analyses, five genes, namely, FERMT1, CARD9, IL20RB, MET, and MMP3, met the criteria and constituted the formula of the risk model (Figures 2C, D). The formula was formed by the sum of the products of the expression of the gene and its coefficient
Internal and external validation of risk model
In accordance with the RS, 86 samples were assigned to the high-risk group, with 91 samples being assigned to the low-risk group in TCGA-PAAD. In GSE57495, 31 patients were assigned to the high-risk group and 32 patients to the low-risk group. In CPTAC, 67 patients were assigned to the low-risk group and the rest were labeled as high risk. The K-M curves confirmed that patients with high-risk scores were prone to having a poor prognosis in TCGA-PAAD (p < 0.001) (Figure 3A), GSE57495 (p < 0.05) (Figure 3B), and CPTAC (p < 0.01) (Figure 3C). Additionally, the ROC curve indicated that our prognostic risk model was widely flexible, with AUCs at 1 year, 3 years, and 5 years of 0.737, 0.736, and 0.813, respectively, in the TCGA-PAAD cohort (Figure 3D). The AUCs at 1 year, 3 years, and 5 years were 0.683, 0.655, and 0.542 in cohort GSE57495, respectively (Figure 3E). The AUCs at 1 year, 2 years, and 3 years were 0.644, 0.662, and 0.643 in cohort CPTAC, respectively (Figure 3F).
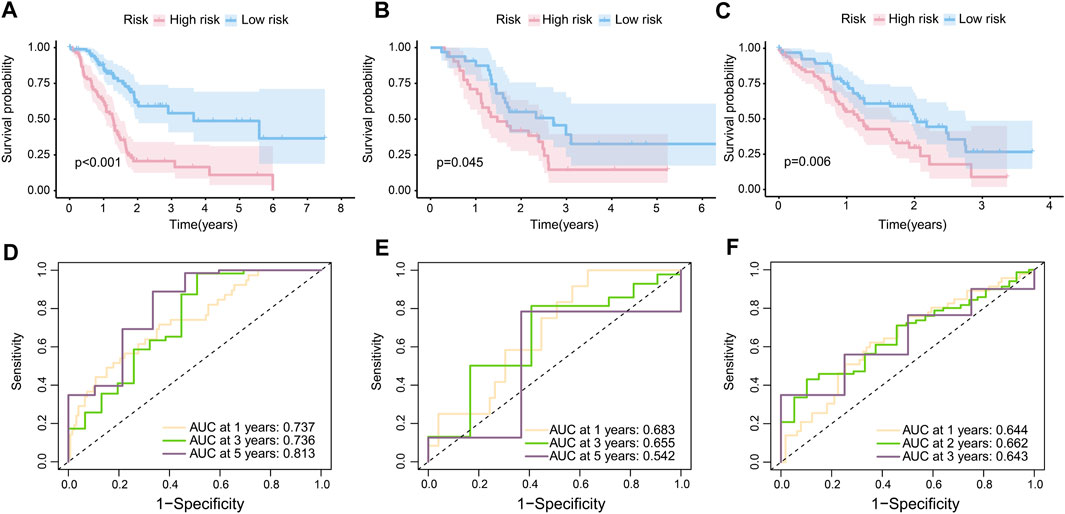
FIGURE 3. Internal and external validation of the risk model. (A) K-M curves of the overall survival in TCGA-PAAD (p < 0.001). (B) K-M curves of the overall survival in GSE57495 (p < 0.05). (C) K-M curves of the overall survival in CPTAC (p < 0.05). (D) 1-year, 3-year, and 5-year ROC curves of the risk score in the TCGA-PAAD cohort; (E) 1-year, 3-year, and 5-year ROC curves of the risk score in the GSE57495 cohort; and (F) 1-year, 2-year, and 3-year ROC curves of the risk score in the CPTAC cohort.
Evaluation of risk model
The clinical features were used to test the applicability of the model. Based on the different clinical indices, such as age, sex, grade, and stage, the patients were separated into different subgroups. The K-M curves demonstrated that there were notable prognostic differences between the low- and high-risk groups in ages ≤65 years (p < 0.001) (Figure 4A); ages >65 years (p < 0.001) (Figure 4B); male sex (p < 0.001) (Figure 4C); female sex (p < 0.01) (Figure 4D); grades 1–2 (p < 0.001) (Figure 4E); grades 3–4 (p < 0.05) (Figure 4F); stages 1–2 (p < 0.001) (Figure 4G); and stages 3–4 (p < 0.05) (Figure 4H). The univariate Cox regression indicated that the prognosis was related to age (p < 0.05), grade (p < 0.05), and RS (p < 0.001), while the multivariate Cox regression showed that only age (p < 0.05) and RS (p < 0.001) were independent prognostic factors (Table 2). In general, RS is a reliable independent index for prognosis.
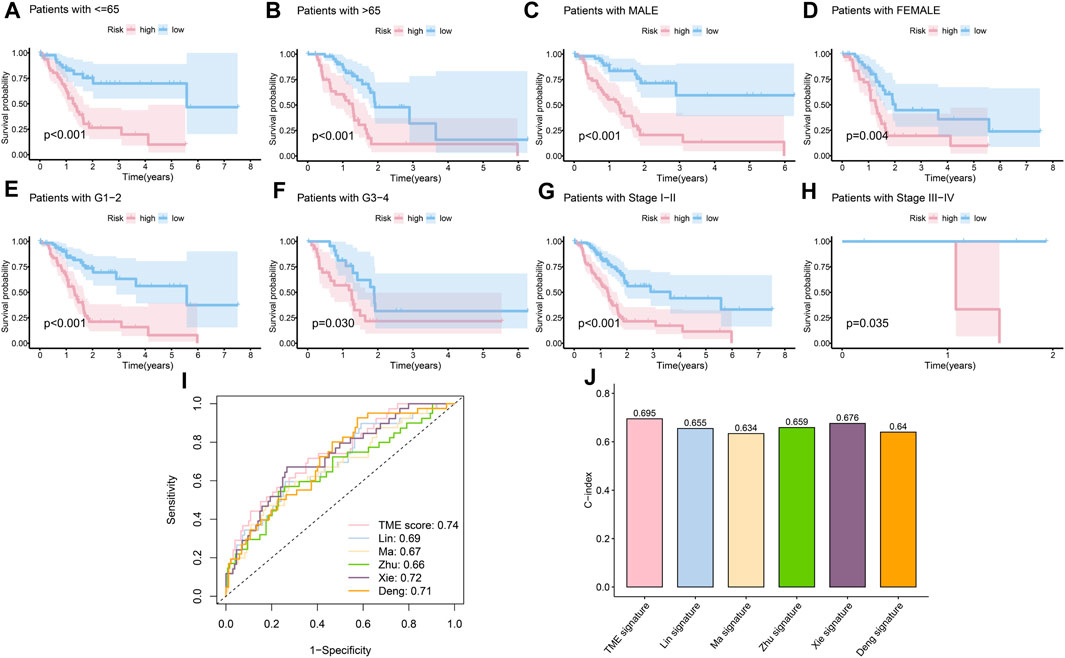
FIGURE 4. Evaluation of the risk model. (A) K-M curves of the survival probability in patients under 65 years old (p < 0.001). (B) K-M curves of the survival probability in patients over 65 years old (p < 0.001). (C) K-M curves of the survival probability in male patients (p < 0.001). (D) K-M curves of the survival probability in female patients (p < 0.01). (E) K-M curves of the survival probability in patients with grades 1–2 disease (p < 0.001). (F) K-M curves of the survival probability in patients with grades 3–4 disease (p < 0.05). (G) K-M curves of the survival probability in patients with stage 1–2 disease (p < 0.001). (H) K-M curves of the survival probability in patients with stages 3–4 disease (p < 0.05). (I) 1-year ROC curves of the risk score in Lin et al. (2021), Ma et al. (2021), Zhu et al. (2021), Xie et al. 2022, Deng et al. (2022), and our models. (J) C-index of different models.
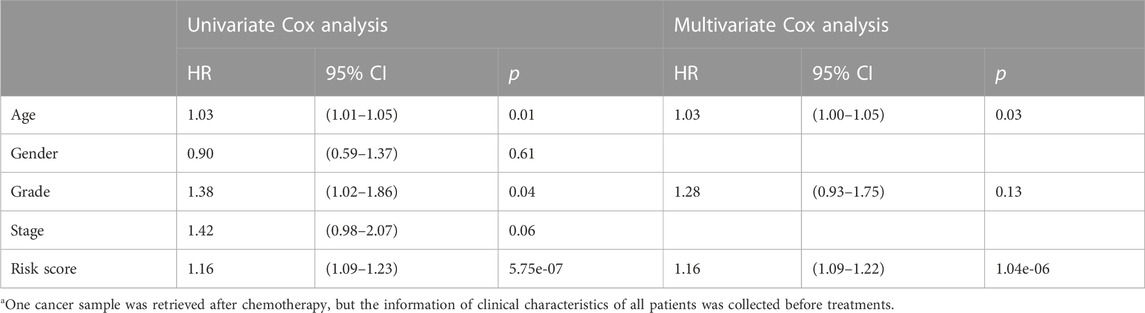
TABLE 2. Relationship between clinical characteristics and prognosis via univariate and multivariate Cox regressiona.
Next, considering the lack of data on long survival in PC, we compared our risk model with published models on ROC at 1 year, and our model achieved the largest AUC in the data set TCGA-PAAD (Figure 4I), achieved the fourth largest AUC in CPTAC (Supplementary Figure S1A), and the second in GEO57495 (Supplementary Figure S1B). The c-index of our model is 0.70, which is higher than the c-index values of Lin et al. (2021) (0.66); Ma et al. (2021) (0.63); Zhu et al. (2021) (0.66); Xie et al. 2022 (0.68); and Deng et al. (2022) (0.64) models (Figure 4J). The c-index values of our model based on CPTAC and GEO57495 were 0.595 (Supplementary Figure S1C) and 0.596 (Supplementary Figure S1D), respectively. The evidence verified that our risk model was superior to those of the other methods in terms of prognosis prediction.
Establishment of nomogram and DCA
Considering the prognostic value of the risk score and clinical characteristics, a nomogram was established to comprehensively predict the outcome. The 1-, 3-, and 5-year survival rates could be calculated by adding the points obtained using age, sex, distant metastasis, lymph node metastasis, grade, and risk score. Moreover, the model could help decision-makers manage patients reasonably and foresee the prognosis of patients (Figure 5A). The DCA and ROC curve showed that the prediction of prognosis benefited more from the nomogram than it did from the assessment with a single clinical index (Figures 5B, C).
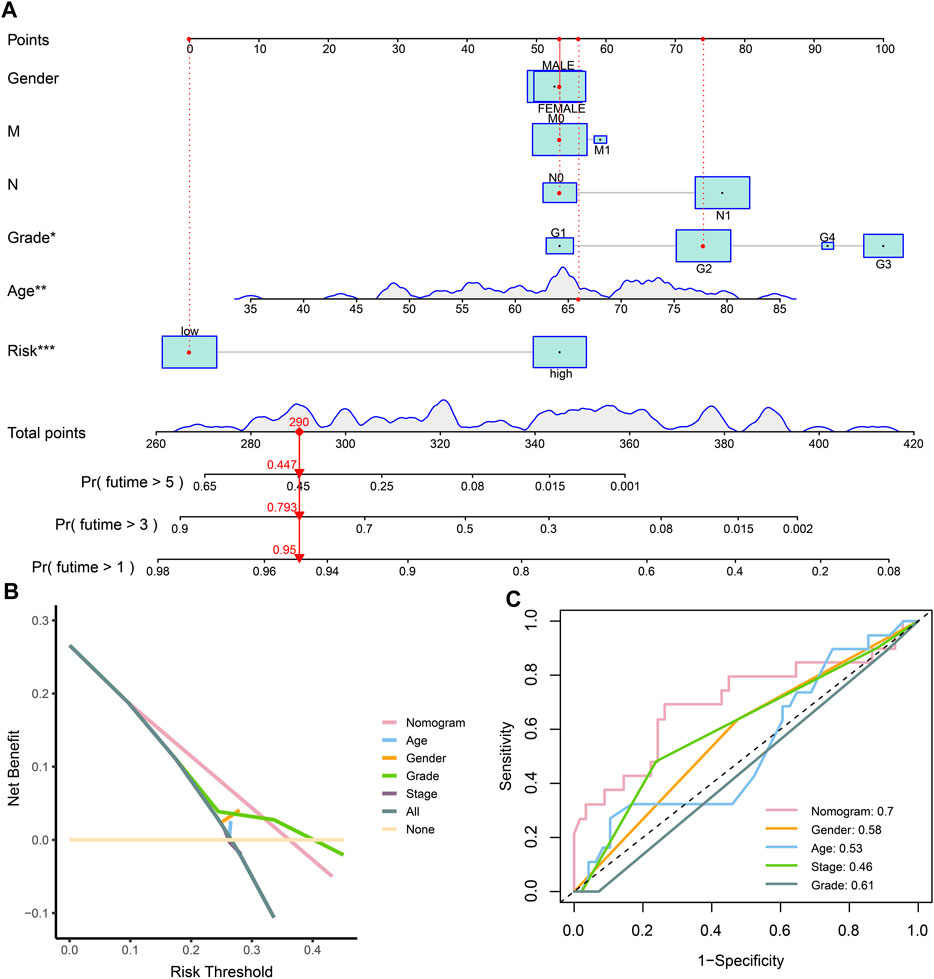
FIGURE 5. Establishment and evaluation of the nomogram. (A) Nomogram of clinical characteristics and risk score. (B) DCA of clinical characteristics and the nomogram. (C) ROC of clinical characteristics and the nomogram.
Molecule and immune features
Molecular characteristics of high- and low-risk groups
Based on protein–protein interaction (PPI) in the STRING database, 35 molecular targets were labeled to be associated with the four genes (FREMT1 being the exception) that were included in the risk model (Figure 6A).
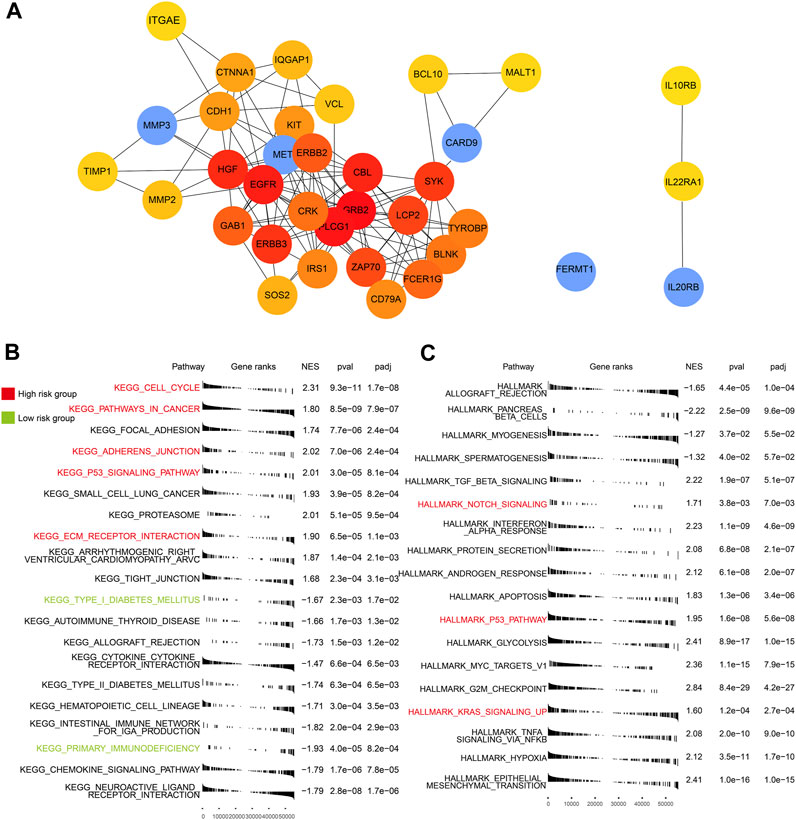
FIGURE 6. PPI of five genes and GSEA of high- and low-risk groups. (A) The interaction of proteins focused on the five genes. (B) Enriched KEGG pathways in the TCGA-PAAD (p < 0.05). (C) Enriched HALLMARK pathways in the TCGA-PAAD (p < 0.05). Key pathways marked in red are mainly enriched in the high-risk group and those in green are in the low-risk group.
We identified a few critical KEGG (Figure 6B), GO (Supplementary Figure S2), and HALLMARK (Figure 6C) pathways in each subgroup. In the high-risk group, multiple cancer-related and ECM relative pathways were upregulated, which included pathways in cancer (p < 0.05), the cell cycle (p < 0.05), KRAS signaling up (p < 0.05), adherens junction (p < 0.05), ECM receptor interaction (p < 0.05), and notch signaling (p < 0.05). Nevertheless, the immune pathways, which included primary immunodeficiency (p < 0.05) and adaptive immune response (p < 0.05), and the endocrine and metabolic related pathways, such as type I diabetes mellitus (p < 0.05) and type II diabetes mellitus groups (p < 0.05), were mainly enriched in the low-risk group. The pathway related to cancer and the lack of involvement of immunity may explain the poor outcomes of patients in the high-risk group.
Immune cell infiltration and immune signature in high- and low-risk groups
To comprehensively investigate the distribution of immunocytes, we applied the multiple algorithms in every cohort. Generally, immune cells differently infiltrated in the three cohorts. We noticed that T cells, CD8+ T cells, B cells, and CTLs were inclined to cluster in the low-risk group in the three cohorts based on different algorithms (Figure 7A) (p < 0.05). In contrast to the low-risk group, the patients in the high-risk group exhibited lower infiltration of immune cells.
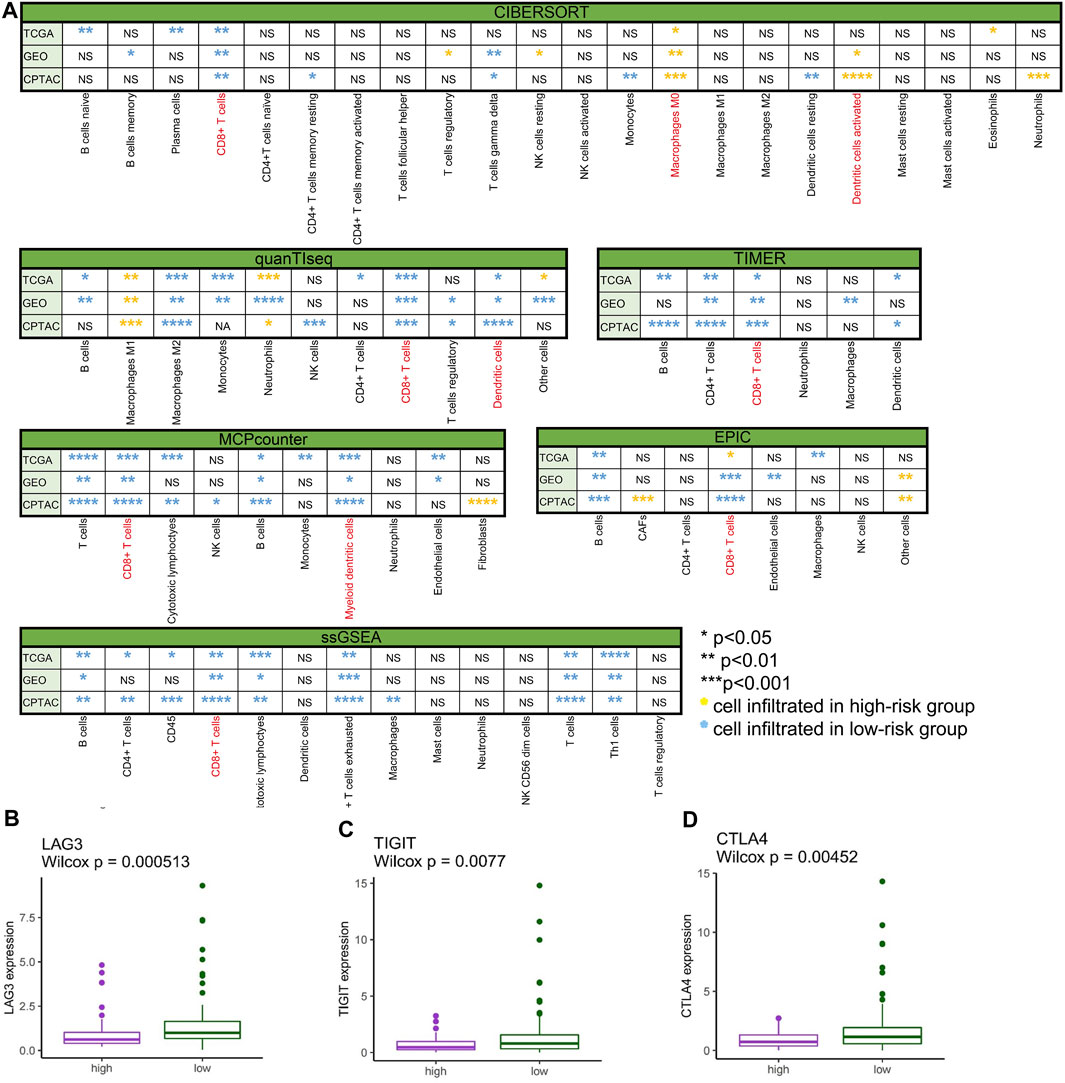
FIGURE 7. Immune cell infiltration and gene expression. (A) Comparison of immune cell infiltration between the low- and high-risk groups in TCGA-PAAD, GSE57495, and CPTAC analyzed by CIBERSORT, quanTIseq, TIMER, MCPcounter, EPIC, and ssGSEA (*p < 0.05, **p < 0.01, ***p < 0.001, ****p < 0.0001, “ns” no significance, yellow* immune cell mainly infiltrated in the high-risk group, and blue* immune cell mainly infiltrated in the low-risk group). (B) LAG3 differently expressed in high- and low-risk groups in TCGA-PAAD (p < 0.001). (C) TIGIT differently expressed in high- and low-risk groups in TCGA-PAAD (p < 0.01). (D) CTLA4 differently expressed in high- and low-risk groups in TCGA-PAAD (p < 0.01).
To spot the latent immune therapy target, we analyzed the expression of immune genes in different groups in TCGA-PAAD. The results showed that LAG3 (Figure 7B), TIGIT (Figure 7C), and CTLA-4 (Figure 7D) were expressed more in the low-risk group than in the high-risk group (p < 0.01). Preclinical and clinical studies have shown that these genes are prospective immunotherapy targets (Chen et al., 2022).
Genomic patterns
Key mutation signatures
We analyzed the mutational spectrum of TCGA-PAAD patients in the high- and low-risk groups. SNP was the most common variant type (Figure 8A). In total, 23,333 substitutions occurred in 149 samples, with the range from 0 to 2,371. In addition, the C>T substitution was the most distinct one between the high- and low-risk groups (p < 0.05) (Figure 8B). In light of the COSMIC signatures that were generated by decomposing the mutation profile, the contribution of signatures 1, 14, and 28 exhibited significant differences in the two subgroups (p < 0.05) (Figure 8D). C>T mutations most likely arise from the T:G mismatches generated from the deamination of 5′-methylcytosine because of non–prior repair during DNA replication. In addition, this is the characteristic of signature 1 which works as a cell division/mitotic clock in most cancers (Alexandrov et al., 2015).
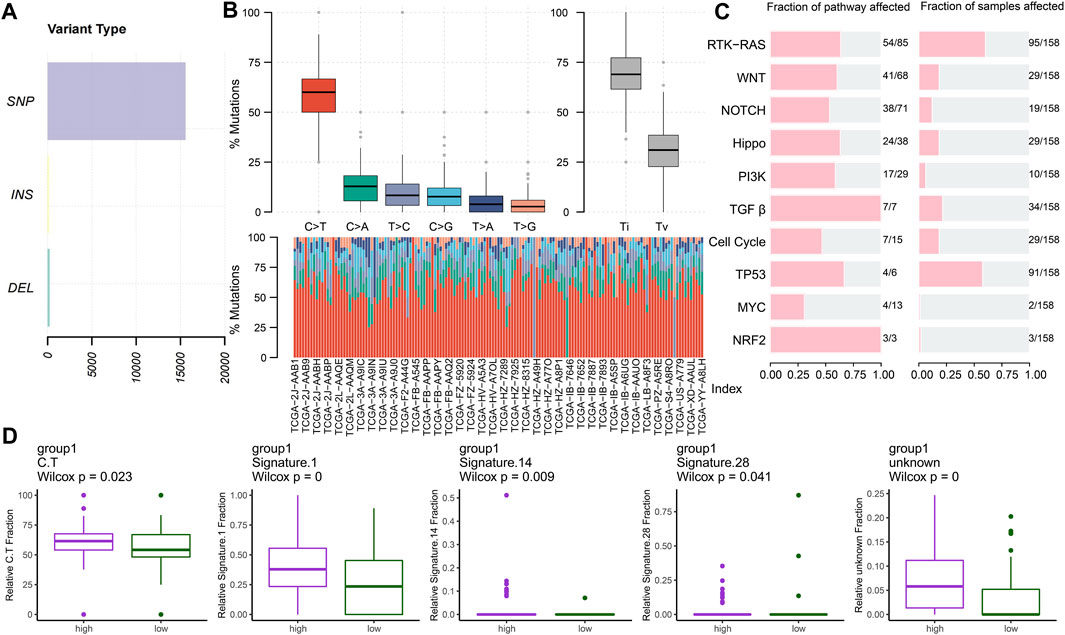
FIGURE 8. Key mutation signatures. (A) Summary of the variant type in the TCGA-PAAD cohort. (B) Possible substitution types in TCGA-PAAD. (C) Mutation condition about oncogenic pathways in TCGA-PAAD. (D) Different expressions of the COSMIC mutational signatures in TCGA-PAAD (p < 0.05).
Understanding the mechanisms of somatically altered signaling pathways in cancer is critical to develop new therapeutic approaches (Sanchez-Vega et al., 2018). By “maftools,” we found that the RTK-RAS and TP53 pathways were the top two signaling pathways with the frequency of alterations, representing 60.13% and 57.59%, respectively (Figure 8C).
Significantly mutated genes
To explore the genomic alterations between the high- and low-risk groups, we identified mutated genes and investigated the CNVs. As previously reported, the top mutated genes, that is, TP53, KRAS, and CDKN2A, showed the most single-nucleotide variations (SNVs) in the high-risk group in PC (Figure 9A) (p < 0.05). The pattern that mutation appeared in the high-risk group with none of it appearing in the low-risk group only showed for ARID1A (p < 0.05). To gain more mutational perspectives, we analyzed the CNVs of the mentioned top 20 genes and obtained similar results with the frequency of mutation of TP53, CDKN2A, and ARID1A (p < 0.05), while the CNVs of KRAS showed no significant difference in the high- and low-risk groups (p > 0.05) (Figure 9B). Next, the striking alterations of CNVs were investigated. In addition, the mutations of CNVs were mainly snoRNAs, the job of which was uncertain in PC (p < 0.05) (Figure 9C) (Williams and Farzaneh, 2012). These results indicate the candidates of CNVs for intimate relationships with PC. Using the maftools, the interaction of SMGs was described. In the high-risk group, it is notable that TP53 chiefly co-mutated with KRAS (p < 0.05) (Figure 9D), whereas in the low-risk group, it mostly co-mutated with CDKN2A (p < 0.05) (Figure 9E).
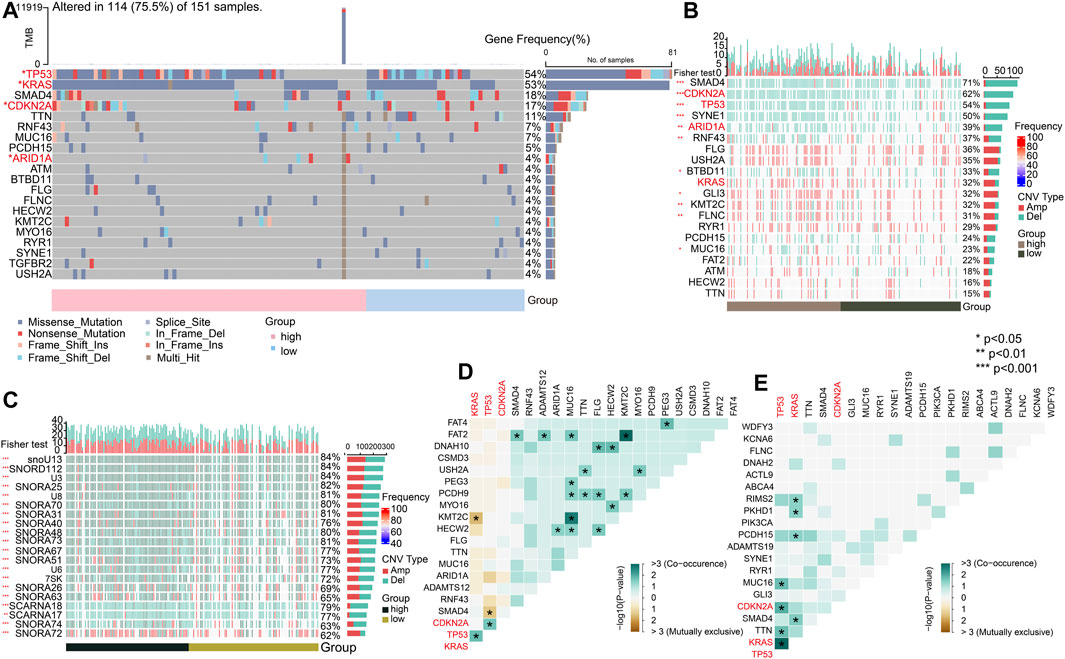
FIGURE 9. Significant mutated genes. (A) Top 20 mutated genes in high- and low-risk groups of the TCGA-PAAD cohort. (B) CNV condition of top 20 mutated genes. (C) Top 20 mutated genes by CNV. (D) Interaction of gene mutations in the high-risk group. (E) Interaction of gene mutations in the low-risk group. (*p < 0.05, **p < 0.01, ***p < 0.001, and ****p < 0.0001).
Single-cell RNA sequencing characteristics
After clustering and annotation of clusters, we noticed the distributions of cancer cells, and fibroblasts in the high-risk groups were apparently higher than those in the low-risk group (p < 0.0001), while myeloid cells were slightly highly clustered in the high-risk group than they were in the low-risk group (p < 0.01). However, T cells were merely expressed in the high-risk group, while they mostly clustered in the low-risk group (p < 0.0001) (Figures 10A–C). These evidence revealed that immune microenvironments in the two RS groups were diverse. Based on the differentially expressed genes (p < 0.05) (Figure 10D), enriched pathways from GO, KEGG, and HALLMARK were analyzed (Figures 10E–H). Similar to the results of the enriched pathways in the analysis of transcriptome, the immune-related pathways were chiefly enriched in the low-risk group, as cancer- and adhesion-related pathways were largely boosted in the high-risk group (p < 0.05).
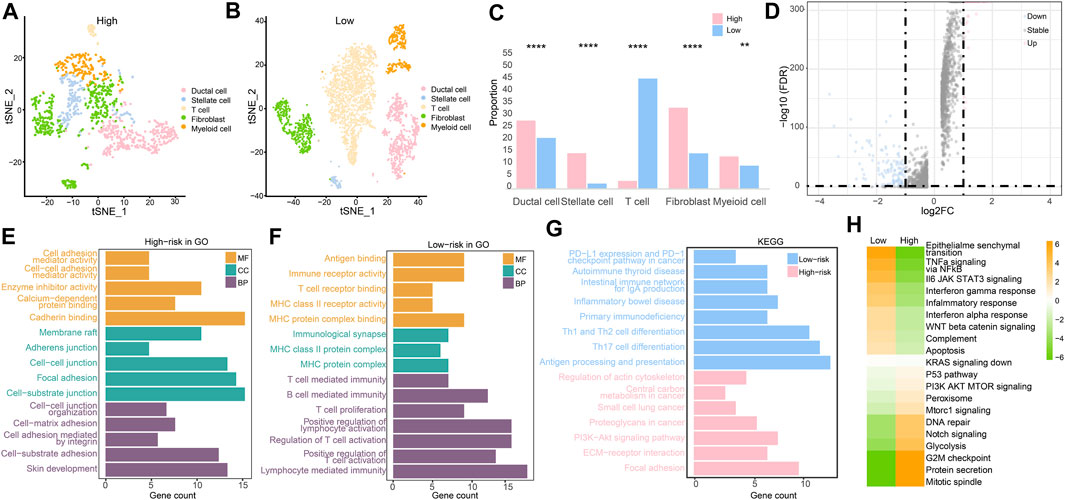
FIGURE 10. Single-cell RNA sequencing analysis. (A) Cell clustering in the high-risk group. (B) Cell clustering in the low-risk group. (C) Different analysis of cell clustering in high- and low-risk groups by Fisher’s test. (D) Differentially expressed genes in high- and low-risk groups. (E) Enriched pathways from GO in the high-risk group. (F) Enriched pathways from GO in the low-risk group. (G) Enriched pathways from KEGG in two RS groups. (H) Enriched pathways by GSVA in two RS groups. (*p < 0.05, **p < 0.01, ***p < 0.001, and ****p < 0.0001).
Chemotherapy and immunotherapy response
In validating chemotherapy sensitivity of different groups, based on the drug response data, using a panel of 29 PC cells, the high-risk cell lines were more resistant to oxaliplatin and irinotecan (the typical chemotherapy drug for PC) than the low-risk cell lines (p < 0.01) (Figures 11A, B). The IC50 of KRAS (G12C) inhibitor was higher in the low-risk group than it was in the high-risk group; however, the difference was not significant (Figure 10C). In addition, other drugs, such as 5-fluorouracil, gemcitabine, and paclitaxel, showed little distinction between the low- and high-risk groups (p > 0.05) (Figures 11D–F).
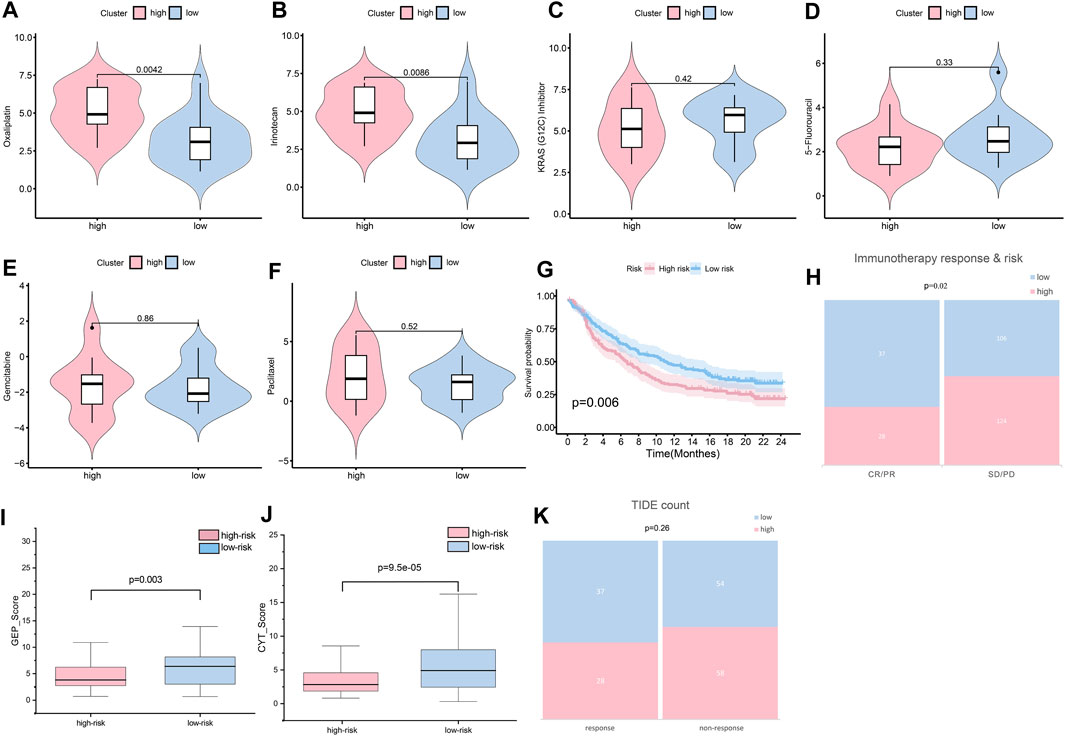
FIGURE 11. Sensitivity of patients to treatments. (A) Oxaliplatin sensitivity in the high- and low-risk groups (p < 0.01). (B) Irinotecan sensitivity in the high- and low-risk groups (p < 0.01). (C) KRAS (G12C) sensitivity in the high- and low-risk groups (p > 0.05). (D) 5-fluorouracil sensitivity in the high- and low-risk groups (p > 0.05). (E) Gemcitabine sensitivity in the high- and low-risk groups (p > 0.05). (F) Paclitaxel sensitivity in the high- and low-risk groups (p > 0.05). (G) Assuming K-M curves of the survival probability in patients in different groups after immunotherapy (p < 0.01). (H) Assuming response to immunotherapy in different groups (p < 0.05). (I) GEP score in the high- and low-risk groups (p < 0.05). (J) CYT score in the high- and low-risk groups (p < 0.001). (K) TIDE count in the high- and low-risk groups (p > 0.05).
Immunotherapy is widely and successfully used in the treatment of many cancers. To determine the potential response to immunotherapy in PC, an anti-PD-1 cohort IMvigor210 was used in our analysis. Patients labeled for high risk benefitted little from the treatment with atezolizumab, while low-risk patients obtained better outcomes (p < 0.01) (Figure 11G). After immunotherapy, patients with lower risk scores were more likely to have a complete response or partial response (CR/PR) (p < 0.05) (Figure 11H). As reported, GEP and CYT are promising therapeutic indexes for PD-1 blockade. Our results confirmed that the low-risk group was prone to higher GEP (Figure 11I) and CYT (Figure 11J) scores (p < 0.01). The low-risk group was more likely to achieve a response after immune treatment, although the difference was not significant (Figure 11K). Generally, the risk score could provide clinicians with a method for identifying beneficial treatment for PC patients.
Protein expression of genes in pancreatic tissues
FERMT1 (Figure 12A), MET (Figure 12B), and MMP3 (Figure 12C) overexpressed in PC tissues, while the expressions of CARD9 (Figure 12D) were not outstanding in both normal and cancer tissues in PC. According to the K-M analyses from HPA, all five genes were prognosis indexes for PC patients. Overexpression of FERMT1 (Figure 12E), MET (Figure 12F), MMP3 (Figure 12G), and IL20RB (Figure 12I) showed worse survival for PC. However, better prognostic tendencies showed up in PC patients who exhibited high expressions of CARD9 (Figure 12H). These results reconfirmed our model.
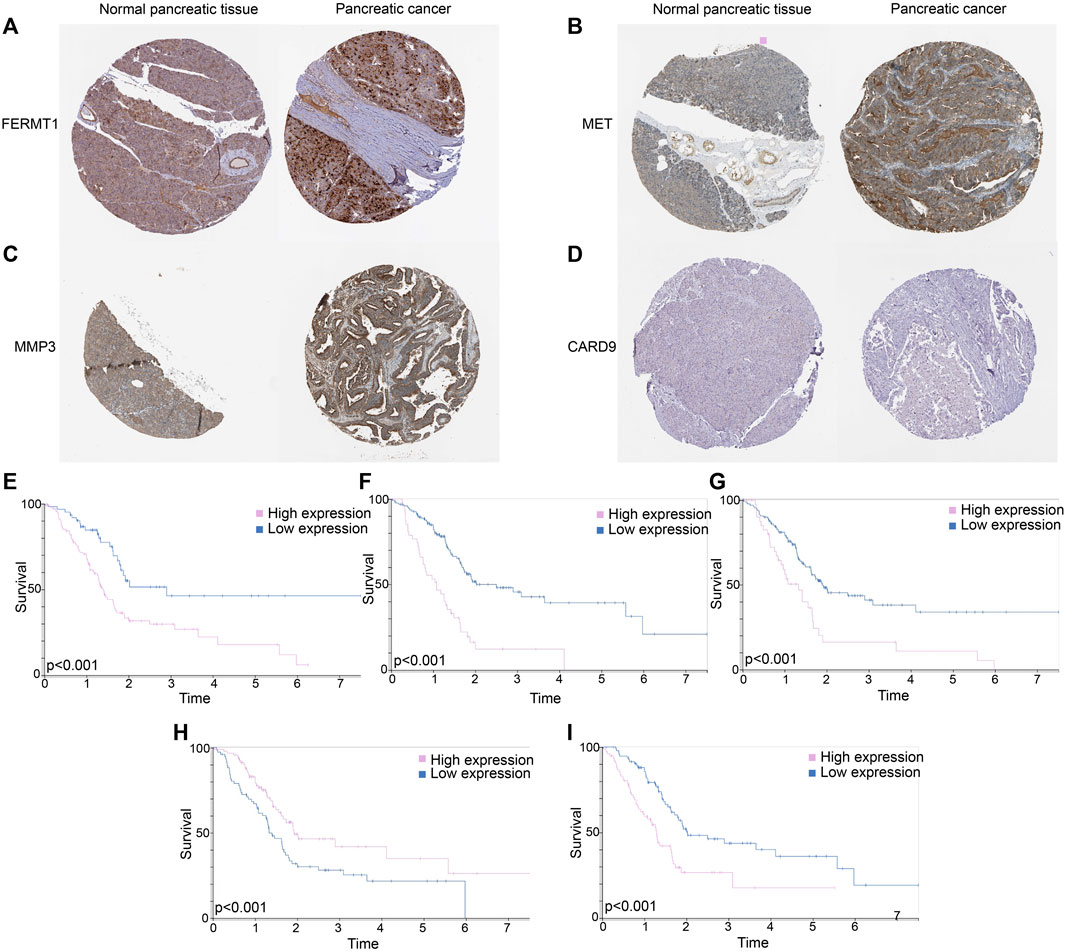
FIGURE 12. (A) Immunohistochemical data of FERMT1 in normal and tumor tissues in PC. (B) Immunohistochemical data of MET in normal and tumor tissues in PC. (C) Immunohistochemical data of MMP3 in normal and tumor tissues in PC. (D) Immunohistochemical data of CARD9 in normal and tumor tissues in PC. (E) K-M curves of survival probability in patients whose expressions of FERMT1 were different. (F) K-M curves of survival probability in patients whose expressions of MET were different. (G) K-M curves of survival probability in patients whose expressions of MMP3 were different. (H) K-M curves of survival probability in patients whose expressions of CARD9 were different. (I) K-M curves of survival probability in patients whose expressions of IL20RB were different.
MRNA expression in PC samples and cells
The expressions of FERMT1, IL20RB, MET, and MMP3 were over expressed in PC samples when compared with those in normal pancreatic tissues in the cohorts GSE15471, GSE28735, and GSE62452 (p < 0.05) (Figures 13A–D). The expression of CARD9 was lower in tumor tissues than it was in the normal groups for GSE28735 and GSE62452 (p < 0.05) cohorts. In the GSE15471 cohort, the expression of CARD9 was higher in tumor tissues but with no statistical significance (Figure 13E).
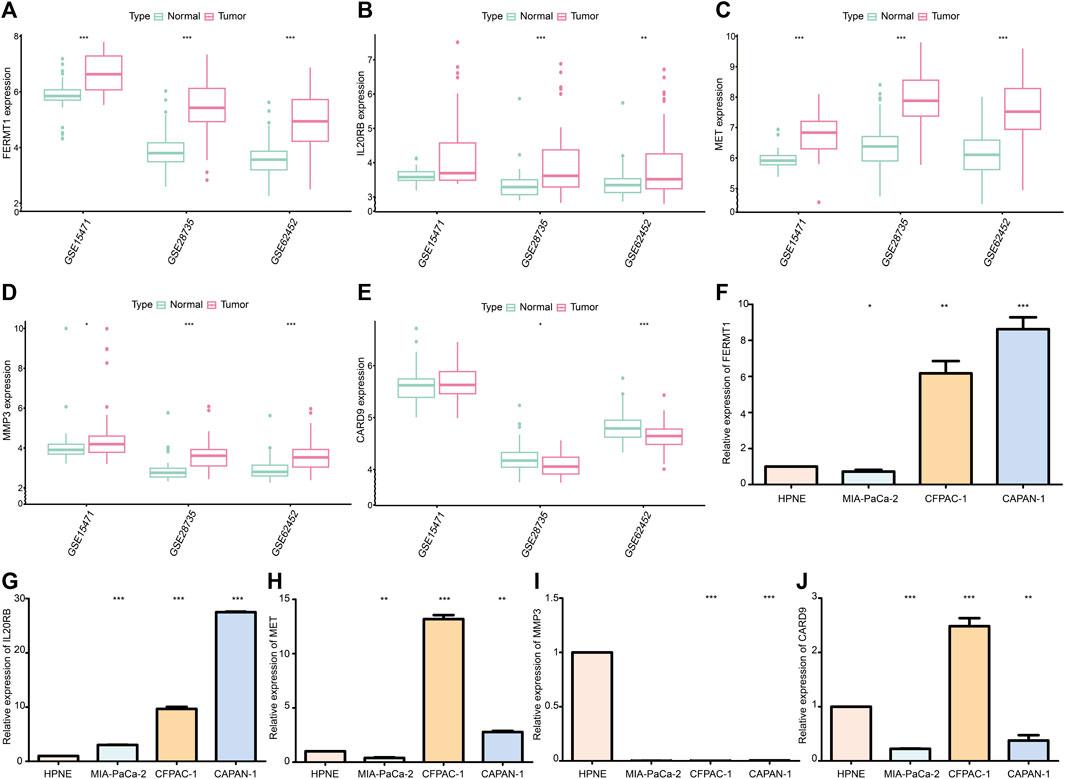
FIGURE 13. (A) Difference in mRNA expression of FERMT1 between normal and cancer tissues in data sets GSE15471, GSE28735, and GSE62452. (B) Difference in mRNA expression of IL20RB between normal and cancer tissues in data sets GSE15471, GSE28735, and GSE62452. (C) Difference in mRNA expression of MET between normal and cancer tissues in data sets GSE15471, GSE28735, and GSE62452. (D) Difference in mRNA expression of MMP3 between normal and cancer tissues in data sets GSE15471, GSE28735, and GSE62452. (E) Difference in mRNA expression of CARD9 between normal and cancer tissues in data sets GSE15471, GSE28735, and GSE62452. (F) Difference in mRNA expression of FERMT1 between the cancer cell line and normal cell line. (G) Difference in mRNA expression of IL20RB between cancer cell lines and normal cell line. (H) Difference in mRNA expression of MET between the cancer cell line and normal cell line. (I) Difference in mRNA expression of MMP3 between cancer cell lines and normal cell line. (J) Difference in mRNA expression of CARD9 between cancer cell lines and normal cell line (*p < 0.05, **p < 0.01, ***p < 0.001).
The expression of FERMT1, IL20RB, and MET increased in most PC cell lines (CFPAC-1 and CAPAN-1) (p < 0.05) (Figures 13F–H). Chiefly, the expression levels of MMP3 and CARD9 were decreased in PC cell lines (MIA-PaCa-2 and CAPAN-1) (p < 0.05) (Figures 13I, J).
Discussion
Recently, increasing evidence has shown a close relationship between PC and TME. The stroma and PC cells dynamically cooperate and promote all aspects of aggressiveness. From a genetic perspective, growth, metabolism, homeostasis and proliferation of cancer cells and the synthesis of cancer-related proteins are influenced by tumorigenesis, which is promoted by the mutation of genes in PC cells, such as KRAS, TP53, CDKN2A, and SMAD4 (Saiki et al., 2021). At the same time, PC is very heterogeneous because it contains abundant ECM and various stromal cells, such as TAMs, MDSCs, CAFs, immunocytes, and PSCs (Reyes-Castellanos et al., 2022). Interestingly, cancer cells can work together with the TME by rewiring metabolism, autophagy, and other mechanisms to serve as vital mediators of PC progression (Perera and Bardeesy, 2015; Qin et al., 2020; Reyes-Castellanos et al., 2020; Reyes-Castellanos et al., 2022). Generally, cancer cells and the TME can promote the development, invasion, metastasis, drug resistance, and evasion of immune surveillance in PC. Previous studies have developed histological or molecular classifications to predict the prognosis of PC, but their predictive ability for therapeutic management is poor (Reid et al., 2013; Bailey et al., 2016; Gutiérrez et al., 2021). Consequently, we analyzed the genetic characteristics involved in the TME and developed a new method to predict the prognosis and sensitivity of patients to treatments in PC.
By univariate and multivariate Cox and LASSO analyses, we established a robust risk model to predict the survival of PC patients and verified it in three cohorts. Cohorts TCGA-PAAD, GSE57495, and CPTAC were used to check the practicality and reliability. Overall, the survival analysis showed that our model is helpful in identifying patients who might suffer from poor prognosis. In cohort TCGA-PAAD, the best effect of the model was exhibited at prediction for 5-year survival rate, while in cohort GSE57495, it was at 1-year. This difference may be caused by the distinction of the constitution of each cohort of patients’ clinical features. For instance, cohort GSE57495 completely focused on the early stage of PC patients. In addition, in cohort CPTAC, no patient lived more than 5 years, which resulted in the absence of AUC at 5 years. Furthermore, along with the construction of the risk model, we spotted five genes that showed an intimate relationship with the prognosis of PC patients. MET is a well-known gene that acts as a growth factor under physiological conditions and can promote oncogenesis via the active mode (Comoglio et al., 2008; Nakamura et al., 2011). In head and neck squamous cell carcinoma, over half of the patients overexpress HGF which stimulates MET to induce the proliferation of cell cycle genes by activating STAT3 in the TME (Igelmann et al., 2019; Boschert et al., 2020; Raj et al., 2022). Our study found MET overexpressed in PC cells and tissues and high-expressions of MET was correlated with worse prognosis. A previous study has confirmed that MET facilitates stromal rewiring by upregulating tenascin-C (TNC) expression, which interacts with ECM components and is deeply involved in the metastasis of cancer, stimulating the proliferation and restraining the differentiation of CSCs in PC (Jones and Jones, 2000; Orend, 2005; Orend and Chiquet-Ehrismann, 2006; Modica et al., 2021). By proteolysis, MMP3, another high-expression gene in PC samples, destroyed various molecules, such as ECM and adhesion molecules, and enabled the tumor to be more aggressive (Sternlicht et al., 1999; Munhoz et al., 2010; Niland et al., 2021). Upregulated MMP3 participates in the progression of genomic instability in tumors (Sun et al., 2014). By manipulating the ECM, MMP3 is involved in oncogenesis, cancer cell proliferation, and invasion, and this explains the factor of poor survival in PC (Hadler-Olsen et al., 2013). Studies have also confirmed that the expression of MMPs is regulated by the ECM and immune system which are absent in cells in vitro (Conlon and Murray, 2019). This may explain the different expressions of MMP3 in PC cells and samples. Due to TGFβ signaling, the expression level of FERMT1 mRNA increases in several PC cell lines and promotes migration and invasion (Sin et al., 2011). CARD9 is critically involved in various inflammatory responses. By manipulating inflammatory cytokines, CARD9 is involved in adaptive immunity (Liu et al., 2022). In cancer, the cellular location of CARD9 is in tumor-infiltrating macrophages rather than in cancer cells (Zhong et al., 2018; Zhong et al., 2019), which explains the lower expression of CARD9 in PC cells and samples than in normal pancreatic ones. Furthermore, as determined by the biological state, macrophages, as a constituent of the TME, can boost or suppress the proliferation and metastasis of cancer (Pan et al., 2020; Xu et al., 2020; Zhou et al., 2020). This may account for the dual functions of CARD9 that is a tumor promoter and/or tumor inhibitor (Yang et al., 2007; Yang et al., 2008; Bergmann et al., 2017; Haas et al., 2017). By working with cytokines and ECM, five genes participate in the progress of PC. In addition, this close relationship of genes and the TME in cancer makes a promising prospective prediction of survival in PC patients, and a comparison with other models certified the efficiency of our model. Next, to predict survival in a more functional and simpler way, the nomogram was established. The result of the nomogram showed that although other clinical factors were taken into account, the risk score still played the leading role.
GSEA, immune cell infiltration, and single-cell analysis confirmed that low-risk patients have a strong relationship with the immune system. The pathway enrichment analysis showed that cancer-related pathways, such as pathways in cancer and the cell cycle, were significantly enriched in the high-risk group, illustrating poor survival. However, in the low-risk group, we noticed the enrichment of immune-related pathways and this was in accordance with the result that the anti-cancer immune cells, such as T cells, CD8+ T cells, CTL, and B cells, were mostly infiltrated in the low-risk group. A previous study has demonstrated that better DFS and OS were guaranteed in patients by a higher expression of T cells (Muller et al., 2022). CD8+ T cells attack tumor cells by recognizing the antigen peptides on their surface (Fukunaga et al., 2004; van der Leun et al., 2020). The role of B cells in PC is still ambiguous. Preclinical evidence have verified that immuno-suppressive B cells could promote cancer by suppressing the activity of CD8+ T cells and secreting cytokines (Gunderson et al., 2016; Pylayeva-Gupta et al., 2016). However, this kind of B cells only account for 10% in B cells in PDAC in humans (Delvecchio et al., 2022). Most B cells form TLS generate an inflammatory phenotype that facilitates the activation and recruitment of antigen-presenting cells and dendritic cells (DCs) (Ene-Obong et al., 2013; Watt and Kocher, 2013; Affara et al., 2014). Therefore, the pro-tumoral role of B cells may be overwhelmed by the anti-tumorigenic role. An intimate relationship with the immune mechanism may explain better outcomes in patients with low risk. In addition, drug sensitivity analysis manifested patients gotten low risk score might benefit from the immune treatment, while the counterpart might not.
Derived from the model, we identified several potential immune targets, such as LAG3, TIGIT, and CTLA-4 (Chihara et al., 2018; DeLong et al., 2019) that are highly expressed in the low-risk group. In PDAC, the CD155/TIGIT axis maintains immune evasion. Combining regimens, with inhibitors of TIGIT and PD-1 plus CD40 agonism, in preclinical models exhibited encouraging tumor suppression (Freed-Pastor et al., 2021). In the TME, T-cell exhaustion is caused by LAG-3 that cooperates with a pile of blockade receptors (Chihara et al., 2018; Edwards et al., 2018; Karlsson et al., 2020). In mice, treatment with anti-LAG-3 and anti-PD-1 antibodies also showed a strong anti-tumor effect (Woo et al., 2012). Although the mentioned targets are still stuck with preclinical trials, our model suggests that immune therapy could be a promising treatment for PC patients.
Mutation of KRAS is one of the most common alterations in both high- and low-risk groups, being present in approximately 90% of PC patients, and is regarded as the major genetic initiating event in oncogenesis by influencing the TME and cell proliferation, apoptosis, autophagy, and metabolism (Bailey et al., 2016; Chan-Seng-Yue et al., 2020; Pereira et al., 2022). Though there was no significant difference in sensitivity of anti-KRAS-G12C in the two groups, we noticed patients marked with high risk are more sensitive to this drug than those at low risk. In addition, the result of GSEA in hallmark data sets showed pathway “KRAS signaling up” was mostly enriched in the high-risk groups. Meanwhile, considering that the mutation of KRAS G12C is less frequent than the mutation of G12D in PC, KRAS G12D inhibitor may be a better choice for high-risk patients.
Another gene, ARID1A, was only mutated in the high-risk group. The function of ARID1A is complicated. In colorectal cancer (CRC), the proliferation of KRAS-mutated cancer cell rely on ARID1A (Sen et al., 2019). In gynecologic cancers, ARID1A suppresses cancer via co-operating with p53 (Guan et al., 2011). In PC, we found that high-risk patients exhibited more ARID1A mutation, but the reason for this phenomenon was not clear. Anti-ARID1A might give us a new therapeutic target for PC. Our study identified that co-mutations of TP53 and KRAS might cause worse survival. This is consistent with a former study (Shoucair et al., 2022). A preclinical study confirmed that mutated KRAS and TP53 could upregulate FOXA1 by stimulating CREB1 and finally exert an oncogenic effect (Kim et al., 2022).
Gemcitabine plus paclitaxel and FOLFIRINOX are the first recommended chemotherapy agents for PC chemotherapy, and using our model, doctors can choose sensitive chemotherapy for PC patients (Jameson et al., 2019; Robatel and Schenk, 2022). The compound regimen of other treatments and immunotherapies, which remodels the TME by adjusting the quantities and type of T cells, exhibits promising effectiveness (Kole et al., 2022). The results verified that low-risk patients would exhibit a better response to immunotherapy. The predictive value of drug responses was weakened by the rough risk characteristics classification. As the only distinctive standard, the assessment of the quantified risk scores for evaluating drug responses cannot conclude with a precise regime. Finally, we identified several new treatment targets, but these require further substantiation in future.
To a certain extent, the use of only online databases for data verification and histological validations at a single level caused validation limitation of our model. In future, local normal and cancer pancreatic tissues and clinical data are called for to verify the robustness of our model. Meanwhile, further experiments that include genomic or proteomic analysis are demanded to investigate the mechanism of FERMT1, IL20RB, MET, MMP3, and CARD9 in the progress of PC and verify potential treatment targets.
Conclusion
In this study, we comprehensively analyzed the expression and prognostic value of TME-related genes in PC. We established a risk model showing high-risk patients with worse prognostic tendencies. In addition, based on this model, multiomics methods were used to explore the immune and genetic conditions to define the traits of the TME, to identify novel treatment targets (LAG3, TIGIT, and ARID1A) and predict diverse treatment sensitivities (high-risk patients were more resistant to oxaliplatin, irinotecan, and immunotherapy).
Data availability statement
The data are available from the TCGA (https://portal.gdc.cancer.gov/), GEO (https://www.ncbi.nlm.nih.gov/geo/), and cBioportal (https://www.cbioportal.org/). The accession numbers can be found in the article/supplementary material.
Ethics statement
Ethical approval was not required for the studies on humans in accordance with the local legislation and institutional requirements because only commercially available established cell lines were used.
Author contributions
YN and DC designed this study. YL, ZB, and SW wrote the algorithm. XG, QZ, and YN analyzed the data. YN wrote this article. LX, XX, and DC revised the article. All authors contributed to the article and approved the submitted version.
Funding
This work was funded by the Science and Technology Foundation of Shaanxi Province (2018ZDXM-SF-062) and the Clinical Research Award of the First Affiliated Hospital of Xi’an Jiaotong University, China (NO. XJTU1AF2021CRF-009).
Acknowledgments
The authors thank all researchers who have contributed to the study.
Conflict of interest
Authors YL and XX were employed by Geneplus-Beijing, Co., Ltd.
The remaining authors declare that the research was conducted in the absence of any commercial or financial relationships that could be construed as a potential conflict of interest.
Publisher’s note
All claims expressed in this article are solely those of the authors and do not necessarily represent those of their affiliated organizations, or those of the publisher, editors, and reviewers. Any product that may be evaluated in this article, or claim that may be made by its manufacturer, is not guaranteed or endorsed by the publisher.
Supplementary material
The Supplementary Material for this article can be found online at: https://www.frontiersin.org/articles/10.3389/fgene.2023.1218774/full#supplementary-material
References
Affara, N. I., Ruffell, B., Medler, T. R., Gunderson, A. J., Johansson, M., Bornstein, S., et al. (2014). B cells regulate macrophage phenotype and response to chemotherapy in squamous carcinomas. Cancer Cell. 25 (6), 809–821. doi:10.1016/j.ccr.2014.04.026
Alexandrov, L. B., Jones, P. H., Wedge, D. C., Sale, J. E., Campbell, P. J., Nik-Zainal, S., et al. (2015). Clock-like mutational processes in human somatic cells. Nat. Genet. 47 (12), 1402–1407. doi:10.1038/ng.3441
Bailey, P., Chang, D. K., Nones, K., Johns, A. L., Patch, A. M., Gingras, M. C., et al. (2016). Genomic analyses identify molecular subtypes of pancreatic cancer. Nature 531 (7592), 47–52. doi:10.1038/nature16965
Balch, C. M., Riley, L. B., Bae, Y. J., Salmeron, M. A., Platsoucas, C. D., von Eschenbach, A., et al. (1990). Patterns of human tumor-infiltrating lymphocytes in 120 human cancers. Arch. Surg. 125 (2), 200–205. doi:10.1001/archsurg.1990.01410140078012
Belle, J. I., and DeNardo, D. G. (2019). A single-cell window into pancreas cancer fibroblast heterogeneity. Cancer Discov. 9 (8), 1001–1002. doi:10.1158/2159-8290.cd-19-0576
Bergmann, H., Roth, S., Pechloff, K., Kiss, E. A., Kuhn, S., Heikenwälder, M., et al. (2017). Card9-dependent IL-1β regulates IL-22 production from group 3 innate lymphoid cells and promotes colitis-associated cancer. Eur. J. Immunol. 47 (8), 1342–1353. doi:10.1002/eji.201646765
Boschert, V., Klenk, N., Abt, A., Janaki Raman, S., Fischer, M., Brands, R. C., et al. (2020). The influence of met receptor level on HGF-induced glycolytic reprogramming in head and neck squamous cell carcinoma. Int. J. Mol. Sci. 21 (2), 471. doi:10.3390/ijms21020471
Bray, F., Ferlay, J., Soerjomataram, I., Siegel, R. L., Torre, L. A., and Jemal, A. (2018). Global cancer statistics 2018: GLOBOCAN estimates of incidence and mortality worldwide for 36 cancers in 185 countries. CA Cancer J. Clin. 68 (6), 394–424. doi:10.3322/caac.21492
Chan-Seng-Yue, M., Kim, J. C., Wilson, G. W., Ng, K., Figueroa, E. F., O'Kane, G. M., et al. (2020). Transcription phenotypes of pancreatic cancer are driven by genomic events during tumor evolution. Nat. Genet. 52 (2), 231–240. doi:10.1038/s41588-019-0566-9
Chen, X., Wu, W., Wei, W., and Zou, L. (2022). Immune checkpoint inhibitors in peripheral T-cell lymphoma. Front. Pharmacol. 13, 869488. doi:10.3389/fphar.2022.869488
Chihara, N., Madi, A., Kondo, T., Zhang, H., Acharya, N., Singer, M., et al. (2018). Induction and transcriptional regulation of the co-inhibitory gene module in T cells. Nature 558 (7710), 454–459. doi:10.1038/s41586-018-0206-z
Comoglio, P. M., Giordano, S., and Trusolino, L. (2008). Drug development of MET inhibitors: targeting oncogene addiction and expedience. Nat. Rev. Drug Discov. 7 (6), 504–516. doi:10.1038/nrd2530
Conlon, G. A., and Murray, G. I. (2019). Recent advances in understanding the roles of matrix metalloproteinases in tumour invasion and metastasis. J. Pathol. 247 (5), 629–640. doi:10.1002/path.5225
Conroy, T., Desseigne, F., Ychou, M., Bouché, O., Guimbaud, R., Bécouarn, Y., et al. (2011). FOLFIRINOX versus gemcitabine for metastatic pancreatic cancer. N. Engl. J. Med. 364 (19), 1817–1825. doi:10.1056/NEJMoa1011923
Cristescu, R., Mogg, R., Ayers, M., Albright, A., Murphy, E., Yearley, J., et al. (2018). Pan-tumor genomic biomarkers for PD-1 checkpoint blockade-based immunotherapy. Science 362 (6411), eaar3593. doi:10.1126/science.aar3593
Das, S., Shapiro, B., Vucic, E. A., Vogt, S., and Bar-Sagi, D. (2020). Tumor cell-derived IL1β promotes desmoplasia and immune suppression in pancreatic cancer. Cancer Res. 80 (5), 1088–1101. doi:10.1158/0008-5472.can-19-2080
DeLong, J. H., O'Hara Hall, A., Rausch, M., Moodley, D., Perry, J., Park, J., et al. (2019). IL-27 and TCR stimulation promote T cell expression of multiple inhibitory receptors. Immunohorizons 3 (1), 13–25. doi:10.4049/immunohorizons.1800083
Delvecchio, F. R., Goulart, M. R., Fincham, R. E. A., Bombadieri, M., and Kocher, H. M. (2022). B cells in pancreatic cancer stroma. World J. Gastroenterol. 28 (11), 1088–1101. doi:10.3748/wjg.v28.i11.1088
Deng, Z. L., Zhou, D. Z., Cao, S. J., Li, Q., Zhang, J. F., and Xie, H. (2022). Development and validation of an inflammatory response-related gene signature for predicting the prognosis of pancreatic adenocarcinoma. Inflammation 45 (4), 1732–1751. doi:10.1007/s10753-022-01657-6
Ducreux, M., Cuhna, A. S., Caramella, C., Hollebecque, A., Burtin, P., Goéré, D., et al. (2015). Cancer of the pancreas: ESMO clinical practice guidelines for diagnosis, treatment and follow-up. Ann. Oncol. 26 (5), v56–v68. doi:10.1093/annonc/mdv295
Edwards, J., Wilmott, J. S., Madore, J., Gide, T. N., Quek, C., Tasker, A., et al. (2018). CD103(+) tumor-resident CD8(+) T cells are associated with improved survival in immunotherapy-naïve melanoma patients and expand significantly during anti-PD-1 treatment. Clin. Cancer Res. 24 (13), 3036–3045. doi:10.1158/1078-0432.ccr-17-2257
Elyada, E., Bolisetty, M., Laise, P., Flynn, W. F., Yu, K. H., Hao, Y., et al. (2019). Cross-species single-cell analysis of pancreatic ductal adenocarcinoma reveals antigen-presenting cancer-associated fibroblasts. Cancer Discov. 9 (8), 1102–1123. doi:10.1158/2159-8290.cd-19-0094
Ene-Obong, A., Clear, A. J., Watt, J., Wang, J., Fatah, R., Riches, J. C., et al. (2013). Activated pancreatic stellate cells sequester CD8+ T cells to reduce their infiltration of the juxtatumoral compartment of pancreatic ductal adenocarcinoma. Gastroenterology 145 (5), 1121–1132. doi:10.1053/j.gastro.2013.07.025
Farrow, B., Albo, D., and Berger, D. H. (2008). The role of the tumor microenvironment in the progression of pancreatic cancer. J. Surg. Res. 149 (2), 319–328. doi:10.1016/j.jss.2007.12.757
Feig, C., Gopinathan, A., Neesse, A., Chan, D. S., Cook, N., and Tuveson, D. A. (2012). The pancreas cancer microenvironment. Clin. Cancer Res. 18 (16), 4266–4276. doi:10.1158/1078-0432.ccr-11-3114
Freed-Pastor, W. A., Lambert, L. J., Ely, Z. A., Pattada, N. B., Bhutkar, A., Eng, G., et al. (2021). The CD155/TIGIT axis promotes and maintains immune evasion in neoantigen-expressing pancreatic cancer. Cancer Cell. 39 (10), 1342–1360.e14. doi:10.1016/j.ccell.2021.07.007
Friedman, J., Hastie, T., and Tibshirani, R. (2010). Regularization paths for generalized linear models via coordinate descent. J. Stat. Softw. 33 (1), 1–22. doi:10.18637/jss.v033.i01
Fukunaga, A., Miyamoto, M., Cho, Y., Murakami, S., Kawarada, Y., Oshikiri, T., et al. (2004). CD8+ tumor-infiltrating lymphocytes together with CD4+ tumor-infiltrating lymphocytes and dendritic cells improve the prognosis of patients with pancreatic adenocarcinoma. Pancreas 28 (1), e26–e31. doi:10.1097/00006676-200401000-00023
Guan, B., Wang, T. L., and Shih Ie, M. (2011). ARID1A, a factor that promotes formation of SWI/SNF-mediated chromatin remodeling, is a tumor suppressor in gynecologic cancers. Cancer Res. 71 (21), 6718–6727. doi:10.1158/0008-5472.can-11-1562
Gunderson, A. J., Kaneda, M. M., Tsujikawa, T., Nguyen, A. V., Affara, N. I., Ruffell, B., et al. (2016). Bruton tyrosine kinase-dependent immune cell cross-talk drives pancreas cancer. Cancer Discov. 6 (3), 270–285. doi:10.1158/2159-8290.cd-15-0827
Gutiérrez, M. L., Muñoz-Bellvís, L., and Orfao, A. (2021). Genomic heterogeneity of pancreatic ductal adenocarcinoma and its clinical impact. Cancers (Basel) 13 (17), 4451. doi:10.3390/cancers13174451
Haas, T., Heidegger, S., Wintges, A., Bscheider, M., Bek, S., Fischer, J. C., et al. (2017). Card9 controls Dectin-1-induced T-cell cytotoxicity and tumor growth in mice. Eur. J. Immunol. 47 (5), 872–879. doi:10.1002/eji.201646775
Hadler-Olsen, E., Winberg, J. O., and Uhlin-Hansen, L. (2013). Matrix metalloproteinases in cancer: their value as diagnostic and prognostic markers and therapeutic targets. Tumour Biol. 34 (4), 2041–2051. doi:10.1007/s13277-013-0842-8
Hasan, S., Jacob, R., Manne, U., and Paluri, R. (2019). Advances in pancreatic cancer biomarkers. Oncol. Rev. 13 (1), 410. doi:10.4081/oncol.2019.410
Hiraoka, N., Ino, Y., Yamazaki-Itoh, R., Kanai, Y., Kosuge, T., and Shimada, K. (2015). Intratumoral tertiary lymphoid organ is a favourable prognosticator in patients with pancreatic cancer. Br. J. Cancer 112 (11), 1782–1790. doi:10.1038/bjc.2015.145
Huang, B., Pan, P. Y., Li, Q., Sato, A. I., Levy, D. E., Bromberg, J., et al. (2006). Gr-1+CD115+ immature myeloid suppressor cells mediate the development of tumor-induced T regulatory cells and T-cell anergy in tumor-bearing host. Cancer Res. 66 (2), 1123–1131. doi:10.1158/0008-5472.can-05-1299
Igelmann, S., Neubauer, H. A., and Ferbeyre, G. (2019). STAT3 and STAT5 activation in solid cancers. Cancers 11 (10), 1428. doi:10.3390/cancers11101428
Jameson, G. S., Borazanci, E., Babiker, H. M., Poplin, E., Niewiarowska, A. A., Gordon, M. S., et al. (2019). Response rate following albumin-bound paclitaxel plus gemcitabine plus cisplatin treatment among patients with advanced pancreatic cancer: a phase 1b/2 pilot clinical trial. JAMA Oncol. 6 (1), 125–132. doi:10.1001/jamaoncol.2019.3394
Jang, J. E., Hajdu, C. H., Liot, C., Miller, G., Dustin, M. L., and Bar-Sagi, D. (2017). Crosstalk between regulatory T cells and tumor-associated dendritic cells negates anti-tumor immunity in pancreatic cancer. Cell. Rep. 20 (3), 558–571. doi:10.1016/j.celrep.2017.06.062
Jiang, P., Gu, S., Pan, D., Fu, J., Sahu, A., Hu, X., et al. (2018). Signatures of T cell dysfunction and exclusion predict cancer immunotherapy response. Nat. Med. 24 (10), 1550–1558. doi:10.1038/s41591-018-0136-1
Jiang, X., Ma, Y., Wang, T., Zhou, H., Wang, K., Shi, W., et al. (2023). Targeting UBE2T potentiates gemcitabine efficacy in pancreatic cancer by regulating pyrimidine metabolism and replication stress. Gastroenterology S0016-5085 (23), 1232–1247. doi:10.1053/j.gastro.2023.02.025
Johnson, W. E., Li, C., and Rabinovic, A. (2007). Adjusting batch effects in microarray expression data using empirical Bayes methods. Biostatistics 8 (1), 118–127. doi:10.1093/biostatistics/kxj037
Jones, P. L., and Jones, F. S. (2000). Tenascin-C in development and disease: gene regulation and cell function. Matrix Biol. 19 (7), 581–596. doi:10.1016/s0945-053x(00)00106-2
Karlsson, J., Nilsson, L. M., Mitra, S., Alsén, S., Shelke, G. V., Stierner, U., et al. (2020). Molecular profiling of driver events in metastatic uveal melanoma. Nat. Commun. 11 (1), 1894. doi:10.1038/s41467-020-15606-0
Kaźmierczak-Siedlecka, K., Dvořák, A., Folwarski, M., Daca, A., Przewłócka, K., and Makarewicz, W. (2020). Fungal gut microbiota dysbiosis and its role in colorectal, oral, and pancreatic carcinogenesis. Cancers (Basel) 12 (5), 1326. doi:10.3390/cancers12051326
Kim, R., An, M., Lee, H., Rha, S. Y., Min, B. H., Kim, T. J., et al. (2022). Early tumor-immune microenvironmental remodeling and response to first-line fluoropyrimidine and platinum chemotherapy in advanced gastric cancer. Cancer Discov. 12 (4), 984–1001. doi:10.1158/2159-8290.cd-21-0888
Kleeff, J., Korc, M., Apte, M., La Vecchia, C., Johnson, C. D., Biankin, A. V., et al. (2016). Pancreatic cancer. Nat. Rev. Dis. Prim. 2, 16022. doi:10.1038/nrdp.2016.22
Kole, C., Charalampakis, N., Tsakatikas, S., Frountzas, M., Apostolou, K., and Schizas, D. (2022). Immunotherapy in combination with well-established treatment strategies in pancreatic cancer: current insights. Cancer Manag. Res. 14, 1043–1061. doi:10.2147/CMAR.S267260
Korotkevich, G., Sukhov, V., Budin, N., Shpak, B., Artyomov, M. N., and Sergushichev, A. (2021). Fast gene set enrichment analysis. bioRxiv, 060012. doi:10.1101/060012
Lin, H., Hu, C., Zheng, S., Zhang, X., Chen, R., and Zhou, Q. (2021). A novel gene signature for prognosis prediction and chemotherapy response in patients with pancreatic cancer. Aging (Albany NY) 13 (9), 12493–12513. doi:10.18632/aging.202922
Liu, X., Jiang, B., Hao, H., and Liu, Z. (2022). CARD9 signaling, inflammation, and diseases. Front. Immunol. 13, 880879. doi:10.3389/fimmu.2022.880879
Lohneis, P., Sinn, M., Bischoff, S., Jühling, A., Pelzer, U., Wislocka, L., et al. (2017). Cytotoxic tumour-infiltrating T lymphocytes influence outcome in resected pancreatic ductal adenocarcinoma. Eur. J. Cancer 83, 290–301. doi:10.1016/j.ejca.2017.06.016
Ma, Z., Li, Z., Ma, Z., Zhou, Z., Zhuang, H., Liu, C., et al. (2021). Development of a KRAS-associated metabolic risk model for prognostic prediction in pancreatic cancer. Biomed. Res. Int. 2021, 9949272. doi:10.1155/2021/9949272
Mariathasan, S., Turley, S. J., Nickles, D., Castiglioni, A., Yuen, K., Wang, Y., et al. (2018). TGFβ attenuates tumour response to PD-L1 blockade by contributing to exclusion of T cells. Nature 554 (7693), 544–548. doi:10.1038/nature25501
Mayakonda, A., Lin, D. C., Assenov, Y., Plass, C., and Koeffler, H. P. (2018). Maftools: efficient and comprehensive analysis of somatic variants in cancer. Genome Res. 28 (11), 1747–1756. doi:10.1101/gr.239244.118
Modica, C., Olivero, M., Zuppini, F., Milan, M., Basilico, C., and Vigna, E. (2021). HGF/MET Axis induces tumor secretion of tenascin-C and promotes stromal rewiring in pancreatic cancer. Cancers (Basel) 13 (14), 3519. doi:10.3390/cancers13143519
Muller, M., Haghnejad, V., Schaefer, M., Gauchotte, G., Caron, B., Peyrin-Biroulet, L., et al. (2022). The immune landscape of human pancreatic ductal carcinoma: key players, clinical implications, and challenges. Cancers 14 (4), 995. doi:10.3390/cancers14040995
Munhoz, F. B., Godoy-Santos, A. L., and Santos, M. C. (2010). MMP-3 polymorphism: genetic marker in pathological processes (review). Mol. Med. Rep. 3 (5), 735–740. doi:10.3892/mmr.2010.340
Nakamura, T., Sakai, K., Nakamura, T., and Matsumoto, K. (2011). Hepatocyte growth factor twenty years on: much more than a growth factor. J. Gastroenterol. Hepatol. 26 (1), 188–202. doi:10.1111/j.1440-1746.2010.06549.x
Niland, S., Riscanevo, A. X., and Eble, J. A. (2021). Matrix metalloproteinases shape the tumor microenvironment in cancer progression. Int. J. Mol. Sci. 23 (1), 146. doi:10.3390/ijms23010146
Nomi, T., Sho, M., Akahori, T., Hamada, K., Kubo, A., Kanehiro, H., et al. (2007). Clinical significance and therapeutic potential of the programmed death-1 ligand/programmed death-1 pathway in human pancreatic cancer. Clin. Cancer Res. 13 (7), 2151–2157. doi:10.1158/1078-0432.ccr-06-2746
Orend, G., and Chiquet-Ehrismann, R. (2006). Tenascin-C induced signaling in cancer. Cancer Lett. 244 (2), 143–163. doi:10.1016/j.canlet.2006.02.017
Orend, G. (2005). Potential oncogenic action of tenascin-C in tumorigenesis. Int. J. Biochem. Cell. Biol. 37 (5), 1066–1083. doi:10.1016/j.biocel.2004.12.002
Ostrand-Rosenberg, S., Sinha, P., Beury, D. W., and Clements, V. K. (2012). Cross-talk between myeloid-derived suppressor cells (MDSC), macrophages, and dendritic cells enhances tumor-induced immune suppression. Semin. Cancer Biol. 22 (4), 275–281. doi:10.1016/j.semcancer.2012.01.011
Pan, Y., Yu, Y., Wang, X., and Zhang, T. (2020). Tumor-associated macrophages in tumor immunity. Front. Immunol. 11, 583084. doi:10.3389/fimmu.2020.583084
Peng, J., Sun, B. F., Chen, C. Y., Zhou, J. Y., Chen, Y. S., Wu, W., et al. (2019). Author correction: single-cell RNA-seq highlights intra-tumoral heterogeneity and malignant progression in pancreatic ductal adenocarcinoma. Cell. Res. 29 (9), 777. doi:10.1038/s41422-019-0212-1
Pereira, F., Ferreira, A., Reis, C. A., Sousa, M. J., Oliveira, M. J., and Preto, A. (2022). KRAS as a modulator of the inflammatory tumor microenvironment: therapeutic implications. Cells 11 (3), 398. doi:10.3390/cells11030398
Perera, R. M., and Bardeesy, N. (2015). Pancreatic cancer metabolism: breaking it down to build it back up. Cancer Discov. 5 (12), 1247–1261. doi:10.1158/2159-8290.CD-15-0671
Pinton, L., Solito, S., Damuzzo, V., Francescato, S., Pozzuoli, A., Berizzi, A., et al. (2016). Activated T cells sustain myeloid-derived suppressor cell-mediated immune suppression. Oncotarget 7 (2), 1168–1184. doi:10.18632/oncotarget.6662
Poruk, K. E., Firpo, M. A., Adler, D. G., and Mulvihill, S. J. (2013). Screening for pancreatic cancer: why, how, and who? Ann. Surg. 257 (1), 17–26. doi:10.1097/SLA.0b013e31825ffbfb
Pylayeva-Gupta, Y., Das, S., Handler, J. S., Hajdu, C. H., Coffre, M., Koralov, S. B., et al. (2016). IL35-Producing B cells promote the development of pancreatic neoplasia. Cancer Discov. 6 (3), 247–255. doi:10.1158/2159-8290.cd-15-0843
Qin, C., Yang, G., Yang, J., Ren, B., Wang, H., Chen, G., et al. (2020). Metabolism of pancreatic cancer: paving the way to better anticancer strategies. Mol. cancer 19 (1), 50. doi:10.1186/s12943-020-01169-7
Raj, S., Kesari, K. K., Kumar, A., Rathi, B., Sharma, A., Gupta, P. K., et al. (2022). Molecular mechanism(s) of regulation(s) of c-MET/HGF signaling in head and neck cancer. Mol. cancer 21 (1), 31. doi:10.1186/s12943-022-01503-1
Reid, M. D., Bagci, P., and Adsay, N. V. (2013). Histopathologic assessment of pancreatic cancer: does one size fit all? J. Surg. Oncol. 107 (1), 67–77. doi:10.1002/jso.23194
Reyes-Castellanos, G., Masoud, R., and Carrier, A. (2020). Mitochondrial metabolism in PDAC: from better knowledge to new targeting strategies. Biomedicines 8 (8), 270. doi:10.3390/biomedicines8080270
Reyes-Castellanos, G., Abdel Hadi, N., and Carrier, A. (2022). Autophagy contributes to metabolic reprogramming and therapeutic resistance in pancreatic tumors. Cells 11 (3), 426. doi:10.3390/cells11030426
Robatel, S., and Schenk, M. (2022). Current limitations and novel perspectives in pancreatic cancer treatment. Cancers 14 (4), 985. doi:10.3390/cancers14040985
Saiki, Y., Jiang, C., Ohmuraya, M., and Furukawa, T. (2021). Genetic mutations of pancreatic cancer and genetically engineered mouse models. Cancers 14 (1), 71. doi:10.3390/cancers14010071
Samstein, R. M., Lee, C. H., Shoushtari, A. N., Shen, R., Janjigian, Y. Y., Barron, D. A., et al. (2019). Tumor mutational load predicts survival after immunotherapy across multiple cancer types. Nat. Genet. 51 (2), 202–206. doi:10.1038/s41588-018-0312-8
Sanchez-Vega, F., Mina, M., Armenia, J., Chatila, W. K., Luna, A., La, K. C., et al. (2018). Oncogenic signaling pathways in the cancer genome Atlas. Cell. 173 (2), 321–337.e10. doi:10.1016/j.cell.2018.03.035
Sen, M., Wang, X., Hamdan, F. H., Rapp, J., Eggert, J., Kosinsky, R. L., et al. (2019). ARID1A facilitates KRAS signaling-regulated enhancer activity in an AP1-dependent manner in colorectal cancer cells. Clin. Epigenetics 11 (1), 92. doi:10.1186/s13148-019-0690-5
Shoucair, S., Habib, J. R., Pu, N., Kinny-Köster, B., van Ooston, A. F., Javed, A. A., et al. (2022). Comprehensive analysis of somatic mutations in driver genes of resected pancreatic ductal adenocarcinoma reveals KRAS G12D and mutant TP53 combination as an independent predictor of clinical outcome. Ann. Surg. Oncol. 29 (4), 2720–2731. doi:10.1245/s10434-021-11081-z
Sin, S., Bonin, F., Petit, V., Meseure, D., Lallemand, F., Bièche, I., et al. (2011). Role of the focal adhesion protein kindlin-1 in breast cancer growth and lung metastasis. J. Natl. Cancer Inst. 103 (17), 1323–1337. doi:10.1093/jnci/djr290
Sinha, P., Clements, V. K., Bunt, S. K., Albelda, S. M., and Ostrand-Rosenberg, S. (2007). Cross-talk between myeloid-derived suppressor cells and macrophages subverts tumor immunity toward a type 2 response. J. Immunol. 179 (2), 977–983. doi:10.4049/jimmunol.179.2.977
Sternlicht, M. D., Lochter, A., Sympson, C. J., Huey, B., Rougier, J. P., Gray, J. W., et al. (1999). The stromal proteinase MMP3/stromelysin-1 promotes mammary carcinogenesis. Cell. 98 (2), 137–146. doi:10.1016/s0092-8674(00)81009-0
Subramanian, A., Tamayo, P., Mootha, V. K., Mukherjee, S., Ebert, B. L., Gillette, M. A., et al. (2005). Gene set enrichment analysis: a knowledge-based approach for interpreting genome-wide expression profiles. Proc. Natl. Acad. Sci. U. S. A. 102 (43), 15545–15550. doi:10.1073/pnas.0506580102
Sun, P., Mu, Y., and Zhang, S. (2014). A novel NF-κB/MMP-3 signal pathway involves in the aggressivity of glioma promoted by Bmi-1. Tumour Biol. 35 (12), 12721–12727. doi:10.1007/s13277-014-2597-2
Thorsson, V., Gibbs, D. L., Brown, S. D., Wolf, D., Bortone, D. S., Ou Yang, T. H., et al. (2019). The immune landscape of cancer. Immunity 51 (2), 411–412. doi:10.1016/j.immuni.2019.08.004
van der Leun, A. M., Thommen, D. S., and Schumacher, T. N. (2020). CD8(+) T cell states in human cancer: insights from single-cell analysis. Nat. Rev. Cancer 20 (4), 218–232. doi:10.1038/s41568-019-0235-4
Von Hoff, D. D., Ervin, T., Arena, F. P., Chiorean, E. G., Infante, J., Moore, M., et al. (2013). Increased survival in pancreatic cancer with nab-paclitaxel plus gemcitabine. N. Engl. J. Med. 369 (18), 1691–1703. doi:10.1056/NEJMoa1304369
Wang, H., Lengerich, B. J., Aragam, B., and Xing, E. P. (2019). Precision lasso: accounting for correlations and linear dependencies in high-dimensional genomic data. Bioinformatics 35 (7), 1181–1187. doi:10.1093/bioinformatics/bty750
Watt, J., and Kocher, H. M. (2013). The desmoplastic stroma of pancreatic cancer is a barrier to immune cell infiltration. Oncoimmunology 2 (12), e26788. doi:10.4161/onci.26788
Williams, G. T., and Farzaneh, F. (2012). Are snoRNAs and snoRNA host genes new players in cancer? Nat. Rev. Cancer 12 (2), 84–88. doi:10.1038/nrc3195
Wolfgang, C. L., Herman, J. M., Laheru, D. A., Klein, A. P., Erdek, M. A., Fishman, E. K., et al. (2013). Recent progress in pancreatic cancer. CA Cancer J. Clin. 63 (5), 318–348. doi:10.3322/caac.21190
Woo, S. R., Turnis, M. E., Goldberg, M. V., Bankoti, J., Selby, M., Nirschl, C. J., et al. (2012). Immune inhibitory molecules LAG-3 and PD-1 synergistically regulate T-cell function to promote tumoral immune escape. Cancer Res. 72 (4), 917–927. doi:10.1158/0008-5472.can-11-1620
Xie, F., Huang, X., He, C., Wang, R., and Li, S. (2022). An inflammatory response-related gene signature reveals distinct survival outcome and tumor microenvironment characterization in pancreatic cancer. Front. Mol. Biosci. 9, 876607. doi:10.3389/fmolb.2022.876607
Xu, F., Wei, Y., Tang, Z., Liu, B., and Dong, J. (2020). Tumor-associated macrophages in lung cancer: friend or foe? (Review). Mol. Med. Rep. 22 (5), 4107–4115. doi:10.3892/mmr.2020.11518
Yang, H., Minamishima, Y. A., Yan, Q., Schlisio, S., Ebert, B. L., Zhang, X., et al. (2007). pVHL acts as an adaptor to promote the inhibitory phosphorylation of the NF-kappaB agonist Card9 by CK2. Mol. Cell. 28 (1), 15–27. doi:10.1016/j.molcel.2007.09.010
Yang, J., Chai, L., Gao, C., Fowles, T. C., Alipio, Z., Dang, H., et al. (2008). SALL4 is a key regulator of survival and apoptosis in human leukemic cells. Blood 112 (3), 805–813. doi:10.1182/blood-2007-11-126326
Zhang, L., Conejo-Garcia, J. R., Katsaros, D., Gimotty, P. A., Massobrio, M., Regnani, G., et al. (2003). Intratumoral T cells, recurrence, and survival in epithelial ovarian cancer. N. Engl. J. Med. 348 (3), 203–213. doi:10.1056/NEJMoa020177
Zhang, J., Li, R., and Huang, S. (2022). The immunoregulation effect of tumor microenvironment in pancreatic ductal adenocarcinoma. Front. Oncol. 12, 951019. doi:10.3389/fonc.2022.951019
Zhong, X., Chen, B., Yang, L., and Yang, Z. (2018). Molecular and physiological roles of the adaptor protein CARD9 in immunity. Cell. Death Dis. 9 (2), 52. doi:10.1038/s41419-017-0084-6
Zhong, X., Chen, B., Yang, L., and Yang, Z. (2019). Card9 as a critical regulator of tumor development. Cancer Lett. 451, 150–155. doi:10.1016/j.canlet.2019.03.001
Zhou, Y., Fei, M., Zhang, G., Liang, W. C., Lin, W., Wu, Y., et al. (2020). Blockade of the phagocytic receptor MerTK on tumor-associated macrophages enhances P2x7r-dependent STING activation by tumor-derived cGAMP. Immunity 52 (2), 357–373. doi:10.1016/j.immuni.2020.01.014
Zhu, Z., Tang, C., Xu, T., and Zhao, Z. (2021). Molecular analysis of prognosis and immune pathways of pancreatic cancer based on TNF family members. J. Oncol. 2021, 2676996. doi:10.1155/2021/2676996
Glossary
Keywords: pancreatic cancer, tumor microenvironment, prognostic risk model, immunotherapy, therapeutic target
Citation: Nie Y, Xu L, Bai Z, Liu Y, Wang S, Zeng Q, Gao X, Xia X and Chang D (2023) Prognostic utility of TME-associated genes in pancreatic cancer. Front. Genet. 14:1218774. doi: 10.3389/fgene.2023.1218774
Received: 08 May 2023; Accepted: 15 August 2023;
Published: 01 September 2023.
Edited by:
Mehdi Pirooznia, Johnson and Johnson, United StatesReviewed by:
Arya Ashok, Tempus Labs, United StatesQing Lin, Johns Hopkins University, United States
Copyright © 2023 Nie, Xu, Bai, Liu, Wang, Zeng, Gao, Xia and Chang. This is an open-access article distributed under the terms of the Creative Commons Attribution License (CC BY). The use, distribution or reproduction in other forums is permitted, provided the original author(s) and the copyright owner(s) are credited and that the original publication in this journal is cited, in accordance with accepted academic practice. No use, distribution or reproduction is permitted which does not comply with these terms.
*Correspondence: Dongmin Chang, c2RtcXF3QDEyNi5jb20=