 Gabriele Martelloni1Alessio Turchi2
 Chiara Fallerini1,3
 Andrea Degl’Innocenti3Margherita Baldassarri1,3
 Simona Olmi4*
 Simone Furini5
 Alessandra Renieri1,3,6 GEN-COVID Multicenter study
- 1Medical Genetics, University of Siena, Siena, Italy
- 2INAF Osservatorio Astrofisico di Arcetri, Florence, Italy
- 3Department of Medical Biotechnologies, Med Biotech Hub and Competence Center, University of Siena, Siena, Italy
- 4CNR-Consiglio Nazionale delle Ricerche—Istituto dei Sistemi Complessi, Sesto Fiorentino, Italy
- 5Department of Electrical, Electronic and Information Engineering “Guglielmo Marconi”, University of Bologna, Cesena, Italy
- 6Genetica Medica, Azienda Ospedaliero-Universitaria Senese, Siena, Italy
The impact of common and rare variants in COVID-19 host genetics has been widely studied. In particular, in Fallerini et al. (Human genetics, 2022, 141, 147–173), common and rare variants were used to define an interpretable machine learning model for predicting COVID-19 severity. First, variants were converted into sets of Boolean features, depending on the absence or the presence of variants in each gene. An ensemble of LASSO logistic regression models was used to identify the most informative Boolean features with respect to the genetic bases of severity. After that, the Boolean features, selected by these logistic models, were combined into an Integrated PolyGenic Score (IPGS), which offers a very simple description of the contribution of host genetics in COVID-19 severity.. IPGS leads to an accuracy of 55%–60% on different cohorts, and, after a logistic regression with both IPGS and age as inputs, it leads to an accuracy of 75%. The goal of this paper is to improve the previous results, using not only the most informative Boolean features with respect to the genetic bases of severity but also the information on host organs involved in the disease. In this study, we generalize the IPGS adding a statistical weight for each organ, through the transformation of Boolean features into “Boolean quantum features,” inspired by quantum mechanics. The organ coefficients were set via the application of the genetic algorithm PyGAD, and, after that, we defined two new integrated polygenic scores (
1 Introduction
COVID-19 disease, due to its rapid spreading worldwide, has led to the most severe pandemic since the deadly Spanish flu, which killed up to 100 million individuals in the past century. Most COVID-19-affected patients have mild symptoms, but approximately 20% of cases need hospitalization, with symptoms characteristic of severe to critical illness requiring very intensive help. Patients with severe illness are often older and/or have comorbidities (e.g., cardiovascular or chronic respiratory disease, diabetes, hypertension, and cancer). Moreover, the organ involvement turned out to be related to disease severity, even though the correlation is still under clarification Daga et al. (2021); Benetti et al. (2020a), while another factor that ended up being discriminant is gender, with men tending to have a more severe disease respect than women Wu et al. (2020). However, these factors do not fully explain the differences in severity and the fact that the immune responses to SARS-CoV-2 were variable, contributing in some cases to greater morbidity and mortality, due to the excessive inflammatory response Ballow and Haga (2021); Madabhavi et al. (2020).
It is now well-recognized that host genetic factors play a fundamental role in the COVID-19 clinical outcome. Recent advances in genome-wide associations have identified potential candidate genes in certain populations that may modify the host immune responses, leading to dysregulated host immunity. Different pathogenetic mechanisms can be involved as new genetic predisposing factors emerge, such as different immunogenicity/cytokine production capability, as well as receptor permissiveness to virus and antiviral defenses. Genetic defects of the type I interferon pathway are linked to a more clinically severe phenotype of COVID-19, and dysregulation of the adaptive immune system may play a role in the severity and complex clinical course of patients with COVID-19 Ballow and Haga (2021). However, with very few genetic factors identified until now, we are still very far from understanding the real relevance of host genetics. The better understanding of host genetic factors is fundamental to predict patients who are at a risk of severe disease and prevent and/or offer personalized and efficient treatments. Moreover, novel genetic discoveries could also inform therapeutic targets for drug repurposing, a pivotal example of which has been the discovery of homozygous deletions in the CCR5 gene conferring resistance to HIV-1 infection, which led to development of a drug that successfully made it through clinical trials Hütter et al. (2013).
Traditional methods for assessing the genetic bases of complex disorders include genome-wide association studies (GWASs) for common variants and burden tests for rare variants. GWASs focus mainly on common variants and are based on a comparison frequency of about 700,000 genomic single-nucleotide polymorphisms (SNPs) in cases/controls (mostly non-coding). The coverage of the coding SNPs is usually performed throughout imputed data, e.g., imputing 2 million SNPs from 700k SNPs by linkage disequilibrium. The method is based on multiple independent tests and has a high threshold for significance. Moreover, GWASs require sample sizes of ten-hundred thousand subjects COVID-19 Host Genetics Initiative (2021); Severe Covid-19 GWAS Group (2020); Kousathanas et al. (2021); Pairo-Castineira et al. (2021). On the other hand, the burden test is based on an aggregation of rare, protein-altering variants and a comparison between cases and controls. The reason behind the burden test is that grouping variants with a large effect size at a gene level might improve power. Like GWASs, the burden test method needs hundreds of thousands of participants for detection of statistically significant associations Kosmicki et al. (2021). These methods have been employed for many years but failed to fully unravel the complexity of human traits. Complex disorders such as COVID-19 are expected to be regulated by thousands of genes with different weights of contribution Marouli et al. (2017); Boyle et al. (2017). Indeed, in common genetic diseases such as cardiovascular or neurodegenerative disorders, the identified genetic markers were not sufficient for full use in clinical practice to predict and treat the disease.
To overcome these limitations, an interplay between host genetics, computational statistics, and dynamic system theory is necessary. Even though the scientific community has made a big effort to analyze the epidemic data made available by the Center for Systems Science and Engineering at Johns Hopkins University Dong et al. (2020), the applications of mean-field models able to predict the kinetics of the epidemic spreading Martelloni and Martelloni (2020a,b); Lai et al. (2020); Chen et al. (2020); Castorina et al. (2020); Fenga (2021); Fanelli and Piazza (2020); Agosto and Giudici (2020); Bialek et al., 2020; Lanteri et al. (2020) cannot help in identifying the gene variants that determine the risk of severity in order to understand the pathophysiological mechanisms responsible for severe disease in heterogeneous groups of patients. At the contrary, machine learning (ML) approaches offer an innovative tool for managing complex problems by significantly increasing our capacity to identify complex patterns of variations. Using data from the whole exome sequencing (WES), a first line of the ML method, i.e., a LASSO logistic regression, has been applied to extract some thousands of coding genetic features contributing to COVID-19 severity Picchiotti et al. (2021); Fallerini et al. (2022). Subsequent functional validation of extracted features demonstrated that, in each tested case, the association with severity has a biological basis and suggested hints for adjuvant treatment Benetti et al. (2020b); Fallerini et al. (2021b,a); Croci et al. (2022); Baldassarri et al. (2021b,a); Mantovani et al. (2022); Monticelli et al. (2021). Using the extracted features, Fallerini et al. (2022) build a severity score named the integrated polygenic score (IPGS), whose performances reached about 75% for both sensitivity and specificity. In this contribution, we want to improve the IPGS severity score performances, with the aim of increasing both metrics and the understanding of biomolecular mechanisms for personalized treatment using innovative ML methods. More in detail, we start from the same set of coding genetic features contributing to COVID-19 severity, already used in Picchiotti et al. (2021); Fallerini et al. (2022), to build two new severity scores that take into account the phenotype of the analyzed patients, i.e., the set of their observable characteristics or traits. In particular, we take into account, in the definition of the severity scores, the involvement of single organs in the development of the COVID-19 disease and the age of patients when they contract the virus. The contribution of single-organ involvement in developing severe COVID-19 disease and that of the gene frequency variants are estimated through an evolutionary algorithm usually implemented to generate high-quality optimization solutions. The severity scores we propose aim at reducing the enormous amount of data to treat and its complexity through a logistic regression, with the final goal of finding a correlation, for each patient, between the score itself and the severity of the disease registered according to the WHO COVID-19 Outcome Scale. In this way, the severity scores cannot be applied as predictive tools in clinical practice since they both require whole-exome sequencing done, the information on organ involvement, and a first screening through a LASSO logistic regression, which is done to extract the coding genetic features contributing to COVID-19 severity. However, they may help in investigating the relationship between gene variants with different frequencies and the development of severe COVID-19 disease.
The Methods section is devoted to the description of the implemented severity scores and the applied methods. Sec. 3 presents the performances of the new severity scores with respect to the IPGS, while a discussion on the presented results is reported in Section 4.
2 Methods
2.1 Data collection
Two different cohorts (from Italy and Sweden) contributed to this study, as described in detail in Supplementary Table S1. The Institutional Review Board approval was obtained for each study (see Institutional review board statement below). Information on the cohort demography is given in Table 1.
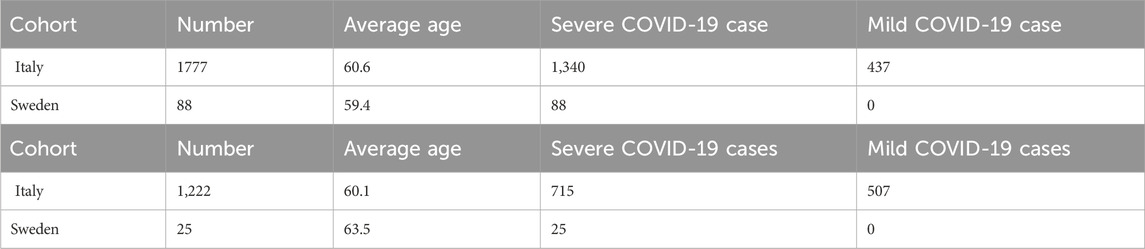
Table 1. Cohort demography information for male (upper table) and female (lower table) patient datasets.
2.1.1 Study participants and recruitment
In order to ensure a collection of samples that could be, as much as possible, comprehensive and representative of the Italian population, hospitals from across Italy, local healthcare units, and departments of preventive medicine have been involved in collecting samples and associated patient-level data for the GEN-COVID Multicenter Study1. The inclusion criteria for the study are as follows: PCR-positive SARS-CoV-2 infection, age ≥18 years, appropriately given informed consent that includes detailed information about the study, and maintaining the confidentiality of personal data. All subjects were positively diagnosed with SARS-CoV-2 and represented a wide range of disease severity, ranging from hospitalized patients with severe COVID-19 disease to asymptomatic individuals. The mean age of patients in the entire cohort is 60.9 years (range 18–99). The patients in the cohort are predominantly men (59.9%) with a mean age of 59.95 years (range 18–99); the mean age of women is 61.8 years (range 19–98). About 30.3% of patients in the cohort have no chronic conditions. The overall case-fatality rate is 2.5% with a mean age of 76.1 years [range 37–98]. Regarding ethnicity, the cohort is composed of 94.25% European, 2.51% Hispanic, 1.09% African, and 2.15% Asian patients. We included all the ethnicities in this study because the results do not depend on population structure-related confounding factors.
2.1.2 Data collection and storage
The socio-demographic information included sex, age, and ethnicity. Information about family history, (pre-existing) chronic conditions, and SARS-CoV-2-related symptoms was collected through a detailed core clinical questionnaire where more than 160 clinical items have been listed (see Supplementary Table S2). Items concerning organ/system involvement (heart, liver, pancreas, kidney, and olfactory/gustatory and lymphoid systems) have been synthesized in a binary mode, where 1 means standard medical parameters indicating specific organ involvement (respiratory severity, taste/smell involvement, heart involvement, liver involvement, pancreas involvement, kidney involvement, lymphoid involvement, blood clotting, cytokine trigger, and a number of comorbidities like asthma, cancer, diabetes, dyslipidemia, hypertension, hypothyroidism, or obesity) and 0 means the absence of involvement of a certain organ/system. Peripheral blood samples were collected in ethylenediaminetetraacetic acid-containing tubes for all subjects, and aliquots of plasma are also available. Whenever possible, leukocytes were isolated from whole blood by density gradient centrifugation and stored in the dimethyl sulfoxide solution and frozen using liquid nitrogen. For the majority of the cohort, swab specimens are also available and stored at the reference hospitals. For more information on data collection and storage, refer to Benetti et al. (2020a); Daga et al. (2021).
2.1.3 Phenotype definitions
COVID-19 severity has been assessed using a modified version of the WHO COVID-19 Outcome Scale (COVID-19 Therapeutic Trial Synopsis 2020); specifically six classification levels have been used to code for the severity: (5) death; (4) hospitalized, receiving invasive mechanical ventilation; (3) hospitalized, receiving continuous positive airway pressure or bilevel positive airway pressure ventilation; (2) hospitalized, receiving low-flow supplemental oxygen; (1) hospitalized, not receiving supplemental oxygen; and 0 not hospitalized. The number of patients present in each phenotype category of this six-level classification (termed GRADING5) is reported in Table 2. Through the application of the presented severity scores, this six-level classification will be reduced to three different classifications: i) a binary classification of patients into mild and severe cases (termed GRADING2), where a patient is considered severe if hospitalized and receiving any form of respiratory support (WHO severity grading equal to 4 or higher in six-point classification); ii) a three-level classification (termed GRADING3), where the patients are classified into non-hospitalized (WHO severity grading equal to 0 or 1), hospitalized and not receiving supplemental oxygen or receiving low-flow oxygen (WHO severity grading equal to 2 or 3), and patients with severe disease (WHO severity grading equal to 4 or higher); iii) a five-level classification (termed GRADING4), where the patients are classified into non-hospitalized (WHO severity grading equal to 0), hospitalized and not receiving supplemental oxygen (WHO severity grading equal to 1) or receiving low-flow oxygen (WHO severity grading equal to 2), hospitalized, receiving continuous positive airway pressure (WHO severity grading equal to 3), hospitalized, receiving invasive mechanical ventilation or dead (WHO severity grading equal to 4, 5).
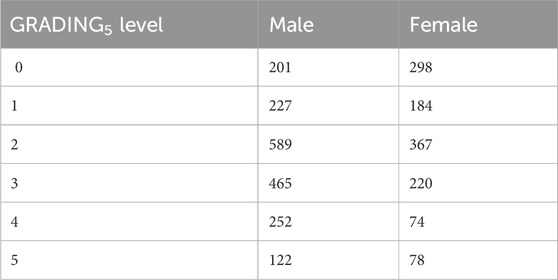
Table 2. Numbers of patients present in each phenotype category for GRADING5.
2.1.4 GEN-COVID cohort
Within the GEN-COVID Multicenter Study, biospecimens from more than 3,000 SARS-CoV-2-positive individuals were collected in the GEN-COVID Biobank (GCB) and used for identifying multi-organ involvement in COVID-19, defining genetic parameters for infection susceptibility within the population and mapping genetically COVID-19 severity and clinical complexity among patients. In particular, within the GEN-COVID Multicenter Study, about 3,000 patients were sequenced by whole-exome sequencing (WES) and partly (about 2,000) already included in the model described in Fallerini et al. (2022). WES with at least 97% coverage at 20x was performed using the Illumina NovaSeq 6000 System (Illumina, San Diego, CA, United States). Library preparation was performed using the Illumina Exome Panel (Illumina) according to the manufacturer’s protocol. Library enrichment was tested by qPCR, and the size distribution and concentration were determined using the Agilent Bioanalyzer 2100 (Agilent Technologies, Santa Clara, CA, United States). The NovaSeq 6000 System (Illumina) was used for DNA sequencing through 150 bp paired-end reads. Variant calling was performed according to the GATK4 (O’Connor and Auwera 2020) best practice guidelines, using BWA (Li and Durbin 2010) for mapping and ANNOVAR (Wang et al., 2010) for annotating.
2.1.5 Swedish cohort
Whole-exome sequencing was performed using the Twist Bioscience exome capture probe and was sequenced on the Illumina NovaSeq 6000 platform. Data were then analyzed using the McGill Genome Center bioinformatics pipeline (https://doi.org/10.1093/gigascience/giz037) in accordance with GATK best practices.
2.2 Post-Mendelian paradigm for COVID-19 modelization
Fallerini et al. (2022) have developed an easily interpretable model that could be used to predict the severity of COVID-19 from host genetic data. Patients were considered severe when hospitalized and receiving any form of respiratory support. The focus on this target variable is motivated by the practical importance of rapidly identifying patients who are more likely to require oxygen support, in an effort to prevent further complications. The complexity of COVID-19 immediately suggests that both common and rare variants are expected to contribute to the likelihood of developing a severe form of the disease. However, the weight of contribution of common and rare variants to the severe phenotype is not expected to be the same. A single rare variant that impairs protein function might cause a severe phenotype by itself after viral infection, while this is not so probable for a common polymorphism, which is likely to have a less marked effect on protein functionality. These observations led to the definition of a score, named integrated polygenic risk score (IPGS), which includes data regarding the variants at different frequencies:
In this equation, the n variables indicate the number of input features of the predictive model that promote the severe outcome (superscript s) or protect from a severe outcome (superscript m) and with genetic variants having minor allele frequency (MAF)
2.3 First phenotype-based IPGS (
To improve the ability of the IPGS to predict the severity of the disease, while keeping the linearity of the formula, we first apply vectorial formulation, where both the Boolean variables of the individual patients and the Boolean variables of the single variants are transformed into vectors with components 0 or 1. To each patient and each single variant is associated a vector, which has univocally defined non-zero components: the non-zero components of the patient vector pi and the variants vector
where Ff is the coefficient representing the frequency of the variants, as shown in Eq. 1, and the subscript f identifies either common, low-frequency, rare, and ultra-rare variants. As introduced before, pi represents the single patient vector, while
2.4 Second phenotype-based IPGS (
Inspired by quantum mechanics, we try to generalize the severity score presented in Eq. 2, explicitly introducing in the formula the age of each patient and leaving the possibility, thanks to the quantum mechanics formalism, to introduce into the new severity score expression more general phenotype definitions. For a brief introduction to the quantum mechanics formalism, see Sec. 2 of the Supplementary Material. Borrowing the formalism of quantum mechanics, we use the following elements to construct the second severity score
• The patient is described in terms of a vector |p >, which represents a state in quantum mechanics and describes the condition of the single human being.
• The genetic variants are also expressed in terms of vectors
• The organs can be considered the physical observable O, whose expectation value represents our quantum-like
• The time related to the evolution operator represents the patient’s age.
• The mild or severe variants can be represented through a spin variable s which takes values 1/2 or −1/2.
In order to better clarify the role played by each single element in the severity score, we explicitly write down the values we assign to the new Boolean variables. More in detail, we can distinguish the state of the single i − th patient via assigning a sequence of values
where H(t) is the Hamiltonian operator and
We can perform subsequent approximations along two different lines: either i) we suppose that the vectors of the variants are eigenvalues of the Hamiltonian H(t), or ii) we perform the infinite time limit of the system. In the first case, if we assume that Ei represents the eigenvalue of the Hamiltonian H(t) related to the precise state
In the latter case, the limit t → ∞ corresponds to the assumption that the patient has contracted COVID-19 and his/her status is characterized by a small number of variants that are only those relevant to the contraction/development of the disease. The small set of variants that are related to the disease and influence the clinic outcome of the patients can be called variants of the saddle point Caux (2016) and identified with
In both Eqs. 3, 4, the term
The severity score in Eq. 1 turns out to be corrected by a form factor that constitutes either the expectation value of the organs on the state of all genes, weighted with the age in Eq. 3, or the interplay between the variants of the genes, known to be associated to viral susceptibility and disease severity and patient status in Eq. 4. While the form factor present in Eq. 3 can be easily interpreted as the clinical status of the patient, where organs correlate with the genetic variants, the form factor in Eq. 4 has a more complex interpretation. Somehow, the vector
To summarize, although in the work of Fallerini et al. (2022) the presence or absence of a genetic variant is identified through a Boolean variable 1 or 0, essentially a bit of information, in the present work, in order to maintain the linearity of the problem, we define a quantum bit to identify the presence/absence of a variant. Therefore, we pass from a scalar variable (1 or 0) to a spin variable, thus allowing us to linearly increase the parameter space and improve the prediction of disease severity. Furthermore, being a multifactorial disease, when defining a score in terms of matrix variables, we are able to take age, sex, and organ involvements into account at the same time. In this respect, the mathematics of quantum mechanics seems the ideal environment to describe this type of problem. However, we are just using a quantum-like formalism when replacing Boolean variables with matrices, but we are not introducing any quantum feature in the machine learning algorithm. Irrespective of the fact that we have just taken inspiration from quantum mechanics, since in the previous definitions of
2.5 The genetic algorithm PyGAD
The genetic algorithm is a method for solving both constrained and unconstrained optimization problems that are inspired by natural selection, the process that drives biological evolution. In a genetic algorithm, we start with an initial population of chromosomes, which are possible solutions to a given problem. Those chromosomes consist of an array of genes whose values vary in a predefined range. The whole optimization problem is encoded into a fitness function, which receives a chromosome and returns a number that tells the fitness (or goodness) of the solution. The higher the fitness, the better the solution encoded in the chromosome. The genetic algorithm repeatedly modifies a population of individual solutions. At each step, the genetic algorithm selects individuals from the current population to be parents and uses them to produce the children for the next generation. At each iteration (generation), a number of good chromosomes are selected for breeding (parent selection). Parents are combined two-by-two (crossover) to generate new chromosomes (children). The children are finally mutated by (randomly) modifying part of their genes, allowing for completely new solutions to emerge. Over successive generations, the population “evolves” toward an optimal solution, as it is shown in the flow chart of a genetic algorithm (GA) in Figure 1.
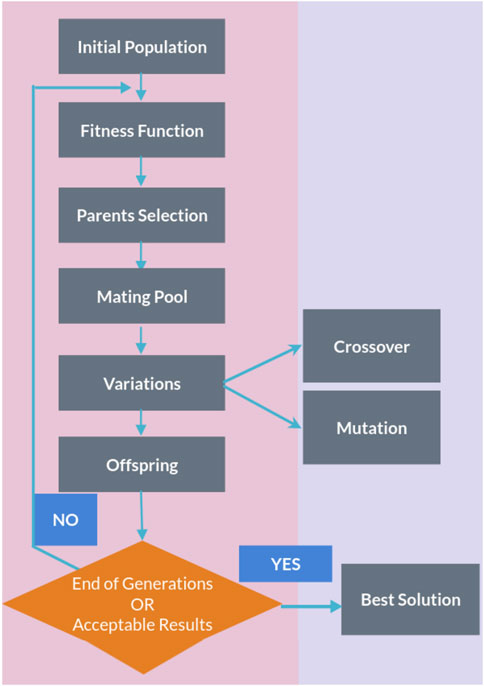
Figure 1. Flow chart of a genetic algorithm.
The genetic algorithm is usually applied to solve problems in which the objective function is discontinuous, non-differentiable, stochastic, or highly non-linear. Among the genetic algorithms, we find PyGAD, an open-source Python library Gad (2021), which supports a wide range of parameters to give the user control over everything in its cycle of operations (see Figure 2).
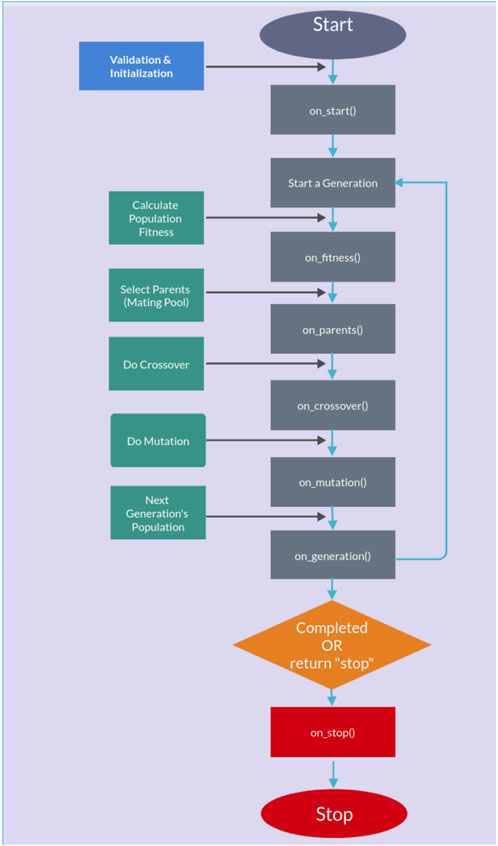
Figure 2. PyGAD lifecycle.
2.5.1 Testing and training procedures
The dataset was randomly divided into a training set and a test set (50/50) for a total of 3,112 patients. In other words, half of the subjects (1,552) were used for training the model, and the remaining half (1,560) are used for testing the model. Patients are chosen randomly to be grouped into the training or the testing set, and the random sampling is varied across the study. Letting the algorithm perform training over a limited set of patients (50%) randomly chosen may potentially diminish the performances of the scores but allows for a more general solution, which is not limited to the particular set chosen for the training/test. The PyGAD algorithm was implemented with the following characteristics in order to converge to a stable solution:
• Number of solutions (i.e., chromosomes) within the population = 32.
• Number of generations 250–500.
• Number of solutions to be selected as parents = 8.
• Parent selection type = sss (for steady-state selection). In the sss case, only a few individuals are replaced at a time, meaning most of the individuals will carry out to the next generation.
• Number of parents to keep in the current population = 1.
• Crossover operation = single_point (for single-point crossover). All genes to the right of that point are swapped between the two parent chromosomes. This results in two offspring, each carrying some genetic information from both parents.
• Type of the mutation operation = random (for random mutation).
• The probability of selecting a gene for applying the mutation operation = 0.2 (for each gene in a solution, a random value with probability 20% is generated).
In most part of the developed training/testing tests, the number of generations able to guarantee a convergence of the solution is 250. We considered a converged solution to be one that has reached an asymptotic value within the duration of the test.
The training/testing procedure, for each severity score, was implemented separately on the male and female patient datasets. The whole procedure is made up of two parts, both used on the testing and training samples. In the first part, we let the genetic algorithm run over the training sample to fit the parameters of the severity scores in Eqs. 2, 3 that produce the best estimate of the N-level classification of patient severity (i.e., GRADINGN parameter). In particular, in this training process, the statistical weights for different organs are calculated without applying any constraint in the fitting process: we do not consider, for example, the possibility that the involvement of certain organs might lead to worse outcomes when compared to that by others. Then,
3 Results
The severity scores in Eqs. 2, 3 are used, together with the GRADINGN data, for training a model that predicts COVID-19 severity. In particular, the training procedure is devoted to fitting the parameters that are present in the severity score equations: 17 free parameters for Eqs. 2 and 18 free parameters for Eq. 3. Fitting the parameters will allow us to assess, for each patient, the level of severity of his/her COVID-19 infection, in terms of
To obtain the best possible fit, we have implemented the genetic algorithm PyGAD with the following step fitness function:
• We assign a reward 50 in case the obtained score value is
• We assign a reward 5 in case the obtained score value is
• We assign 0 otherwise.
The reward values are chosen without lack of generality: we have assigned a sufficiently big reward value when the algorithm is able to predict the right GRADINGN value, a small but non-zero reward value when the prediction is not too far from the right value and a 0 reward value when the prediction is completely wrong. Any other set of reward values chosen according to this principle, which ensures the convergence of the solution, will give comparable results.
3.1 GRADING2
First, we present the results related to GRADING2, where we have reduced the severity scores to a binary classification of patients into mild and severe cases, considering a patient severe (GRADING2 = 1) if hospitalized and receiving any form of respiratory support or healthy (GRADING2 = 0) in all the other cases. The number of patients present in each phenotype category for GRADING2 is reported in Table 3.

Table 3. Numbers of patients present in each phenotype category for GRADING2.
Furthermore, a multivariable logistic regression was fitted using possible inputs
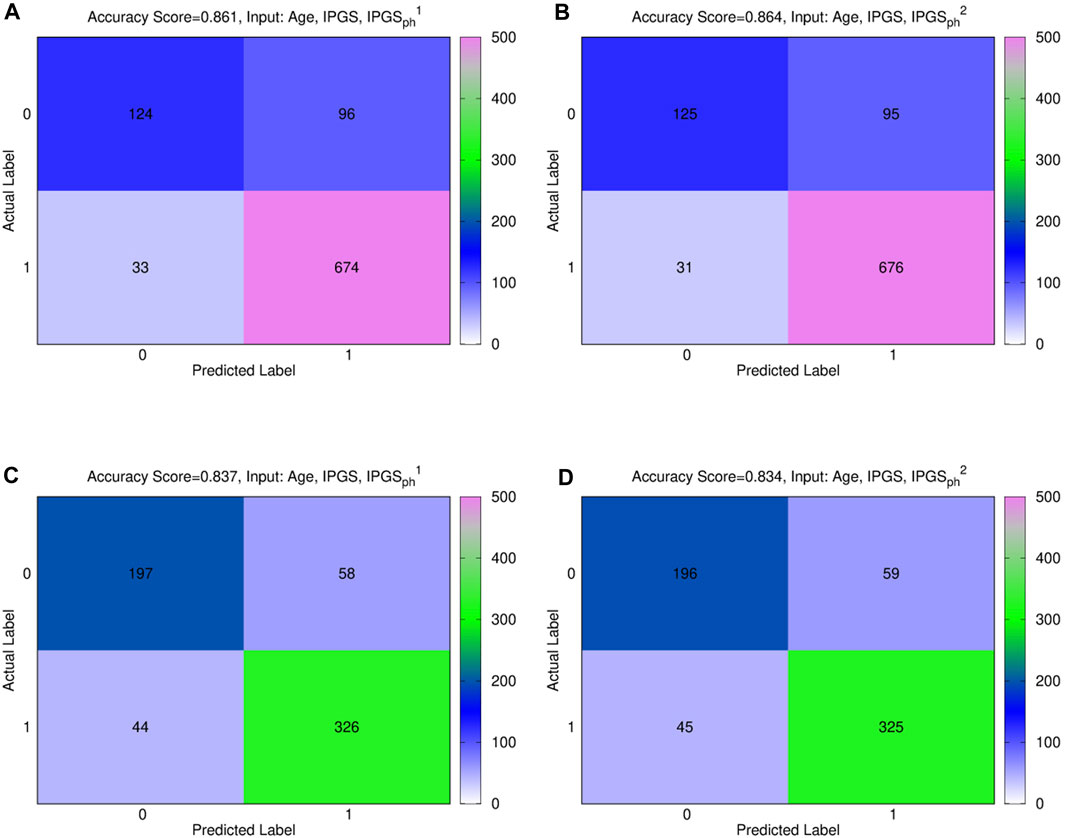
Figure 3. (A), (B) confusion male matrix from logistic regression. (A) Input: age, IPGS, and
In order to confirm the goodness of the results previously shown, we evaluate the increase in the performances of the severity score, as shown in Eqs. 2, 3, with respect to the performances of a model where the values of the
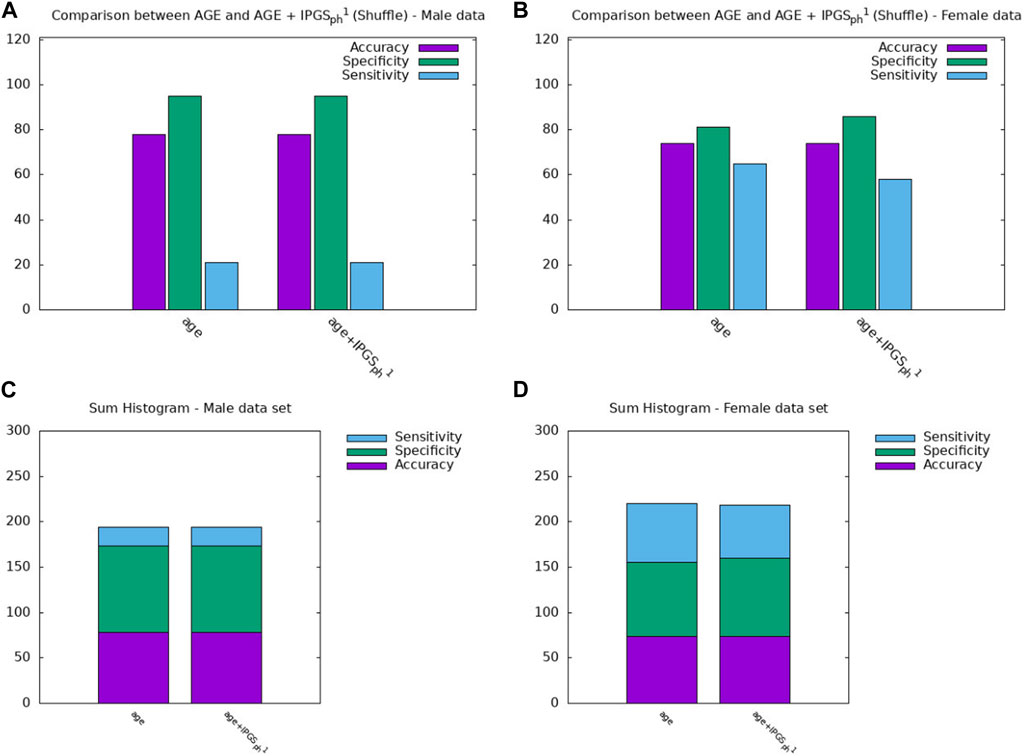
Figure 4. Comparison between the results obtained from a logistic regression with in input age or age+IPGS1 with shuffled variants for the (A,C) male sample and the (B,D) female sample.
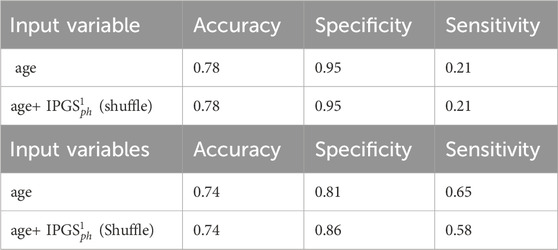
Table 4. Accuracy, sensitivity, and specificity scores resulting from the logistic regression for GRADING2. The table above (below) shows the results obtained from the male (female) patient dataset.
In order to further investigate the role played by age and other factors that seem to be discriminant, i.e., sex, in comparison with the new severity scores presented here, we report a comparison between the performances of the logistic regression when the predictor variables in the input are (age + sex), (age + sex + IPGS), or (age + sex + IPGS +
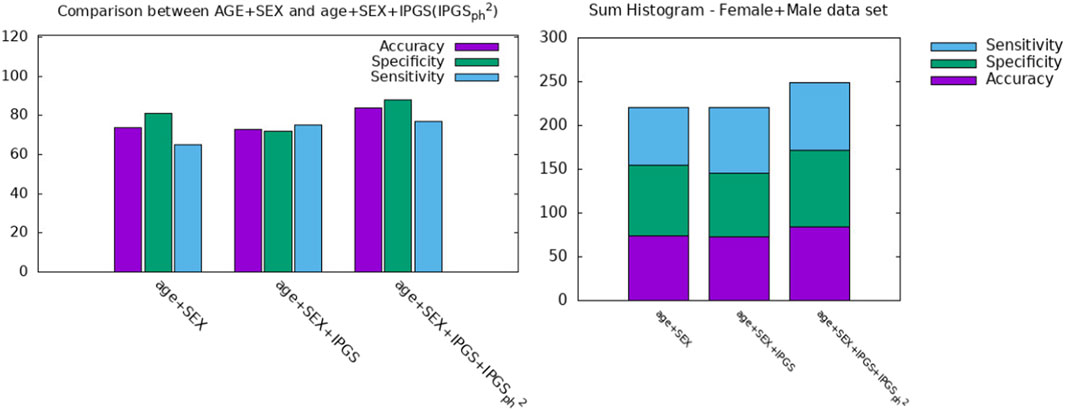
Figure 5. Comparison between AGE + SEX, AGE + SEX + IPGS, and AGE + SEX + IPGS+
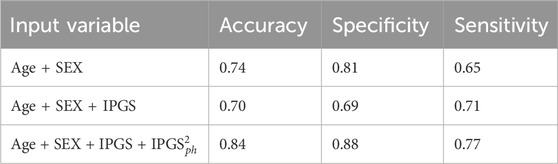
Table 5. Accuracy, sensitivity, and specificity scores resulting from the logistic regression on both female and male patient datasets for GRADING2.
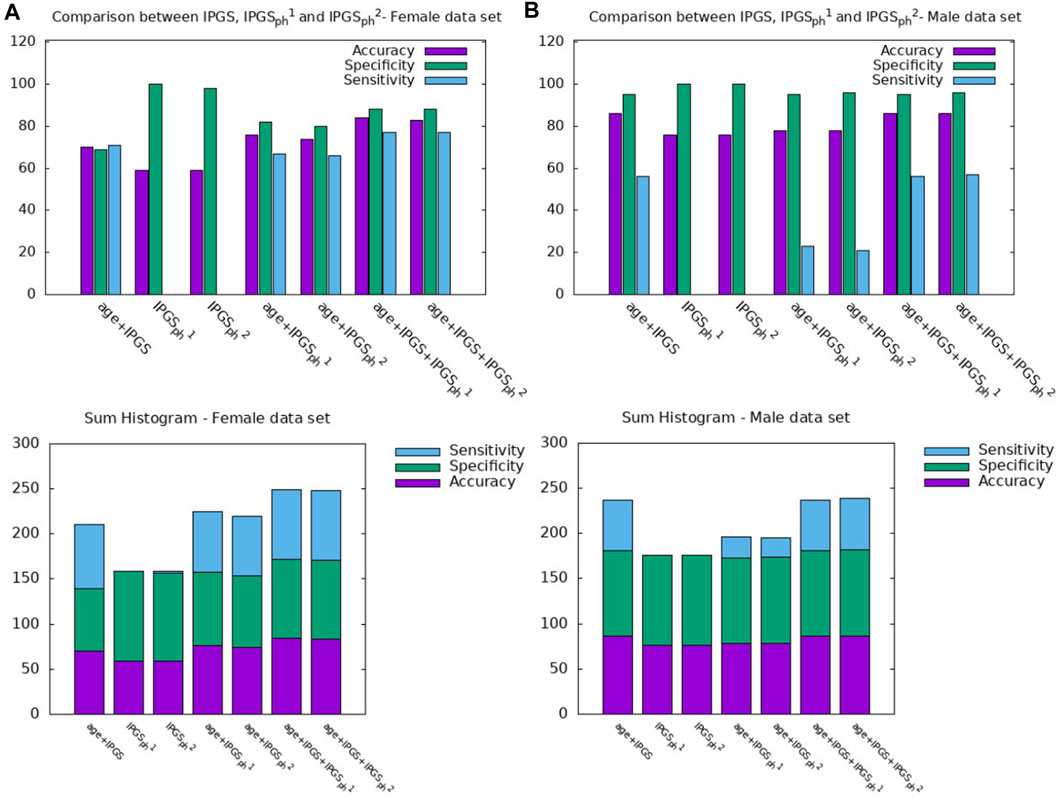
Figure 6. Comparison between IPGS,
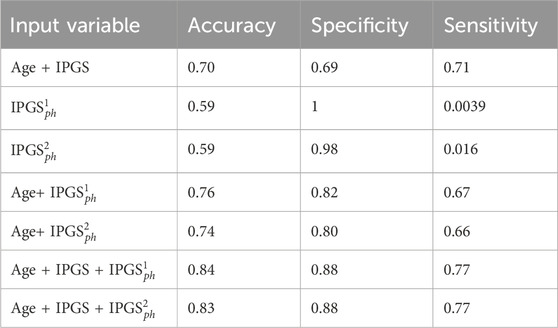
Table 6. Accuracy, sensitivity, and specificity scores resulting from the logistic regression on the female patient dataset for GRADING2.
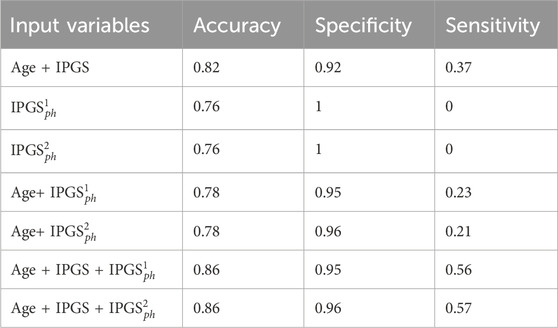
Table 7. Accuracy, sensitivity, and specificity scores resulting from the logistic regression on the male patient dataset for GRADING2.
Since the applied method is stochastic, for completeness, we also report the accuracy, sensitivity, and specificity scores averaged over the different training and testing tests that we specify for the case where the logistic regression has inputs (age, IPGS, and
Therefore age, genetic variants, and organ involvements seem to all concur and contribute to the amount of information necessary to reach good levels of sensitivity and accuracy scores (
Finally, we spend some words on the comparison between
However, it is clear that the information on the organ involvement is independent of the chosen severity score model and that the genetic PyGAD algorithm works very well in highlighting this aspect. The proposed severity scores perform comparably within the same sample data because they are both able to convey all the relevant information from the clinical data collection, even though they are derived from different principles and are functionally different.
3.2 GRADING3
In this second part of the section, we present the results related to GRADING3, where we have reduced the severity scores to a three-level classification of patients into non-hospitalized (GRADING3 = 0), hospitalized but not receiving supplemental oxygen or receiving low-flow oxygen (GRADING3 = 1), and patients with severe disease (GRADING3 = 2). In this last case, patients are considered to manifest a severe disease when they are hospitalized and receiving intensive or invasive respiratory support or are dead. The number of patients present in each phenotype category for GRADING3 is reported in Table 8.
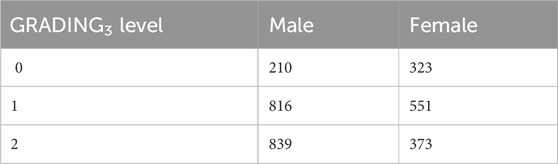
Table 8. Number of patients present in each phenotype category for GRADING3.
Figure 7 shows the confusion matrices for the male (panels (a) and (b)) and female (panels (c) and (d)) patient datasets, where the best fit is presented for both sets. The results are relative to a logistic regression with multiple predictor variables used as inputs: age, IPGS, and
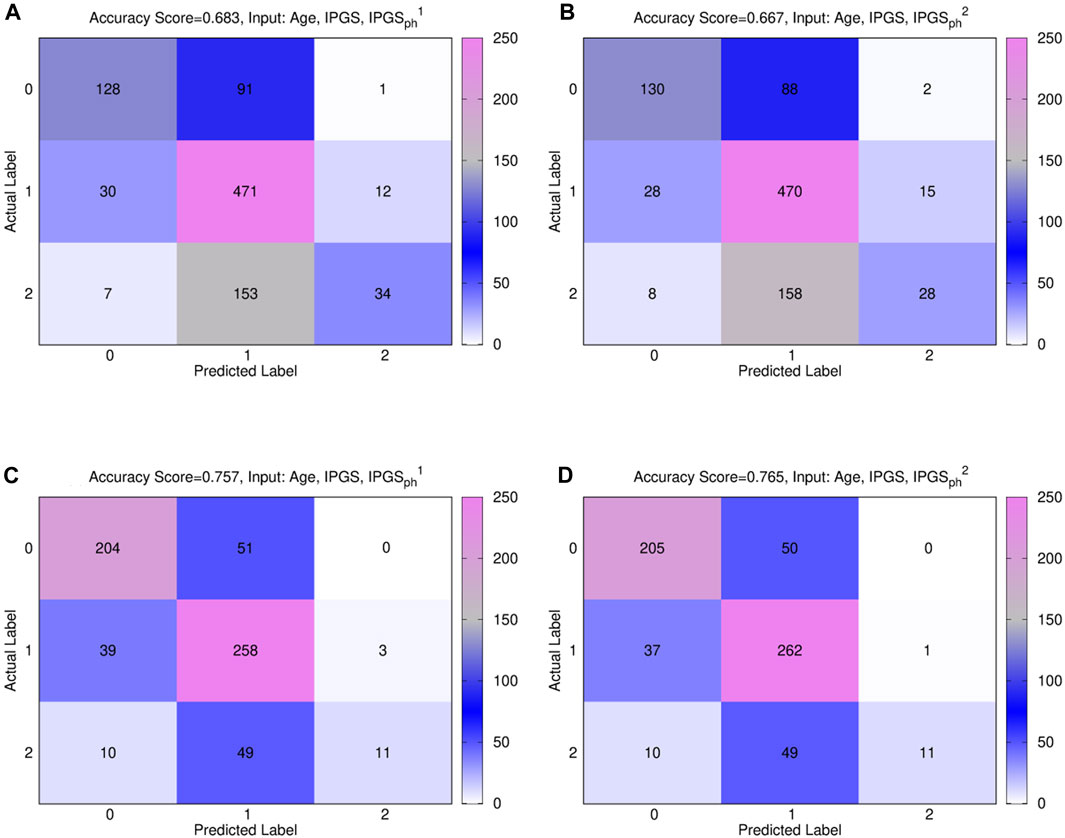
Figure 7. Comparison between
In general, the accuracy reached in each case for GRADING3 is lower than the accuracy reached for GRADING2, as shown in Figure 3, due to binning limitations. If we look in detail at the confusion matrices shown in Figure 7, it turns out that the biggest errors are done in two cases: i) when we have to predict 0 and we predict 1; ii) when we have to predict 2 and we predict 1. Probably the information that we have on the clinical framework of each patient is not optimized for distinguishing between low and severe disease, thus explaining why the GRADING2 was performing better since the algorithm was not required to distinguish between low and severe disease for GRADING2, but all the hospitalized patients were treated in the same way. A general comparison of the performances of the logistic regression on GRADING3 is shown in Tables 9, 10 for the female and male patient datasets, respectively. Analogously to the results obtained for GRADING2, the performances are enhanced when calculating the logistic regression on age, IPGS, and
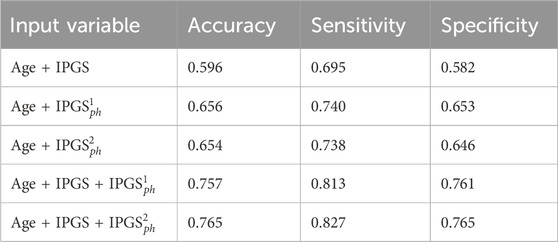
Table 9. Accuracy, sensitivity, and specificity scores resulting from the logistic regression on the female patient dataset for GRADING3. The calculation of precision and sensitivity is done by applying the sklearn.metrics module Pedregosa et al. (2011); Kramer and Kramer (2016) in Python. The algorithm calculates the metrics for each label and finds their average scores, weighted by the number of true instances for each label.
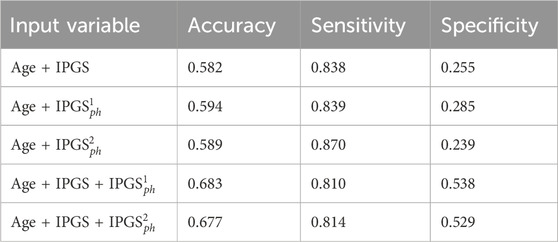
Table 10. Accuracy, sensitivity, and specificity scores resulting from the logistic regression on the male patient dataset for GRADING3. The calculation of precision and sensitivity is done by applying the sklearn.metrics module Pedregosa et al. (2011); Kramer and Kramer (2016) in Python. The algorithm calculates the metrics for each label and finds their average scores, weighted by the number of true instances for each label.
3.3 GRADING4
We finally present the results related to GRADING4, where we have applied the WHO severity grading in five points to classify the patients, merging the classes (4) and (5). The number of patients present in each phenotype category for GRADING4 is reported in Table 11.

Table 11. Number of patients present in each phenotype category for GRADING4.
Figure 8 shows the confusion matrices for the male (panels (a)) and female (panels (b)) patient datasets, where the best fit is presented for both sets. The results are relative to a logistic regression with multiple predictor variables are used as inputs: age, IPGS, and
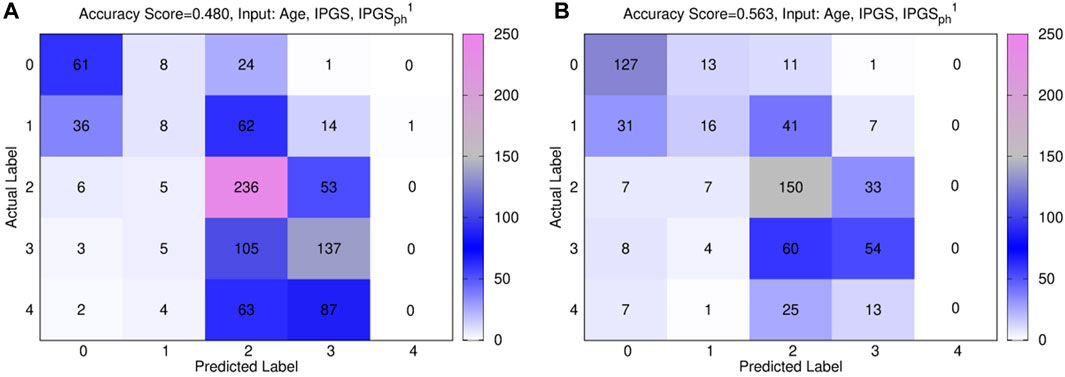
Figure 8. Confusion matrices obtained from the logistic regression of the single scores with age, IPGS, and
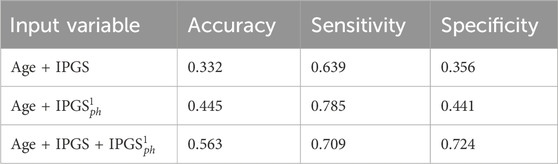
Table 12. Accuracy, specificity, and sensitivity scores resulting from a logistic regression on the female patient dataset for GRADING4. The calculation of specificity and sensitivity is done by applying the sklearn.metrics module Pedregosa et al. (2011); Kramer and Kramer (2016) in Python. The algorithm calculates the metrics for each label and finds their average scores, weighted by the number of true instances for each label.
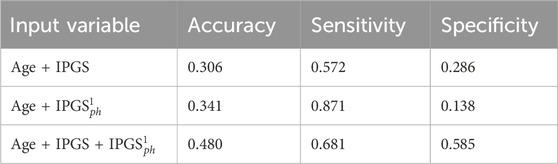
Table 13. Accuracy, specificity, and sensitivity scores resulting from a logistic regression on the male patient dataset for GRADING4. The calculation of specificity and sensitivity is done by applying the sklearn.metrics module Pedregosa et al. (2011); Kramer and Kramer (2016) in Python. The algorithm calculates the metrics for each label and finds their average scores, weighted by the number of true instances for each label.
In general, the accuracy reached in each case for GRADING4 is lower than those reached for both GRADING2 and GRADING3. If we look in detail at the confusion matrices presented in Figure 8, the biggest errors are related to the false-positive values detected for classes 3 and 4. While the algorithm seems to identify quite well the classes 0, 1, and 2, more difficulties are encountered when it comes to distinguishing between the class levels relative to severe disease. Finally, if we compare the results of the logistic regression performed with (age and IPGS) as inputs with those obtained with inputs (age, IPGS, and
4 Conclusion
In this article, we have presented two severity scores that, starting from the integrated polygenic score (IPGS) introduced in Fallerini et al. (2022), integrate the phenotype of the analyzed patients in order to improve the accuracy, sensitivity, and specificity performances registered by the IPGS. The performances of the proposed methods, based on a combination of clinical and genetic information, are higher than the performances of methods based on genetic information alone, as testified by the results of the logistic regression with age+
However, since both our scores include information about organ involvements, which are available only in the course of the viral infection, these scores cannot be used as predictive tools in the general population, thus resulting as the main limitation of the study. Another limitation of this study is that the estimated performances are likely an overestimation of the predictive performances in a completely independent cohort, i.e., one that is not used to identify the genetic features to be used in the IPGS score. However, this limitation does not affect the main result of the study, which is the comparison in performances between IPGS and the new proposed scores. Irrespectively of the scores’ inability to make predictions on phenotype information since the information on the clinical history of each patient is needed to train the model, it is possible to profit from severity scores when investigating the role played by genetic variants in influencing the host response. The coefficients Ff representing the frequency of the variants as well as the sign α of the mild variants remain coefficients to be fitted through the ML algorithm. In this way, we could explore and test different possibilities, such as different Ff coefficients weighting the contribution of different variants (while in Fallerini et al. (2022), Ff was assumed to be all equal to 1), or different signs for the mild variants, thus releasing the hypothesis that mild variants are always protective.
The development of a tool able to predict, prior to viral infection, if one will be severely affected would have a tremendous impact on the social life and world economy, improving our capability of treatment and thus reducing mortality. In this view, the COVID-19 disease represents an ideal scenario for developing methods that could be used for other complex disorders since, compared to other complex disorders, in COVID-19, the environmental trigger is well-known (e.g., SARS-CoV-2 infection).
Data availability statement
Publicly available datasets were analyzed in this study. Sequencing data have been deposited in CINECA through http://www.nig.cineca.it/, specifically, http://nigdb.ext.cineca.it/, in the COVID-19 section through https://www.nig.cineca.it/?page_id=25. There are no restrictions on data access. Only registration is needed. A section dedicated to COVID-19 samples has been created within the NIG database (http://nigdb.ext.cineca.it/) that provides variant frequencies as a free tool for both clinicians and researchers. The GEN-COVID Biobank (GCB), a collection of biospecimens from patients affected by COVID-19, and the associated GEN-COVID Patient Registry (GCPR) were established and maintained at the University of Siena using the infrastructure of an already well-established biobank (est. 1998) (http://www.biobank.unisi.it/). The data and samples housed in the GEN-COVID Patient Registry and the GEN-COVID Biobank are available for consultation. For consultation, you may contact the last author, AR (e-mail:YWxlc3NhbmRyYS5yZW5pZXJpQHVuaXNpLml0). The data from high-density (700k) SNP genotyping are also generated on the same cohort and shared with international collaborations, including the COVID-19 Host Genetics Initiative (https://www.covid19hg.org/) and with GoFAIR VODAN [COVID-19 Host Genetics Initiative. The COVID-19 Host Genetics Initiative, a global initiative to elucidate the role of host genetic factors in susceptibility and severity of the SARS-CoV-2 virus pandemic. Eur J Hum Genet. 2020;28:715–8]
Ethics statement
The studies involving humans were approved by the Institutional Review Board (IRB). The GEN-COVID is a multi-center academic observational study that was approved by the IRB of each participating center (protocol code no. 16929, dated 16 March 2020 for GEN-COVID at the University Hospital of Siena). The studies were conducted in accordance with the local legislation and institutional requirements. The participants provided their written informed consent to participate in this study. Written informed consent was obtained from the individual(s) for the publication of any potentially identifiable images or data included in this article.
Author contributions
GM: formal analysis, investigation, software, visualization, and writing–original draft. AT: formal analysis, investigation, software, visualization, and writing–original draft. CF: data curation, project administration, and writing–original draft. AD: data curation and writing–original draft. MB: data curation and writing–original draft. SO: supervision, validation, visualization, and writing–review and editing. SF: supervision, validation, and writing–review and editing. AR: funding acquisition, project administration, resources, supervision, validation, and writing–review and editing.
GEN-COVID Multicenter study (https://sites.google.com/dbm.unisi.it/gen-covid)
Francesca Mari, Sergio Daga, Ilaria Meloni, Mirella Bruttini, Susanna Croci, Mirjam Lista, Debora Maffeo, Elena Pasquinelli, Giulia Brunelli, Kristina Zguro, Viola Bianca Serio, Enrica Antolini, Simona Letizia Basso, Samantha Minetto, Giulia Rollo, Martina Rozza, Angela Rina, Rossella Tita, Maria Antonietta Mencarelli, Caterina Lo Rizzo, Anna Maria Pinto, Francesca Ariani, Francesca Montagnani, Mario Tumbarello, Ilaria Rancan, Massimiliano Fabbiani, Francesco Bianchi, and Nicola Picchiotti (Medical Genetics, University of Siena, Siena, Italy; Med Biotech Hub and Competence Center, Department of Medical Biotechnologies, University of Siena, Siena, Italy; Genetica Medica, Azienda Ospedaliero-Universitaria Senese, Siena, Italy; Department of Medical Sciences, Infectious and Tropical Diseases Unit, Azienda Ospedaliera-Universitaria Senese, Siena, Italy); Elena Bargagli, Laura Bergantini, Miriana d’Alessandro, Paolo Cameli, and David Bennett (Unit of Respiratory Diseases and Lung Transplantation, Department of Internal and Specialist Medicine, University of Siena, Siena, Italy); Federico Anedda, Simona Marcantonio, Sabino Scolletta, and Federico Franchi (Department of Emergency and Urgency, Medicine, Surgery, and Neurosciences, Unit of Intensive Care Medicine, Siena University Hospital, Siena, Italy); Maria Antonietta Mazzei and Susanna Guerrini (Department of Medical, Surgical, and Neurosciences and Radiological Sciences, Unit of Diagnostic Imaging, University of Siena, Italy); Edoardo Conticini, Luca Cantarini, and Bruno Frediani (Rheumatology Unit, Department of Medicine, Surgery and Neurosciences, University of Siena, Policlinico Le Scotte, Italy); Danilo Tacconi, Chiara Spertilli Raffaelli, and Arianna Emiliozzi (Department of Specialized and Internal Medicine, Infectious Diseases Unit, San Donato Hospital Arezzo, Italy); Marco Feri, Alice Donati (Department of Emergency, Anesthesia Unit, San Donato Hospital, Arezzo, Italy); Raffaele Scala and Luca Guidelli (Department of Specialized and Internal Medicine, Pneumology Unit and UTIP, San Donato Hospital, Arezzo, Italy); Genni Spargi and Marta Corridi (Department of Emergency, Anesthesia Unit, Misericordia Hospital, Grosseto, Italy); Cesira Nencioni and Leonardo Croci (Department of Specialized and Internal Medicine, Infectious Diseases Unit, Misericordia Hospital, Grosseto, Italy); Gian Piero Caldarelli (Clinical Chemical Analysis Laboratory, Misericordia Hospital, Grosseto, Italy); Davide Romani, Paolo Piacentini, Maria Bandini, Elena Desanctis, and Silvia Cappelli (Dipartimento di Prevenzione, Azienda Usl Toscana sud est, Italy); Anna Canaccini, Agnese Verzuri, Valentina Anemoli, and Manola Pisani (Dipartimento Tecnico-Scientifico Territoriale, Azienda Usl Toscana sud est, Italy); Agostino Ognibene, Maria Lorubbio, and Alessandro Pancrazzi (UOC Laboratorio Analisi Chimico Cliniche, Arezzo, Italy); Massimo Vaghi (Chirurgia vascolare, Ospedale Maggiore di Crema, Italy); Antonella D’Arminio Monforte, and Federica Gaia Miraglia (Department of Health Sciences, Clinic of Infectious Diseases, ASST Santi Paolo e Carlo, University of Milan, Italy); Mario U. Mondelli, Stefania Mantovani, Raffaele Bruno, Marco Vecchia, and Marcello Maffezzoni (Division of Clinical Immunology—Infectious Diseases, Department of Medicine, Fondazione IRCCS Policlinico San Matteo, Pavia, Italy; Department of Internal Medicine and Therapeutics, University of Pavia, Pavia, Italy); Enrico Martinelli (Department of Respiratory Diseases, Azienda Ospedaliera di Cremona, Cremona, Italy); Massimo Girardis, Stefano Busani, and Sophie Venturelli (Department of Anesthesia and Intensive Care, University of Modena and Reggio Emilia, Modena, Italy); Andrea Cossarizza (Department of Medical and Surgical Sciences for Children and Adults, University of Modena and Reggio Emilia, Modena, Italy); Andrea Antinori and Alessandra Vergori (HIV/AIDS Department, National Institute for Infectious Diseases, IRCCS, Lazzaro Spallanzani, Rome, Italy); Stefano Rusconi, Matteo Siano, Arianna Gabrieli, and Agostino Riva (III Infectious Diseases Unit, ASST-FBF-Sacco, Milan, Italy; Department of Biomedical and Clinical Sciences Luigi Sacco, University of Milan, Milan, Italy); Daniela Francisci, Elisabetta Schiaroli, and Carlo Pallotto (Infectious Diseases Clinic, “Santa Maria della Misericordia” Hospital, University of Perugia, Perugia, Italy); Saverio Giuseppe Parisi, and Monica Basso (Department of Molecular Medicine, University of Padova, Italy); Sandro Panese and Stefano Baratti (Clinical Infectious Diseases, Mestre Hospital, Venezia, Italy); Pier Giorgio Scotton, Francesca Andretta, and Mario Giobbia (Department of Infectious Diseases, Treviso Hospital, Local Health Unit 2 Marca Trevigiana, Treviso, Italy); Renzo Scaggiante and Francesca Gatti (Infectious Diseases Clinic, ULSS1, Belluno, Italy); Francesco Castelli, Eugenia Quiros-Roldan, and Melania Degli Antoni (Department of Infectious and Tropical Diseases, University of Brescia and ASST Spedali Civili Hospital, Brescia, Italy); Isabella Zanella (Department of Molecular and Translational Medicine, University of Brescia, Italy; Clinical Chemistry Laboratory, Cytogenetics and Molecular Genetics Section, Diagnostic Department, ASST Spedali Civili di Brescia, Italy); Matteo della Monica and Carmelo Piscopo (Medical Genetics and Laboratory of Medical Genetics Unit, A.O.R.N. “Antonio Cardarelli,” Naples, Italy); Mario Capasso, Roberta Russo, Immacolata Andolfo, Achille Iolascon, and Giuseppe Merla (Department of Molecular Medicine and Medical Biotechnology, University of Naples Federico II, Naples, Italy; CEINGE Biotecnologie Avanzate, Naples, Italy); Giuseppe Fiorentino (Unit of Respiratory Physiopathology, AORN dei Colli, Monaldi Hospital, Naples, Italy); Massimo Carella and Marco Castori (Division of Medical Genetics, Fondazione IRCCS Casa Sollievo della Sofferenza Hospital, San Giovanni Rotondo, Italy); Giuseppe Merla and Gabriella Maria Squeo (Laboratory of Regulatory and Functional Genomics, Fondazione IRCCS Casa Sollievo della Sofferenza); Filippo Aucella (Department of Medical Sciences, Fondazione IRCCS Casa Sollievo della Sofferenza Hospital, San Giovanni Rotondo, Italy); Pamela Raggi and Rita Perna (Clinical Trial Office, Fondazione IRCCS Casa Sollievo della Sofferenza Hospital, San Giovanni Rotondo, Italy); Matteo Bassetti and Antonio Di Biagio (Department of Health Sciences, University of Genova, Genova, Italy; Infectious Diseases Clinic, Policlinico San Martino Hospital, IRCCS for Cancer Research Genova, Italy); Maurizio Sanguinetti, Luca Masucci, and Alessandra Guarnaccia (Microbiology, Fondazione Policlinico Universitario Agostino Gemelli IRCCS, Catholic University of Medicine, Rome, Italy; Department of Laboratory Sciences and Infectious Diseases, Fondazione Policlinico Universitario A. Gemelli IRCCS, Rome, Italy); Serafina Valente and Alex Di Florio (Department of Cardiovascular Diseases, University of Siena, Siena, Italy); Marco Mandalà, Alessia Giorli, and Lorenzo Salerni (Otolaryngology Unit, University of Siena, Italy); Patrizia Zucchi and Pierpaolo Parravicini (Department of Internal Medicine, ASST Valtellina e Alto Lario, Sondrio, Italy); Elisabetta Menatti (Study Coordinator Oncologia Medica e Ufficio Flussi Sondrio, Italy); Tullio Trotta, Ferdinando Giannattasio, and Gabriella Coiro (First Aid Department, Luigi Curto Hospital, Polla, Salerno, Italy); Fabio Lena and Gianluca Lacerenza (Department of Pharmaceutical Medicine, Misericordia Hospital, Grosseto, Italy); Cristina Mussini (Infectious Diseases Clinics, University of Modena and Reggio Emilia); Luisa Tavecchia (U.O.C. Medicina, ASST Nord Milano, Ospedale Bassini, Cinisello Balsamo (MI), Italy); Lia Crotti, Gianfranco Parati, and Roberto Menè (IRCCS, Istituto Auxologico Italiano, Dipartimento di Cardiologia, Ospedale San Luca, Milano, Italy; Department of Medicine and Surgery, University of Milano-Bicocca, Milan, Italy; Istituto Auxologico Italiano, IRCCS, Center for Cardiac Arrhythmias of Genetic Origin, Milan, Italy; Istituto Auxologico Italiano, IRCCS, Laboratory of Cardiovascular Genetics, Milan, Italy; Member of the European Reference Network for Rare, Low Prevalence, and Complex Diseases of the Heart-ERN GUARD-Heart); Maurizio Sanarico (Independent Data Scientist, Milan, Italy); Marco Gori (University of Siena, DIISM-SAILAB, Siena, Italy; Maasai, I3S CNRS, Université Côte d’Azur, France); Francesco Raimondi and Alessandra Stella (Laboratorio di Biologia Bio@SNS, Scuola Normale Superiore, Pisa, Italy); Filippo Biscarini (CNR-Consiglio Nazionale delle Ricerche, Istituto di Biologia e Biotecnologia Agraria (IBBA), Milano, Italy); Tiziana Bachetti (Direzione Scientifica, Istituti Clinici Scientifici Maugeri IRCCS, Pavia, Italy); Maria Teresa La Rovere (Istituti Clinici Scientifici Maugeri IRCCS, Department of Cardiology, Institute of Montescano, Pavia, Italy); Maurizio Bussotti (Istituti Clinici Scientifici Maugeri IRCCS, Department of Cardiology, Institute of Milan, Italy); Serena Ludovisi (Fondazione IRCCS Ca’ Granda Ospedale Maggiore Policlinico, Milan, Italy); Katia Capitani (Core Research Laboratory, ISPRO, Florence, Italy); Simona Dei (Health Management, Azienda Usl Toscana sud est, Tuscany, Italy); Sabrina Ravaglia (IRCCS C. Mondino Foundation, Pavia, Italy); Annarita Giliberti, Giulia Gori, Rosangela Artuso, Elena Andreucci, Angelica Pagliazzi, and Erika Fiorentini (Medical Genetics Unit, Meyer Children’s University Hospital); Antonio Perrella and Francesco Bianchi (Department of Medicine, Pneumology Unit, Misericordia Hospital, Grosseto, Italy); Paola Bergomi, Emanuele Catena, and Riccardo Colombo (Department of Anesthesia and Intensive Care Unit, ASST Fatebenefratelli Sacco, Luigi Sacco Hospital, Polo Universitario, University of Milan, Milan); Sauro Luchi, Giovanna Morelli, Paola Petrocelli, Sarah Iacopini, and Sara Modica (Infectious Disease Unit, Hospital of Lucca, Italy); Silvia Baroni (Department of Diagnostic and Laboratory Medicine, Institute of Biochemistry and Clinical Biochemistry, Fondazione Policlinico Universitario A. Gemelli IRCCS, Catholic University of the Sacred Heart, Rome, Italy); Giulia Micheli (Clinic of Infectious Diseases, Catholic University of the Sacred Heart, Rome, Italy); Marco Falcone, Donato Urso, Giusy Tiseo, and Tommaso Matucci (Department of Clinical and Experimental Medicine, Infectious Diseases Unit, University of Pisa, Pisa, Italy); Davide Grassi and Claudio Ferri (Department of Clinical Medicine, Public Health, Life, and Environment Sciences, University of L’Aquila, Italy); Franco Marinangeli (Anesthesiology and Intensive Care, University of L’Aquila, L’Aquila, Italy); Francesco Brancati (Department of Life, Health, and Environmental Sciences, University of L’Aquila, L’Aquila, Italy; Human Functional Genomics Laboratory, IRCCS San Raffaele Roma, Rome, Italy); Antonella Vincenti, Valentina Borgo, Stefania Lombardi, and Mirco Lenzi (Infectious Disease Unit, Hospital of Massa, Italy); Massimo Antonio Di Pietro, Francesca Vichi, Benedetta Romanin, Letizia Attala, Cecilia Costa, Andrea Gabbuti, and Alessio Bellucci (Infectious Diseases Unit, Santa Maria Annunziata Hospital, USL Centro, Florence, Italy); Patrizia Casprini (Laboratory of Clinical Pathology and Immunoallergy, Florence–Prato, Italy); Cristoforo Pomara and Massimiliano Esposito (Department of Medical, Surgical, and Advanced Technologies “G.F. ingrassia,” University of Catania, Catania, Italy); Roberto Leoncini, Michele Cirianni, and Lucrezia Galasso (Laboratorio Patologia Clinica, Azienda Ospedaliero-Universitaria Senese); Marco Antonio Bellini (Ambulatory Chronic Polipathology of Siena, Department of Medicine, Surgery, and Neurosciences, University of Siena, Siena, Italy); Chiara Gabbi (Department of Biosciences and Nutrition, Karolinska Institutet, Stockholm, Sweden).
Funding
The author(s) declare that financial support was received for the research, authorship, and/or publication of this article. This study is part of the GEN-COVID Multicenter Study, (https://sites.google.com/dbm.unisi.it/gen-covid), the Italian multicenter study aimed at identifying the COVID-19 host genetic bases. Specimens were provided by the COVID-19 Biobank of Siena, which is part of the Genetic Biobank of Siena, member of BBMRI-IT, of the Telethon Network of Genetic Biobanks (project no. GTB18001), EuroBioBank, and RD-Connect. Some authors of this paper are members of the European Reference Network on rare respiratory diseases ERN-LUNG. We thank private donors for the support provided to AR(Department of Medical Biotechnologies, University of Siena) for the COVID-19 host genetics research project (D.L n.18 of 17 March 2020). We also thank the COVID-19 Host Genetics Initiative (https://www.covid19hg.org/), MIUR project “Dipartimenti di Eccellenza 2018–2020” to the Department of Medical Biotechnologies University of Siena, Italy, and “Bando Ricerca COVID-19 Toscana” project to Azienda Ospedaliero-Universitaria Senese. We thank Intesa San Paolo for the 2020 charity fund dedicated to the project N B/2020/0119 “Identificazione delle basi genetiche determinanti la variabilità clinica della risposta a COVID-19 nella popolazione italiana.” The Italian Ministry of University and Research for funding within the “Bando FISR 2020” in COVID-19 for the project “Editing dell’RNA contro il Sars-CoV-2: hackerare il virus per identificare bersagli molecolari e attenuare l’infezione - HACKTHECOV” and the Istituto Buddista Italiano Soka Gakkai for funding the project “PAT-COVID: Host genetics and pathogenetic mechanisms of COVID-19” (ID n. 2020–2016_RIC_3). We thank EU project H2020-SC1-FA-DTS-2018–2020, entitled “International consortium for integrative genomics prediction (INTERVENE)”—Grant Agreement No. 101016775. Generous support was also received from private donations by Mrs. Maurizio Traglio, Enzo Cattaneo, and Alberto Borella.
Acknowledgments
The authors would like to thank the CINECA consortium for providing computational resources and the Network for Italian Genomes (NIG; http://www.nig.cineca.it) for its support. They would also like to thank the Uppsala Intensive Care COVID-19 research group for sharing data on the Swedish COVID patient cohort.
Conflict of interest
The authors declare that the research was conducted in the absence of any commercial or financial relationships that could be construed as a potential conflict of interest.
Publisher’s note
All claims expressed in this article are solely those of the authors and do not necessarily represent those of their affiliated organizations, or those of the publisher, the editors, and the reviewers. Any product that may be evaluated in this article, or claim that may be made by its manufacturer, is not guaranteed or endorsed by the publisher.
Supplementary material
The Supplementary Material for this article can be found online at: https://www.frontiersin.org/articles/10.3389/fgene.2024.1362469/full#supplementary-material
Footnotes
1The GEN-COVID Multicenter Study includes a network of 22 Italian hospitals, 13 from Northern Italy, 5 from Central Italy, and 4 from Southern Italy. It also includes local healthcare units and departments of preventative medicine (https://sites.google.com/dbm.unisi.it/gen-covid).
References
Agosto, A., and Giudici, P. (2020). A Poisson autoregressive model to understand covid-19 contagion dynamics. Risks 8, 77. doi:10.3390/risks8030077
Baldassarri, M., Fava, F., Fallerini, C., Daga, S., Benetti, E., Zguro, K., et al. (2021a). Severe covid-19 in hospitalized carriers of single cftr pathogenic variants. J. personalized Med. 11, 558. doi:10.3390/jpm11060558
Baldassarri, M., Picchiotti, N., Fava, F., Fallerini, C., Benetti, E., Daga, S., et al. (2021b). Shorter androgen receptor polyq alleles protect against life-threatening covid-19 disease in european males. EBioMedicine 65, 103246. doi:10.1016/j.ebiom.2021.103246
Ballow, M., and Haga, C. L. (2021). Why do some people develop serious covid-19 disease after infection, while others only exhibit mild symptoms? J. Allergy Clin. Immunol. Pract. 9, 1442–1448. doi:10.1016/j.jaip.2021.01.012
Benetti, E., Giliberti, A., Emiliozzi, A., Valentino, F., Bergantini, L., Fallerini, C., et al. (2020a). Clinical and molecular characterization of covid-19 hospitalized patients. Plos one 15, e0242534. doi:10.1371/journal.pone.0242534
Benetti, E., Tita, R., Spiga, O., Ciolfi, A., Birolo, G., Bruselles, A., et al. (2020b). Ace2 gene variants may underlie interindividual variability and susceptibility to covid-19 in the Italian population. Eur. J. Hum. Genet. 28, 1602–1614. doi:10.1038/s41431-020-0691-z
Bialek, S., Boundy, E., Bowen, V., Chow, N., Cohn, A., Dowling, N., et al. CDC COVID-19 Response Team (2020). Severe outcomes among patients with coronavirus disease 2019 (COVID-19) - United States, february 12-march 16, 2020. Morb. Mortal. Wkly. Rep. 69, 343–346. doi:10.15585/mmwr.mm6912e2
Boyle, E. A., Li, Y. I., and Pritchard, J. K. (2017). An expanded view of complex traits: from polygenic to omnigenic. Cell. 169, 1177–1186. doi:10.1016/j.cell.2017.05.038
Castorina, P., Iorio, A., and Lanteri, D. (2020). Data analysis on coronavirus spreading by macroscopic growth laws. Int. J. Mod. Phys. C 31, 2050103. doi:10.1142/s012918312050103x
Caux, J.-S. (2016). The quench action. J. Stat. Mech. Theory Exp. 2016, 064006. doi:10.1088/1742-5468/2016/06/064006
Chen, Y., Liu, Q., and Guo, D. (2020). Emerging coronaviruses: genome structure, replication, and pathogenesis. J. Med. virology 92, 2249–2423. doi:10.1002/jmv.26234
COVID-19 Host Genetics Initiative, Karjalainen, J., Liao, R. G., Neale, B. M., Daly, M., Ganna, A., et al. (2021). Mapping the human genetic architecture of covid-19. Nature 600, 472–477. doi:10.1038/s41586-021-03767-x
Croci, S., Venneri, M. A., Mantovani, S., Fallerini, C., Benetti, E., Picchiotti, N., et al. (2022). The polymorphism l412f in tlr3 inhibits autophagy and is a marker of severe covid-19 in males. Autophagy 18, 1662–1672. doi:10.1080/15548627.2021.1995152
Daga, S., Fallerini, C., Baldassarri, M., Fava, F., Valentino, F., Doddato, G., et al. (2021). Employing a systematic approach to biobanking and analyzing clinical and genetic data for advancing covid-19 research. Eur. J. Hum. Genet. 29, 745–759. doi:10.1038/s41431-020-00793-7
Dong, E., Du, H., and Gardner, L. (2020). An interactive web-based dashboard to track covid-19 in real time. Lancet Infect. Dis. 20, 533–534. doi:10.1016/S1473-3099(20)30120-1
Fallerini, C., Daga, S., Benetti, E., Picchiotti, N., Zguro, K., Catapano, F., et al. (2021a). Selp asp603asn and severe thrombosis in covid-19 males. J. Hematol. Oncol. 14, 123–124. doi:10.1186/s13045-021-01136-9
Fallerini, C., Daga, S., Mantovani, S., Benetti, E., Picchiotti, N., Francisci, D., et al. (2021b). Association of toll-like receptor 7 variants with life-threatening covid-19 disease in males: findings from a nested case-control study. elife 10, e67569. doi:10.7554/eLife.67569
Fallerini, C., Picchiotti, N., Baldassarri, M., Zguro, K., Daga, S., Fava, F., et al. (2022). Common, low-frequency, rare, and ultra-rare coding variants contribute to covid-19 severity. Hum. Genet. 141, 147–173. doi:10.1007/s00439-021-02397-7
Fanelli, D., and Piazza, F. (2020). Analysis and forecast of covid-19 spreading in China, Italy and France. Chaos, Solit. Fractals 134, 109761. doi:10.1016/j.chaos.2020.109761
Fenga, L. (2021). Covid-19: an automatic, semiparametric estimation method for the population infected in Italy. PeerJ 9, e10819. doi:10.7717/peerj.10819
Gad, A. F. (2021). Pygad: an intuitive genetic algorithm python library. arXiv preprint arXiv:2106.06158.
Gebhard, C., Regitz-Zagrosek, V., Neuhauser, H. K., Morgan, R., and Klein, S. L. (2020). Impact of sex and gender on covid-19 outcomes in europe. Biol. sex Differ. 11, 29–13. doi:10.1186/s13293-020-00304-9
Hütter, G., Blüthgen, C., Neumann, M., Reinwald, M., Nowak, D., and Klüter, H. (2013). Coregulation of hiv-1 dependency factors in individuals heterozygous to the ccr5-delta32 deletion. AIDS Res. Ther. 10, 26–28. doi:10.1186/1742-6405-10-26
Jin, J.-M., Bai, P., He, W., Wu, F., Liu, X.-F., Han, D.-M., et al. (2020). Gender differences in patients with covid-19: focus on severity and mortality. Front. public health 152. doi:10.3389/fpubh.2020.00152
Kosmicki, J. A., Horowitz, J. E., Banerjee, N., Lanche, R., Marcketta, A., Maxwell, E., et al. (2021). Pan-ancestry exome-wide association analyses of covid-19 outcomes in 586,157 individuals. Am. J. Hum. Genet. 108, 1350–1355. doi:10.1016/j.ajhg.2021.05.017
Kousathanas, A., Pairo-Castineira, E., Rawlik, K., Stuckey, A., Odhams, C. A., Walker, S., et al. (2021). Whole genome sequencing identifies multiple loci for critical illness caused by covid-19. medRxiv.
Kramer, O., and Kramer, O. (2016). Scikit-learn. Mach. Learn. Evol. strategies, 45–53. doi:10.1007/978-3-319-33383-0_5
Lai, A., Bergna, A., Acciarri, C., Galli, M., and Zehender, G. (2020). Early phylogenetic estimate of the effective reproduction number of sars-cov-2. J. Med. virology 92, 675–679. doi:10.1002/jmv.25723
Lanteri, D., Carco, D., and Castorina, P. (2020). How macroscopic laws describe complex dynamics: asymptomatic population and covid-19 spreading. Int. J. Mod. Phys. C 31, 2050112. doi:10.1142/s0129183120501120
Madabhavi, I., Sarkar, M., and Kadakol, N. (2020). Covid-19: a review. Monaldi Archives Chest Dis. 90. doi:10.4081/monaldi.2020.1298
Mantovani, S., Daga, S., Fallerini, C., Baldassarri, M., Benetti, E., Picchiotti, N., et al. (2022). Rare variants in toll-like receptor 7 results in functional impairment and downregulation of cytokine-mediated signaling in covid-19 patients. Genes. & Immun. 23, 51–56. doi:10.1038/s41435-021-00157-1
Marouli, E., Graff, M., Medina-Gomez, C., Lo, K. S., Wood, A. R., Kjaer, T. R., et al. (2017). Rare and low-frequency coding variants alter human adult height. Nature 542, 186–190. doi:10.1038/nature21039
Martelloni, G., and Martelloni, G. (2020a). Analysis of the evolution of the sars-cov-2 in Italy, the role of the asymptomatics and the success of logistic model. Chaos, Solit. Fractals 140, 110150. doi:10.1016/j.chaos.2020.110150
Martelloni, G., and Martelloni, G. (2020b). Modelling the downhill of the sars-cov-2 in Italy and a universal forecast of the epidemic in the world. Chaos, Solit. Fractals 139, 110064. doi:10.1016/j.chaos.2020.110064
Monticelli, M., Hay Mele, B., Benetti, E., Fallerini, C., Baldassarri, M., Furini, S., et al. (2021). Protective role of a tmprss2 variant on severe covid-19 outcome in young males and elderly women. Genes. 12, 596. doi:10.3390/genes12040596
Mukherjee, S., and Pahan, K. (2021). Is covid-19 gender-sensitive? J. Neuroimmune Pharmacol. 16, 38–47. doi:10.1007/s11481-020-09974-z
O’Brien, J., Du, K. Y., and Peng, C. (2020). Incidence, clinical features, and outcomes of covid-19 in Canada: impact of sex and age. J. ovarian Res. 13, 1–12. doi:10.1186/s13048-020-00734-4
Pairo-Castineira, E., Clohisey, S., Klaric, L., Bretherick, A. D., Rawlik, K., Pasko, D., et al. (2021). Genetic mechanisms of critical illness in covid-19. Nature 591, 92–98. doi:10.1038/s41586-020-03065-y
Pedregosa, F., Varoquaux, G., Gramfort, A., Michel, V., Thirion, B., Grisel, O., et al. (2011). Scikit-learn: machine learning in python. J. Mach. Learn. Res. 12, 2825–2830. doi:10.5555/1953048.2078195
Picchiotti, N., Benetti, E., Fallerini, C., Daga, S., Baldassarri, M., Fava, F., et al. (2021). Post-mendelian genetic model in covid-19. Cardiol. Cardiovasc. Med. 5 (6), 673–694. doi:10.26502/fccm.92920232
Severe Covid-19 GWAS Group, Ellinghaus, D., Degenhardt, F., Bujanda, L., Buti, M., Albillos, A., et al. (2020). Genomewide association study of severe covid-19 with respiratory failure. N. Engl. J. Med. 383, 1522–1534. doi:10.1056/NEJMoa2020283
Stehman, S. V. (1997). Selecting and interpreting measures of thematic classification accuracy. Remote Sens. Environ. 62, 77–89. doi:10.1016/s0034-4257(97)00083-7
Keywords: COVID-19, host genetics, integrated polygenic score, genetic algorithm, logistic regression, genetic science modeling
Citation: Martelloni G, Turchi A, Fallerini C, Degl’Innocenti A, Baldassarri M, Olmi S, Furini S, Renieri A and GEN-COVID Multicenter study (2024) Host genetics and COVID-19 severity: increasing the accuracy of latest severity scores by Boolean quantum features. Front. Genet. 15:1362469. doi: 10.3389/fgene.2024.1362469
Received: 28 December 2023; Accepted: 09 April 2024;
Published: 22 May 2024.
Edited by:
Ramcés Falfán-Valencia, National Institute of Respiratory Diseases-Mexico (INER), MexicoReviewed by:
Ravins Dohare, Jamia Millia Islamia, IndiaMeltem Ece Kars, Icahn School of Medicine at Mount Sinai, United States
Karthikeyan Subbarayan, Martin Luther University of Halle-Wittenberg, Germany
Copyright © 2024 Martelloni, Turchi, Fallerini, Degl’Innocenti, Baldassarri, Olmi, Furini, Renieri and GEN-COVID Multicenter study. This is an open-access article distributed under the terms of the Creative Commons Attribution License (CC BY). The use, distribution or reproduction in other forums is permitted, provided the original author(s) and the copyright owner(s) are credited and that the original publication in this journal is cited, in accordance with accepted academic practice. No use, distribution or reproduction is permitted which does not comply with these terms.
*Correspondence: Simona Olmi, c2ltb25hLm9sbWlAZmkuaXNjLmNuci5pdA==