 José P. Miranda1,2,3
 Ana Pereira4
 Camila Corvalán4
 Juan F. Miquel5
 Gigliola Alberti6,7Juan C. Gana6,7José L. Santos1,2*
- 1Department of Nutrition, Diabetes, and Metabolism, School of Medicine, Pontificia Universidad Católica de Chile, Santiago, Chile
- 2School of Medicine, PhD in Epidemiology Program, Pontificia Universidad Católica de Chile, Santiago, Chile
- 3Advanced Center for Chronic Diseases (ACCDiS), Pontificia Universidad Católica de Chile and Universidad de Chile, Santiago, Chile
- 4Instituto de Nutrición y Tecnología de los Alimentos INTA, Universidad de Chile, Santiago, Chile
- 5Department of Gastroenterology, School of Medicine, Pontificia Universidad Católica de Chile, Santiago, Chile
- 6Pediatrics Division, School of Medicine, Pontificia Universidad Católica de Chile, Santiago, Chile
- 7Department of Gastroenterology and Pediatric Nutrition, School of Medicine, Pontificia Universidad Católica de Chile, Santiago, Chile
Gene variants in the UGT1A1 gene are strongly associated with circulating bilirubin levels in several populations, as well as other variants of modest effect across the genome. However, the effects of such variants are unknown regarding the Native American ancestry of the admixed Latino population. Our objective was to assess the Native American genetic determinants of serum bilirubin in Chilean admixed adolescents using the local ancestry deconvolution approach. We measured total serum bilirubin levels in 707 adolescents of the Chilean Growth and Obesity Cohort Study (GOCS) and performed high-density genotyping using the Illumina-MEGA array (>1.7 million genotypes). We constructed a local ancestry reference panel with participants from the 1000 Genomes Project, the Human Genome Diversity Project, and our GOCS cohort. Then, we inferred and isolated haplotype tracts of Native American, European, or African origin to perform genome-wide association studies. In the whole cohort, the rs887829 variant and others near UGT1A1 were the unique signals achieving genome-wide statistical significance (b = 0.30; p = 3.34 × 10−57). After applying deconvolution methods, we found that significance is also maintained in Native American (b = 0.35; p = 3.29 × 10⁻¹⁷) and European (b = 0.28; p = 1.14 × 10⁻²³) ancestry components. The rs887829 variant explained a higher percentage of the variance of bilirubin in the Native American (37.6%) compared to European ancestry (28.4%). In Native American ancestry, carriers of the TT genotype of this variant averaged 4-fold higher bilirubinemia compared to the CC genotype (p = 2.82 × 10⁻¹²). We showed for the first time that UGT1A1 variants are the primary determinant of bilirubin levels in Native American ancestry, confirming its pan-ethnic relevance. Our study illustrates the general value of the local ancestry deconvolution approach to assessing isolated ancestry effects in admixed populations.
Introduction
Bilirubin is the end-product of heme degradation, mainly derived from erythrocytic hemoglobin (−80% of total bilirubin production) and, to a lesser extent, from other hemoproteins such as myoglobin, cytochromes, and catalases. After roughly 120 days of the erythrocyte functional life, macrophages of mononuclear phagocyte system of the spleen, bone marrow, and Kupfer cells of the liver engulf senescent erythrocytes and degrade them to release the prosthetic heme group from globin chains. The rate-limiting enzyme of heme catabolism is heme oxygenase (HMOX). This enzyme opens the porphyrin ring to generate Fe2+, CO, and the green pigment biliverdin, consuming NADPH. After the HMOX reaction, biliverdin is degraded by biliverdin reductase using NADPH to produce bilirubin, a lipid-soluble compound of yellowish-orange color. In circulation, bilirubin is bound to albumin and taken into the liver by members of the human organic anion-transporting polypeptide (OATP) family (Fujiwara et al., 2017). Once in the liver, bilirubin is conjugated with glucuronic acid (mono- and, mostly, diglucuronide bilirubin) exclusively by the UDP-glucuronosyltransferase 1A1 (UGT1A1) enzyme (Ritter et al., 1991). The conjugated bilirubin (also called “direct bilirubin”) is a water-soluble compound that is transported into bile via the ATP-dependent multidrug-resistant protein transporter MRP2 (ABCC2) in the canalicular hepatocyte membrane (Jedlitschky et al., 1997).
Total circulating bilirubin (TB) levels (typically in the range of 0.2–1.0 mg/dL) are determined by the rate of enzymes involved in heme synthesis and degradation, liver uptake, glucuronidation, hepatic excretion, absorption from the gut and transport. During a lifetime, circulating TB levels are reported to increase during childhood and adolescence, reaching a peak between 25–30 years and then decreasing with age. TB levels are higher in men than women and among nonsmokers than smokers. Additionally, ethnic differences are reported concerning higher levels among Mexican Americans compared to non-Hispanic blacks (Rosenthal et al., 1984; Zucker et al., 2004). From a physiopathology perspective, hyperbilirubinemia is classified according to whether it is due to an increased bilirubin production by enhanced hemolysis; defects in conjugation caused by severe mutations in UGT1A1 causing Crigler-Najjar type I and II syndromes; due to a hepatocellular alteration, as in the case of viral hepatitis, some autoimmune liver diseases, or by biliary atresia, as it occurs in obstructions by gallstones or tumors (Méndez-Sánchez et al., 2019). A mild increase of serum bilirubin levels is also observed in the Gilbert syndrome, a benign condition caused by a TA-insertion in the TATA box of UGT1A1 promoter [A (TA)7TAA] (termed UGT1A1*28; instead of the normal TA6), leading to 50%–70% reduction in UGT1A1 gene expression (Strassburg, 2010).
At a population level, several genome-wide association studies (GWAS) have identified the UGT1A on chromosome 2q37.1 as the major locus influencing serum bilirubin, including European (Johnson et al., 2009; Sanna et al., 2009), Australian (Benton et al., 2015), African American (Chen et al., 2013), and Asian (Kang et al., 2010; Dai et al., 2013) populations. Among Europeans, there are also other significant variants modestly associated with bilirubin levels in the solute carrier organic anion transporter family member 1B1, 1B3, and 1B7 genes (SLCO1B1, SLCO1B3, and SLCO1B7), which encode for a membrane-bound sodium-independent organic anion transporter (Johnson et al., 2009; Sanna et al., 2009; Sakaue et al., 2021; Sinnott-Armstrong et al., 2021). However, little is known about Native American ancestry at a genome-wide scale (Kronenberg et al., 2002; Lin et al., 2009a; Melton et al., 2011). Assessing the Native American ancestry in genetic studies is important since Latino populations (a genetic admixture of Native American, European, and African origins) (Eyheramendy et al., 2015; Chacón-Duque et al., 2018) have been largely excluded from such studies. However, assessing the effect of gene variants on phenotypes in Native American ancestry is difficult given the lack of cohorts with participants of this ancestry because this population began a process of admixing with European and African populations just over 500 years ago. To overcome this limitation, a new strategy was recently reported that allows the determination of each variant’s ancestry locally, using the local ancestry deconvolution approach (Atkinson et al., 2021). This method generates multiple sub-cohorts within an admixed population to disentangle an isolated ancestral component by extracting and tagging haplotype tracts. Then, our study aimed to perform a Local Ancestry Deconvoluted GWAS (LAD-GWAS) to evaluate the isolated effect of inferred Native American ancestry on serum bilirubin regulation in Chilean adolescents.
Subjects and methods
Study design
We evaluated adolescents enrolled in the Growth and Obesity Chilean Cohort Study (GOCS). This cohort was created in 2006 and follows 1,190 children aged 2.6–4.0 years at enrollment who attended public nursery schools of the Chilean National Preschool Program (JUNJI) as well as the Chilean National School Board Program (JUNAEB) in six counties in Santiago de Chile (Sánchez et al., 2016). We genotyped a subset of 964 participants by microarray and measured serum bilirubin levels on 707 adolescents at age 15.4 ± 0.98 years (341 males, 366 females). A diagram of the analysis flow is shown in Figure 1.
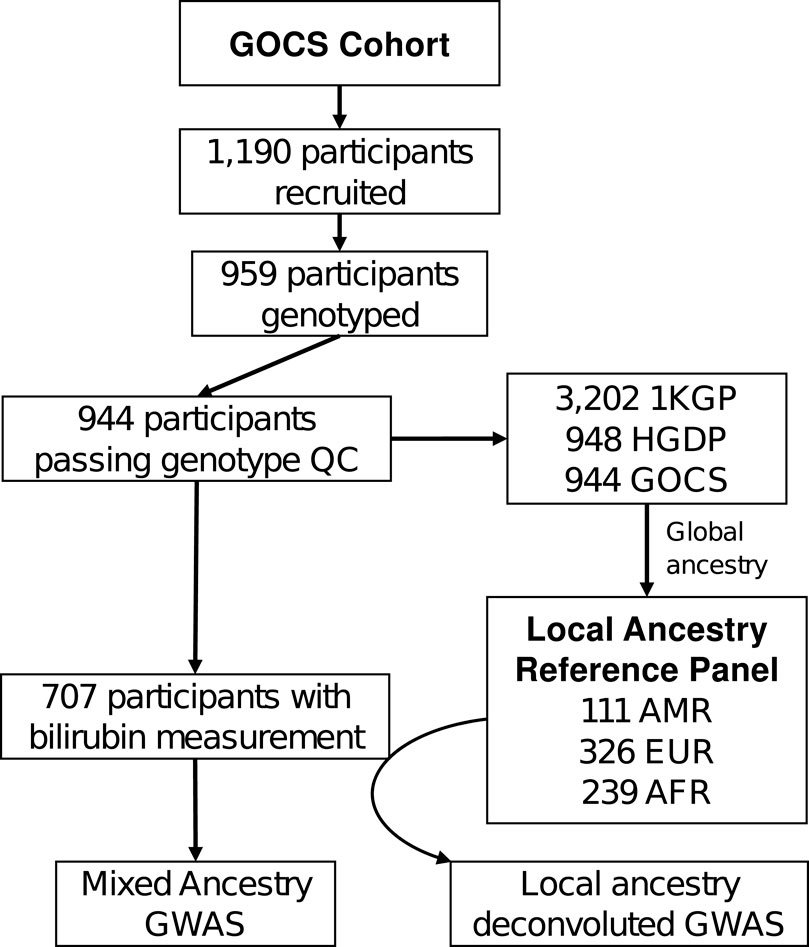
Figure 1. Flow analysis in GOCS cohort for the admixed ancestry GWAS or Local Ancestry Deconvoluted GWAS of bilirubin. 1KGP and HGDP correspond to the genotypes of the 1000 Genomes Project and the Human Genome Diversity Project participants, respectively. AMR: admixed Latino population, EUR: European ancestry, AFR: African ancestry.
This study was approved by the Ethics Review Board of the School of Medicine (Pontificia Universidad Católica de Chile). Written informed consent was obtained from the parents or guardians of each participant of the GOCS cohort.
Anthropometric and biochemical measurements
The Body Mass Index (BMI) for age z-score (BAZ) was measured according to WHO recommendations (De Onis et al., 2007). Using the Diazo method, we measured TB on a Cobas C System (Roche/Hitachi). Briefly, total bilirubin, in the presence of a suitable solubilizing agent, is coupled with a diazonium ion in a strongly acidic medium to form red-colored azobilirubin. The color intensity of the formed dye is proportional to the concentration of TB present in the sample. It was determined photometrically by the increase in absorbance at 552 nm.
SNP genotyping and quality control
We performed genome-wide genotyping on 964 GOCS cohort participants and 8 duplicate genotyping controls from the Human Genome Diversity Cell Line Panel (HGDP-CEPH) using the Infinium® Multhi-Ethnic Global BeadChip (Illumina. Inc). We loaded genotyping data into GenomeStudio v2.0.3 (Illumina. Inc) and called automatic clustering (Tobar et al., 2019; Miranda et al., 2022). From the total of samples analyzed, 14 with a call rate <0.98 were removed. The average genotyping concordance between the HGDP-CEPH Panel duplicate controls was 99.99% ± 0.02, and the total genotyping rate was 0.9993. The project was exported to PLINK format for further filtering.
Using PLINK v1.9 (Purcell et al., 2007), we removed three more samples based on gender mismatch and three due to relatedness (IBD/IBS>0.2). Excluded variants had minor allele frequency (MAF) < 0.01, missing genotype data >5%, duplicated physical positions (one variant was kept from each duplicate pair), and deviations from the Hardy-Weinberg Equilibrium (HWE) (p < 1 × 10⁻⁴). To rule out strand inconsistency, 58,236 transversions (A↔T or C↔G) were removed. After these filters, we obtained 944 participants (468 males and 476 females) and a dataset of 700,344 autosomal variants in the GRCh37 human reference sequence.
Genotype imputation
We used the filtered data set of 700,344 variants for genotype imputation in the TOPMed Imputation Server (Das et al., 2016; Taliun et al., 2021). The TOPMed imputation pipeline used Minimac4 v1.6.6 (Fuchsberger et al., 2015), including Eagle v2.4 for phasing genotypes, the TOPMed r2 reference panel with 97,256 samples from diverse populations, and more than 300 million genetic variants. We used BCFTools v1.9 to obtain imputed single nucleotide variants with high imputation probability (rsq>0.9) and MAF >0.005, yielding a total of 7,797,326 variants in GRCh38 human reference sequence.
Construction of the multiethnic panel for local ancestry
We obtained the genotypes from the Human Genome Diversity Project (HGDP) (Bergström et al., 2020) and the 1000 Genomes Project (1KGP) (Auton et al., 2015), contained in the gnomAD v3.1.2 release (https://gnomad.broadinstitute.org/downloads). The data set included 4,150 samples and about 150 million single nucleotide variants. Using BCFTools, we filtered this data set to keep only passing filter variants with genotype called in at least 90% of the samples and with a frequency greater than 0.5%, obtaining 15,520,451 variants. Using BCFTools, we intersected by equal position and alleles this dataset with the imputed dataset for the 944 GOCS participants.
In the resulting dataset containing 5,094 samples, we used PLINK v1.9 to remove regions in high linkage disequilibrium (Price et al., 2006). Data were pruned using an independent pairwise approach with a window size of 50 kb, a step size of 5 SNPs, and a r2 cutoff threshold of 0.2. With the 254,807 variants obtained, we estimated global ancestry using ADMIXTURE with cross-validation and several populations K from 3 to 18 (Alexander et al., 2009). Global ancestry composition was plotted in RStudio v2022.07.0. Using PLINK v1.9 on the same variants, we estimated 20 principal components (PCs) for population stratification correction.
For the local ancestry panel, we selected 676 samples with an estimated ancestry component with an origin of >97% for Native American, >97% for European, and >99.9% for African (Supplementary Tables S2, S3).
To obtain phased genotypes and ensure that we had harmonized genotypes between the different data sets, the set with the 5,094 samples was imputed again on the TOPMed imputation server. From these data, we prepared a subset with the 944 GOCS samples for local ancestry (imputation probability >99% and MAF>0.05%). We performed a second subset with the 676 reference panel samples and selected the variants described in gnomAD to estimate local ancestry in the Latino admixed population.
Local ancestry estimation and local ancestry deconvolution in GOCS
To estimate local ancestry in GOCS, we used RFMix v2 (Maples et al., 2013) with our reference panel of 676 samples with the highest Native American, European, or African global ancestry. To estimate global ancestry from local ancestry estimates, we performed a weighted sum by the size of each autosome. We used Tractor (Atkinson et al., 2021) to deconvolute GOCS genotypes in the different ancestry. The tractor pipeline takes the RFMix results, extracts each ancestry’s inferred haplotypes (or tracts), and generates an ancestry-isolated VCF files.
Admixed ancestry and local ancestry deconvoluted GWAS (LAD-GWAS)
We developed a traditional admixed ancestry GWAS with the 707 GOCS participants using PLINK2 in association with serum TB. We considered 3,744,716 variants with at least 5 participants with alternative homozygous genotypes to fit additive models.
To assess the effect of the isolated Native American (NAT) or European ancestry (EUR) in GOCS, we used PLINK2, considering half-calls as missing. We only consider 2,604,077 variants for NAT ancestry and 3,229,387 variants for EUR ancestry. These variants had at least 3 participants with alternative homozygous genotypes to fit an additive model.
Inferred variants of AFR origin were excluded from the analysis due to the low proportion found in GOCS. Non-autosomal variants were excluded. Manhattan and Q-Q plots were constructed using the “qqman” library on RStudio.
To assess whether our local ancestry estimates were correct, we compared the allele frequencies of the top variants among the entire GOCS cohort and the estimated NAT or EUR ancestry with the frequencies obtained in gnomAD v3.1.2 genomes. We selected frequencies for admixed Latino ancestry (AMR), Europeans (non-Finnish), and Native American ancestry estimated with a similar methodology (https://gnomad.broadinstitute.org/). We also compared the allele frequencies of our variants with those described in the HGDP project for NAT ancestry, which includes samples of Maya, Colombian, Karitiana, Pima, and Surui origin.
Statistical methods
We calculated summary statistics in the GOCS cohort using RStudio. We used a two-tailed Student’s t-test to compare boys and girls. The admixed ancestry GWAS was conducted with 707 GOCS participants using an additive genetic model adjusted by sex, age, BAZ, and five genetic principal components (PCs). In contrast, for the LAD-GWAS, we adjusted by sex, age, and BAZ as covariates. Associations with p < 5 × 10⁻⁸ were considered genome-wide significant, while associations between p < 1 × 10⁻⁵ and >5 × 10⁻⁸ were considered suggestive of association. Only variants corrected for multiple testing with FDR-BH p < 0.05 are reported. We use Pearson´s correlation to compare allele frequencies between the different ancestries. All analyses were performed on an HP Z800 Workstation, with 24x Intel® Xeon(R) CPU X5675 @ 3.07 GHz, 48 Gb RAM, and a 6 Tb RAID, with Ubuntu 20.04.4 LTS 64-bit operating system.
Results
Total serum bilirubin levels among participants of the study
The 707 participants of the Chilean GOCS cohort included in the present study had an average age of 15.4 ± 0.98 years, and 51.8% were females (Table 1). Total bilirubin levels were significantly higher in boys than girls. On the other hand, BAZ was considerably higher in girls than boys. To manage confounding, the additive regression models of the GWAS were adjusted for age, sex, and BAZ.
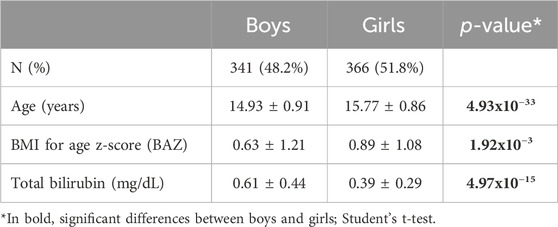
Table 1. Characteristics of the 707 GOCS Cohort participants included in this study. Significant differences were found for age and BAZ according to sex. These covariates were included in the fit of the GWAS regression models.
Global ancestry composition of GOCS participants
Using the ADMIXTURE program with cross-validation, we estimated that the optimal number of populations for the 5,094-sample dataset, including participants from GOCS, the HGDP, and the 1KGP, is obtained with K = 15 (Supplementary Figure S1).
The GOCS cohort showed a global Native American (NAT) ethnic component that reached 61.4% (Supplementary Table S1; Figure 2). This regional component was separated into three different populations, with a main contribution that could come from the Native-American Mapuche population (55.3%) and a low contribution from Andean (3.84%) and Central American origin (2.2%) (Supplementary Table S1; Supplementary Figure S2).
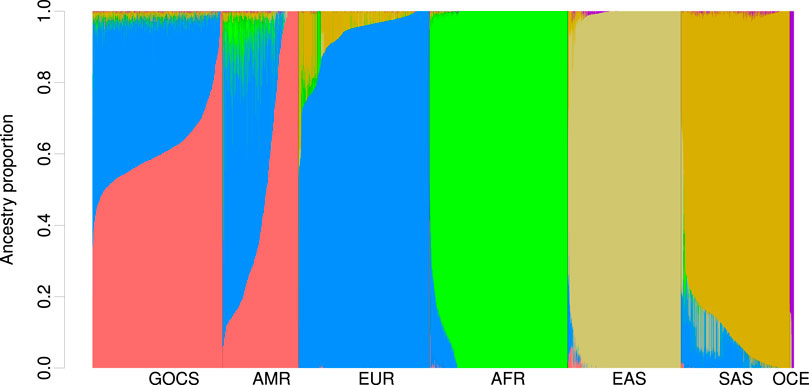
Figure 2. Global ancestry proportions are estimated in GOCS, the HGDP, and 1KGP. Global ancestry was estimated with ADMIXTURE using K = 15 populations and included probably Chilean Mapuche, Peruvian, Mexican, Colombian, Surui, Maya, Karitiana, and Pima (
The global European (EUR) ancestry component averaged a total of 36%, coming mainly from Iberian, Basque, Sardinian, Tuscan, Italian, and French populations (25%) and, to a lesser extent, from Northern Europeans (6.2%) (Supplementary Table S1). Because we included HGDP samples of Middle Eastern origin, we could disentangle this component and estimate that it is present at an average of 4.75% in GOCS. As expected, the GOCS cohort had a low ancestry component of AFR origin (0.55%), East Asian (0.34%), Central and South Asian (0.16%), and Oceanian (0.13%) (Supplementary Table S1).
Local ancestry in GOCS
Based on the global ancestry estimate of the 5,094 samples, we selected 676 samples with the highest proportion of NAT, EUR, or AFR ancestry (Supplementary Tables S2, S3). Among them, 16 samples in GOCS showed a high component of NAT origin. Additionally, we selected samples from the HGDP and the 1KGP, reaching a total of 111 samples with a percentage of NAT ancestry greater than 97%. The average NAT component in these 111 samples reached 99.7% (Supplementary Table S3).
For the EUR component, we selected 326 samples with more than 97% European global ancestry, including the HGDP and the 1KGP samples from Basque, Bedouin, Northern Europeans, Finnish, French, British, Iberia, Arcadian, and Sardinian populations. The average EUR ethnic component in these samples reached 98.7%.
Additionally, 239 samples for our reference panel with AFR origin averaged 99.9% global ancestry in the HGDP and the 1KGP. These samples belong to Esan, Gambian, Pygmy, and Yoruba populations.
According to the local ancestry results obtained with RFMix, GOCS participants are composed of 45.6% NAT ancestry, 52.5% EUR ancestry, and 1.9% AFR ancestry (Supplementary Table S4). Although differences are observed for the estimated global ancestry with ADMIXTURE, both results are highly agreed (R2 = 0.998 for NAT, R2 = 0.985 for EUR, and R2 = 0.661 for AFR ancestry, respectively). In general, ADMIXTURE could overestimate the global NAT component and underestimate the EUR and AFR components in GOCS, considering that the participants of the GOCS cohort have a recently admixed ancestry component and we did not have available samples of pure NAT ancestry to include in the panel for the estimation of global ancestry. (Supplementary Figure S4).
GWAS of total bilirubin in GOCS participants
Gene variants reaching the threshold of significance at the genome-wide level (p < 5 × 10⁻⁸) were limited to the vicinity of the UDP-glucuronosyltransferase gene family 1 member A1 (UGT1A1) (Figure 3; upper). The strongest association was with the rs887829 variant upstream UGT1A1, beta = 0.3 mg/dL total bilirubin, p = 3.34 × 10−57, effect allele T (Table 2). This variant masked other 232 significant variants in high linkage disequilibrium (R2 > 0.1) located in the vicinity (±500 Kb), and its allele frequency in GOCS was 32.5% (Supplementary Table S5). Carriers of the TT genotype of the rs887829 variant averaged 3.32 times higher bilirubinemia than those of the CC genotype (p = 2.9 × 10⁻³⁴) (Figure 4).
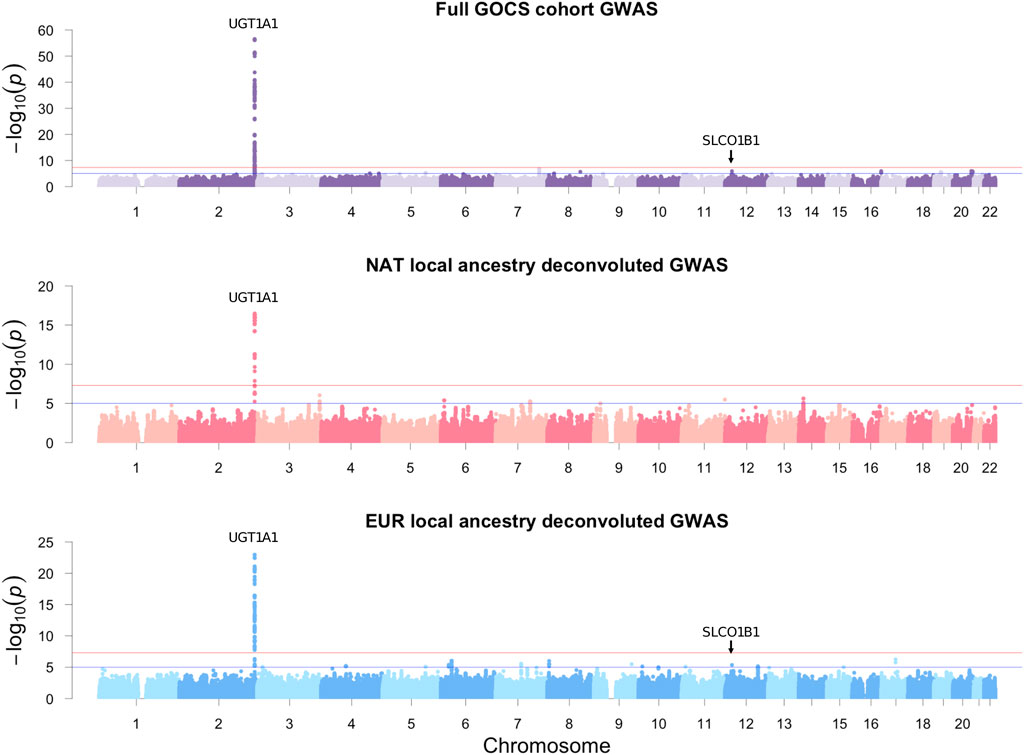
Figure 3. GOCS cohort GWAS and LAD-GWAS of total bilirubin. Additive models were adjusted for age, sex, and BAZ. The traditional GWAS of the GOCS cohort was also adjusted for five genetic principal components. Only autosomal variants were included.
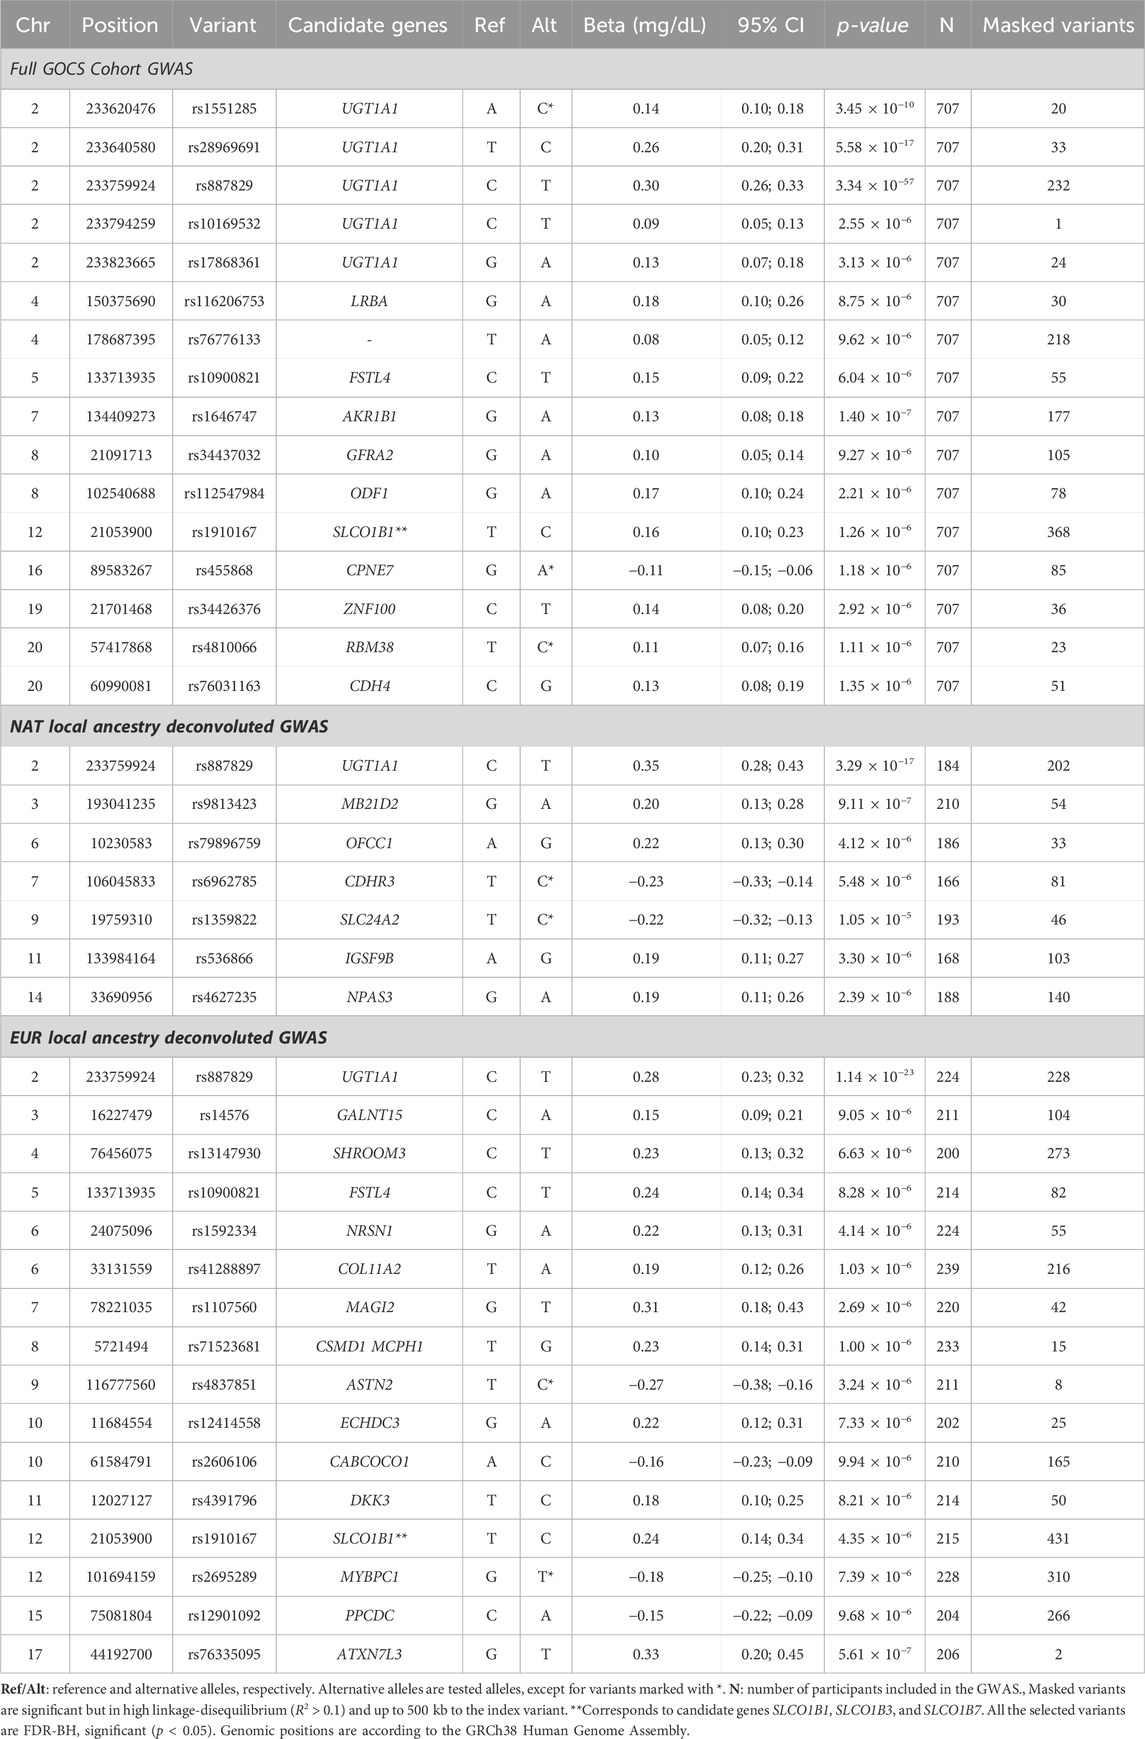
Table 2. Summary statistics of the GWAS for the entire GOCS cohort and the Local Ancestry Deconvoluted GWAS for total bilirubin levels.
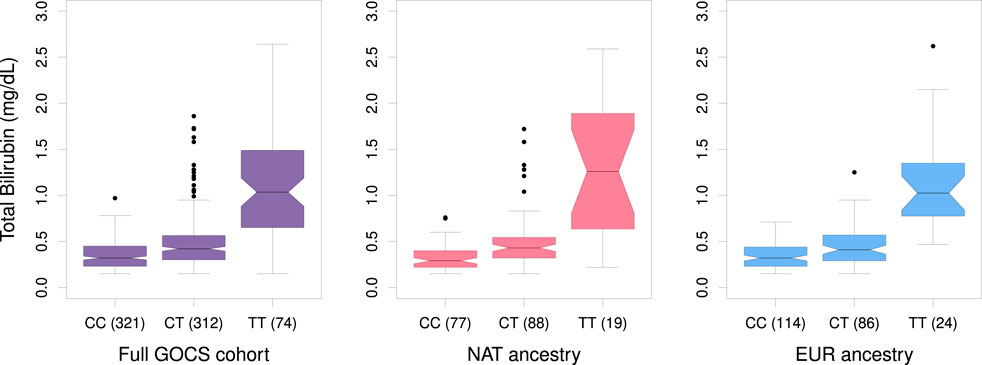
Figure 4. Boxplot of total bilirubin levels in GOCS according to genotypes of the variant rs887829 near UGT1A1 for the total cohort and for sub-cohorts with Native American or European ancestry. In parentheses, the number of participants carriers of each genotype is shown.
In addition to UGT1A1, we found 11 other regions with a suggestive association (p-value between 1 × 10⁻⁵ and 5 × 10⁻⁸). Among the suggestive variants, we found the rs1910167 variant, effect allele C, in the solute carrier organic anion transporter family member 1B3 (SLCO1B3), 1B7 (SLCO1B7), and upstream of 1B1 (SLCO1B1), beta = 0.16 mg/dL total bilirubin, p = 1.26 × 10⁻⁶. This variant masked 368 other significant variants in the vicinity in high linkage disequilibrium and has a frequency of 8.3% in GOCS (Supplementary Table S4).
The variant rs887829 near UGT1A1 explained 34.98% of the variation in total bilirubin levels, while the rs1910167 variant near SLCO1B1 only explained 4.61%. When considering the combined effect, both variants explained 36.86% of the variation in bilirubin levels in the entire cohort.
Other variants suggestive of association were found in candidate genes LRBA, FSTL4, AKR1B1, GFRA2, ODF1, CPNE7, ZNF100, RBM38, and CDH4 (Table 2). The GWAS genomic inflation factor was λ = 1.008 (Supplementary Figure S4).
Local ancestry deconvoluted GWAS of total bilirubin in GOCS participants
By considering the deconvoluted genotypes with NAT origin, we found that the variant with the strongest association was also rs887829, upstream of the UGT1A1 gene, beta = 0.35 mg/dL total bilirubin, p = 3.29 × 10⁻¹⁷, with a frequency of 34.2% in the NAT component of GOCS (Table 2; Supplementary Table S5). We also found six other regions with variants suggestive of association near MB21D2, OFCC1, CDHR3, SLC24A2, IGSF9B, and NPAS3 genes (Table 2). When we performed the same analysis but considering the inferred haplotypes for EUR ancestry, the variant with the strongest association was also rs887829, upstream of UGT1A1, beta = 0.28, p = 1.14 × 10⁻²³, with a frequency of 32.1% in the EUR component of GOCS (Table 2; Supplementary Table S5).
We found 15 other regions with variants suggestive of association. One of these regions included the rs1910167 variant in SLCO1B3/SLCO1B7 and upstream of SLCO1B1, beta = 0.24 mg/dL total bilirubin, p = 4.35 × 10⁻⁶. This variant has an allele frequency of 14.2% in the EUR component of GOCS but only 0.3% in the NAT component (Table 2; Supplementary Table S5). Other variants suggestive of association were in the candidate genes GALNT15, SHROOM3, FSTL4, NRSN1, COL11A2, MAGI2, CSMD1/MCPH1, ASTN2, ECHDC3, CABCOCO1, DKK3, MYBPC1, PPCDC, and ATXN7L3 (Table 2).
The genomic inflation factor was λ = 1.01646 for NAT ancestry and λ = 1.01646 for EUR LAD-GWAS (Supplementary Figure S4).
In general, carriers of the TT genotype of rs887829 in the NAT ancestry of GOCS averaged 4-fold higher bilirubinemia than carriers of the CC genotype (p = 2.82 × 10⁻¹²). In contrast, carriers of the TT genotype in the EUR ancestral component of GOCS averaged 3.2 times higher bilirubinemia (p = 1.09 × 10⁻²⁷) (Figure 4).
For the GWAS with the NAT ancestral component of GOCS, the rs887829 variant near UGT1A1 explained 37.6% of the variation in bilirubin levels. When considering the GWAS with the EUR ancestry of GOCS, this variant explained 28.4% of the variation. In comparison, the rs1910167 near SLCO1B1 variant explained 12.3%, and the combination of rs887829/rs1910167 explained 42% of the variation in bilirubin levels.
When we compared the allele frequencies of the top variants between the entire GOCS cohort and the estimated NAT or EUR ancestry, we found relevant differences. The variant rs28969691, close to UGT1A1, was highly prevalent in NAT ancestry (19.8%) but almost absent in EUR (0.9%). Conversely, variants close to SLCO1B1, FSTL4, RBM38, and CSMD1 genes are virtually absent in NAT ancestry (Supplementary Table S5).
The frequency of the top variants in the GOCS cohort correlated very well with those described in gnomAD for admixed Latin ancestry (Pearson´s r = 0.99). Still, the correlation was lower when compared with the NAT or EUR ancestry estimated in GOCS (Pearson´s r = 0.93 and r = 0.95, respectively). The frequencies of NAT variants estimated in GOCS were similar to those estimated in gnomAD (Pearson´s r = 0.96) and those in the HGDP (Pearson´s r = 0.97). For the estimated EUR ancestry in GOCS, there was a high correlation with the frequency of variants in gnomAD for non-Finnish Europeans (Pearson´s r = 0.99) (Supplementary Table S5).
Discussion
Although association studies to describe the genetic determinants of bilirubin levels in different populations began more than 10 years ago, the effect and magnitude of such genetic variants in Native American ancestry was unknown. The admixed Latino population has NAT, EUR, and AFR ancestry components, so building cohorts with pure NAT ancestry can be highly complex and costly. In the present study, we used Local Ancestry Deconvolution to isolate chromosomal fragments of NAT origin of Chilean adolescents and performed a GWAS with serum bilirubin levels. Our results showed for the first time that UGT1A1 is also the most strongly associated gene with serum bilirubin levels in NAT ancestry, suggesting several differences in the magnitude of association compared to EUR ancestry.
Global and local ancestry in GOCS
As a result of the global ancestry analysis, we found that NAT ancestry was separated into three subpopulations. One subpopulation grouped samples with Central American origin; a second subpopulation grouped the 1KGP participants of Peruvian origin, which we called the Andean subpopulation, while a third subcomponent we believe corresponds to Mapuche origin. We make this statement since most GOCS participants cluster in this group, and we previously determined that the main component of NAT origin in our cohort is of Mapuche origin and marginally of Aymara origin (Vicuña et al., 2021).
Considering this, constructing a reference panel for local ancestry based only on genotypes obtained from the 1KGP and HGDP projects would greatly bias our results because the ancestry component of Mapuche origin is practically non-existent in those participants (Supplementary Figure S2). Therefore, we decided to include 16 GOCS participants with a higher proportion of NAT ancestry in our panel to account for haplotypes of Mapuche origin.
Although it was initially described that the origin of Chileans is predominantly NAT, EUR, and to a lesser extent, AFR (52%, 45%, and 3%, respectively) (Eyheramendy et al., 2015), recent studies suggest that there is also a southern Mediterranean or Middle East ancestry component, as a product of the migration of Christian converts of non-European origin that dates to the Spanish colonization of the Americas (Chacón-Duque et al., 2018). This study mentions that Sephardic/East/South Mediterranean ancestry averages 4% in the Chilean population (Chacón-Duque et al., 2018). By including the HGDP samples in our global ancestry estimate, which contains 162 participants of Middle Eastern origin (Bedouin, Druze, Mozabite, and Palestinian), we could dissect this component in the GOCS cohort. It averaged 4.75%, which is quite close to that reported by Chacón-Duque et al. (Supplementary Table S1). For simplicity of analysis, we considered Middle East ancestry as part of the Europeans in this work.
We found a high degree of agreement when we compared the global ancestry with the local ancestry estimates. However, ADMIXTURE could be overestimating the proportion of NAT ancestry. This will occur because of the lack of pure Mapuche or Aymara ancestry samples to include in our reference panel for a better definition of the outgroup. When considering the 16 GOCS samples used in our reference panel, the proportion of NAT ancestry estimated by RFMix ranged from 75% to 96%, with an average of 82.9% (Supplementary Table S3). Despite the differences obtained between ADMIXTURE and RFMix, our estimates are valid considering the high agreement for NAT and EUR ancestry (R2 = 0.99 for each, Supplementary Figure S3).
Traditional GWAS and LAD-GWAS of serum bilirubin
Although the standard practice is to use local ancestry as an adjustment variable in regression models to reduce the confounding effect of population stratification by ethnicity, our focus of analysis is different. Because our goal was to determine the effect of NAT ancestry on the regulation of bilirubin levels, rather than adjusting, we stratified the GOCS cohort into its different ancestral components.
When we used the Tractor pipeline to extract the haplotype phases and separate them according to NAT, EUR, or AFR origin, several fragments (or tracts) with discordant ancestry (or half-call) were generated. Although we could have treated this discordant ancestry as haploid for GWAS, we decided to approach the analysis more conservatively and treat them as missing due to our reduced sample size. In practice, with the Tractor pipeline, we generated a sub-cohort for each variant, and the participants of these sub-cohorts are all those who called a diploid genotype for that variant in a specific ancestry; therefore, genotypes for an individual are represented in a (3 x n)ijk matrix, where 3 is the possible allele combinations (reference/reference, reference/alternative, and alternative/alternative), and n is the number of variants that called for a diploid genotype in ancestries i, j, or k. Therefore, the number of participants analyzed in each LAD-GWAS was variable for each variant, ranging between 166 and 239 for the variants in Table 2 with estimated origin in NAT or EUR ancestry, unlike the 707 participants included in the traditional GWAS.
Both in the entire cohort GWAS and the LAD-GWAS, we found that the most significantly associated variant was rs887829. This variant is in the promoter of the UGT1A1 gene, 310 bp upstream of the (TA)n repeat UGT1A1*28 (rs3064744) at the TATA box, which is known to reduce the expression of UGT1A1 enzyme on Gilbert-Meulengracht´s Syndrome, drifting into reduced bilirubin glucuronidation (Bosma et al., 1995; Shin et al., 2015). Glucuronidation is an essential mechanism in forming water-soluble substrates not limited to bilirubin but many xenobiotics, leading them to excretion from the body via bile or urine (Tephly and Burchell, 1990). Thus, UGT1A1 as well as other UGT genes have important roles in drug/xenobiotic and polyphenol metabolism (An et al., 2015; Gammal et al., 2016; Allegra et al., 2017; Xu et al., 2017; Leger et al., 2018). Recent research has shown that high bilirubin levels within normal ranges are strongly associated with a lower prevalence of diseases mediated by oxidative stress, including diabetes, metabolic syndrome, and cardiovascular disease (Lin et al., 2009b; Jylhävä et al., 2012; Cox et al., 2013; Benton et al., 2015).
Among the variants suggestive of association, it is important to mention those in SLCO1B3/SLCO1B7 genes and upstream SLCO1B1, both for the entire GOCS participants and for the LAD-GWAS with EUR ancestry, but not for the LAD-GWAS with NAT ancestry. SLCO1B1 is a hepatic transporter with an affinity for bilirubin and is associated with the levels of this molecule in multiple studies with participants of European and Middle East ancestry (Johnson et al., 2009; Sakaue et al., 2021; Sinnott-Armstrong et al., 2021).
Even when we found variants suggestive of association in other genes, none of them have been described in other populations, both for the traditional GWAS and for the LAD-GWAS, without a priori biological plausibility for these results.
The high correlation between variants of NAT estimated in GOCS with those estimated for Amerindigenous in gnomAD and those of NAT in the HGDP project partially validate the deconvolution of local ancestry performed in our study. However, a wider analysis is required to perform a comprehensive estimate of variant deconvolution.
When we compared the frequency of variants between NAT and European ancestry, we found important differences. This observation suggests that polygenic risk scores or the instrumental variables in Mendelian Randomization studies, might not have direct applicability when used in populations genetically different from those for which they were described. A local ancestry deconvolution method is an interesting approach that allows identifying variants with significantly different frequencies between populations to adjust these genetic instruments and achieve greater applicability.
Strengths and weaknesses of this study
The present study is the first to report the isolated effect of NAT ancestry in the regulation of serum bilirubin levels, and the results are consistent with those described in other regions, such as Europe, Africa, Asia, and Oceania. One of the weaknesses of the study is the relatively small sample size, which prevents obtaining information on variants such as those described in the SLCO1B1, SLCO1B3, and SLCO1B7 genes, significant in the European population, but with shallow allelic frequency in the NAT component. Another drawback is that we cannot confirm whether new players, different from UGT1A1, are relevant in NAT ancestry for bilirubin regulation due to the lack of a cohort to replicate our suggestive findings.
Conclusion
We show that the local ancestry deconvolution method allows to efficiently isolate a component of ancestry in admixed populations. Using this approximation, we were able to determine that variants in the UGT1A1 gene are the most strongly associated with serum bilirubin levels in the inferred Native American ancestry. Our results confirm the pan-ethnic relevance of UGT1A1 in regulating bilirubin levels and illustrates the general value of the local ancestry deconvolution approach to assess isolated ancestry effects in admixed populations.
Data availability statement
The data presented in the study are deposited in the UC Research Data Repository (https://doi.org/10.60525/04teye511/JLG0FV).
Ethics statement
The studies involving humans were approved by the Comité Ético-Científico (CEC)—School of Medicine, Pontificia Universidad Católica de Chile. The studies were conducted in accordance with the local legislation and institutional requirements. Written informed consent for participation in this study was provided by the participants’ legal guardians/next of kin.
Author contributions
JPM: Conceptualization, Data curation, Formal Analysis, Investigation, Methodology, Software, Validation, Visualization, Writing–original draft, Writing–review and editing. AP: Funding acquisition, Investigation, Project administration, Writing–review and editing. CC: Funding acquisition, Investigation, Project administration, Writing–review and editing. JM: Writing–review and editing. GA: Conceptualization, Data curation, Investigation, Methodology, Project administration, Writing–review and editing. JG: Conceptualization, Data curation, Funding acquisition, Investigation, Methodology, Project administration, Writing–review and editing. JS: Conceptualization, Data curation, Funding acquisition, Investigation, Methodology, Project administration, Supervision, Writing–original draft, Writing–review and editing.
Funding
The author(s) declare that financial support was received for the research, authorship, and/or publication of this article. This work was supported by projects FONDECYT 1150416, 1161456, 1200839, and 11190856 from Agencia Nacional de Investigación y Desarrollo de Chile ANID (former Comisión Nacional de Investigación Científica y Tecnológica de Chile CONICYT).
Acknowledgments
Genotyping was performed at the Spanish National Cancer Research Centre in the Human Genotyping lab, a member of CeGen, PRB3, and is supported by grant PT17/0019, of the PE I + D + i 2013–2016, funded by ISCIII and ERDF. JPM thanks the Advanced Center for Chronic Diseases (ACCDiS) for its doctoral fellowship in the Ph.D. Program in Epidemiology, Pontificia Universidad Católica de Chile. The authors would like to thank Prof. Idoia Labayen (Universidad Pública de Navarra, Pamplona, Spain) for her helpful comments.
Conflict of interest
The authors declare that the research was conducted in the absence of any commercial or financial relationships that could be construed as a potential conflict of interest.
Publisher’s note
All claims expressed in this article are solely those of the authors and do not necessarily represent those of their affiliated organizations, or those of the publisher, the editors and the reviewers. Any product that may be evaluated in this article, or claim that may be made by its manufacturer, is not guaranteed or endorsed by the publisher.
Supplementary material
The Supplementary Material for this article can be found online at: https://www.frontiersin.org/articles/10.3389/fgene.2024.1382103/full#supplementary-material
References
Alexander, D. H., Novembre, J., and Lange, K. (2009). Fast model-based estimation of ancestry in unrelated individuals. Genome Res. 19, 1655–1664. doi:10.1101/gr.094052.109
Allegra, S., De Francia, S., Cusato, J., Arduino, A., Massano, D., Longo, F., et al. (2017). Deferasirox pharmacogenetic influence on pharmacokinetic, efficacy and toxicity in a cohort of pediatric patients. Pharmacogenomics 18, 539–554. doi:10.2217/pgs-2016-0176
An, S. H., Chang, B. C., Lee, K. E., and Gwak, H. S. (2015). Influence of UDP-glucuronosyltransferase polymorphisms on stable warfarin doses in patients with mechanical cardiac valves. Cardiovasc Ther. 33, 324–328. doi:10.1111/1755-5922.12147
Atkinson, E. G., Maihofer, A. X., Kanai, M., Martin, A. R., Karczewski, K. J., Santoro, M. L., et al. (2021). Tractor uses local ancestry to enable the inclusion of admixed individuals in GWAS and to boost power. Nat. Genet. 53, 195–204. doi:10.1038/s41588-020-00766-y
Auton, A., Abecasis, G. R., Altshuler, D. M., Durbin, R. M., Abecasis, G. R., Bentley, D. R., et al. (2015). A global reference for human genetic variation. Nature 526, 68–74. doi:10.1038/nature15393
Benton, M. C., Lea, R. A., Macartney-Coxson, D., Bellis, C., Carless, M. A., Curran, J. E., et al. (2015). Serum bilirubin concentration is modified by UGT1A1 Haplotypes and influences risk of Type-2 diabetes in the Norfolk Island genetic isolate. BMC Genet. 16, 136. doi:10.1186/s12863-015-0291-z
Bergström, A., McCarthy, S. A., Hui, R., Almarri, M. A., Ayub, Q., Danecek, P., et al. (2020). Insights into human genetic variation and population history from 929 diverse genomes. Science 1979, eaay5012. doi:10.1126/science.aay5012
Bosma, P. J., Chowdhury, J. R., Bakker, C., Gantla, S., de Boer, A., Oostra, B. A., et al. (1995). The genetic basis of the reduced expression of bilirubin UDP-glucuronosyltransferase 1 in gilbert’s syndrome. N. Engl. J. Med. 333, 1171–1175. doi:10.1056/NEJM199511023331802
Chacón-Duque, J. C., Adhikari, K., Fuentes-Guajardo, M., Mendoza-Revilla, J., Acuña-Alonzo, V., Barquera, R., et al. (2018). Latin Americans show wide-spread Converso ancestry and imprint of local Native ancestry on physical appearance. Nat. Commun. 9, 5388. doi:10.1038/s41467-018-07748-z
Chen, G., Ramos, E., Adeyemo, A., Shriner, D., Zhou, J., Doumatey, A. P., et al. (2013). UGT1A1 is a major locus influencing bilirubin levels in African Americans. Genet. Epidemiol. 37, 463–468. doi:10.1038/ejhg.2011.206
Cox, A. J., Ng, M. C.-Y., Xu, J., Langefeld, C. D., Koch, K. L., Dawson, P. A., et al. (2013). Association of SNPs in the UGT1A gene cluster with total bilirubin and mortality in the Diabetes Heart Study. Atherosclerosis 229, 155–160. doi:10.1016/j.atherosclerosis.2013.04.008
Dai, X., Wu, C., He, Y., Gui, L., Zhou, L., Guo, H., et al. (2013). A genome-wide association study for serum bilirubin levels and gene-environment interaction in a Chinese population. Genet. Epidemiol. 37, 293–300. doi:10.1002/gepi.21711
Das, S., Forer, L., Schönherr, S., Sidore, C., Locke, A. E., Kwong, A., et al. (2016). Next-generation genotype imputation service and methods. Nat. Genet. 48, 1284–1287. doi:10.1038/ng.3656
De Onis, M., Onyango, A. W., Borghi, E., Siyam, A., Nishida, C., and Siekmann, J. (2007). Development of a WHO growth reference for school-aged children and adolescents. Bull. World Health Organ 85, 660–667. doi:10.2471/BLT.07.043497
Eyheramendy, S., Martinez, F. I., Manevy, F., Vial, C., and Repetto, G. M. (2015). Genetic structure characterization of Chileans reflects historical immigration patterns. Nat. Commun. 6, 6472–6510. doi:10.1038/ncomms7472
Fuchsberger, C., Abecasis, G. R., and Hinds, D. A. (2015). minimac2: faster genotype imputation. Bioinformatics 31, 782–784. doi:10.1093/BIOINFORMATICS/BTU704
Fujiwara, R., Schaeffeler, E., Nies, A. T., Schwab, M., Haag, M., and Zanger, U. M. (2017). Systemic regulation of bilirubin homeostasis: potential benefits of hyperbilirubinemia. Hepatology 67, 1609–1619. doi:10.1002/hep.29599
Gammal, R., Court, M., Haidar, C., Iwuchukwu, O., Gaur, A., Alvarellos, M., et al. (2016). Clinical pharmacogenetics implementation consortium (CPIC) guideline for UGT1A1 and atazanavir prescribing. Clin. Pharmacol. Ther. 99, 363–369. doi:10.1002/cpt.269
Jedlitschky, G., Leier, I., Buchholz, U., Hummel-Eisenbeiss, J., Burchell, B., and Keppler, D. (1997). ATP-dependent transport of bilirubin glucuronides by the multidrug resistance protein MRP1 and its hepatocyte canalicular isoform MRP2. Biochem. J. 327, 305–310. doi:10.1042/bj3270305
Johnson, A. D., Kavousi, M., Smith, A. V., Chen, M.-H., Dehghan, A., Aspelund, T., et al. (2009). Genome-wide association meta-analysis for total serum bilirubin levels. Hum. Mol. Genet. 18, 2700–2710. doi:10.1093/hmg/ddp202
Jylhävä, J., Lyytikäinen, L.-P., Kähönen, M., Hutri-Kähönen, N., Kettunen, J., Viikari, J., et al. (2012). A genome-wide association study identifies UGT1A1 as a regulator of serum cell-free DNA in young adults: the cardiovascular risk in young Finns study. PLoS One 7, e35426. doi:10.1371/journal.pone.0035426
Kang, T.-W., Kim, H.-J., Ju, H., Kim, J.-H., Jeon, Y.-J., Lee, H.-C., et al. (2010). Genome-wide association of serum bilirubin levels in Korean population. Hum. Mol. Genet. 19, 3672–3678. doi:10.1093/hmg/ddq281
Kronenberg, F., Coon, H., Gutin, A., Abkevich, V., Samuels, M. E., Ballinger, D. G., et al. (2002). A genome scan for loci influencing anti-atherogenic serum bilirubin levels. Eur. J. Hum. Genet. 10, 539–546. doi:10.1038/sj.ejhg.5200842
Leger, P., Chirwa, S., Nwogu, J. N., Turner, M., Richardson, D. M., Baker, P., et al. (2018). Race/ethnicity difference in the pharmacogenetics of bilirubin-related atazanavir discontinuation. Pharmacogenet Genomics 28, 1–6. doi:10.1097/FPC.0000000000000316
Lin, J.-P., Schwaiger, J. P., Cupples, L. A., O’donnell, C. J., Zheng, G., Schoenborn, V., et al. (2009a). Conditional linkage and genome-wide association studies identify UGT1A1 as a major gene for anti-atherogenic serum bilirubin levels-The Framingham Heart Study. Atherosclerosis 206, 228–233. doi:10.1016/j.atherosclerosis.2009.02.039
Lin, R., Wang, Y., Wang, Y., Fu, W., Zhang, D., Zheng, H., et al. (2009b). Common variants of four bilirubin metabolism genes and their association with serum bilirubin and coronary artery disease in Chinese Han population. Pharmacogenet Genomics 19, 310–318. doi:10.1097/FPC.0b013e328328f818
Maples, B. K., Gravel, S., Kenny, E. E., and Bustamante, C. D. (2013). RFMix: a discriminative modeling approach for rapid and robust local-ancestry inference. Am. J. Hum. Genet. 93, 278–288. doi:10.1016/J.AJHG.2013.06.020
Melton, P. E., Haack, K., Göring, H. H., Laston, S., Umans, J. G., Lee, E. T., et al. (2011). Genetic influences on serum bilirubin in American Indians: the strong heart family study. Am. J. Hum. Biol. 23, 118–125. doi:10.1002/ajhb.21114
Méndez-Sánchez, N., Qi, X., Vitek, L., and Arrese, M. (2019). Evaluating an outpatient with an elevated bilirubin. Am. J. Gastroenterology 114, 1185–1188. doi:10.14309/ajg.0000000000000336
Miranda, J. P., Lardone, M. C., Rodríguez, F., Cutler, G. B., Santos, J. L., Corvalán, C., et al. (2022). Genome-wide association study and polygenic risk scores of serum DHEAS levels in a Chilean children cohort. J. Clin. Endocrinol. Metab. 107, e1727–e1738. doi:10.1210/CLINEM/DGAB814
Price, A. L., Patterson, N. J., Plenge, R. M., Weinblatt, M. E., Shadick, N. A., and Reich, D. (2006). Principal components analysis corrects for stratification in genome-wide association studies. Nat. Genet. 38, 904–909. doi:10.1038/ng1847
Purcell, S., Neale, B., Todd-Brown, K., Thomas, L., Ferreira, M. A. R., Bender, D., et al. (2007). PLINK: a tool set for whole-genome association and population-based linkage analyses. Am. J. Hum. Genet. Am. J. Hum. Genet 8181, 559–575. doi:10.1086/519795
Ritter, J. K., Crawford, J. M., and Owens, I. S. (1991). Cloning of two human liver bilirubin UDP-glucuronosyltransferase cDNAs with expression in COS-1 cells. J. Biol. Chem. 266, 1043–1047. doi:10.1016/S0021-9258(17)35280-8
Rosenthal, P., Pincus, M., and Fink, D. (1984). Sex- and age-related differences in bilirubin concentrations in serum. Clin. Chem. 30, 1380–1382. doi:10.1093/clinchem/30.8.1380
Sakaue, S., Kanai, M., Tanigawa, Y., Karjalainen, J., Kurki, M., Koshiba, S., et al. (2021). A cross-population atlas of genetic associations for 220 human phenotypes. Nat. Genet. 53, 1415–1424. doi:10.1038/s41588-021-00931-x
Sánchez, U., Weisstaub, G., Santos, J., Corvalán, C., and Uauy, R. (2016). GOCS cohort: children’s eating behavior scores and BMI. Eur. J. Clin. Nutr. 70, 925–928. doi:10.1038/ejcn.2016.18
Sanna, S., Busonero, F., Maschio, A., McArdle, P. F., Usala, G., Dei, M., et al. (2009). Common variants in the SLCO1B3 locus are associated with bilirubin levels and unconjugated hyperbilirubinemia. Hum. Mol. Genet. 18, 2711–2718. doi:10.1093/hmg/ddp203
Shin, H. J., Kim, J. Y., Cheong, H. S., Na, H. S., Shin, H. D., and Chung, M. W. (2015). Functional study of haplotypes in UGT1A1 promoter to find a novel genetic variant leading to reduced gene expression. Ther. Drug Monit. 37, 369–374. doi:10.1097/FTD.0000000000000154
Sinnott-Armstrong, N., Tanigawa, Y., Amar, D., Mars, N., Benner, C., Aguirre, M., et al. (2021). Genetics of 35 blood and urine biomarkers in the UK Biobank. Nat. Genet. 53, 185–194. doi:10.1038/s41588-020-00757-z
Strassburg, C. P. (2010). Hyperbilirubinemia syndromes (Gilbert-Meulengracht, crigler-najjar, dubin-johnson, and rotor syndrome). Best. Pract. Res. Clin. Gastroenterol. 24, 555–571. doi:10.1016/j.bpg.2010.07.007
Taliun, D., Harris, D. N., Kessler, M. D., Carlson, J., Szpiech, Z. A., Torres, R., et al. (2021). Sequencing of 53,831 diverse genomes from the NHLBI TOPMed Program. Nature 590, 290–299. doi:10.1038/s41586-021-03205-y
Tephly, T. R., and Burchell, B. (1990). UDP-glucuronosyltransferases: a family of detoxifying enzymes. Trends Pharmacol. Sci. 11, 276–279. doi:10.1016/0165-6147(90)90008-V
Tobar, H. E., Cataldo, L. R., González, T., Rodríguez, R., Serrano, V., Arteaga, A., et al. (2019). Identification and functional analysis of missense mutations in the lecithin cholesterol acyltransferase gene in a Chilean patient with hypoalphalipoproteinemia. Lipids Health Dis. 18, 132–210. doi:10.1186/s12944-019-1045-0
Vicuña, L., Norambuena, T., Miranda, J. P., Pereira, A., Mericq, V., Ongaro, L., et al. (2021). Novel loci and Mapuche genetic ancestry are associated with pubertal growth traits in Chilean boys. Hum. Genet. 140, 1651–1661. doi:10.1007/s00439-021-02290-3
Xu, J., Boström, A. E., Saeed, M., Dubey, R. K., Waeber, G., Vollenweider, P., et al. (2017). A genetic variant in the catechol-O-methyl transferase (COMT) gene is related to age-dependent differences in the therapeutic effect of calcium-channel blockers. Medicine 96, e7029. doi:10.1097/MD.0000000000007029
Keywords: bilirubin, local ancestry deconvolution, GWAS, population genomics, genetic epidemiology, native American, UGT1A1
Citation: Miranda JP, Pereira A, Corvalán C, Miquel JF, Alberti G, Gana JC and Santos JL (2024) Genetic determinants of serum bilirubin using inferred native American gene variants in Chilean adolescents. Front. Genet. 15:1382103. doi: 10.3389/fgene.2024.1382103
Received: 05 February 2024; Accepted: 18 April 2024;
Published: 17 May 2024.
Edited by:
Kazumichi Fujioka, Kobe University, JapanReviewed by:
Cheryl D. Cropp, Morehouse School of Medicine, United StatesRocio Gomez, Center for Research and Advanced Studies (CINVESTAV), Mexico
Emilio Cordova, National Institute of Genomic Medicine (INMEGEN), Mexico
Copyright © 2024 Miranda, Pereira, Corvalán, Miquel, Alberti, Gana and Santos. This is an open-access article distributed under the terms of the Creative Commons Attribution License (CC BY). The use, distribution or reproduction in other forums is permitted, provided the original author(s) and the copyright owner(s) are credited and that the original publication in this journal is cited, in accordance with accepted academic practice. No use, distribution or reproduction is permitted which does not comply with these terms.
*Correspondence: José L. Santos, anNhbnRvc21AdWMuY2w=