 Luis E. Hernandez-Castro1,2*
 Elizabeth Anne Jessie Cook3,4†
 Oswald Matika1,2
 Isaac Joseph Mengele5,6
 Shabani Kiyabo Motto5,6
 Shedrack Festo Bwatota5
 Bibiana Zirra-Shallangwa2
 Ricardo Pong-Wong2
 James Prendergast1,2
 Raphael Mrode7
 Philip G. Toye3,4Daniel Mushumbusi Komwihangilo8Eliamoni Lyatuu9
 Benedict E. Karani3,4
 Getrude Nangekhe3,4Ally Okeyo Mwai3
 Gabriel Mkilema Shirima5
 Barend Mark de Clare Bronsvoort1,2*†
- 1Centre for Tropical Livestock Genetics and Health (CTLGH), Roslin Institute, University of Edinburgh, Roslin, United Kingdom
- 2The Roslin Institute and The Royal (Dick) School of Veterinary Studies, The University of Edinburgh, Edinburgh, United Kingdom
- 3International Livestock Research Institute (ILRI), Nairobi, Kenya
- 4Centre for Tropical Livestock Genetics and Health (CTLGH), ILRI Kenya, Nairobi, Kenya
- 5Department of Global Health and Bio-Medical Sciences, School of Life Science and Bioengineering, The Nelson Mandela African Institution of Science and Technology, Arusha, Tanzania
- 6Tanzania Veterinary Laboratory Agency, Central Veterinary Laboratory, Dar es Salaam, Tanzania
- 7Scotland’s Rural College, Edinburgh, United Kingdom
- 8Tanzania Livestock Research Institute (TALIRI), Dodoma, Tanzania
- 9International Livestock Research Institute (ILRI), Dar es Salaam, Tanzania
Identifying the genetic determinants of host defence against infectious pathogens is central to enhancing disease resilience and therapeutic efficacy in livestock. Here, we investigated immune response heritability to important infectious diseases affecting smallholder dairy cattle using variance component analysis. We also conducted genome-wide association studies (GWAS) to identify genetic variants that may help understand the underlying biology of these health traits. By assessing 668,911 single-nucleotide polymorphisms (SNPs) genotyped in 2,045 crossbred cattle sampled from six regions of Tanzania, we identified high levels of interregional admixture and European introgression, which may increase infectious disease susceptibility relative to indigenous breeds. Heritability estimates were low to moderate, ranging from 0.03 (SE ± 0.06) to 0.44 (SE ± 0.07), depending on the health trait. GWAS results revealed several loci associated with seropositivity to the viral diseases Rift Valley fever and bovine viral diarrhoea, the protozoan parasites Neospora caninum and Toxoplasma gondii, and the bacterial pathogens Brucella sp, Leptospira hardjo, and Coxiella burnetii. The identified quantitative trait loci mapped to genes involved in immune defence, tumour suppression, neurological processes, and cell exocytosis. We propose that our results provide a basis for future understanding of the cellular pathways contributing to general and taxon-specific infection responses, and for advancing selective breeding and therapeutic target design.
1 Introduction
The smallholder dairy cattle sector in Tanzania makes an important contribution to the country’s gross domestic product and is a source of food, income, and employment for Tanzanian households (Swai and Karimuribo, 2011a; Swai and Karimuribo, 2011b; Katjiuongua and Nelgen, 2014). Despite control efforts, animal diseases remain a significant constraint to productivity and profitability in the sector, with an estimated mortality of up to 14% across herds (Swai et al., 2010; Alonso et al., 2015). Cattle pathogens causing abortion (e.g., Rift Valley fever virus (RVFV), bovine viral diarrhoea virus (BVDV) and Neospora caninum), and/or zoonoses (e.g., Brucella abortus, Leptospira hardjo, Coxiella burnetii, and Toxoplasma gondii) contribute greatly to economic losses, threaten human public health, and are currently circulating at considerable levels across regions of Tanzania (Bwatota et al., 2022; Mengele et al., 2023; Motto et al., 2023; Lankester et al., 2024).
The defence processes (resilience) by which organisms limit pathogen loads (resistance) or the damage caused by given pathogen loads (tolerance) are crucial for the epidemiology of infectious diseases (Råberg et al., 2007; Horns and Hood, 2012; Knap and Doeschl-Wilson, 2020). Changes in the host’s immunological and pathogenesis mechanisms can particularly reduce transmission, and therefore the prevalence, by blocking infections or eliminating pathogens (Ayres and Schneider, 2008; Medzhitov et al., 2012). Natural host genetic variability (e.g., α-thalassaemia, sickle-cell haemoglobin, and G6PDH deficiency) has been shown to protect against deadly Plasmodium falciparum infection (Flint et al., 1986; Lelliott et al., 2015; Archer et al., 2018; Kwok et al., 2021). Several genetic variants and genes (e.g., HLA and IFNAR2 genes) linked to host pathophysiological processes have been associated with SARS-CoV-2 susceptibility and COVID-19 severity (Ovsyannikova et al., 2020; Velavan et al., 2021). Recently, a CRISPR-/Cas9-mediated knockout that alters the BVDV binding domain of the CD46 gene showed reduced susceptibility in a cloned calf (Workman et al., 2021; Workman et al., 2023). Therefore, understanding the genetic basis of disease resilience could complement current control strategies and reduce the burden of endemic or emerging infectious diseases (Knap and Doeschl-Wilson, 2020; Hulst et al., 2021).
Given the limited resources and feasibility of deploying disease control options (e.g., vaccination, biosecurity, and contact tracing), health improvement in smallholder dairy cattle via genomic selection (GS) could complement conventional disease control efforts in Tanzania and other low- and middle-income countries (LMICs). For instance, genetic improvement and quantitative trait locus (QTL) identification, mainly for production traits such as milk yield, are already being implemented in smallholder crossbred cattle populations in India (Al Kalaldeh et al., 2021; Al Kalaldeh et al., 2023). GS implementation in smallholder systems such as those in India and East Africa is challenging, but progress has been made in building breeding infrastructure, routine phenotype recording, affordable genotyping, analytical tools, and human capacity (Mrode et al., 2019; Marshall et al., 2019; Ibeagha-Awemu et al., 2019; Mrode et al., 2021; Brown et al., 2016). This work has allowed a better understanding of the genetic architecture of tolerance/resistance to important diseases in African livestock populations [e.g., East Coast fever in cattle and indigenous chicken infectious diseases (Banos et al., 2020; Wragg et al., 2022)].
Host antibody responses due to recent infection or previous exposure are heritable, and the genetic factors influencing these traits have been explored for several human infectious pathogens (Rubicz et al., 2011; Rubicz et al., 2015; Mangino et al., 2017). The heritability of antibody responses to infectious diseases has also been described in several livestock species. For example, Liu et al. (2014) reported heritability estimates of 0.36 (±0.075) and 0.35 (±0.077), respectively, for antibody responses to Newcastle disease and avian influenza virus in poultry. Heritability estimates of 0.10 (±0.05) for antibody responses to Mycobacterium avium subsp. paratuberculosis, which causes diarrhoea and decreases milk yield, were reported in Danish dairy cattle (Mortensen et al., 2004). Moderate heritability estimates of 0.32 (±0.09) for immune competence after vaccination against Clostridium tetani in Angus beef calves suggest an opportunity for immune competency improvement via genetic selection (Hine et al., 2019). Antibody responses to bovine herpesvirus-1 (BoHV-1), which causes latent infectious bovine rhinotracheitis (IBR), had heritability estimates ranging from 0.12 (±0.05) to 0.14 (±0.04) in Irish cattle (Ring et al., 2019). Therefore, including health-related traits (e.g., humoral immune response) in breeding programmes would be beneficial as a long-term tool to reduce the disease burden in livestock.
Understanding the underlying biology of health traits can be achieved by identifying QTL regions associated with disease resistance. Incorporating relevant associated SNPs into custom-designed SNP chip arrays allows higher accuracy in genomic selection breeding programmes, narrows candidate genes for gene expression or editing, and helps develop diagnostic tools and therapeutic agents. Resistance to Mycobacterium bovis has been attributed to several regions in the Bos taurus genome, such as the loci containing the PTPRT and MYO3B genes (Bermingham et al., 2014). Tolerance to the protozoan parasite Theileria parva (East Coast fever—ECF) in cattle has been linked to a locus spanning a paralogue of the FAF1 gene. In field trials, 100% of animals with a tolerance allele survived T. parva infection, although this SNP variant explained approximately 31.9% of the total phenotypic variance (Wragg et al., 2022). The knowledge and identification of putative candidate genes have allowed the editing of bovine genomes to express resistance to pathogens such as M. bovis or BVDV (Workman et al., 2021; Workman et al., 2023; Wu et al., 2015). In complex trait studies, such as immune response traits, several genes may contribute small effects in parallel, and therefore, the identification of these underlying mechanisms may be challenging at any given time during the immune response process (e.g., activation of the innate and acquired immune response) (Siwek et al., 2015; Gratten and Visscher, 2016; Solovieff et al., 2013; Leach et al., 2010).
The current study quantifies variation in antibody responses to zoonotic and reproductive infectious diseases and estimates their genetic parameters in highly admixed smallholder dairy cattle populations in Tanzania. We investigated the presence or absence of population structure in our data, computed estimates of heritability for the traits under study, and conducted GWAS using a 668,911 SNP chip array in 2,045 crossbred smallholder dairy cattle. The underlying genetic architecture revealed using GWAS allows the identification of potential QTL regions of importance in livestock health and breed improvement programmes. We discuss possible cellular pathways contributing to general and taxon-specific infection responses and the underlying biology of health traits.
2 Results
2.1 Genotyping and serological traits of Tanzanian smallholder cattle
A total of 2,045 crossbred cattle were sampled from six regions that are important for dairy production in Tanzania (Figure 1A) and tested for antibodies to seven pathogens. The animals were initially genotyped with a mid-density (100K) array, and then, the genotypes were imputed to a high-density (∼600K) array (see Methods). Thirty-four animals were removed as they failed the quality control (QC) measures from the imputation pipeline due to high levels of missing SNPs. A further 34 animals with high levels of relatedness (>0.25) to another animal based on the KING-robust estimator were removed (that is, one animal from each relatedness comparison pair was removed) (Manichaikul et al., 2010). The call rate (<90%) and minor allele frequency (<0.01) thresholds removed 17,132 of the imputed SNPs. A total of 668,911 SNPs remained after imputation and QC measures for subsequent analyses (see S1 Table for SNP marker density per chromosome). The final dataset contained 1,977 cattle, of which 25.2% were seropositive for BVDV, 19.1% for N. caninum, 13.2% for Leptospira hardjo, 9.3% for RVFV, 5.9% for T. gondii, 3.9% for Coxiella burnetii, and 2.4% for B. abortus (Figure 1B).
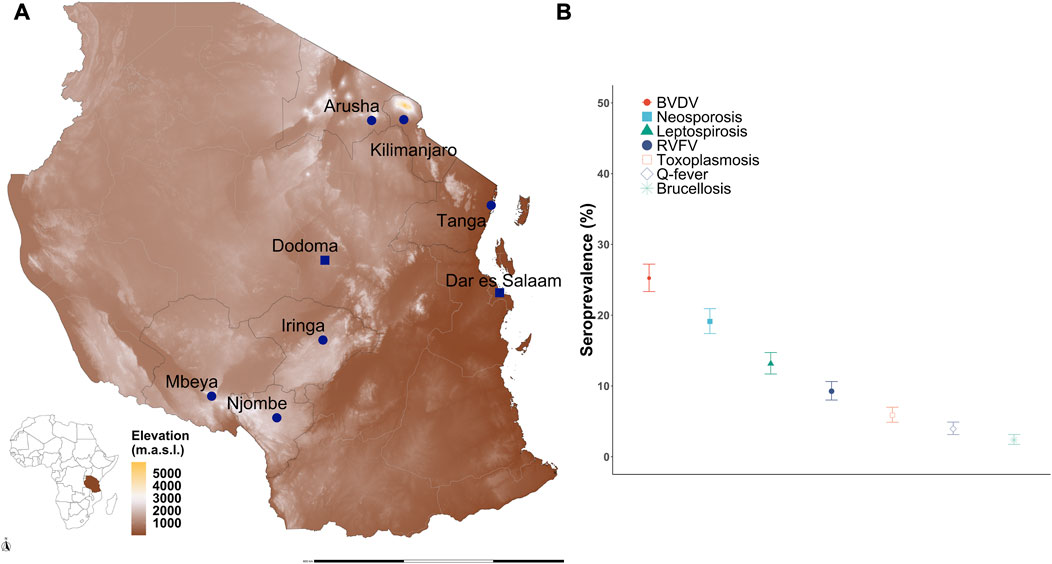
Figure 1. Seroprevalence of reproductive and zoonotic diseases in smallholder dairy cattle in Tanzania. (A) Geographic location of the six regions sampled in Tanzania: Arusha, Kilimanjaro, Tanga, Iringa, Mbeya, and Njombe. (B) Seroprevalence to seven pathogens among smallholder dairy cattle is variable, with the highest seropositivity to BVDV, neosporosis, and leptospirosis. Source map: www.usgs.gov/centers/eros/science/usgs-eros-archive-digital-elevation-global-multi-resolution-terrain-elevation.
2.2 Population structure and ancestry
We investigated the population stratification and structure among the selected crossbred Tanzanian cattle (TZA) and their genomic context by incorporating purebred data as a reference, after which we performed principal component analysis (PCA) and admixture analysis. The reference cattle population included 99 European cattle (ET) from Holstein and Jersey breeds, 59 African taurine (AT) composed of N’Dama and Muturu, and 65 Asian zebu (AZ) from Gir and Nelore populations (Wragg et al., 2022) (Figure 2A).
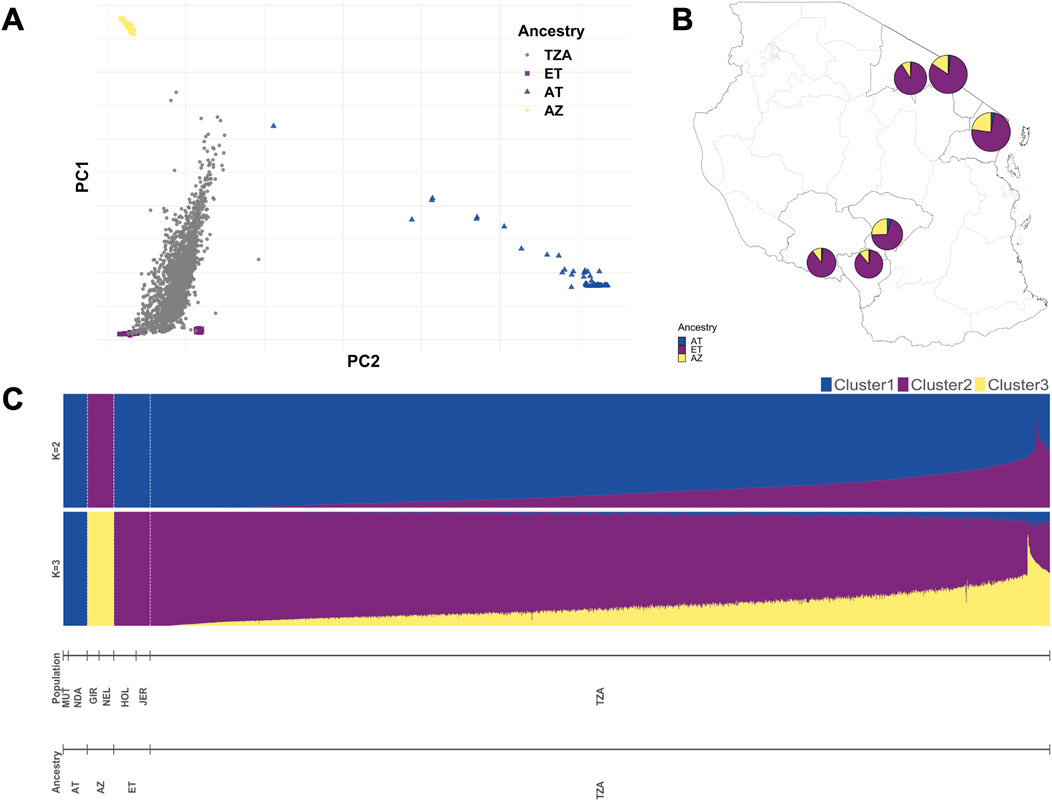
Figure 2. Population structure and global ancestry estimates among smallholder dairy cattle farms in Tanzania, Africa. (A) Scatterplot showing Tanzanian cattle samples (grey dots) within reference populations (European taurine (ET): Holstein and Jersey, African taurine (AT): N’Dama and Muturu, Asian zebu (AZ): Gir and Nelore). (B) Pie charts showing ET, AT, and AZ ancestry of Tanzanian cattle in the six sampled regions. (C) Supervised admixture analysis of the population using ADMIXTURE software.
First, we visualised the first two principal components (PCs) from the PCA analysis, in which we could identify our reference purebreds. The first and second PCs explained 47.2% and 10.9% of the total genomic variation, respectively (Supplementary Figure S1). We identified five clusters in the PCA scatterplot, where the Tanzanian samples were grouped across ET, where the Holstein and Jersey samples were separated into two clusters, and where the AZ samples from the Gir and Nelore breeds were clustered together. The AT samples, which included the N’Dama and Muturu breeds, were further separated from the rest of the population by the PC2 axis.
We used supervised admixture analysis to estimate the proportion of predefined ancestral populations in our Tanzanian samples (Figure 2C). With K = 2 predefined ancestral populations, B. taurus and Bos indicus ancestry is evident at variable levels in Tanzanian cattle. The estimated global ancestry proportions of B. taurus and B. indicus were 86% and 14% on average, respectively, across all Tanzanian samples. The proportions of African and European taurine ancestry diverged in our Tanzanian cattle when assuming K = 3 fixed ancestral populations. Across all sampled regions in Tanzania, animals had on average high levels of European taurine ancestry, followed by Asian zebu, and, at the lowest level, African taurine ancestry (Figure 2B). Unsupervised admixture analysis revealed similar patterns of ancestries at K = 2 and K = 3 (Supplementary Figure S2), and more than seven clusters (accounting for six reference populations and our Tanzanian population) were likely present in our dataset, as suggested by the cross-validation plot (Supplementary Figure S3).
2.3 Heritability estimates of the serological responses
The seroprevalences in the cattle population under study were low, ranging from 2% for B. abortus to 25% for BVDV. We observed low-to-moderate heritability estimates of the serological responses to the seven pathogens likely to cause abortion in our cattle study. The heritability estimates (Equations 1–3), when assuming a continuous trait (0/1) and using the observed scale (h20,1), ranged from 0.03 (SE ± 0.06) for Q-fever to 0.44 (SE ± 0.07) for BVDV. However, when we linked the observed estimates (0/1) to the underlying scale (h2u) [calculated with the formula shown by Dempster and Lerner in 1950 (Dempster and Lerner, 1950; Falconer, 1989)], the estimates were moderate to high at 0.14 and 0.93 for Q-fever and B. abortus, respectively (Table 1).
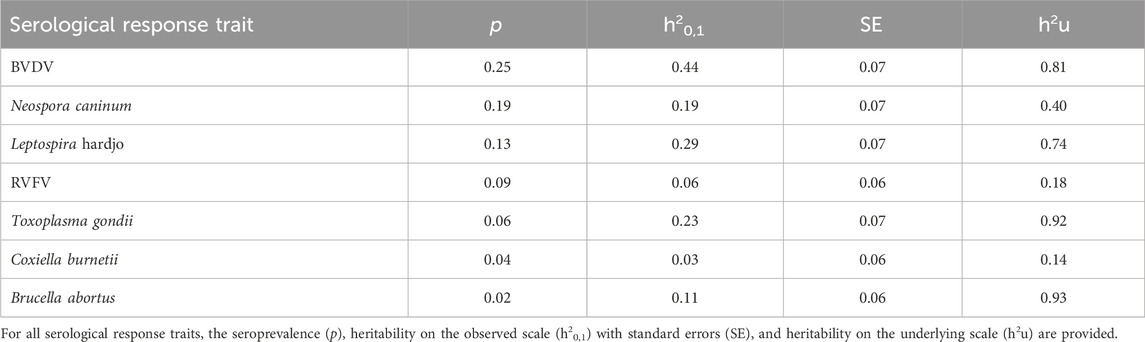
Table 1. Estimated heritability for serological response to six important reproductive and zoonotic infectious diseases in Tanzanian smallholder dairy cattle.
2.4 Mapping SNP markers associated with serological response traits
Our GWAS results (Figure 3) identified a total of 53 SNP markers with p-values below the suggestive significance threshold (
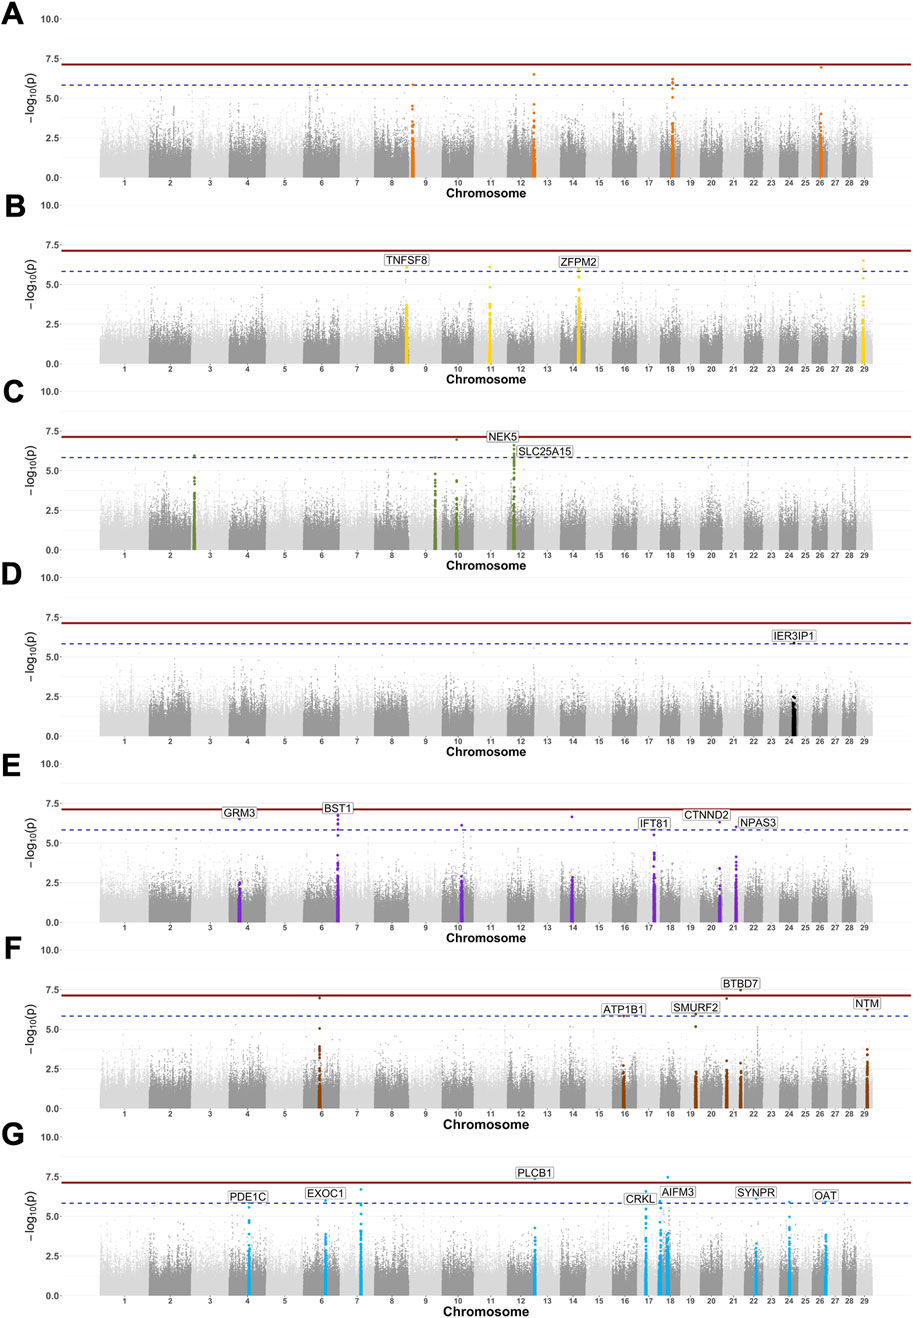
Figure 3. Genome-wide associations for serological response to seven infectious diseases in Tanzanian cattle. Manhattan plots show the SNP markers with the log-10 p-values above 7.13 (continuous line) and 5.83 (dashed line) thresholds. The adjacent 500 SNPs to those significant ones were colour-coded to represent each of the six reproductive/zoonotic diseases: BVDV (A), Neospora caninum (B), Leptospira hardjo (C), RVFV (D), Toxoplasma gondii (E), Coxiella burnetii (F), and Brucella abortus (G).
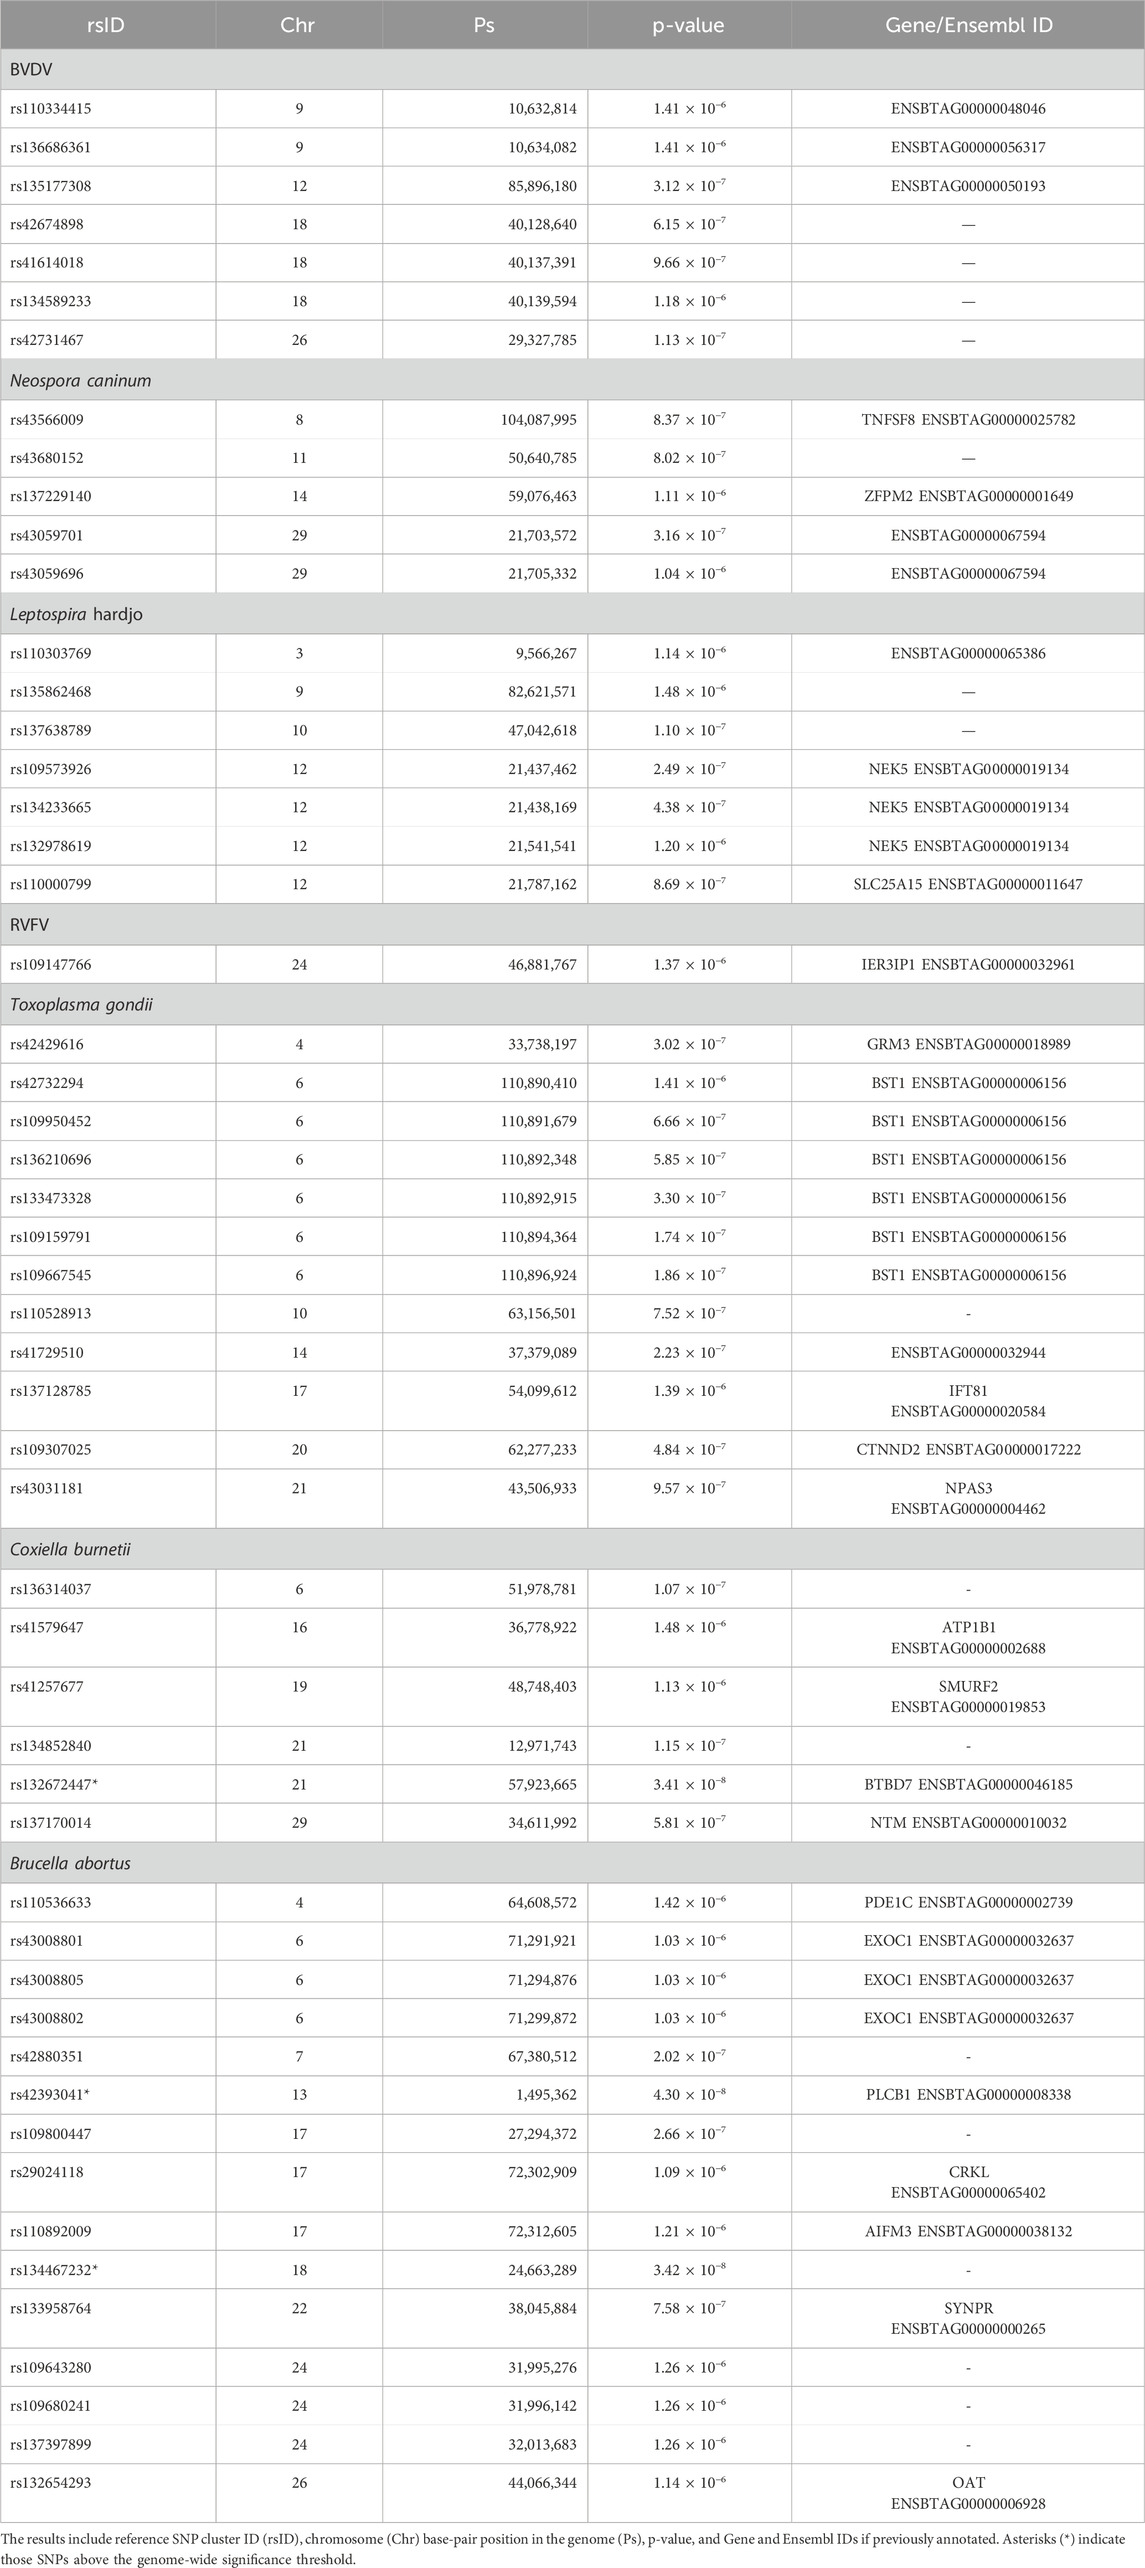
Table 2. Single-nucleotide polymorphism (SNP) markers in linkage disequilibrium for seven diseases in the Tanzanian smallholder cattle population.
Seven SNP markers had p-values below the suggestive significance threshold for BVDV and were mapped to unannotated regions on chromosomes 9, 12, 18, and 26 (Figure 3A). Five SNP markers had p-values below the suggestive significance threshold for the N. caninum serological response, with one located within the TNFSF8 gene on chromosome 8, a second SNP located within the ZFPM2 gene, and a further three SNPs located within unannotated regions on chromosomes 14 and 29 (Figure 3B). Another seven SNPs with p-values below the suggestive significance threshold were identified for the Leptospira hardjo serological response, of which three SNPs were located within the NEK5 gene and one within the SLC25A15 gene, while three SNPs were located within the unannotated regions on chromosomes 3, 9, and 10 (Figure 3C). One SNP marker with p-values below the significance threshold for the RVFV serological response was located within the IER3IP1 gene (Figure 3D). We also identified 12 SNPs with a p-value below the suggestive significance threshold for the T. gondii serological response that were located within the GRM3 (one SNP), BST1 (six SNPs), IFT81 (one SNP), CTNND2 (one SNP), and NPAS3 (one SNP) genes on chromosomes 4, 6, 17, 20, and 21, respectively (Figure 3E). One SNP marker with a p-value below the genome-wide significance threshold (
To gain further insight into the genetic architecture of these traits, we calculated the proportion of the additive genetic variance explained by the most significant SNPs. The genotype SNP effects were fitted in a linear mixed model to estimate their additive and dominance effects. These effects were used to calculate the allele substitution and the additive variance explained by the SNP. Summary statistics of the SNPs showing the strongest associations are described in detail in Supplementary Table S2. In summary, the proportion of additive variance explained by a given SNP ranged from 0.21% to 1.76%. The allele substitution effects varied from −0.30 to 0.06, and the dominance effects ranged from −0.15 to 0.17. The only two SNPs (rs137229140 and rs42429616) with non-significant additive effects had been mapped to the ZFPM2 and GRM3 genes in the N. caninum and T. gondii GWAS, respectively.
3 Discussion
In this study, we present findings from hard-to-measure phenotypes collected from smallholder dairy cattle herds in the six regions of Tanzania, which were mainly admixed with a high proportion of European taurine ancestry. Our study revealed low-to-high heritability estimates for antibody responses that varied with the pathogens assayed, but were highest for BVDV, Leptospira hardjo, and N. caninum exposures. GWAS identified several SNP markers with statistically significant associations with the studied traits. The identified loci mapped to B. taurus genomic regions, which included annotated genes involved in cell exocytosis pathways and immune response. Our GWAS results are novel and will add to the knowledge of genomic regions associated with cattle immune responses to infectious diseases. Some of the information presented in this study has the potential to enhance our current biological understanding of these traits along with the breeding of cattle for disease resistance.
The history of the domestication of African cattle breeds is complex and marked by multiple admixture events between local African taurine breeds, indicine zebu, and more recently, European (e.g., Jersey, Ayrshire, and Friesian) breeds, resulting in highly diverse populations (Kim et al., 2020). As shown in our population structure and admixture analysis (Figure 2), these Tanzanian smallholder dairy cattle were crosses of European and indicine breeds, comparable to other East African smallholder cattle populations (Mrode et al., 2021; Aliloo et al., 2018), but with higher levels of European introgression. The high percentage of European taurine, followed by indicine zebu, and less African taurine ancestry pattern obtained in the admixture analysis at K = 3 can be explained by the sampling of a few African taurine breeds (Figure 2C). The high proportion of B. taurus global ancestry (86%) on average in the Tanzanian samples (K = 2) may suggest a high proportion of exotic genes. Although our study is limited to investigating global ancestry, we acknowledge that inferring local ancestry for these health traits could be as insightful as it is for production traits such as milk yield (Al Kalaldeh et al., 2023). As purebred data reared under similar conditions were not available, we were not able to investigate genetic differences between breeds and their effect on antibody responses, which have been previously described as a key factor in bovine trypanosomiasis, tuberculosis, and East Coast fever (Wragg et al., 2022; Kim et al., 2020; Callaby et al., 2020). In this admixed Tanzanian cattle population, however, we were able to identify SNPs in linkage disequilibrium with causative mutations responsible for the antibody responses to different infectious diseases.
In this study, the heritability for the seven serological status traits was obtained on the observed scale and converted to the underlying scale. For the observed scale, the binary serological phenotype was assumed to be a continuous variable with normally distributed residuals, and, therefore, the genetic analysis was carried out assuming a standard linear mixed model (LMM). The heritability on the observed scale was transformed to the underlying scale, which assumes that the binary trait is being controlled by an unobserved liability variable, using Robertson’s approximation given in Dempster and Lerner (Dempster and Lerner, 1950; Falconer, 1989). This method of transforming the heritability on the observed scale allows a simple and computationally efficient genetic analysis approach for binary traits while still yielding unbiased estimates of heritability on the underlying scale (Lee et al., 2011). An alternative method to analyse the binary traits in this study would have been to use a generalised linear mixed model (GLMM) with a probit link function to fit the threshold model and account for the unobserved liability variable. While the use of GLMM would be a theoretically more correct approach, given that it allows for better modelling of non-normal data, there are several drawbacks hindering its efficient implementation. GLMM implementations based on penalised quasi-likelihood have been shown to yield biased estimates, and the Laplace approximation and the quadrature methods are less affected by this bias, but at a considerable extra computational cost, especially in relatively complex models (Gbur et al. 2012; Madden and Ojiambo, 2024). GLMM implementations based on the MCMC approach [e.g., Hadfield (2010)] can eliminate the problem of biased estimates, but the computational cost is even greater, therefore restricting its usage in the analysis of relatively small datasets. Hence, our approach of computing the heritability on the underlying scale by transforming the heritability on the observed scale is an appealing alternative, given that it is expected to yield reliable genetic estimates at an acceptable computing cost, while the use of a fast GLMM implementation may not necessarily improve the reliability of the estimates.
The prevalence of the infectious pathogens observed in this study population was variable, with the highest percentages for BVDV, N. caninum, Leptospira hardjo, and RVFV. These findings partially correspond to the most attributable livestock abortion agents (e.g., RVFV, N. caninum, and pestiviruses) found in aetiological surveys in Tanzania (Lankester et al., 2024; Thomas et al., 2022). We observed low estimates of heritability on the observed (0/1) scale when the disease prevalence was the lowest (e.g., 2%); however, the underlying scale that links the observed heritability estimates to the prevalence reflects the true genetic proportion expected for these traits (Dempster and Lerner, 1950; Falconer, 1989; Ojavee et al., 2022) had we used a GLMM appropriate for binary traits.
We identified 53 SNPs with a strong association with serological responses across pathogens—some of which mapped to annotated genes in the B. taurus genome (Table 2). The seven SNPs associated with the BVDV serological response mapped to unannotated regions (Figure 3A). BVDV is a highly contagious pathogen with a complex epidemiology that affects dairy cattle herds worldwide by causing persistent infection, poor reproductive performance, and significant economic losses (Scharnböck et al., 2018; Walz et al., 2020). Several BVDV control options exist (e.g., vaccination, biosecurity, and removal of persistently infected animals) (Moennig and Becher, 2018), but they are rarely implemented and/or maintained in LMICs (Richter et al., 2019; Zirra-Shallangwa et al., 2022). With the advances in genome editing, however, it has been possible to breed the first calf with reduced BVDV susceptibility by altering the CD46 gene. BVDV binds to two peptide domains in CD46 to infect cells, and therefore, an altered CD46 molecule appears to limit the viral load in the blood (viraemia) in an edited calf (Workman et al., 2021; Workman et al., 2023). In the RVFV GWAS, one SNP above the suggestive significant threshold mapped to the IER3IP1 gene, mutations of which cause a neurodevelopmental disorder in humans, and it was recently demonstrated to play a fundamental role in B-cell development in mice (Zhong et al., 2023).
The apicomplexan parasites in this study, T. gondii and N. caninum, are known for causing reproductive problems in cattle and/or have a high zoonotic potential (T. gondii) (Reichel et al., 2013). In our T. gondii serological response GWAS results, we found that 10 of the 12 associated SNPs were located in the annotated genes, GRM3, BST1, IFT81, CTNND2, and NPAS3 (Table 2). The GRM3 gene encodes proteins that regulate neurotransmitters (e.g., glutamate) and gene mutations have been directly linked to neurological conditions such as schizophrenia (Egan et al., 2004). In addition, GRM3 has also been shown to suppress colon cancer and glioblastoma growth (Yi et al., 2017; Wirsching et al., 2021). The BST1 gene encodes a molecule that facilitates pre-B-cell growth, and it has been involved in autoimmune and neurological diseases in humans (Kaisho et al., 1994; Yokoyama, 2023). The CTNND2 gene has been previously identified in GWAS results from Nelore cattle, where it may be important for growth, meat quality, and milk production (Machado et al., 2022). The rest of the annotated genes are involved in ciliogenesis/spermatogenesis (IFT8) and neurogenesis/schizophrenia disorder (NPAS3) (Michaelson et al., 2017; Qu et al., 2020; van Scheltinga et al., 2010). Investigations into the relationship between toxoplasmosis and the genes involved in neurological processes have only recently been reported (Milne et al., 2020). Several studies have indicated that T. gondii infection increases the risk of neurological diseases such as schizophrenia (Carter, 2011; Xiao et al., 2018; Li et al., 2018; Wang et al., 2019). This risk may be somewhat explained by the potential of T. gondii to deregulate neurotransmitters, such as glutamate, which is synthesised by astrocytes that are heavily affected during T. gondii infection (David et al., 2016). Therefore, it is not entirely unlikely that several of these variants within the GRM3, BST1, and NPAS3 genes may be associated with the host response to T. gondii infection, as revealed by our GWAS results.
In the case of N. caninum, we identified five SNPs—one mapped to the TNFSF8 gene, a second within the ZFPM2 gene, and three SNPs located in unannotated regions (Figure 3B). The tumour necrosis factor superfamily (TNFSF) genes encode proteins and molecules responsible for host immune defence and tumour suppression (Sonar and Lal, 2015; Ward-Kavanagh et al., 2016). TNFSF8 gene expression plays an important role in the defence of immune cells (e.g., CD4 T cells) against Mycobacterium tuberculosis and hepatitis C virus infection (Sallin et al., 2018; Fu et al., 2021). The zinc finger proteins (ZFPM2) are responsible for encoding GATA transcription factors (zinc finger DNA-binding proteins) that control the development of erythrocytes and immune cells such as CD4 T cells (Gao et al., 2015; Lentjes et al., 2016). Although the link between GATA transcription factors and N. caninum immune response is unknown, they appear to play an important role in the local immune response to Pseudomonas aeruginosa (Shapira et al., 2006).
Several of the SNPs with a significant association with bacterial pathogens (L. hardjo, C. burnetii, and B. abortus) were mapped to the NEK5, SLC25A15, ATP1B1, SMURF2, BTBD7, NMT, PDE1C, EXOC1, PLCB1, CRKL, AIFM3, SYNPR, or OAT genes. In this B. abortus GWAS result, three SNPs were located within the EXOC1 gene, which is part of a complex of proteins that regulate cell exocytosis pathways. The EXOC1-encoded protein is part of an 8-molecule complex that binds the cell plasma membrane to endosomal compartments. Several bacterial organisms, such as Listeria monocytogenes, Staphylococcus aureus, and B. abortus use different exocytic pathways to infect host cells (Ireton et al., 2018; Ireton et al., 2023). After B. abortus is phagocytosed by mainly macrophages or dendritic cells, it initially interacts with early endosomes to enter the cell and subsequently replicate within the endoplasmic reticulum (Celli, 2015). Therefore, genetic variations in the EXOC1 region may determine whether B. abortus infection will occur or not in host cells. Although the C. burnetii serological response association with the NTM gene is unclear, the NTM gene has been identified in association with B. abortus infection in wild boar and displaced abomasum disorder in Holstein cattle (Freebern et al., 2020; Fabbri et al., 2022). The association between SNPs located within the BTBD7 and PLCB1 genes and serological response to bacterial pathogens is not clear; however, the BTBD7 gene has been associated with indicators of heat stress in Holstein cattle and is involved in other biological processes such as development and tumour progression (Luo et al., 2022; Liu et al., 2023). The NEK5 and SLC25A15 genes encode proteins involved in mitochondrial function, cell-cycle progression, metabolism and tumourigenesis, but have no clear role in the immune response to bacterial infection (Melo Hanchuk et al., 2015; Chen et al., 2022). In vitro human gene expression experiments have shown that the ATPase Na+/K+ transporting subunit β 1 (ATP1B1) protein limits DNA and RNA virus expression and replication by promoting IFN and pro-inflammatory cytokine activation (Cao et al., 2021). Although the SMAD-specific E3 ubiquitin protein ligase 2 (SMURF2) has a primary role in TGF-β signalling pathways (e.g., embryogenesis, and cellular homeostasis), it has recently been shown to affect antiviral signalling pathways (e.g., type 1 IFN signalling and binding of filovirus VP40 matrix proteins) (Pan et al., 2014; Shepley-McTaggart et al., 2021). The PDE1C, CRKL, AIFM3, SYNPR, and OAT genes are involved in developmental and metabolic functions; however, their role in the immune response to bacterial pathogens has not yet been studied.
The SNPs identified as having a strong association with antibody responses to infectious diseases explained a small proportion (0.21%–1.76%) of the additive genetic variance, which is not surprising for complex traits where many genes may be involved in their regulation. However, we were reassured to observe that these SNPs had a significant additive genetic effect, which would allow them to be passed on to the next generation. Importantly, the additive genetic effects in two SNPs that mapped to the ZFPM2 and GRM3 genes were not significant, indicating that dominance effects may be present and play a more important role at this locus. The proportion of genetic variance explained by a given SNP was small, but it is still relevant information that may prove useful in genomic selection and/or gene expression studies to identify genes involved in the antibody response to infectious diseases.
Studying these complex traits with 2,045 sampled animals may be limiting our GWAS, but increasing data collection in livestock systems is often expensive given that health traits are not routinely recorded for breeding purposes. In addition, it is important to note that gathering health trait data from small-scale dairy farms in low-income countries without appropriate cold chain facilities is time-consuming and costly. GWAS results from smallholder systems investigating health traits are scarce, and most studies focus on production performance traits using 4,000–5,000 animals (Al Kalaldeh et al., 2021; Al Kalaldeh et al., 2023; Mrode et al., 2021). Alternately, large-scale commercial cattle GWAS results on production performance traits include between 20,000 and 200,000 animals (Dominguez-Castaño et al., 2024; Jiang et al., 2019). Several GWAS on health traits in commercial cattle populations in developed countries, where phenotypic and genotypic records and financial resources are more likely to be available, could include between 600 and nearly 30,000 animals. To address limited data, flexible Bayesian frameworks have been proposed in crossbred cattle in similar systems while mainly studying production traits such as milk yield (Costilla et al., 2023; Moser et al., 2015). Nevertheless, there is no clear evidence of Bayesian models outperforming GBLUP methods for genomic selection in commercial breeding value evaluation schemes or for health traits in comparable smallholder cattle populations, and GBLUP evaluations are widely accepted in commercial breeding evaluation settings (Mrode et al., 2019; Mrode et al., 2021; Brown et al., 2016).
Despite these limitations, our research provides novel genetic estimates on health that have not yet been reported in smallholder livestock production systems and identifies specific genetic variations linked to the antibody responses to various diseases in admixed African cattle populations. Our findings pinpoint putative regions on the cattle genome that may play a role in immune defence and disease susceptibility. These areas warrant further exploration, such as verification of our findings in other larger similar populations and conducting in vitro experiments to study the gene expression or the use of genome editing, as demonstrated in the case of the BVDV-edited calf.
4 Materials and methods
4.1 Sample collection and study area
Genotypes for the cattle were obtained from the African Dairy Genetics Gains (ADGG) project (https://www.ilri.org/research/projects/african-dairy-genetic-gains), which consisted of 2,045 crossbred Tanzanian cows and bulls sampled from their larger database. ADGG has managed a performance (e.g., milk yield and body weight) and genotype database for the majority of the registered animals, mainly smallholder cattle, from Tanzania and other low- and middle-income countries (LMICs) since 2016. This cattle subset was selected based on the cattle with confirmed presence in both the household and the ADGG database at the time of collection. Households were located in 23 districts in six regions of importance for dairy production in Tanzania (Swai and Karimuribo, 2011a; Swai and Karimuribo, 2011b) (Figure 1).
A cross-sectional survey and sample collection were carried out by our veterinary team, ADGG, and Tanzanian Livestock Research Institute (TALIRI) staff from July 2019 to October 2020. Information on households (e.g., geographic location), animals (e.g., age, sex, and phenotypical features), and herd management (e.g., feeding, reproduction, and health) was recorded electronically using an open data kit (ODK) platform and curated for downstream analysis using R and RStudio (R Core Team. and R, 2022; RStudio Team, 2020).
Blood samples were collected from each animal by jugular venipuncture using plain vacutainer tubes (BD vacutainer®, Auckland, New Zealand), centrifuged, and refrigerated until processing in regional laboratories in the study regions of Tanzania. Serum was aliquoted in cryovial tubes and stored at −20°C at the Nelson Mandela African Institution of Science and Technology (NM-AIST) in Arusha, Tanzania.
The animal ethics of the study were reviewed and approved by the International Livestock Research Institute Institutional Animal Care and Use Committee (ILRI-IACUC2018-27), and research approval was granted by the Tanzania Commission for Science and Technology (COSTECH) (ref. 2019-207-NA-2019-95).
4.2 Description of the Tanzanian cattle population
On average, cattle in this study were 5 years of age, with 97.2% of them being female breeds. Phenotypic characterisation classified 3.8% as having African indigenous features, whereas 96.2% were identified as crosses between East African Shorthorn Zebu and Ayrshire, Holstein, or Jersey breeds. Management strategies in this population were varied, with the majority of animals placed under an intensive feeding system and having little opportunity to graze freely in open pastures. Reproductive management was carried out through artificial insemination, and a small percentage of farmers reported the use of an owned or rented bull as a mode of reproduction in the herd.
Preventative disease control measures were carried out through vaccination, although they were not routinely implemented, with only 15.2% of farmers reporting using mainly a foot-and-mouth disease vaccine. A total of 23 districts were sampled, with the number of animals in each district varying from 15 in the Iringa Municipal Council to 261 in the Moshi Rural District Council. The herd size, composed mainly of heifers or cows, was variable, with only a few herds being larger than 50 mature females.
4.3 Serological health resilience traits
The serological response trait was obtained for each individual animal through testing for the antibody responses to seven pathogens using commercial ELISA kits of BVDV (ID Screen® BVD p80 Antibody Competition, Innovate Diagnostics, France), N. caninum (ID Screen® N. caninum Competition, Innovate Diagnostics, France), L. hardjo (Leptospira interrogans subtype Hardjoprajitno and Leptospira borgpetersenii subtype Hardjobovis; the Linnodee Leptospira Hardjo ELISA Kit™, Linnodee Animal Care, United Kingdom), RVFV (ID Screen® Rift Valley Fever Competition Multi-species, Innovate Diagnostics, France), T. gondii (ID Screen® Toxoplasmosis Indirect Multi-species, Innovate Diagnostics, France), C. burnetii (Q fever; PrioCHECKIT™ Ruminant Q Fever Ab Plate Kit, Thermo Fisher Scientific, United States), and B. abortus (COMPELISA 160 and 400, APHA Scientific, United Kingdom). The manufacturer’s guidelines were followed (see details in (Bwatota et al., 2022; Mengele et al., 2023; Motto et al., 2023; Ryan et al., 2012). All optical density (OD) values were transformed into a binary seropositive seronegative classification based on the manufacturer’s recommended cut-offs.
4.4 Genotyping and imputation
Following a method previously applied to East African crossbred dairy cattle (Aliloo et al., 2018), we genotyped our samples using a low-density GeneSeek Genomic Profiler Bovine 100K chip and inferred missing genotypes using a reference cattle population genotyped with a high-density chip. As described in Aliloo et al. (2018), the imputation method uses a crossbred cattle population, mainly from Kenya, Tanzania, Uganda, and Ethiopia in East Africa [see details in Aliloo et al. (2018) Table 1] and a purebred reference (British Friesian, Holstein, Jersey, Guernsey, Nelore, and N'Dama) population (n = 3091), both genotyped using the Illumina BovineHD BeadChip (Illumina, San Diego, CA). This reference population was obtained and curated during the Dairy Genetics East Africa (DGEA) project, which collected performance, genotype, and household data in these East African countries, and was provided by authors Aliloo et al. (2018) solely for imputation. In this procedure, only autosomal SNPs (that is, mitochondrial, unmapped, duplicated map position, and SNPs located in sex chromosomes were removed), with a GC score >15%, a call rate >90%, and a minor allele frequency (MAF) > 0.01, and animals with below 10% missing genotypes were kept for the imputation pipeline. The imputation process involved a pre-phasing stage using the Eagle v2.4.1 positional Burrows–Wheeler transform and hidden Markov model algorithm (Loh et al., 2016), followed by the imputation of genotypes using the Minimac3 v2.0.1 state space reduction algorithm (Das et al., 2016) programme. The dataset after imputation contained 2,011 animals and 670,367 SNPs.
To explore the population structure and global ancestry of our samples, we first merged our samples into a reference population (Wragg et al., 2022) and applied further quality control measures. Both datasets were converted from the TOP to FOR format and aligned using the SNPchiM v3 programme (Nicolazzi et al., 2015) and subsequently merged into a single VCF file using the bcftools v1.3 suite (Li, 2011). The merged data were converted from the VCF to BED format using the Plink v1.90 programme (Chang et al., 2015; Purcell et al., 2007), in which SNPs with an MAF <0.01 (--maf) and a call rate >90% (--geno) and animals with above 10% missing calls (--mind) were removed. Additionally, one animal from a pair was removed for a high degree of relatedness above 0.25 (parent–offspring and full siblings) based on the KING-robust estimator (Manichaikul et al., 2010), which was implemented in the Plink v2.0 programme (Chang et al., 2015; Purcell et al., 2007).
4.5 Genomic differentiation and ancestry estimation
We ran PCA and model-based estimation of global ancestry on our Tanzanian dataset and a merged genotype reference dataset to explore the population structure. Our reference population included pure European taurine (ET, n = 99; 63 Holstein, and 36 Jersey), African taurine (AT, n = 59; 47 N’Dama and 12 Muturu), and Asian zebu (AZ, n = 65; 30 Gir and 25 Nelore) cattle genotyped with the Illumina BovineHD BeadChip (Wragg et al., 2022). We also ran a separate PCA with only the Tanzanian samples, with the first five PCs later being used as covariates to control for the population structure in models for genetic parameter estimates and genome-wide association analysis.
Prior to PCA and global ancestry estimation, SNP markers in high linkage disequilibrium (LD) were removed after applying an r-squared threshold >0.2 with another SNP within a 200-SNP window with sliding windows of 10 SNPs at a time. To estimate the level of ET, AT, and AZ ancestry in our Tanzanian cattle, we performed a supervised admixture (Alexander et al., 2009) analysis using a 5-step expectation-maximisation (EM) algorithm. We ran a 10-fold cross-validation with 200 bootstrap resampling to calculate standard errors while assuming K = 2 to K = 3 fixed ancestries. We compared our supervised analysis with an unsupervised admixture analysis with the same parameter setting but exploring K = 2 to K = 23 clusters (Supplementary Figure S2). The admixture Q matrix represents the estimated global ancestry proportion of the Tanzanian animals across different genetic clusters. In the Q matrix, the rows show the individuals, and the columns show the clusters identified in the admixture analysis. These clusters were visualised using the R pophelper package (Francis, 2017), and the best value of K was chosen based on the lowest cross-validation error in the unsupervised analysis.
4.6 Genetic parameter estimation
First, we estimated the genetic parameters on the observed scale, and then their heritability (
The genetic analysis on the observed scale assumes the binary trait (0/1) to be continuous with normally distributed residuals. A single-trait LMM was performed for each trait. The following model was fitted:
where
The heritability on the underlying scale (
where
4.7 Genome-wide association analysis
GWAS analyses were conducted using univariate analyses for each of the seven traits using the GEMMA software (Zhou and Stephens, 2012), fitting the same effects included in the LMM described in Equation 1 plus the additive effect of the SNP being tested. The Bonferroni correction was used to account for multiple tests. The SNP effects were declared statistically significant at the suggestive or genome-wide level when p-values were lower than 1.4917 × 10⁻⁶ and 7.4586 × 10⁻⁸, respectively. The Manhattan plot (Figure 3) and the QQ plots (Supplementary Figures S4–S10) are shown on the –log10 p-value scale (the suggestive and genome-wide significant thresholds in the –log10 p-value scale are 5.83 and 7.13, respectively).
To get further insight into the genetic architecture of these traits, we investigated the contribution to the overall additive genetic variance for the top SNPs that crossed the genome-wide and suggestive significant thresholds. We fitted an LMM model as described in Equation 1 plus the genotype effect of the SNP in question which, in turn, was used to calculate its additive and dominance effects. These genetic effects were calculated as follows: additive effect,
4.8 Genome mapping of associated loci
The investigation of the putative genes located with the QTL regions identified for the immune serological response in our Tanzanian cattle was done using the annotated B. taurus ARS-UCD1.3 genome in Ensembl.org (https://www.ensembl.org/Bos_taurus/Info/Index?db=core).
Data availability statement
The raw genotype data produced by this project are the property of the Tanzanian government and access to the genotype data is possible if all parties are signatories to the access and benefit sharing documents (prior informed consent and mutually agreed terms) in compliance with The Nagoya Protocol on Access to Genetic Resources and the Fair and Equitable Sharing of Benefits Arising from their Utilization to under the Convention on Biological Diversity. Interested researchers can contact the ADGG project at Support.ADGG@cgiar.org for further information. The serology data can be found at the University of Edinburgh repository at https://datashare.ed.ac.uk/handle/10283/8974.
Ethics statement
The animal studies were approved by the International Livestock Research Institute Institutional Animal Care and Use Committee (ILRI-396 IACUC 2018-27) and the Tanzania Commission for Science and Technology. The studies were conducted in accordance with the local legislation and institutional requirements. Written informed consent was obtained from the owners for the participation of their animals in this study.
Author contributions
LH-C: conceptualization, data curation, formal analysis, investigation, methodology, project administration, validation, visualization, writing–original draft, and writing–review and editing. EC: conceptualization, funding acquisition, investigation, project administration, resources, supervision, writing–original draft, and writing–review and editing. OM: formal analysis, methodology, software, supervision, validation, visualization, writing–original draft, and writing–review and editing. IM: data curation, investigation, project administration, writing–original draft, writing–review and editing, and methodology. SM: data curation, investigation, project administration, writing–original draft, writing–review and editing, and methodology. SB: data curation, investigation, project administration, writing–original draft, writing–review and editing, and methodology. BZ-S: data curation, investigation, project administration, writing–original draft, writing–review and editing, and methodology. RP-W: formal analysis, investigation, methodology, writing–original draft, writing–review and editing, data curation, and software. JP: data curation, investigation, methodology, writing–original draft, writing–review and editing, and formal analysis. RM: data curation, investigation, methodology, project administration, resources, supervision, writing–original draft, and writing–review and editing. PT: data curation, investigation, project administration, resources, writing–original draft, and writing–review and editing. DK: data curation, investigation, project administration, resources, writing–original draft, and writing–review and editing. EL: data curation, investigation, project administration, resources, writing–original draft, and writing–review and editing. BK: data curation, investigation, methodology, project administration, writing–original draft, and writing–review and editing. GN: data curation, investigation, methodology, project administration, writing–original draft, and writing–review and editing. OM: data curation, investigation, project administration, resources, writing–original draft, and writing–review and editing. GS: data curation, funding acquisition, investigation, project administration, resources, writing–original draft, and writing–review and editing. BC: conceptualization, data curation, funding acquisition, investigation, methodology, project administration, resources, supervision, writing–original draft, writing–review and editing, and formal analysis.
Funding
The author(s) declare that financial support was received for the research, authorship, and/or publication of this article. This research was funded in part by the Gates Foundation and with UK aid from the UK Foreign, Commonwealth and Development Office (Grant Agreement OPP1127286) under the auspices of the Centre for Tropical Livestock Genetics and Health (CTLGH), established jointly by the University of Edinburgh, SRUC (Scotland's Rural College), and the International Livestock Research Institute. The findings and conclusions contained within are those of the authors and do not necessarily reflect positions or policies of the Gates Foundation nor the UK Government.
Acknowledgments
The authors would like to acknowledge David Wragg for their help and support in merging the reference and this study of cattle genotypes and Hassan Aliloo for his guidance on genotype imputation. We would also like to thank Philipp Schwabl and Stephen Morrow for reading the paper.
Conflict of interest
The authors declare that the research was conducted in the absence of any commercial or financial relationships that could be construed as a potential conflict of interest.
Publisher’s note
All claims expressed in this article are solely those of the authors and do not necessarily represent those of their affiliated organizations, or those of the publisher, the editors and the reviewers. Any product that may be evaluated in this article, or claim that may be made by its manufacturer, is not guaranteed or endorsed by the publisher.
Supplementary material
The Supplementary Material for this article can be found online at: https://www.frontiersin.org/articles/10.3389/fgene.2025.1497355/full#supplementary-material
References
Alexander, D. H., Novembre, J., and Lange, K. (2009). Fast model-based estimation of ancestry in unrelated individuals. Genome Res. 19 (9), 1655–1664. doi:10.1101/GR.094052.109
Aliloo, H., Mrode, R., Okeyo, A. M., Ni, G., Goddard, M. E., and Gibson, J. P. (2018). The feasibility of using low-density marker panels for genotype imputation and genomic prediction of crossbred dairy cattle of East Africa. J. Dairy Sci. 101 (10), 9108–9127. doi:10.3168/jds.2018-14621
Al Kalaldeh, M., Swaminathan, M., Gaundare, Y., Joshi, S., Aliloo, H., Strucken, E. M., et al. (2021). Genomic evaluation of milk yield in a smallholder crossbred dairy production system in India. Genet. Sel. Evol. 53 (1), 73. doi:10.1186/s12711-021-00667-6
Al Kalaldeh, M., Swaminathan, M., Podtar, V., Jadhav, S., Dhanikachalam, V., Joshi, A., et al. (2023). Detection of genomic regions that differentiate Bos indicus from Bos taurus ancestral breeds for milk yield in Indian crossbred cows. Front. Genet. 13, 1082802. doi:10.3389/fgene.2022.1082802
Alonso, S., Unger, F., Toye, P. G., Jores, J., Wakhungu, J. W., Msalya, G., et al. (2015). Cattle diseases in dairy herds in Tanzania: farmers’ view and laboratory confirmation. Available online at: https://cgspace.cgiar.org/handle/10568/68751.
Archer, N. M., Petersen, N., Clark, M. A., Buckee, C. O., Childs, L. M., and Duraisingh, M. T. (2018). Resistance to Plasmodium falciparum in sickle cell trait erythrocytes is driven by oxygen-dependent growth inhibition. Proc. Natl. Acad. Sci. 115 (28), 7350–7355. doi:10.1073/pnas.1804388115
Ayres, J. S., and Schneider, D. S. (2008). Two ways to survive infection: what resistance and tolerance can teach us about treating infectious diseases. Nat. Rev. Immunol. 8 (11), 889–895. doi:10.1038/nri2432
Banos, G., Lindsay, V., Desta, T. T., Bettridge, J., Sanchez-Molano, E., Vallejo-Trujillo, A., et al. (2020). Integrating genetic and genomic analyses of combined health data across ecotypes to improve disease resistance in indigenous african chickens. Front. Genet. 11, 543890. doi:10.3389/fgene.2020.543890
Bermingham, M. L., Bishop, S. C., Woolliams, J. A., Pong-Wong, R., Allen, A. R., McBride, S. H., et al. (2014). Genome-wide association study identifies novel loci associated with resistance to bovine tuberculosis. Heredity. 112 (5), 543–551. doi:10.1038/hdy.2013.137
Brown, A., Ojango, J., Gibson, J., Coffey, M., Okeyo, M., and Mrode, R. (2016). Short communication: genomic selection in a crossbred cattle population using data from the Dairy Genetics East Africa Project. J. Dairy Sci. 99 (9), 7308–7312. doi:10.3168/jds.2016-11083
Bwatota, S. F., Shirima, G. M., Hernandez-Castro, L. E., Bronsvoort, B. M., de, C., Wheelhouse, N., et al. (2022). Seroprevalence and risk factors for Q fever (Coxiella burnetii) exposure in smallholder dairy cattle in Tanzania. Veterinary Sci., 9(12): 662. doi:10.3390/VETSCI9120662
Callaby, R., Kelly, R., Mazeri, S., Egbe, F., Benedictus, L., Clark, E., et al. (2020). Genetic diversity of Cameroon cattle and a putative genomic map for resistance to bovine tuberculosis. Front. Genet. 11, 550215. doi:10.3389/fgene.2020.550215
Cao, W., Guo, Y., Cheng, Z., Xu, G., Zuo, Q., Nie, L., et al. (2021). Inducible ATP1B1 upregulates antiviral innate immune responses by the ubiquitination of TRAF3 and TRAF6. J. Immunol. 206 (11), 2668–2681. doi:10.4049/jimmunol.2001262
Carter, C. J. (2011). Schizophrenia: a pathogenetic autoimmune disease caused by viruses and pathogens and dependent on genes. J. Pathogens 2011, 128318. doi:10.4061/2011/128318
Celli, J. (2015). The changing nature of the Brucella-containing vacuole. Cell. Microbiol. 17 (7), 951–958. doi:10.1111/cmi.12452
Chang, C. C., Chow, C. C., Tellier, L. C., Vattikuti, S., Purcell, S. M., and Lee, J. J. (2015). Second-generation PLINK: rising to the challenge of larger and richer datasets. GigaScience 4 (1), 4–7. doi:10.1186/s13742-015-0047-8
Chen, Y. J., Hong, W. F., Liu, M. L., Guo, X., Yu, Y. Y., Cui, Y. H., et al. (2022). An integrated bioinformatic investigation of mitochondrial solute carrier family 25 (SLC25) in colon cancer followed by preliminary validation of member 5 (SLC25A5) in tumorigenesis. Cell. Death and Dis. 13 (3), 237. doi:10.1038/s41419-022-04692-1
Costilla, R., Zeng, J., Kalaldeh, M. A., Swaminathan, M., Gibson, J. P., Ducrocq, V., et al. (2023). Developing flexible models for genetic evaluations in smallholder crossbred dairy farms. J. Dairy Sci. 106 (12), 9125–9135. doi:10.3168/jds.2022-23135
Das, S., Forer, L., Schönherr, S., Sidore, C., Locke, A. E., Kwong, A., et al. (2016). Next-generation genotype imputation service and methods. Nat. Genet. 48 (10), 1284–1287. doi:10.1038/ng.3656
David, C. N., Frias, E. S., Szu, J. I., Vieira, P. A., Hubbard, J. A., Lovelace, J., et al. (2016). GLT-1-Dependent disruption of CNS glutamate homeostasis and neuronal function by the Protozoan parasite Toxoplasma gondii. PLOS Pathog. 12 (6), e1005643. doi:10.1371/journal.ppat.1005643
Dempster, E. R., and Lerner, I. M. (1950). Heritability of threshold characters. Genetics 35 (2), 212–236. doi:10.1093/GENETICS/35.2.212
Dominguez-Castaño, P., Fortes, M., Tan, W. L. A., Toro-Ospina, A. M., and Silva, J. (2024). Genome-wide association study for milk yield, frame, and udder-conformation traits of Gir dairy cattle. J. Dairy Sci. 107 (12), 11127–11138. doi:10.3168/jds.2024-24648
Egan, M. F., Straub, R. E., Goldberg, T. E., Yakub, I., Callicott, J. H., Hariri, A. R., et al. (2004). Variation in GRM3 affects cognition, prefrontal glutamate, and risk for schizophrenia. Proc. Natl. Acad. Sci. 101 (34), 12604–12609. doi:10.1073/pnas.0405077101
Fabbri, M. C., Crovetti, A., Tinacci, L., Bertelloni, F., Armani, A., Mazzei, M., et al. (2022). Identification of candidate genes associated with bacterial and viral infections in wild boars hunted in Tuscany (Italy). Sci. Rep. 12 (1), 8145. doi:10.1038/s41598-022-12353-8
Falconer, D. S. (1965). The inheritance of liability to certain diseases, estimated from the incidence among relatives. Ann. Hum. Genet. 29 (1), 51–76. doi:10.1111/j.1469-1809.1965.tb00500.x
Falconer, D. S. (1989). Introduction to quantitative genetics. 3rd Edition. New York: Longman Scientific and Technical.
Flint, J., Hill, A. V. S., Bowden, D. K., Oppenheimer, S. J., Sill, P. R., Serjeantson, S. W., et al. (1986). High frequencies of alpha-thalassaemia are the result of natural selection by malaria. Nature 321 (6072), 744–750. doi:10.1038/321744a0
Francis, R. M. (2017). Pophelper: an R package and web app to analyse and visualize population structure. Mol. Ecol. Resour. 17 (1), 27–32. doi:10.1111/1755-0998.12509
Freebern, E., Santos, D. J. A., Fang, L., Jiang, J., Gaddis, K. L. P., Liu, G. E., et al. (2020). GWAS and fine-mapping of livability and six disease traits in Holstein cattle. BMC Genomics 21, 41. doi:10.1186/s12864-020-6461-z
Fu, Z., Cai, W., Shao, J., Xue, H., Ge, Z., Fan, H., et al. (2021). Genetic variants in TNFSF4 and TNFSF8 are associated with the risk of HCV infection among Chinese high-risk population. Front. Genet. 12, 630310. doi:10.3389/fgene.2021.630310
Gao, J., Chen, Y. H., and Peterson, L. C. (2015). GATA family transcriptional factors: emerging suspects in hematologic disorders. Exp. Hematol. and Oncol. 4 (1), 28. doi:10.1186/s40164-015-0024-z
Gbur, E. E., Stroup, W. W., McCarter, K. S., Durham, S., Young, L. J., Christman, M., et al. (2012). Analysis of generalized linear mixed models in the agricultural and natural resources sciences. 2012th ed. United States of America: American Society of Agronomy, Crop Science Society of America, and Soil Science Society of America. Available online at: https://www.wiley.com/en-us/Analysis+of+Generalized+Linear+Mixed+Models+in+the+Agricultural+and+Natural+Resources+Sciences-p-9780891181828 (Accessed February 2025).
Gratten, J., and Visscher, P. M. (2016). Genetic pleiotropy in complex traits and diseases: implications for genomic medicine. Genome Med. 8 (1), 78. doi:10.1186/s13073-016-0332-x
Hadfield, J. D. (2010). MCMC methods for multi-response generalized linear mixed models: the MCMCglmm R package. J. Stat. Softw. 33, 1–22. doi:10.18637/jss.v033.i02
Hadjipavlou, G., Matika, O., Clop, A., and Bishop, S. C. (2008). Two single nucleotide polymorphisms in the myostatin (GDF8) gene have significant association with muscle depth of commercial Charollais sheep. Anim. Genet. 39 (4), 346–353. doi:10.1111/j.1365-2052.2008.01734.x
Hine, B. C., Bell, A. M., Niemeyer, D. D. O., Duff, C. J., Butcher, N. M., Dominik, S., et al. (2019). Immune competence traits assessed during the stress of weaning are heritable and favorably genetically correlated with temperament traits in Angus cattle1. J. Animal Sci. 97 (10), 4053–4065. doi:10.1093/jas/skz260
Horns, F., and Hood, M. E. (2012). The evolution of disease resistance and tolerance in spatially structured populations. Ecol. Evol. 2 (7), 1705–1711. doi:10.1002/ece3.290
Hulst, A. D., de Jong, M. C. M., and Bijma, P. (2021). Why genetic selection to reduce the prevalence of infectious diseases is way more promising than currently believed. Genetics 217 (4), iyab024. doi:10.1093/GENETICS/IYAB024
Ibeagha-Awemu, E. M., Peters, S. O., Bemji, M. N., Adeleke, M. A., and Do, D. N. (2019). Leveraging available resources and stakeholder involvement for improved productivity of african livestock in the era of genomic breeding. Front. Genet. 10, 357. doi:10.3389/fgene.2019.00357
Ireton, K., Gyanwali, G. C., Herath, T. U. B., and Lee, N. (2023). Exploitation of the host exocyst complex by bacterial pathogens. Mol. Microbiol. 120 (1), 32–44. doi:10.1111/mmi.15034
Ireton, K., Van Ngo, H., Bhalla, M., Address, P., and Paykel Trust, P. (2018). Interaction of microbial pathogens with host exocytic pathways. Cell. Microbiol. 20 (8), e12861. doi:10.1111/CMI.12861
Jiang, J., Ma, L., Prakapenka, D., VanRaden, P. M., Cole, J. B., and Da, Y. (2019). A large-scale genome-wide association study in U.S. Holstein cattle. Front. Genet. 10, 412. doi:10.3389/fgene.2019.00412
Kaisho, T., Ishikawa, J., Oritani, K., Inazawa, J., Tomizawa, H., Muraoka, O., et al. (1994). BST-1, a surface molecule of bone marrow stromal cell lines that facilitates pre-B-cell growth. Proc. Natl. Acad. Sci. 91 (12), 5325–5329. doi:10.1073/pnas.91.12.5325
Katjiuongua, H. B., and Nelgen, S. (2014). Tanzania smallholder dairy value chain development: situation analysis and trends. Available online at: https://cgspace.cgiar.org/handle/10568/68513 (Accessed April 2023).
Kim, K., Kwon, T., Dessie, T., Yoo, D. A., Mwai, O. A., Jang, J., et al. (2020). The mosaic genome of indigenous African cattle as a unique genetic resource for African pastoralism. Nat. Genet.;52(10): 1099–1110. doi:10.1038/s41588-020-0694-2
Knap, P. W., and Doeschl-Wilson, A. (2020). Why breed disease-resilient livestock, and how? Genet. Sel. Evol. 52 (1), 60. doi:10.1186/s12711-020-00580-4
Kwok, A. J., Mentzer, A., and Knight, J. C. (2021). Host genetics and infectious disease: new tools, insights and translational opportunities. Nat. Rev. Genet. 22 (3), 137–153. doi:10.1038/s41576-020-00297-6
Lankester, F., Kibona, T., Allan, K. J., Glanville, W. A., Buza, J. J., Katzer, F., et al. (2024). The value of livestock abortion surveillance in Tanzania: identifying disease priorities and informing interventions. eLife 13. doi:10.7554/eLife.95296
Leach, R. J., Craigmile, S. C., Knott, S. A., Williams, J. L., and Glass, E. J. (2010). Quantitative trait loci for variation in immune response to a Foot-and-Mouth Disease virus peptide. BMC Genet. 11, 107. doi:10.1186/1471-2156-11-107
Lee, S. H., Wray, N. R., Goddard, M. E., and Visscher, P. M. (2011). Estimating missing heritability for disease from genome-wide association studies. Am. J. Hum. Genet. 88 (3), 294–305. doi:10.1016/j.ajhg.2011.02.002
Lelliott, P. M., McMorran, B. J., Foote, S. J., and Burgio, G. (2015). The influence of host genetics on erythrocytes and malaria infection: is there therapeutic potential? Malar. J. 14 (1), 289. doi:10.1186/s12936-015-0809-x
Lentjes, M. H., Niessen, H. E., Akiyama, Y., de Bruïne, A. P., Melotte, V., and van Engeland, M. (2016). The emerging role of GATA transcription factors in development and disease. Expert Rev. Mol. Med. 18, e3. doi:10.1017/erm.2016.2
Li, H. (2011). A statistical framework for SNP calling, mutation discovery, association mapping and population genetical parameter estimation from sequencing data. Bioinformatics 27 (21), 2987–2993. doi:10.1093/bioinformatics/btr509
Li, Y., Viscidi, R. P., Kannan, G., McFarland, R., Pletnikov, M. V., Severance, E. G., et al. (2018). Chronic Toxoplasma gondii infection induces anti-N-Methyl-d-Aspartate receptor autoantibodies and associated behavioral changes and neuropathology. Infect. Immun. 86 (10), 003988-18–e418. doi:10.1128/IAI.00398-18
Liu, T., Qu, H., Luo, C., Li, X., Shu, D., Lund, M. S., et al. (2014). Genomic selection for the improvement of antibody response to Newcastle disease and avian influenza virus in chickens. PLOS ONE 9 (11), e112685. doi:10.1371/journal.pone.0112685
Liu, Y., Song, J., Gu, J., Xu, S., Wang, X., and Liu, Y. (2023). The role of BTBD7 in normal development and tumor progression. Technol. Cancer Res. and Treat. 22, 15330338231167732. doi:10.1177/15330338231167732
Loh, P. R., Danecek, P., Palamara, P. F., Fuchsberger, C., Reshef, Y. A., Finucane, H. K., et al. (2016). Reference-based phasing using the haplotype reference consortium panel. Nat. Genet. 48(11): 1443–1448. doi:10.1038/ng.3679
Luo, H., Hu, L., Brito, L. F., Dou, J., Sammad, A., Chang, Y., et al. (2022). Weighted single-step GWAS and RNA sequencing reveals key candidate genes associated with physiological indicators of heat stress in Holstein cattle. J. Animal Sci. Biotechnol. 13 (1), 108. doi:10.1186/s40104-022-00748-6
Machado, P. C., Brito, L. F., Martins, R., Pinto, L. F. B., Silva, M. R., and Pedrosa, V. B. (2022). Genome-wide association analysis reveals novel loci related with visual score traits in nellore cattle raised in pasture–based systems. Animals Open Access J. MDPI 12 (24), 3526. doi:10.3390/ani12243526
Madden, L. V., and Ojiambo, P. S. (2024). The value of generalized linear mixed models for data analysis in the plant sciences. Front. Hortic. 3. doi:10.3389/fhort.2024.1423462
Mangino, M., Roederer, M., Beddall, M. H., Nestle, F. O., and Spector, T. D. (2017). Innate and adaptive immune traits are differentially affected by genetic and environmental factors. Nat. Commun. 8 (1), 13850. doi:10.1038/ncomms13850
Manichaikul, A., Mychaleckyj, J. C., Rich, S. S., Daly, K., Sale, M., and Chen, W. M. (2010). Robust relationship inference in genome-wide association studies. Bioinformatics 26 (22), 2867–2873. doi:10.1093/bioinformatics/btq559
Marshall, K., Gibson, J. P., Mwai, O., Mwacharo, J. M., Haile, A., Getachew, T., et al. (2019). Livestock genomics for developing countries – african examples in practice. Front. Genet. 10, 297. doi:10.3389/fgene.2019.00297
Matika, O., Riggio, V., Anselme-Moizan, M., Law, A. S., Pong-Wong, R., Archibald, A. L., et al. (2016). Genome-wide association reveals QTL for growth, bone and in vivo carcass traits as assessed by computed tomography in Scottish Blackface lambs. Genet. Sel. Evol. 48 (1), 11–15. doi:10.1186/s12711-016-0191-3
Matika, O., Robledo, D., Pong-Wong, R., Bishop, S. C., Riggio, V., Finlayson, H., et al. (2019). Balancing selection at a premature stop mutation in the myostatin gene underlies a recessive leg weakness syndrome in pigs. PLOS Genet. 15 (1), e1007759. doi:10.1371/JOURNAL.PGEN.1007759
Medzhitov, R., Schneider, D. S., and Soares, M. P. (2012). Disease tolerance as a defense strategy. Science. 335 (6071), 936–941. doi:10.1126/science.1214935
Melo Hanchuk, T. D., Papa, P. F., La Guardia, P. G., Vercesi, A. E., and Kobarg, J. (2015). Nek5 interacts with mitochondrial proteins and interferes negatively in mitochondrial mediated cell death and respiration. Cell. Signal. 27 (6), 1168–1177. doi:10.1016/j.cellsig.2015.02.021
Mengele, I. J., Shirima, G. M., Bwatota, S. F., Motto, S. K., Bronsvoort, B. M., de, C., et al. (2023). The status and risk factors of brucellosis in smallholder dairy cattle in selected regions of Tanzania. Veterinary Sci. 10 (2), 155. doi:10.3390/vetsci10020155
Michaelson, J. J., Shin, M. K., Koh, J. Y., Brueggeman, L., Zhang, A., Katzman, A., et al. (2017). Neuronal PAS domain proteins 1 and 3 are master regulators of neuropsychiatric risk genes. Biol. Psychiatry 82 (3), 213–223. doi:10.1016/j.biopsych.2017.03.021
Milne, G., Webster, J. P., and Walker, M. (2020). Toxoplasma gondii: an underestimated threat? Trends Parasitol. 36 (12), 959–969. doi:10.1016/j.pt.2020.08.005
Moennig, V., and Becher, P. (2018). Control of bovine viral diarrhea. Pathogens 7 (1), 29. doi:10.3390/pathogens7010029
Mortensen, H., Nielsen, S. S., and Berg, P. (2004). Genetic variation and heritability of the antibody response to Mycobacterium avium subspecies paratuberculosis in Danish Holstein cows. J. Dairy Sci. 87 (7), 2108–2113. doi:10.3168/jds.S0022-0302(04)70029-6
Moser, G., Lee, S. H., Hayes, B. J., Goddard, M. E., Wray, N. R., and Visscher, P. M. (2015). Simultaneous discovery, estimation and prediction analysis of complex traits using a bayesian mixture model. PLOS Genet. 11 (4), e1004969. doi:10.1371/journal.pgen.1004969
Motto, S. K., Hernandez-Castro, L. E., Shirima, G. M., Mengele, I. J., Bwatota, S. F., Bronsvoort, B. M. de C., et al. (2023). Seroepidemiology of Leptospira serovar Hardjo and associated risk factors in smallholder dairy cattle in Tanzania. PLOS Neglected Trop. Dis. 17 (4), e0011199. doi:10.1371/journal.pntd.0011199
Mrode, R., Ojango, J., Ekine-Dzivenu, C., Aliloo, H., Gibson, J., and Okeyo, M. A. (2021). Genomic prediction of crossbred dairy cattle in Tanzania: a route to productivity gains in smallholder dairy systems. J. Dairy Sci. 104 (11), 11779–11789. doi:10.3168/jds.2020-20052
Mrode, R., Ojango, J. M. K., Okeyo, A. M., and Mwacharo, J. M. (2019). Genomic selection and use of molecular tools in breeding programs for indigenous and crossbred cattle in developing countries: current status and future prospects. Front. Genet. 9, 694. doi:10.3389/fgene.2018.00694
Nicolazzi, E. L., Caprera, A., Nazzicari, N., Cozzi, P., Strozzi, F., Lawley, C., et al. (2015). SNPchiMp v.3: integrating and standardizing single nucleotide polymorphism data for livestock species. BMC Genomics 16 (1), 283. doi:10.1186/S12864-015-1497-1
Ojavee, S. E., Kutalik, Z., and Robinson, M. R. (2022). Liability-scale heritability estimation for biobank studies of low prevalence disease. medRxiv. doi:10.1101/2022.02.02.22270229
Ovsyannikova, I. G., Haralambieva, I. H., Crooke, S. N., Poland, G. A., and Kennedy, R. B. (2020). The role of host genetics in the immune response to SARS-CoV-2 and COVID-19 susceptibility and severity. Immunol. Rev. 296 (1), 205–219. doi:10.1111/imr.12897
Pan, Y., Li, R., Meng, J. L., Mao, H. T., Zhang, Y., and Zhang, J. (2014). Smurf2 negatively modulates RIG-I–dependent antiviral response by targeting VISA/MAVS for ubiquitination and degradation. J. Immunol. 192 (10), 4758–4764. doi:10.4049/jimmunol.1302632
Purcell, S., Neale, B., Todd-Brown, K., Thomas, L., Ferreira, M. A. R., Bender, D., et al. (2007). PLINK: a tool set for whole-genome association and population-based linkage analyses. Am. J. Hum. Genet. 81 (3), 559–575. doi:10.1086/519795
Qu, W., Yuan, S., Quan, C., Huang, Q., Zhou, Q., Yap, Y., et al. (2020). The essential role of intraflagellar transport protein IFT81 in male mice spermiogenesis and fertility. Am. J. Physiology - Cell. Physiology 318 (6), C1092-C1106–C1106. doi:10.1152/ajpcell.00450.2019
Råberg, L., Sim, D., and Read, A. F. (2007). Disentangling genetic variation for resistance and tolerance to infectious diseases in animals. Science 318 (5851), 812–814. doi:10.1126/science.1148526
Reichel, M. P., Alejandra Ayanegui-Alcérreca, M., Gondim, L. F. P., and Ellis, J. T. (2013). What is the global economic impact of Neospora caninum in cattle – the billion dollar question. Int. J. Parasitol. 43 (2), 133–142. doi:10.1016/j.ijpara.2012.10.022
Richter, V., Kattwinkel, E., Firth, C. L., Marschik, T., Dangelmaier, M., Trauffler, M., et al. (2019). Mapping the global prevalence of bovine viral diarrhoea virus infection and its associated mitigation programmes. Veterinary Rec. 184 (23), 711. doi:10.1136/vr.105354
Ring, S. C., Graham, D. A., Kelleher, M. M., Doherty, M. L., and Berry, D. P. (2019). Genetic parameters for variability in the birth of persistently infected cattle following likely in utero exposure to bovine viral diarrhea virus. J. Animal Sci. 97 (2), 559–568. doi:10.1093/JAS/SKY430
RStudio Team (2020). RStudio: integrated development for R. RStudio. Boston, MA: PBC. Available online at: http://www.rstudio.com/.
Rubicz, R., Leach, C. T., Kraig, E., Dhurandhar, N. V., Duggirala, R., Blangero, J., et al. (2011). Genetic factors influence serological measures of common infections. Hum. Hered. 72 (2), 133–141. doi:10.1159/000331220
Rubicz, R., Yolken, R., Drigalenko, E., Carless, M. A., Dyer, T. D., Kent, Jr J., et al. (2015). Genome-wide genetic investigation of serological measures of common infections. Eur. J. Hum. Genet. 23 (11), 1544–1548. doi:10.1038/ejhg.2015.24
Ryan, E. G., Leonard, N., O’Grady, L., More, S. J., and Doherty, M. L. (2012). Seroprevalence of leptospira hardjo in the Irish suckler cattle population. Ir. Veterinary J. 65 (1), 8–11. doi:10.1186/2046-0481-65-8
Sallin, M. A., Kauffman, K. D., Riou, C., Du Bruyn, E., Foreman, T. W., Sakai, S., et al. (2018). Host resistance to pulmonary Mycobacterium tuberculosis infection requires CD153 expression. Nat. Microbiol. 3 (11), 1198–1205. doi:10.1038/s41564-018-0231-6
Scharnböck, B., Roch, F. F., Richter, V., Funke, C., Firth, C. L., Obritzhauser, W., et al. (2018). A meta-analysis of bovine viral diarrhoea virus (BVDV) prevalences in the global cattle population. Sci. Rep. 8 (1), 14420. doi:10.1038/s41598-018-32831-2
Shapira, M., Hamlin, B. J., Rong, J., Chen, K., Ronen, M., and Tan, M. W. (2006). A conserved role for a GATA transcription factor in regulating epithelial innate immune responses. Proc. Natl. Acad. Sci. U. S. A. 103 (38), 14086–14091. doi:10.1073/pnas.0603424103
Shepley-McTaggart, A., Schwoerer, M. P., Sagum, C. A., Bedford, M. T., Jaladanki, C. K., Fan, H., et al. (2021). Ubiquitin ligase SMURF2 interacts with filovirus VP40 and promotes egress of VP40 VLPs. Viruses 13 (2), 288. doi:10.3390/v13020288
Siwek, M., Slawinska, A., Rydzanicz, M., Wesoly, J., Fraszczak, M., Suchocki, T., et al. (2015). Identification of candidate genes and mutations in QTL regions for immune responses in chicken. Anim. Genet. 46 (3), 247–254. doi:10.1111/age.12280
Solovieff, N., Cotsapas, C., Lee, P. H., Purcell, S. M., and Smoller, J. W. (2013). Pleiotropy in complex traits: challenges and strategies. Nat. Rev. Genet. 14 (7), 483–495. doi:10.1038/nrg3461
Sonar, S., and Lal, G. (2015). Role of tumor necrosis factor superfamily in neuroinflammation and autoimmunity. Front. Immunol. 6, 364. doi:10.3389/fimmu.2015.00364
Swai, E. S., and Karimuribo, E. D. (2011a). Smallholder dairy farming in Tanzania. Outlook Agric. 40 (1), 21–27. doi:10.5367/OA.2011.0034
Swai, E. S., and Karimuribo, E. D. (2011b). Smallholder dairy farming in Tanzania: current profiles and prospects for development. Outlook Agric. 40 (1), 21–27. doi:10.5367/oa.2011.0034
Swai, E. S., Karimuribo, E. D., and Kambarage, D. M. (2010). Risk factors for smallholder dairy cattle mortality in Tanzania. J. South Afr. Veterinary Assoc. 81 (4), 241–246. doi:10.4102/jsava.v81i4.155
Thomas, K. M., Kibona, T., Claxton, J. R., de Glanville, W. A., Lankester, F., Amani, N., et al. (2022). Prospective cohort study reveals unexpected aetiologies of livestock abortion in northern Tanzania. Sci. Rep. 12 (1), 11669. doi:10.1038/s41598-022-15517-8
VanRaden, P. M. (2008). Efficient methods to compute genomic predictions. J. Dairy Sci. 91 (11), 4414–4423. doi:10.3168/JDS.2007-0980
van Scheltinga, A. F. T., Bakker, S. C., and Kahn, R. S. (2010). Fibroblast growth factors in schizophrenia. Schizophr. Bull. 36 (6), 1157–1166. doi:10.1093/schbul/sbp033
Velavan, T. P., Pallerla, S. R., Rüter, J., Augustin, Y., Kremsner, P. G., Krishna, S., et al. (2021). Host genetic factors determining COVID-19 susceptibility and severity. eBioMedicine 72, 103629. doi:10.1016/j.ebiom.2021.103629
Walz, P. H., Chamorro, M. F., Falkenberg, S., Passler, T., van der Meer, F., and Woolums, A. (2020). Bovine viral diarrhea virus: an updated American College of Veterinary Internal Medicine consensus statement with focus on virus biology, hosts, immunosuppression, and vaccination. J. Veterinary Intern. Med. 34(5): 1690–1706. doi:10.1111/jvim.15816
Wang, A. W., Avramopoulos, D., Lori, A., Mulle, J., Conneely, K., Powers, A., et al. (2019). Genome-wide association study in two populations to determine genetic variants associated with Toxoplasma gondii infection and relationship to schizophrenia risk. Prog. Neuro-Psychopharmacology Biol. Psychiatry 92, 133–147. doi:10.1016/j.pnpbp.2018.12.019
Ward-Kavanagh, L., Lin, W. W., Šedý, J. S., and Ware, C. F. (2016). The TNF receptor superfamily in costimulating and coinhibitory responses. Immunity 44 (5), 1005–1019. doi:10.1016/j.immuni.2016.04.019
Wirsching, H. G., Silginer, M., Ventura, E., Macnair, W., Burghardt, I., Claassen, M., et al. (2021). Negative allosteric modulators of metabotropic glutamate receptor 3 target the stem-like phenotype of glioblastoma. Mol. Ther. - Oncolytics 20, 166–174. doi:10.1016/j.omto.2020.12.009
Workman, A. M., Heaton, M. P., Vander Ley, B. L., Webster, D. A., Sherry, L., Bostrom, J. R., et al. (2023). First gene-edited calf with reduced susceptibility to a major viral pathogen. PNAS Nexus 2 (5), pgad125. doi:10.1093/pnasnexus/pgad125
Workman, A. M., Heaton, M. P., Webster, D. A., Harhay, G. P., Kalbfleisch, T. S., Smith, T. P. L., et al. (2021). Evaluating large spontaneous deletions in a bovine cell line selected for bovine viral diarrhea virus resistance. Viruses 13 (11), 2147. doi:10.3390/v13112147
Wragg, D., Cook, E. A. J., de Laté, P. L., Sitt, T., Hemmink, J. D., Chepkwony, M. C., et al. (2022). A locus conferring tolerance to Theileria infection in African cattle. PLOS Genet. 18 (4), e1010099. doi:10.1371/JOURNAL.PGEN.1010099
Wu, H., Wang, Y., Zhang, Y., Yang, M., Lv, J., Liu, J., et al. (2015). TALE nickase-mediated SP110 knockin endows cattle with increased resistance to tuberculosis. Proc. Natl. Acad. Sci. 112 (13), E1530–E1539. doi:10.1073/pnas.1421587112
Xiao, J., Prandovszky, E., Kannan, G., Pletnikov, M. V., Dickerson, F., Severance, E. G., et al. (2018). Toxoplasma gondii: biological parameters of the connection to schizophrenia. Schizophr. Bull. 44 (5), 983–992. doi:10.1093/schbul/sby082
Yi, H., Geng, L., Black, A., Talmon, G., Berim, L., and Wang, J. (2017). The miR-487b-3p/GRM3/TGFβ signaling axis is an important regulator of colon cancer tumorigenesis. Oncogene 36 (24), 3477–3489. doi:10.1038/onc.2016.499
Yokoyama, S. (2023). Genetic polymorphisms of bone marrow stromal cell antigen-1 (BST-1/CD157): implications for immune/inflammatory dysfunction in neuropsychiatric disorders. Front. Immunol. 14, 1197265. doi:10.3389/fimmu.2023.1197265
Zhong, X., Moresco, J. J., Keller, K., Lazaro, D. R., Ely, C., Moresco, E. M. Y., et al. (2023). Essential requirement for IER3IP1 in B cell development. Proc. Natl. Acad. Sci. 120 (46), e2312810120. doi:10.1073/pnas.2312810120
Zhou, X., and Stephens, M. (2012). Genome-wide efficient mixed model analysis for association studies. Nat. Genet. 44 (7), 821–824. doi:10.1038/NG.2310
Zirra-Shallangwa, B., González Gordon, L., Hernandez-Castro, L. E., Cook, E. A. J., Bronsvoort, B. M., de, C., et al. (2022). The epidemiology of bovine viral diarrhea virus in low- and middle-income countries: a systematic review and meta-analysis. Front. Veterinary Sci. 9, 947515. doi:10.3389/fvets.2022.947515
Keywords: genetic estimates, GWAS, genomic population characterisation, Tanzanian dairy cattle, serological response traits, health traits, selective breeding and therapeutic target
Citation: Hernandez-Castro LE, Cook EAJ, Matika O, Mengele IJ, Motto SK, Bwatota SF, Zirra-Shallangwa B, Pong-Wong R, Prendergast J, Mrode R, Toye PG, Komwihangilo DM, Lyatuu E, Karani BE, Nangekhe G, Mwai AO, Shirima GM and Bronsvoort BMdC (2025) Genetic estimates and genome-wide association studies of antibody response in Tanzanian dairy cattle. Front. Genet. 16:1497355. doi: 10.3389/fgene.2025.1497355
Received: 16 September 2024; Accepted: 03 March 2025;
Published: 24 April 2025.
Edited by:
Fernanda Marcondes de Rezende, University of Florida, United StatesReviewed by:
Vinicius Silva Junqueira, Bayer CropScience, BrazilRoy Costilla, AgResearch Ltd., New Zealand
Copyright © 2025 Hernandez-Castro, Cook, Matika, Mengele, Motto, Bwatota, Zirra-Shallangwa, Pong-Wong, Prendergast, Mrode, Toye, Komwihangilo, Lyatuu, Karani, Nangekhe, Mwai, Shirima and Bronsvoort. This is an open-access article distributed under the terms of the Creative Commons Attribution License (CC BY). The use, distribution or reproduction in other forums is permitted, provided the original author(s) and the copyright owner(s) are credited and that the original publication in this journal is cited, in accordance with accepted academic practice. No use, distribution or reproduction is permitted which does not comply with these terms.
*Correspondence: Luis E. Hernandez-Castro, ZW5yaXFoZXJuYW5kZXoxOEBnbWFpbC5jb20=; Barend Mark de Clare Bronsvoort, bWFyay5icm9uc3Zvb3J0QHJvc2xpbi5lZC5hYy51aw==
†These authors have contributed equally to this work