 Goodwin G. Jinesh1,2*‡
 Isha Godwin3†‡
- 1Department of Molecular Oncology, H. Lee Moffitt Cancer Center & Research Institute, Tampa, FL, United States
- 2Molecular Medicine Program, H. Lee Moffitt Cancer Center & Research Institute, Tampa, FL, United States
- 3Saveetha Medical College, Chennai, Tamil Nadu, India
Filaggrin gene (FLG/FLG2) product deregulations are associated with various allergic skin diseases, including but not limited to atopic dermatitis, alopecia areata, and ichthyosis vulgaris. However, the molecular immunological underpinnings of filaggrin phenotype manifestations are not completely understood. To gain insight into the underlying context, we classified the melanomas based on the filaggrin expression (filaggrinHigh/Low) and profiled the signaling context behind pruritic melanomas. We identified that the major signaling context changes behind filaggrinHigh melanomas are active FGFR signaling and impaired GNA14 and Th1 signatures, in addition to many genetic and immune changes that are associated with pruritus.
Introduction
Filaggrin gene (FLG/FLG2) mutations and expression are associated with various allergic skin diseases, such as atopic dermatitis, alopecia areata, and ichthyosis vulgaris (Smith et al., 2006; Irvine et al., 2011). These diseases are characterized by the terminal differentiation of keratinocytes and skin cells into keratinized and cornified envelope-enriched layers of skin as a result of pruritic allergies. However, the molecular signaling underpinnings of these skin phenotype manifestations behind filaggrin are poorly understood. Filaggrins also affect the biology of melanoma angiogenesis and malignancy, which primarily target the skin (Thyssen et al., 2018; Leick et al., 2019). Pruritus in melanoma patients is induced in the context of checkpoint immunotherapy (Salinas et al., 2021). Pruritus in the skin is an itching sensation, and the scratch response is triggered by microbial and/or autoantigens through an immune cell-directed allergic reaction involving histamine (Yarwood et al., 2000). Histamine has the potential to inhibit interferon-γ (IFN-γ) signaling in melanoma (Kanda and Watanabe, 2002) and, therefore, could blunt Th1 immunity (Bradley et al., 1996). Interestingly, individuals with the loss-of-function variations in FLG are diagnosed with melanoma frequently (Adelanwa et al., 2022). To gain insight into the signaling context behind filaggrins, we examined the filaggrin expression (filaggrinHigh/Low: combined FLG and FLG2 mRNAs; see the methods section for details)-associated melanoma transcriptome to understand the underlying genetic and immune-signature context behind pruritic melanomas.
Methods
TCGA skin cutaneous melanoma (SKCM) data patient grouping based on filaggrin
Skin cutaneous melanoma (SKCM) RNA-Seq data were obtained from the Cancer Genome Atlas (TCGA) (https://gdac.broadinstitute.org/). The RNA-Seq dataset was processed as described previously (Jinesh et al., 2024a). Briefly, the RNA-Seq dataset was sorted based on FLG, FLG2, or a combination of FLG + FLG2 mRNA expression to stratify patients into FLGHigh versus FLGLow (n = 73 each), FLG2High versus FLG2Low (n = 73 each), and FLG + FLG2 filaggrinHigh versus FLG + FLG2 filaggrinLow (n = 47 each) groups of equal size within sets to have equal statistical power. Further details regarding the number of patients per group are given in specific sections below.
Patient overall survival analysis of filaggrin-based melanoma patient groups
The overall survival data of the filaggrin-based patient groups were analyzed as described previously (Jinesh et al., 2021; Jinesh et al., 2020; Jinesh and Kamat, 2017). Briefly, TCGA SKCM survival data for FLG mRNA expression-based groups were obtained through OncoLnc (http://www.oncolnc.org/) using 16% settings for the FLGHigh and FLGLow groups (n = 73 each) to get the survival data. Similarly, FLG2 mRNA expression-based groups were obtained using 16% settings for the FLG2High and FLG2Low groups (n = 73 each) to get the survival data. The FLG + FLG2 mRNA expression-based groups were obtained after calculating the average of FLG and FLG2 mRNA expression from RNA-Seq data and sorting based on the average mRNA expression of FLG and FLG2 mRNAs per patient. Then, the group was set at >90 versus <10 percentiles for the FLG + FLG2 filaggrinHigh and FLG + FLG2 filaggrinLow groups (n = 47 each) to get the survival data (Supplementary Figure S1A) (see the statistics section for significance calculations).
SKCM FLG versus FLG2 mRNA expression correlation analysis
SKCM RNA-Seq data from TCGA SKCM samples were processed to classify the normal versus tumor, and the tumor sample set was used to create an XY-plot of the mRNA expression data of FLG and FLG2 using GraphPad Prism v.7.04 (La Jolla, CA, United States). The Pearson r2 correlation coefficient was calculated at a 95% confidence interval using the GraphPad software.
cBioPortal: SKCM FLG and FLG2 mutation analysis
SKCM mutation data for FLG and FLG2 were obtained through cBioPortal (https://www.cbioportal.org/) (Cerami et al., 2012; Gao et al., 2013). Briefly, SKCM FLG + FLG2 filaggrinHigh and filaggrinLow group patient IDs were fed into cBioPortal as groups, and the mutation data for driver mutations and variants of unknown significance (VUS) were examined. The data were presented in a tabular form. There was no significant difference in mutation numbers.
cBioPortal: SKCM 450 k methylation data analysis
Methylation analysis was carried out as described previously (Jinesh et al., 2018), with minor modifications. Briefly, the 450 k methylation data of TCGA SKCM samples were accessed through cBioPortal (https://www.cbioportal.org/) (Cerami et al., 2012; Gao et al., 2013). The methylation log2 data and their negative log10 p-value data were then used to create an XY-plot in GraphPad Prism v.7.04 (La Jolla, CA, United States). Datapoints with moderate (p=<0.05 to >0.001) to high (p=<0.001) significance on the high- and low- methylated genes were color-coded, as indicated in the figure.
Gene set enrichment analysis (GSEA) and genomic positional GSEA
GSEA was performed as described previously (Jinesh et al., 2024b). Briefly, the SKCM RNA-Seq data from the filaggrinHigh and filaggrinLow groups were subjected to FPKM adjustment, and group averages for all genes were calculated. The filaggrinHigh and filaggrinLow group averages were subjected to GSEA for Hallmark, C1-positional, C2-curated, C3-motif, C5-Gene Ontology, C6-oncogenic, C7-immunologic, and C8-cell type complete gene-set collections/modules (MsigDB: https://www.gsea-msigdb.org/gsea/msigdb/ against Human_Illumina_Array_MSigDB.v7.5.1.chip). The phenotypes analyzed were filaggrinHigh and filaggrinLow tumors (switching class-B: filaggrinHigh versus class-A filaggrinLow phenotype), the >21,990 normalized enrichment scores (NESs) of all modules that were run (excluding C1-positional, which was processed separately) were combined in Microsoft Windows 10 PowerShell, and the top ranks were identified based on NES sorting.
The top-ranked gene sets with the lowest FDRq value and NES >2 or < −2 were used to generate a dotplot using the ggplot2 package in R. The FDRq values were converted to negative integers to reflect false discoveries as small dots in the dotplot. The dotplot and scale were composited in Adobe Photoshop CS5 and resized simultaneously using the lock aspect ratio to avoid unintended changes in dot sizes of the plot and the scale.
The C1-positional set enrichments were sorted based on NESs, and the top upregulated signature was examined for filaggrins and associated gene identities using GraphPad Prism v.7.04 (La Jolla, CA, United States).
R code:
library(ggplot2)
ggplot(DFname, aes(x = Xgroup, y = YGeneset)) +
geom_point(aes(size = NegativeFRDqValue, color = NES)) +
scale_color_gradientn(colors = c(“magenta,” “steelblue,” “black,” “white,” “brown,” “red,” “yellow”),
limits = c(-3, 3))
Network analysis of differentially expressed genes between the filaggrinHigh and filaggrinLow groups
The differentially expressed genes between the filaggrinHigh and filaggrinLow groups were filtered based on the p-value (cut off: <0.05) and log2 fold change (>2 for genes upregulated in filaggrinHigh melanomas and <2 for genes downregulated in filaggrinHigh melanomas). The gene symbols of the 536 upregulated genes in filaggrinHigh melanomas were fed into the NetworkAnalyst web server (https://www.networkanalyst.ca/) (Zhou et al., 2019) using the gene list input mode, and the analysis was run using the SIGNOR 2.0 database of Signaling Network. The network was organized into a circular/bi/tripartite layout before exporting the image. A similar analysis was carried out for 116 downregulated genes in filaggrinHigh melanomas. Node tables were exported for both the upregulated and downregulated gene sets, and the degree and betweenness scores were fed into the ggplot2 package in R to generate ranked dotplots to see the top-node-associated genes.
R codes:
> library(ggplot2)
# For upregulated genes in filaggrinHigh melanomas
> ggplot(DFname, aes(x = XGroup, y = YGene)) +
geom_point(aes(size = Betweenness, color = Degree)) +
scale_color_gradientn(colors = c(“black,” “blue,” “magenta,” “red”),
limits = c(2, 32))
# For downregulated genes in filaggrinHigh melanomas
> ggplot(DFname, aes(x = XGroup, y = YGene)) +
geom_point(aes(size = Betweenness, color = Degree)) +
scale_color_gradientn(colors = c(“black,” “blue,” “magenta,” “red”), limits = c(0, 100))
The dotplot and scale were composited in Adobe Photoshop CS5 and resized simultaneously using the lock aspect ratio to keep the dot size matching between the plot and the scale.
Detailed translation of the filaggrin-based transcriptome in Enrichr
Differentially expressed genes between the filaggrinHigh and filaggrinLow groups that were filtered based on the p-value and log2 fold change and sorted as upregulated and downregulated genes for NetworkAnalyst analysis (see above in the network analysis section) were fed into the Enrichr online web server (Chen et al., 2013; Kuleshov et al., 2016; Xie et al., 2021) to examine the top signatures based on the expression of these genes. All Enrichr signatures were collected as text files, merged in Windows 10 PowerShell, and sorted based on adjusted p-values. The top signatures obtained for the upregulated and downregulated signature results were categorized into disease, tissue, gene co-expression, genetics, microbes and immunity, and chemicals and drugs. The adjusted p-values and the number of gene hits for the categorized signatures were plotted as dotplots using the ggplot2 package in R. The dotplot and scale were composited in Adobe Photoshop CS5 and resized simultaneously using the lock aspect ratio to avoid unintended changes in dot sizes of the plot and the scale. To make the dot sizes comparable between dot plots of various categories, minimum and maximum limits were set based on the full dataset range. The minimum and maximum limits of the dots were cropped off during figure compositing.
R code:
> library(ggplot2)
# For upregulated genes in filaggrinHigh melanomas
> ggplot(DFname, aes(x = Xgroup, y = YGeneset)) +
geom_point(aes (size = GeneNumber, color = AdjpValueR)) +
scale_color_gradientn (colors = c(“black,” “red,” “yellow”), limits = c(0, 300))
#GeneNumber = Number of hits
# For downregulated genes in filaggrinHigh melanomas
> ggplot(DFname, aes(x = Xgroup, y = YGeneset)) +
geom_point(aes(size = GeneNumber, color = AdjpValueR)) +
scale_color_gradientn(colors = c(“black,” “magenta,” “skyblue1”), limits = c(0, 30))
#GeneNumber = Number of hits
Statistical analyses
The filaggrin-based group survival data were then plotted using GraphPad Prism v.7.04 (La Jolla, CA, United States), and the log-rank (Mantel–Cox test) p-values were considered for the level of significance, as described previously (Jinesh et al., 2017). P-values <0.05 were considered minimally significant, and those <0.001 were considered highly significant. The sample number “n” for the TCGA data patient groups is indicated in the figures. For the methylation analysis, the p-value of 0.05 was considered significant, and p-values <0.001 were considered to be of robust significance. The p-values were based on cBioPortal analysis. For Enrichr dotplots, adjusted p-values were considered for significance inferences. For GSEA, normalized enrichment scores (NES) with the lowest FDRq values (close to zero) were considered as strong enrichments (negative or positive).
Results
High filaggrin mRNA expression (FLG and/or FLG2 transcripts) is associated with a poor overall survival in melanoma (Figure 1A), and a positive correlation was observed in the expression patterns between the FLG and FLG2 transcripts (Figure 1B). Therefore, based on the average of the combined FLG and FLG2 mRNA expressions, we classified the melanoma patients into the filaggrinHigh and filaggrinLow groups, respectively (Supplementary Figure S1A). Interestingly, no recognizable mutation status differences were detected between the groups (Figure 1C), but significant methylation log2 ratio differences for the FLG and FLG2 genes were found (Figure 1D).
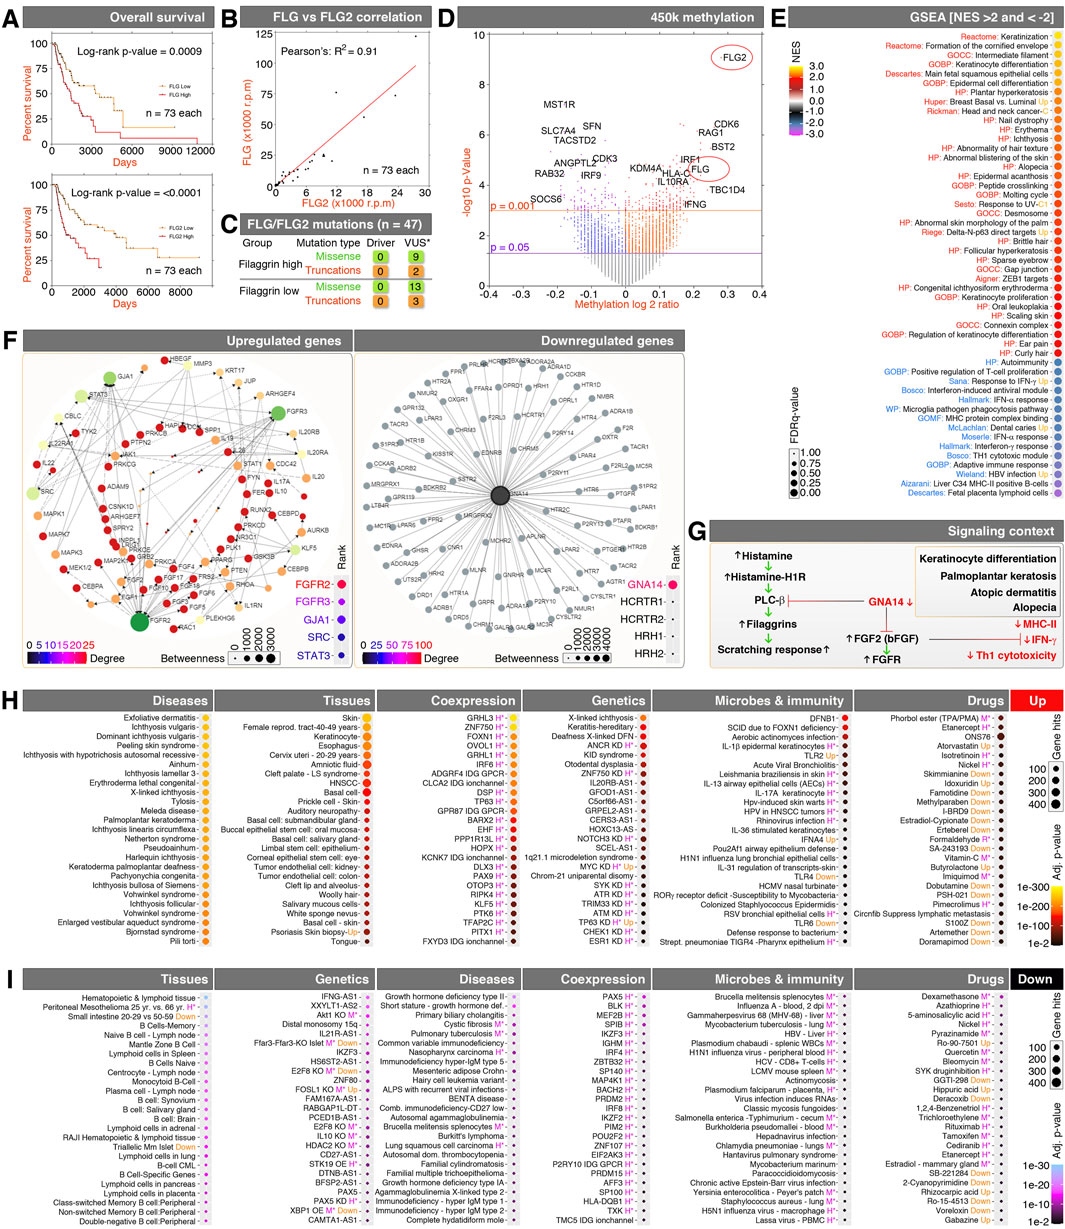
Figure 1. Filaggrin-based expression profiling reveals the underpinnings of the signaling and immune context of filaggrinHigh melanomas. (A) Kaplan–Meier curves of FLG (top) and FLG2 (bottom)-based classifications of melanoma. (B) Correlation analysis of FLG and FLG2 expression in melanomas. (C) cBioPortal-based driver and variants of unknown significance (*VUS) mutations between filaggrinHigh/Low groups of melanomas. (D) Methylation versus mRNA expression volcano plot showing FLG and FLG2 (red ellipse marks) at the highly methylated subset. (E) GSEA of filaggrinHigh/Low RNA-Seq data. (F) Network analysis of filaggrinHigh/Low RNA-Seq data to get the signaling connections. The color scale and dot size are for the dotplot on the bottom right, showing the top-ranked signaling networks. (G) Schematic showing the signaling context inferred using panel-f and the published literature. Red indicates inhibited or downregulated signaling components. Green or black indicates upregulated signaling components/phenotypes. (H–I) Detailed Enrichr profiling of the filaggrinHigh/Low RNA-Seq data for the upregulated genes panel (H) and downregulated genes panel (I). Purple *H indicates human data, and *M indicates mouse data.
GSEA examination of differentially expressed genes between the filaggrinHigh and filaggrinLow groups confirmed the enrichment of RNAs related to clinically observed known human phenotypes driven by filaggrins, such as atopic dermatitis, alopecia, and ichthyosis, in addition to cell–cell contact structures, skin keratinization, and keratinocyte differentiation signatures (Figure 1E). Consistently, filaggrins co-expressed with the cornified envelope-regulatory gene signature (Supplementary Figure S1B). Conversely, a notable suppression of the interferon, major histocompatibility complex II (MHC-II), and Th1 cytotoxic modules was evident at the RNA level (Figure 1E). These data suggest that the suppression of the Th1 cytotoxic immunity signature is associated with the ichthyosis-related gene expression signature in filaggrinHigh melanomas.
Network analysis of the top significantly upregulated genes displayed a large network of the FGF–FGFR system, and the significantly downregulated genes displayed a large network of GNA14-networked genes (Figure 1F). Based on the known interactions between the FGF–FGFR system versus the GNA14 system, as described by a previous study (Zou et al., 2019), we inferred the underlying signaling context that a loss of the GNA14–GPCR system might activate the FGF–FGFR system in filaggrinHigh melanomas, and FGF signaling could further counteract interferon signaling (Jinesh et al., 2020; Maddaluno et al., 2020) to disable the Th1 cytotoxic module (Bradley et al., 1996) (Figure–1G).
As the known phenotypes were consistent with the gene network context, we carried out a detailed translation profiling of the filaggrinHigh melanomas using upregulated (Figure 1H) and downregulated (Figure 1I) genes in Enrichr and categorized the phenotypes into disease, tissues, co-expressed genes/products, genetic factors, microbes and immunity, and chemical drugs that potentially regulate these gene expression patterns to accentuate the potential causes of filaggrinHigh phenotypes.
In the upregulated gene signatures in filaggrinHigh melanomas, the disease set revealed multiple notable skin exfoliating ichthyosis conditions and palmoplantar keratoderma (Figure 1H). The tissues further indicated that not just the skin but also woolly hair, esophagus, auditory nerves, and epithelial cells lining the alimentary canal and reproductive tract-related signatures were affected in filaggrinHigh melanomas (Figure 1H). The genetic set implicates the X-chromosome involvement in the filaggrinHigh melanomas while corroborating with keratinization and deafness (keratitis–ichthyosis–deafness syndrome: KID syndrome) (Figure 1H). Microbes and immunity set indicates a vital clue that an aerobic actinomyces infection and associated defensin-β1 could be the dominant etiological cause, which could be complemented by human papillomavirus [HPV; and head and neck squamous cell carcinoma (HNSCC), which further suggests HPV, and staphylococcal signatures (Figure–1H). No single drug was found to influence the majority of the upregulated genes, as the genes influenced by individual drugs were approximately just one-fourth of the total upregulated genes, but could knock out crucial drivers (such as transcription factors) to have a broader impact (Figure 1H).
On the downregulated gene set side in filaggrinHigh melanomas, less pronounced gene enrichment was observed because fewer numbers of gene mRNAs were suppressed. However, these candidates were closely connected to lymphoid cell-mediated immunity, interferon-antisense, and so on (Figure 1I). The majority of other signature enrichments were only found to be influenced by a small set of genes despite significant scores, thus raising reliability issues; therefore, we listed those with a cautionary note (Figure 1I).
All these data, taken together show that a major change in FGF/FGFR versus GNA14/Th1 cytotoxic module gene expression underlies filaggrinHigh melanomas, which blends with allergic skin disease signatures, such as atopic dermatitis, alopecia, and ichthyosis, in addition to cell–cell contact, skin keratinization, and keratinocyte differentiation.
Discussion
Initial observations on the survival of melanoma patients stratified by filaggrin mRNA expression showed a significantly poorer survival in the filaggrinHigh group. However, overall survival of melanoma patients can be influenced by numerous factors other than melanoma itself due to the unusual time it often takes for the disease to progress. However, one possible cause could be that an impaired Th1 response could expose patients to more infections and reduce their survival.
Interestingly, filaggrins displayed significant methylation along with interferon signaling component targets and still displayed contrasting expression patterns at the mRNA level, where the interferon signaling targets were downregulated but the filaggrins were upregulated. This difference suggests that the levels of filaggrin mRNAs might be regulated either at the post-transcriptional level to have increased stability or at the transcriptional level by exposing the genomic loci in euchromatin regions compared to the interferon-related loci. Furthermore, the lack of distinctive mutations between the groups rules out the possibility of mutation-based nonsense-mediated decay. Further studies are required to understand this notion.
Using GSEA, we first ascertained that the known filaggrin-related gene signatures, such as those associated with atopic dermatitis, alopecia, and ichthyosis, are also evident in filaggrinHigh melanomas before carrying out detailed profiling and context inference. Based on GSEA, network analysis, and Enrichr profiling, we identified for the first time that upregulated FGF/FGFR, allergic signatures versus impaired GNA14, and Th1 signatures as the major changes in the context of filaggrinHigh melanomas. This is possibly because of the microbiome in the melanoma that includes Staphylococcus (Mekadim et al., 2022), which is known to suppress IFN-γ signaling and Th1 cell recruitment (Li et al., 2017) to evade the immune system (Frodermann et al., 2011). The FGF/FGFR system, on the other hand, cooperates with this context as it is also known to inhibit IFN-γ signaling (Adachi et al., 2022), and inhibiting the FGF/FGFR system is required to boost checkpoint inhibitor cancer immunotherapy (Ruan et al., 2023).
The immune checkpoint therapy in melanomas induces pruritus in melanomas (Salinas et al., 2021; Fischer et al., 2013), which explains in part why filaggrinHigh melanomas exhibit allergic signatures and suggest Th1 alterations. This allergic signature that is exhibited could be due to the microbiome involved in the melanomas. For example, melanomas are known to harbor discriminately abundant microbes, including Staphylococcus (Mekadim et al., 2022), which can produce IgE-inducing toxins (Bachert et al., 2020) and a protease-based allergic immune response (Krysko et al., 2019). Interestingly, this is similar to the allergic skin disease atopic dermatitis, where the lesions harbor discriminately abundant microbes, including Staphylococcus (Clausen et al., 2018). In support of our findings, histamine is known to inhibit interferon signaling in melanomas (Kanda and Watanabe, 2002), and checkpoint inhibition is known to induce a pruritic response in melanomas (Salinas et al., 2021; Fischer et al., 2013). Upregulation of defensins (DFNB1) further supports the involvement of microbes in pruritic melanomas.
Thus, for the first time, we identified a change in FGF/FGFR versus GNA14/Th1 signaling as the major underlying signaling context of filaggrinHigh melanomas, which can be further explored through clinical and experimental studies. Our detailed profiling of filaggrinHigh melanomas identifies additional potential causes of pruritic melanomas in the genetic (X-chromosome), microbial (bacteria and HPV), and immunological (Defensins) contexts.
Data availability statement
Publicly available datasets were analyzed in this study. These data can be found at TCGA: https://portal.gdc.cancer.gov/.
Author contributions
GJ: Conceptualization, Data curation, Formal analysis, Investigation, Methodology, Project administration, Resources, Software, Supervision, Validation, Visualization, Writing – original draft, Writing – review and editing. IG: Conceptualization, Data curation, Formal analysis, Investigation, Visualization, Writing – original draft, Writing – review and editing.
Funding
The author(s) declare that no financial support was received for the research and/or publication of this article.
Acknowledgments
The authors sincerely thank the TCGA network for the SKCM data. The results shown here are partly based upon data generated by the TCGA Research Network: https://www.cancer.gov/tcga.
Conflict of interest
The authors declare that the research was conducted in the absence of any commercial or financial relationships that could be construed as a potential conflict of interest.
Generative AI statement
The author(s) declare that no Generative AI was used in the creation of this manuscript.
Publisher’s note
All claims expressed in this article are solely those of the authors and do not necessarily represent those of their affiliated organizations, or those of the publisher, the editors and the reviewers. Any product that may be evaluated in this article, or claim that may be made by its manufacturer, is not guaranteed or endorsed by the publisher.
Supplementary material
The Supplementary Material for this article can be found online at: https://www.frontiersin.org/articles/10.3389/fgene.2025.1569403/full#supplementary-material
References
Adachi, Y., Kamiyama, H., Ichikawa, K., Fukushima, S., Ozawa, Y., Yamaguchi, S., et al. (2022). Inhibition of FGFR reactivates IFNγ signaling in tumor cells to enhance the combined antitumor activity of lenvatinib with Anti-PD-1 antibodies. Cancer Res. 82 (2), 292–306. doi:10.1158/0008-5472.CAN-20-2426
Adelanwa, A., Yousaf, A., Fang, W., and Kolodney, M. S. (2022). Common filaggrin gene loss-of-function variants are associated with skin cancer risk. J. Am. Acad. Dermatology 87 (2), 458–460. doi:10.1016/j.jaad.2021.09.068
Bachert, C., Humbert, M., Hanania, N. A., Zhang, N., Holgate, S., Buhl, R., et al. (2020). Staphylococcus aureus and its IgE-inducing enterotoxins in asthma: current knowledge. Eur. Respir. J. 55 (4), 1901592. doi:10.1183/13993003.01592-2019
Bradley, L. M., Dalton, D. K., and Croft, M. (1996). A direct role for IFN-gamma in regulation of Th1 cell development. J. Immunol. 157 (4), 1350–1358. doi:10.4049/jimmunol.157.4.1350
Cerami, E., Gao, J., Dogrusoz, U., Gross, B. E., Sumer, S. O., Aksoy, B. A., et al. (2012). The cBio cancer genomics portal: an open platform for exploring multidimensional cancer genomics data. Cancer Discov. 2 (5), 401–404. doi:10.1158/2159-8290.CD-12-0095
Chen, E. Y., Tan, C. M., Kou, Y., Duan, Q., Wang, Z., Meirelles, G. V., et al. (2013). Enrichr: interactive and collaborative HTML5 gene list enrichment analysis tool. BMC Bioinforma. 14 (1), 128. doi:10.1186/1471-2105-14-128
Clausen, M.-L., Agner, T., Lilje, B., Edslev, S. M., Johannesen, T. B., and Andersen, P. S. (2018). Association of disease severity with skin microbiome and filaggrin gene mutations in adult atopic dermatitis. JAMA Dermatol. 154 (3), 293–300. doi:10.1001/jamadermatol.2017.5440
Fischer, A., Rosen, A. C., Ensslin, C. J., Wu, S., and Lacouture, M. E. (2013). Pruritus to anticancer agents targeting the EGFR, BRAF, and CTLA-4. Dermatol Ther. 26 (2), 135–148. doi:10.1111/dth.12027
Frodermann, V., Chau, T. A., Sayedyahossein, S., Toth, J. M., Heinrichs, D. E., and Madrenas, J. (2011). A modulatory Interleukin-10 response to staphylococcal peptidoglycan prevents Th1/Th17 adaptive immunity to Staphylococcus aureus. J. Infect. Dis. 204 (2), 253–262. doi:10.1093/infdis/jir276
Gao, J., Aksoy, B. A., Dogrusoz, U., Dresdner, G., Gross, B., Sumer, S. O., et al. (2013). Integrative analysis of complex cancer genomics and clinical profiles using the cBioPortal. Sci. Signal 6 (269), pl1. doi:10.1126/scisignal.2004088
Irvine, A. D., McLean, W. H. I., and Leung, D. Y. M. (2011). Filaggrin mutations associated with skin and allergic diseases. N. Engl. J. Med. 365 (14), 1315–1327. doi:10.1056/NEJMra1011040
Jinesh, G. G., Flores, E. R., and Brohl, A. S. (2018). Chromosome 19 miRNA cluster and CEBPB expression specifically mark and potentially drive triple negative breast cancers. PLoS One. 13 (10), e0206008. doi:10.1371/journal.pone.0206008
Jinesh, G. G., and Kamat, A. M. (2017). The blebbishield emergency program overrides chromosomal instability and phagocytosis checkpoints in cancer stem cells. Cancer Res. 77 (22), 6144–6156. doi:10.1158/0008-5472.CAN-17-0522
Jinesh, G. G., Manyam, G. C., Mmeje, C. O., Baggerly, K. A., and Kamat, A. M. (2017). Surface PD-L1, E-cadherin, CD24, and VEGFR2 as markers of epithelial cancer stem cells associated with rapid tumorigenesis. Sci. Rep. 7 (1), 9602. doi:10.1038/s41598-017-08796-z
Jinesh, G. G., Napoli, M., Ackerman, H. D., Raulji, P. M., Montey, N., Flores, E. R., et al. (2020). Regulation of MYO18B mRNA by a network of C19MC miRNA-520G, IFN-gamma, CEBPB, p53 and bFGF in hepatocellular carcinoma. Sci. Rep. 10 (1), 12371. doi:10.1038/s41598-020-69179-5
Jinesh, G. G., Napoli, M., Smallin, M. T., Davis, A., Ackerman, H. D., Raulji, P., et al. (2021). Mutant p53s and chromosome 19 microRNA cluster overexpression regulate cancer testis antigen expression and cellular transformation in hepatocellular carcinoma. Sci. Rep. 11 (1), 12673. doi:10.1038/s41598-021-91924-7
Jinesh, G. G., Smallin, M. T., Mtchedlidze, N., Godwin, I., Napoli, M., Hackel, N., et al. (2024a). C19MC miRNA-520G induces SP100 antiviral gene transcription and inhibits melanin production in skin cutaneous melanoma. Genes Dis. 11 (1), 60–63. doi:10.1016/j.gendis.2023.02.047
Jinesh, G. G., Smallin, M. T., Mtchedlidze, N., Napoli, M., Lockhart, J. H., Flores, E. R., et al. (2024b). C19MC drives nucleolar invasion of mitochondria and meiotic nuclear division in human cancers. iScience 27 (11), 111132. doi:10.1016/j.isci.2024.111132
Kanda, N., and Watanabe, S. (2002). Histamine inhibits the production of interferon-induced protein of 10 kDa in human squamous cell carcinoma and melanoma. J. Invest Dermatol 119 (6), 1411–1419. doi:10.1046/j.1523-1747.2002.19627.x
Krysko, O., Teufelberger, A., Van Nevel, S., Krysko, D. V., and Bachert, C. (2019). Protease/antiprotease network in allergy: the role of Staphylococcus aureus protease-like proteins. Allergy 74 (11), 2077–2086. doi:10.1111/all.13783
Kuleshov, M. V., Jones, M. R., Rouillard, A. D., Fernandez, N. F., Duan, Q., Wang, Z., et al. (2016). Enrichr: a comprehensive gene set enrichment analysis web server 2016 update. Nucleic Acids Res. 44 (W1), W90–W97. doi:10.1093/nar/gkw377
Leick, K. M., Rodriguez, A. B., Melssen, M. M., Benamar, M., Lindsay, R. S., Eki, R., et al. (2019). The barrier molecules junction plakoglobin, filaggrin, and dystonin play roles in melanoma growth and angiogenesis. Ann. Surg. 270 (4), 712–722. doi:10.1097/SLA.0000000000003522
Li, Z., Levast, B., and Madrenas, J. (2017). Staphylococcus aureus downregulates IP-10 production and prevents Th1 cell recruitment. J. Immunol. 198 (5), 1865–1874. doi:10.4049/jimmunol.1601336
Maddaluno, L., Urwyler, C., Rauschendorfer, T., Meyer, M., Stefanova, D., Spörri, R., et al. (2020). Antagonism of interferon signaling by fibroblast growth factors promotes viral replication. EMBO Mol. Med. 12 (9), e11793. doi:10.15252/emmm.201911793
Mekadim, C., Skalnikova, H. K., Cizkova, J., Cizkova, V., Palanova, A., Horak, V., et al. (2022). Dysbiosis of skin microbiome and gut microbiome in melanoma progression. BMC Microbiol. 22 (1), 63. doi:10.1186/s12866-022-02458-5
Ruan, R., Li, L., Li, X., Huang, C., Zhang, Z., Zhong, H., et al. (2023). Unleashing the potential of combining FGFR inhibitor and immune checkpoint blockade for FGF/FGFR signaling in tumor microenvironment. Mol. Cancer 22 (1), 60. doi:10.1186/s12943-023-01761-7
Salinas, N., Nowak, E., Etienne, M., Legoupil, D., Fouchard, M., Brenaut, E., et al. (2021). Causes of pruritus in patients treated with immune checkpoint inhibitors for melanomas or skin carcinomas. Front. Med. (Lausanne) 8, 632683. doi:10.3389/fmed.2021.632683
Smith, F. J. D., Irvine, A. D., Terron-Kwiatkowski, A., Sandilands, A., Campbell, L. E., Zhao, Y., et al. (2006). Loss-of-function mutations in the gene encoding filaggrin cause ichthyosis vulgaris. Nat. Genet. 38 (3), 337–342. doi:10.1038/ng1743
Thyssen, J. P., Andersen, Y. M. F., Balslev, E., Szecsi, P. B., Stender, S., Kaae, J., et al. (2018). Loss-of-function mutations in filaggrin gene and malignant melanoma: a case–control study. J. Eur. Acad. Dermatology Venereol. 32 (2), 242–244. doi:10.1111/jdv.14532
Xie, Z., Bailey, A., Kuleshov, M. V., Clarke, D. J. B., Evangelista, J. E., Jenkins, S. L., et al. (2021). Gene set knowledge discovery with enrichr. Curr. Protoc. 1 (3), e90. doi:10.1002/cpz1.90
Yarwood, J. M., Leung, D. Y. M., and Schlievert, P. M. (2000). Evidence for the involvement of bacterial superantigens in psoriasis, atopic dermatitis, and kawasaki syndrome. FEMS Microbiol. Lett. 192 (1), 1–7. doi:10.1111/j.1574-6968.2000.tb09350.x
Zhou, G., Soufan, O., Ewald, J., Hancock, R. E. W., Basu, N., and Xia, J. (2019). NetworkAnalyst 3.0: a visual analytics platform for comprehensive gene expression profiling and meta-analysis. Nucleic Acids Res. 47, W234–W241. doi:10.1093/nar/gkz240
Keywords: filaggrin, pruritus, GNA14, IFN-γ, Th1 signaling, Staphylococcus, human papilloma virus
Citation: Jinesh GG and Godwin I (2025) FilaggrinHigh melanomas exhibit active FGFR and allergic signatures with impaired GNA14 and Th1 signatures. Front. Genet. 16:1569403. doi: 10.3389/fgene.2025.1569403
Received: 08 February 2025; Accepted: 27 June 2025;
Published: 18 July 2025.
Edited by:
Jin-Fen Xiao, University of Texas MD Anderson Cancer Center, United StatesReviewed by:
Baoyi Liu, China-Japan Friendship Hospital, ChinaRoberta Piras, Cedars Sinai Medical Center, United States
Copyright © 2025 Jinesh and Godwin. This is an open-access article distributed under the terms of the Creative Commons Attribution License (CC BY). The use, distribution or reproduction in other forums is permitted, provided the original author(s) and the copyright owner(s) are credited and that the original publication in this journal is cited, in accordance with accepted academic practice. No use, distribution or reproduction is permitted which does not comply with these terms.
*Correspondence: Goodwin G. Jinesh, Z29vZHdpbmppbmVzaEBnbWFpbC5jb20=
†Present address: Isha Godwin, Department of Cardiothoracic Surgery, Royal Brompton Hospital, London, United Kingdom
‡These authors share first authorship