 Bruna Santana
 Yniv Palti
 Guangtu Gao2
 Kyle E. Martin
 Breno O. Fragomeni
- 1Animal Genomics Laboratory, Department of Animal Science, University of Connecticut, Storrs, CT, United States
- 2National Center for Cool and Cold Water Aquaculture, United States Department of Agriculture, Agricultural Research Service, Leetown, WV, United States
- 3Hendrix Genetics, Sumner, WA, United States
Bacterial cold-water disease (BCWD) outbreaks in salmonid aquaculture have resulted in significant losses in commercial populations. Currently, there is no commercially available vaccine for the disease caused by Flavobacterium psychrophilum. BCWD resistance in rainbow trout exhibits moderate heritability and has been the focus of selection efforts. The understanding of key genomic regions associated with BCWD resistance has advanced since the integration of genomic information into genetic evaluations, proving successful in enhancing BCWD resistance in some commercial lines. Here, we report the results of a genome-wide association study for BCWD resistance in an important commercial rainbow trout line to further our understanding of the genetic architecture of the trait and infer a selective breeding strategy for this line. Different scenarios were tested, including the use of all single-nucleotide polymorphisms (SNPs) passing quality control, removal of SNPs with major effect, elimination of consistent “major SNPs” in subgroups of the population, and exclusion of SNPs within haplotypes with major effect. Prediction accuracy was evaluated with different SNP weighting strategies, utilizing cross-validation groups formed either randomly or based on principal components and cluster analyses of genotypic data. Comparative analysis of cross-validation methods suggested that partitioning of the dataset using K-means clustering reduced overfitting. The incorporation of SNP weighting further confirmed the oligogenic nature of the trait under investigation. Prediction accuracy with pedigree-based best linear unbiased prediction (PBLUP) was 0.27 and increased to 0.36 with genomic information. The accuracy obtained with a single largest effect haplotype was 0.23. Moreover, a decrease in accuracy was observed upon excluding major SNPs and haplotypes, providing supplementary evidence of their importance on phenotypes. The two largest association peaks on OmyA31/Omy25 and Omy8 were consistent with previous reports.
1 Introduction
Bacterial cold-water disease (BCWD) outbreaks in salmonid aquaculture lead to morbidity (Madsen and Dalsgaard, 1999; Nilsen et al., 2011) and high mortality rates across populations (Dalsgaard and Madsen, 2000; Nematollahi et al., 2003; Loch and Faisal, 2015). The disease is caused by a treatable bacterium, Flavobacterium psychrophilum. However, the use of antibiotics may increase production costs, environmental build-up, and promote the selection of pathogen strains that may be resistant to antibiotics. Vaccination is another form of addressing the issue by improving the protection of immunocompetent fish (Hoare et al., 2017; 2019). However, at present, there is no commercially available vaccine for BCWD (Vallejo et al., 2022). Genomic selection has been proved successful in substantially improving BCWD resistance in rainbow trout, and for this reason, it has been adopted for commercial implementation (Vallejo R. et al., 2017; 2018). In recent years, following the development of improved genome resources for rainbow trout (Palti et al., 2015b; Gao et al., 2021), many more reports have been published from a variety of labs reporting on the use of genome-wide association studies and the use of genomic-enabled predictions for selection in resistance to other pathogens and for other important aquaculture production traits (Ali et al., 2019; Reis Neto et al., 2019; Silva et al., 2019; Yoshida et al., 2018; Ahmed et al., 2022; Calboli et al., 2022; Fraslin et al., 2022; 2023; Garcia et al., 2023; Kudinov et al., 2024; Palti et al., 2024).
Typical statistical approaches in genomic selection often assume every locus to have influence over complex traits (Meuwissen et al., 2001; VanRaden, 2008; Aguilar et al., 2010). This assumption is suitable for polygenic traits (Santana et al., 2023) and large data sets (Lourenco et al., 2017). However, there are scenarios when using variable selection methods (Mehrban et al., 2017) or an SNP weighting approach (Vallejo et al., 2019) will lead to higher accuracies. By assigning weights to single-nucleotide polymorphisms (SNPs) during the construction of the genomic relationship matrix, it is possible to ease the assumption that all markers have a uniform contribution to the phenotypic expression (VanRaden, 2008). Alternative assumptions in terms of the distribution of the markers’ effects were beneficial for accounting for particular genetic architectures, especially for oligogenic traits (Wang et al., 2012; Zhang et al., 2016; Fragomeni et al., 2017, 2019; Lourenco et al., 2017).
Genomic regions identified as significant for BCWD have been consistent across studies in rainbow trout. Two major quantitative trait loci (QTL) on chromosomes Omy08 and Omy25 were shown to explain more than 10% of the additive genetic variance for BCWD resistance (Liu et al., 2018; Vallejo R. L. et al., 2017). Furthermore, a QTL on Omy25 was validated in an independent population, and individuals carrying the favorable allele exhibited a significantly higher survival rate (Mathiessen et al., 2023). Important associations identified in genome-wide association studies (GWAS) are not expected to change drastically over several generations in a population until recombination can start to break down the association between genetic markers and the causative QTL variant. Additionally, exceptions might occur when divergent individuals are introduced into the population (Uffelmann et al., 2021), in polygenic traits (Fragomeni et al., 2014), or due to allele fixation (Muir et al., 2008).
Troutlodge, Inc., the largest distributor of rainbow trout eggs in the United States and worldwide, maintains a year-round production of eggs using four distinct broodstock lines, with peak spawning in February, May, August, and November. Phylogenetic analyses based on genotypes from 96 Fluidigm SNP assays indicated that all four lines are genetically distinct (Liu et al., 2017). Previously, we identified two significant QTL for BCWD resistance on chromosomes Omy08 and Omy25p_OmyA31 in the May spawning line (Vallejo R. L. et al., 2017), which have been shown to be effective in a marker-assisted selection (MAS) breeding strategy in that line (Liu et al., 2018; 2022).
Genome-wide association studies (GWAS) may be adopted to elucidate a trait’s genetic architecture (Goddard et al., 2016). As a consequence, they may provide better insights about assumptions of SNP effect’s distribution, and additionally, be used to improve SNP array design (Moghaddar et al., 2022), target genomic regions for gene editing (Lee and Fidock, 2014), inform drug development programs (Uffelmann et al., 2021), and for MAS (Liu et al., 2018).
In the present study, we conducted genomic analyses in the Troutlodge February spawning nucleus breeding population, which represents a distinct genetic line that is equally important to the U.S. aquaculture industry as the previously studied Troutlodge May line. Hence, the objective of this study was to perform GWAS for BCWD resistance in this distinct and commercially important rainbow trout line while adopting distinct approaches to compute SNP effects, methods to validate major SNPs, and identify haplotypes associated with the trait. Additionally, this study aimed to predict accuracy when different SNP weighting strategies were adopted to elucidate the most effective selective breeding strategy for this commercial rainbow trout line.
2 Materials and methods
2.1 Ethics statement
This study used rainbow trout fin clips collected after controlled infection with Flavobacterium psychrophilum (Fp) at the Center for Aquaculture Technology (CAT) research facility (Souris, PE, Canada) as part of the Troutlodge, Inc., selective breeding program. As farm animals used in a commercial breeding program, these fish are exempt from regulation under the U.S. Animal Welfare Act and, therefore, not subject to oversight by an Institutional Animal Care and Use Committee or other such ethics committee. This exemption is defined in U.S. Code title 7, chapter 54, section 2132g. However, experimentation and handling were conducted in accordance with U.S. government principles for the use and care of vertebrate animals used in testing, research, and training, which include provisions to minimize animal suffering. Specific measures for amelioration of animal suffering during the fish pathogen testing included minimization of handling and maintenance of optimal water temperature and oxygen saturation; additionally, the fish were fed a standard fish meal diet to satiation daily. Fish near death from severe symptoms of infection during the observation period were removed and terminated (by immersion in a lethal dose of MS-222) before the collection of fin tissue to minimize suffering. After the 24-day observation period, surviving fish were terminated by immersion in a lethal dose of 500 mg/L of MS-222 for 30 min before sampling and disposal.
2.2 Fish rearing and disease challenge
Equal volumes of ∼30 eyed eggs per full-sib (FS) family from 148 families were pooled randomly at the Troutlodge hatchery facility in Sumner, Washington, United States, and shipped overnight to the research facility of the Center for Aquaculture Technologies in Canada (Souris, PE). Throughout all phases of the study, water was maintained with 90%–130% oxygen saturation. Flow through freshwater maintained at 8 °C with a daily fluctuation of ±1 °C was used during the egg incubation and hatching phases. Heath stacks remained covered throughout incubation, and dead eggs were removed daily. Once yolk sacs were absorbed, fry were transferred to larger holding units and were held under a 24-h light photoperiod in recirculating 12 °C ± 1 °C freshwater, at flow rates set to allow for adequate flushing/waste removal and maintenance of environmental parameters. The fish were fed to satiation twice daily. At 80 days post hatching, equal numbers of fry were divided to three replicate tanks for the BCWD challenge and 24-day survival trial. Average body weight on the first day of the disease challenge was 1.52 g with a standard deviation of ±0.44 g. The disease challenge protocol developed by the USDA-ARS group from Leetown, WV, United States (Silverstein et al., 2009; Leeds et al., 2010), was followed in this study. Fish within a respective holding tank were grouped into cohorts of N = 50 and anesthetized via immersion prior to being intraperitoneally (IP) injected with 0.1 mL of PBS with the F. psychrophilum bacterial strain CSF-295-93 (4.7 × 10⁶ CFU/fish). This is a pathogenic strain of the bacteria that has been shown to cause consistent mortality in the lab challenge model, with a strong correlation with survival performance after outbreaks in the field. The strain was isolated by Dr. Scott LaPatra in 1993 from a farm outbreak in Idaho, United States. It was used to derive a live attenuated vaccine and has been characterized biologically and immunologically (Lafrentz et al., 2007; Lafrentz et al., 2009; Lafrentz et al., 2011; Sudheesh et al., 2007). The genome of this strain was sequenced and characterized by Wiens et al. (2014). The bacterial strain isolate, with specific storage conditions and culture know-how information, can be obtained upon request and appropriate arrangements for research material transfer from the corresponding author. The injection process took approximately 2 h per holding tank, or 6–7 h in total. Once injected, fish were placed in their respective holding tank for recovery and observation. The sham control group included two random cohorts, each composed of 50 fish from the pool of 148 families that were injected with PBS and kept at similar density and water conditions to the larger three replicate tanks with the bacteria-injected fish throughout the 24-day survival trial. No mortalities were observed in the sham control group. Fish welfare checks were performed twice daily during the growth phase from hatching to day 80 post hatching and following the disease challenge. Dead and moribund fish were removed, recorded, and fin clip samples were taken from the removed fish daily during the 24-day survival trial following the disease challenge. Fin clips from the sampled fish were stored individually in 95% ethanol at room temperature for up to 2 months until DNA extractions.
The dose used in the injections was identified empirically to accomplish an approximately 50% survival rate per tank, which is the typical goal of disease resistance studies that aim to maximize phenotypic diversity in order to exploit the genetic diversity in the population. Previous work by the USDA group has shown that for Fp infection to induce BCWD in rainbow trout, the IP injection model provided the most consistent results across challenges, populations and over time and that significant response to selection using the lab IP model corresponded with significant improvement in survival after disease outbreaks in the field (Silverstein et al., 2009; Leeds et al., 2010; Wiens et al., 2013a; Wiens et al., 2018). It has also been a very successful model for detecting QTL and for developing genomic selection predictions with very good accuracy (Vallejo et al., 2022; Liu et al., 2022; Vallejo et al., 2018; Vallejo R. et al., 2017) and has been used to analyze gene expression responses to infection in the host (Marancik et al., 2015; Wiens et al., 2023).
2.3 Data
Phenotypic data for days to death (DAYS) were collected from 3,784 rainbow trout fish. The number of fish with survival phenotype data collected from tanks C1, C2, and C3 were 1,279, 1,210, and 1,295, respectively. DAYS is a discrete variable representing the number of post-challenge days survived in a period of 24 days. All survivors at the end of the challenge were assigned the phenotype of 24 days. A total of 3,784 DAYS records were collected, with an average value of 16.32 and a standard deviation (SD) of 7.68. The average (SD) DAYS per tank were 16.86 (7.59), 16.29 (7.75), and 15.84 (7.69). There were no significant differences between tanks 1 and 2 (p > 0.05), and tank 3 was significantly different from the other two tanks (p < 0.05) with a difference of 1.02 DAYS according to two-sample t-tests. Therefore, comparisons between outcomes from models with and without the tank effect were conducted and will be included in the next section. The fish with phenotypes were assigned to 141 full-sib families using a low-density SNP array following previously described methods (Liu et al., 2016; Vallejo et al., 2022). The median number of fish per family was 28, with an average of 26.8, a minimum of 1, and a maximum of 38. The overall pedigree file contained 6,658 individuals spanning over 12 generations.
A total of 2,121 fish from 141 families were genotyped by a commercial genotyping service provider (Center for Aquaculture Technologies, San Diego, CA) using the rainbow trout 57K Axiom Genotyping SNP Array 384-well format (Thermo Fisher Scientific catalog number 550571) (Palti et al., 2015a). Genotype calls were done by the authors using the Affymetrix Array Power Tools kit for the rainbow trout Axiom array, followed by bioinformatics processing of the data for quality control (QC) and formatting for the BLUPF90 analysis using standard methods as previously described (Palti et al. 2015a; Vallejo R. et al., 2017). Of the genotyped animals, 1,897 had phenotypic records with a mean of 16.28 DAYS and a standard deviation of 8.28. A total of 1,231, 224, and 442 individuals were genotyped from tanks C1, C2, and C3, respectively. All the animals with phenotypes from tank C1 were genotyped. The animals genotyped from tanks C2 and C3 were selected from families of greater importance for the breeding program due to high genetic merit predictions for other production traits. The remaining 224 genotyped animals had no phenotype records and were the ancestors of the individuals in the challenge.
A total of 36,676 SNP markers passed QC filtering. The dataset of filtered markers provided good coverage for all 32 chromosomes in the reference rainbow trout genome. During QC, samples and markers with a call rate of less than 0.90 or with 10% or more Mendelian conflicts were removed. Additionally, markers with minor allele frequency (MAF) less than 0.05 were also removed. Finally, markers from unplaced contigs and the mitochondria were excluded from the analysis.
2.4 Model and analyses
Pedigree and genomic breeding values (estimated breeding values (EBV) and genomic estimated breeding values (GEBV), respectively) for DAYS were calculated from the following linear model (Equation 1):
where
In a second model, potential predominant haplotype(s), which would be closely aligned with a specified major SNP identified in GWAS, were incorporated as an additional fixed effect as a covariate. Details of the haplotype identification process are provided in Section 2.6. Model 2 (Equation 2) had a fixed effect that distinguishes groups based on the presence of none, one, or two haplotype copies of the highly associated haplotype(s), and W is the incidence matrix for the
In Model 2, the variance explained by the detected haplotype was computed to account for changes in the additive genetic variance due to the inclusion of the haplotype effects:
The assumption of the variances of the random effects was
where
where
where M is a matrix of gene content, centered on the allele frequencies that are obtained from the entire genotyped population being evaluated,
The variance components analyses were performed with PBLUP and ssGBLUP under an AIREML approach for DAYS with Model 1. Breeding values were calculated by solving the system of equations using the variance components calculated in the previous step. All computations were performed using BLUPF90+ software (Misztal et al., 2015).
An additional model was tested, similar to Model 1, but without the fixed effect of the tank from which the fish were reared as a fixed effect with values ranging from 1 to 3. This model utilized complete phenotypic records under ssGBLUP. The GEBVs calculated under this model scenario correlated at 0.99 with those from Model 1. Therefore, only results from Model 1 without the tank effect are reported because there may be a risk of a confounding effect between genetics and tank.
2.5 Cross validation for predictive ability
Predictive ability was defined as the correlation between predicted and observed phenotype (Legarra et al., 2008) and was estimated using cross validation. The observed phenotypes were corrected by subtracting the fixed effects calculated in a preliminary run with complete data (Lourenco et al., 2015). The estimated breeding values (EBV) and genomic estimated breeding values (GEBV) were estimators of the phenotypes.
In an initial approach, genotyped animals were randomly assigned to five groups of equal size. In each cross-validation round, four of the groups were included in a training set and the one remaining group was used for validation. This step was repeated five times, so all genotyped fish would be included in the validation group once. The validation group’s phenotypes were masked and not used in the (g)EBVs computation. Full pedigree and genomic data were used for all animals. Fish without genotypes had their phenotypes included in the training groups. Predictive ability was the average correlation between corrected phenotypes and (g)EBV for the validation fish across the five random groups. Additionally, the regression coefficient (b1) of the corrected phenotype on the (g)EBVs was used to verify inflation (b1 > 1) or deflation (b1 < 1) of predictions.
In a second scenario, fish with identified genotypes were assigned to groups according to their genomic relationships based on principal components and K-means clustering of the genotypic data (Saatchi et al., 2011). K-means clustering is an algorithm used to group similar data points into clusters. In this study, it was used to generate groups of samples for cross validation compared to random grouping. Individuals exhibiting greater genetic similarity were grouped together. The training and validation procedures were similar to the previous approach, where four groups were in the training group and one was in the validation set each time. Similarly, ungenotyped fish with phenotypic information were included in the training groups. The numbers of records or genotypes for the cross-validation groups are presented in Table 1.
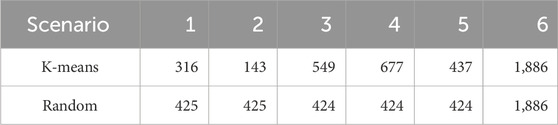
Table 1. Numbers of fish per cross-validation group for two scenarios. Group 6 is composed of the non-genotyped samples, which were included in the training set in all cases.
2.6 Haplotype identification and model inclusion
Haplotypes were identified with findhap.f90 version 3 (VanRaden et al., 2013). The program initially processes the haplotypes of close ancestors from the oldest to the youngest individuals. Genotypes are phased into haplotypes based on either ancestor haplotypes or the most common non-conflicting haplotype (VanRaden et al., 2015). Haplotypes of varying lengths were utilized as priors and to identify the ideal parameters (results not shown). The haplotypes were identified by checking segments between 20 and 2000 SNPs, and the maximum number of haplotypes allowed was 5000. The rate of miscalled genotypes allowed when matching haplotypes was 0.004. The haplotyping process was conducted over four iterations. The values used were based on preliminary runs and on the software-recommended values. The following options were used in findhap.f90: iters = 4, maxlen = 2000, minlen = 20, steps = 3, maxhap = 5000, and errate = 0.004.
Additionally, a simple linear model that included the intercept and the main haplotype effect was tested. This model differs from Model 2 as it does not include the random additive genetic effect. Moreover, in this model, the haplotype effect was tested as both a covariate and a categorical effect. Finally, the results of this linear model were summed to the PBLUP breeding values to mimic a marker-assisted selection with a single marker.
2.7 Genome-wide association analysis
The current rainbow trout reference genome (Gao et al., 2021) was used for the GWAS. The SNP effects were calculated based on the ssGBLUP solutions using a back-solving process derived by Wang et al. (2012), based on formulas provided by VanRaden (2008) and Strandén and Garrick (2009):
where
Then,
where
GWAS was performed using Model 1 and Model 2. The percentages of variance explained by windows of 10 adjacent SNPs were used for the Manhattan plots. They were calculated by summing the SNP individual variances and then dividing this value by the total additive genetic variance using software POSTGSF90 (Aguilar et al., 2014). Additionally, accuracy was calculated with alternative SNP arrays based on GWAS results: 1) All SNPs that passed quality control “Total SNP”; 2) removal of SNPs explaining more than 0.5% of the additive genetic variance; this scenario is referred to as “Minus Major SNP”; 3) removal of SNPs that explained more than 2% of the additive genetic variance and were consistent in all K-means cross-validation groups; this scenario is referred to as “Minus Common SNP”; 4) removal of SNPs within major haplotypes; this scenario is referred to as “Minus Haplotype.” The thresholds used for the SNP deletion were determined based on visual inspection of Manhattan plots. Normalized relationship matrices were obtained with average diagonal coefficients set to 1 for scenarios with additional exclusion of SNPs after quality control.
3 Results
3.1 BCWD survival phenotypes
Survival records were obtained from a total of 3,784 fish across three replicate tanks with slightly fewer than 1,300 fish per tank. Mortality with clinical signs of bacterial cold-water disease was first observed on day 5 of the challenge. The mortality kinetics were nearly identical across the three tanks, with peak mortality days between days 6 and 14 of the post-challenge survival trial. Mortality rate plateaued from day 16, reaching a cumulative mortality rate of ∼50%, and the last mortality was recorded on day 23 (Figure 1). Fish that survived to day 24 of the post-challenge survival trial were recorded as alive at the end of the trial. Average mortality rate per replicate tank was ∼55% with higher mortality observed in tank 3 (Figure 2). Survival days data were also recorded, with an average value of 16.32 days and an SD of 7.68. Fish that were alive at the end of the trial were assigned a survival days value of 24. The averages (SD) per tank were 16.86 (7.59), 16.29 (7.75), and 15.84 (7.69). There were no significant differences in survival days between tanks 1 and 2 (p > 0.05), and tank 3 was significantly different from the other two tanks (p < 0.05).
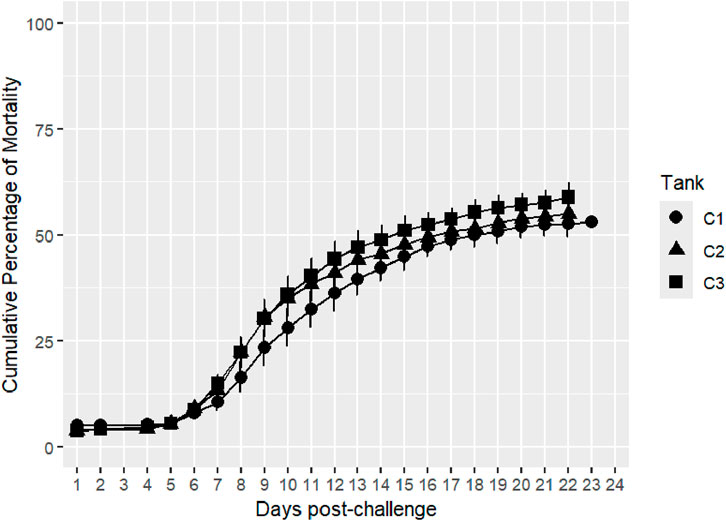
Figure 1. Distribution of daily mortality post-challenge in the commercial rainbow trout line. The bars represent the standard deviation (SD) between tanks.
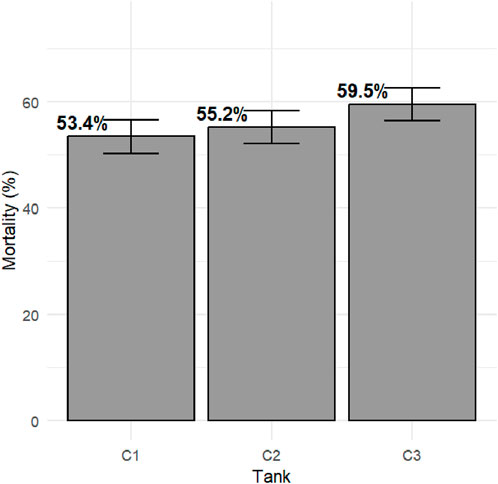
Figure 2. Total mortality post-challenge in the commercial rainbow trout line. The bars represent standard error (SE) between tanks.
3.2 Variance components
Estimates of heritability are presented in Table 2. The heritability (SE) with PBLUP was 0.39 (0.05), and for ssGBLUP, the values were 0.30 (0.03) and 0.15 (0.04), using Model 1 and Model 2, respectively. The incorporation of haplotype copies as a fixed effect and the elimination of a major haplotype from the SNP panel caused the additive genetic variance of the trait to decline. The variance of the haplotype was 3.38, which would result in a heritability of 0.19 when that variance is incorporated into the genetic variance.

Table 2. Genetic parameter estimates for BCWD survival status in the rainbow trout February spawning commercial line of Troutlodge from the 2020 year class. 2020 with different statistical approaches, including the genetic additive variance component (σa), residual component (σe), haplotype effect (Hap22pq), heritability (h2), and standard error (se).
3.3 SNPs and haplotypes associated with BCWD resistance
Manhattan plots containing GWAS outcomes from scenarios with complete data are reported in Figures 3–5. The quantitative trait loci associated with BCWD resistance are reported as the SNP window explaining more than 2% of the genetic variance (Tables 3, 4).
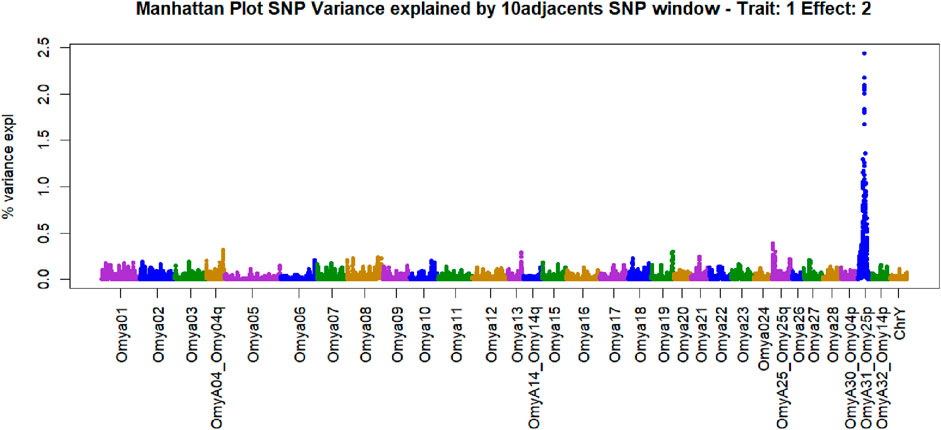
Figure 3. Manhattan plot of genome-wide association studies for resistance to bacterial cold-water disease in the 2020 year class of the February spawning commercial line of rainbow trout with ssGBLUP.
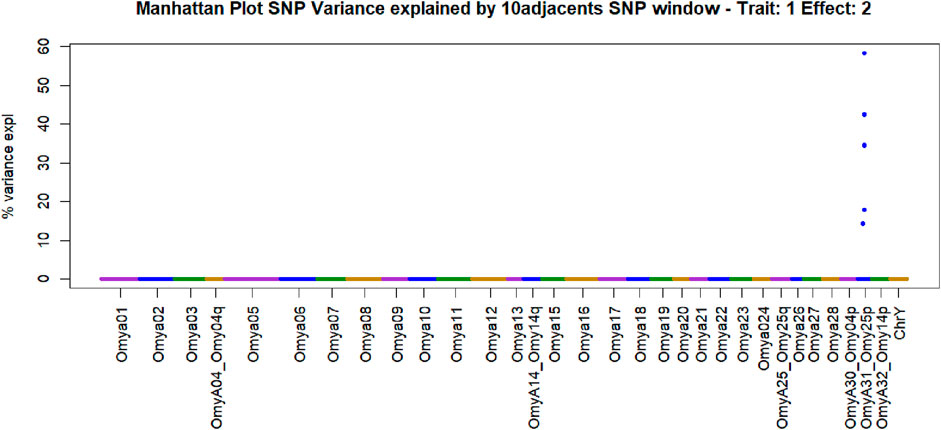
Figure 4. Manhattan plot of genome-wide association studies for resistance to bacterial cold-water disease in the 2020 year class of the February spawning commercial line of rainbow trout with weighted ssGBLUP under the NonlinearA weighting approach with a constant value of 2 and a limit of 50 from Iteration 10.
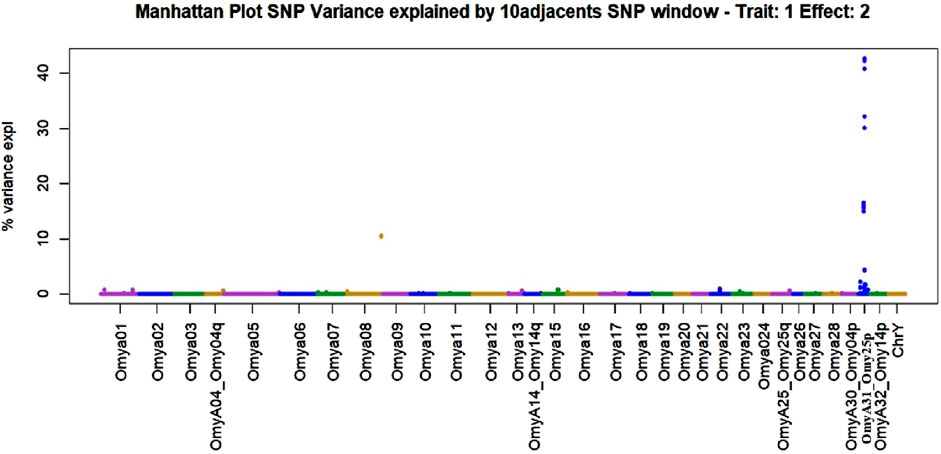
Figure 5. Manhattan plot of genome-wide association studies for resistance to bacterial cold-water disease in the 2020 year class of the February spawning commercial line of rainbow trout with weighted ssGBLUP under quadratic weights from Iteration 3. The model that generated this plot contained the fixed effect of haplotype (Model 2).
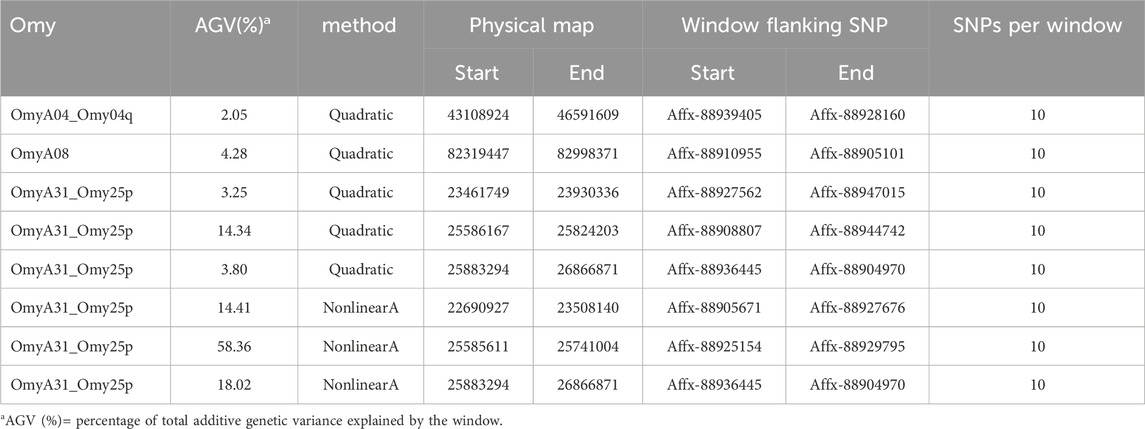
Table 3. Quantitative trait loci associated with bacterial cold-water disease resistance in the 2020 year class of the February spawning commercial line of rainbow trout using the complete dataset with NonlinearA weighting (constant = 2, limit = 50) for the 10th iteration with Model 1.
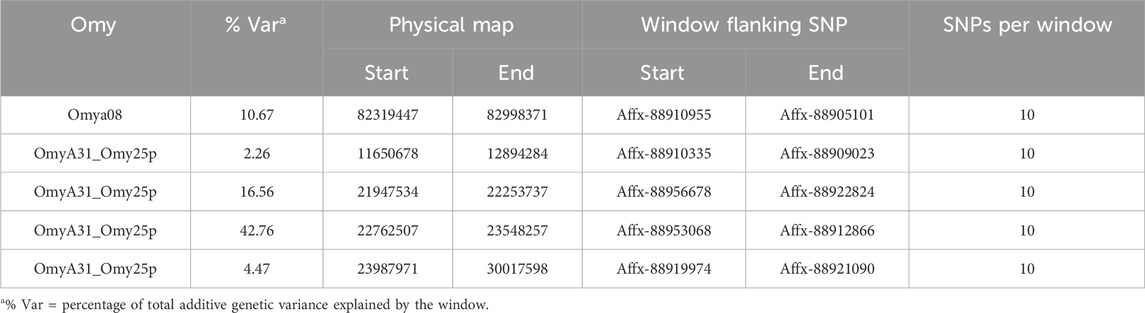
Table 4. Quantitative trait loci associated with bacterial cold-water disease resistance in the 2020 year class of the February spawning commercial line of rainbow trout using the complete dataset with quadratic weighting for the third iteration with Model 2 (haplotype model).
The SNPs removed from the “Total SNP” dataset to create the “Minus Common SNP” scenario were found in every chromosome except Omya16 and Omya24. In contrast, the SNPs removed to establish the “Minus Major SNP” scenario were specifically located in the OmyA31_Omy25p QTL region.
One haplotype was detected in the genomic regions highly associated with the trait. This haplotype had 19 SNPs, and its first SNP (Affx-88926696) was at position 25217123 bp on OmyA31_Omy25p chromosome, while the last SNP (Affx-88929795) was located on the same chromosome at position 25741004. The frequency of this “dominant haplotype” was 28.34%. Additionally, this haplotype was incorporated as a fixed effect in Model 2.
3.4 Accuracy and inflation for different validation approaches
The PBLUP approach with random cross validation yielded a prediction accuracy average (standard deviation) of 0.27 (0.03). With the K-means cross validation, the average PBLUP prediction accuracy was 0.26 (0.03). Prediction accuracy increased by 0.04 (15%) from PBLUP to ssGBLUP with the K-means validation and by 0.06 (22%) with random cross validation (Figure 6). The SNP weighting approaches increased accuracy gains up to a value of 0.36, which was 33% improvement over PBLUP with random cross validation and 38% over PBLUP with K-means cross validation (Figures 6–9).

Figure 6. Accuracy expressed as the correlation between the (g)EBVs and corrected phenotypes and the regression coefficient of the corrected phenotype on the (g)EBVs (bias) for two 5-fold cross-validation scenarios (random and K-means) with Model 1 under weighted ssGBLUP performed for three iterations when using genomic information with the quadratic weighting approach. The values were averaged across the five replicates, and the error bars represent the standard deviations.
The outcomes from the cross-validation scenarios using the quadratic weighting approach are illustrated in Figure 6, revealing a consistent pattern of lower accuracy in K-means validation than random cross validation. The accuracy increased from single-step GBLUP (ssGBLUP) to weighted single-step GBLUP (WssGBLUP) from 0.33 to 0.36 for the random cross validation with quadratic weighting, while for the K-means cross validation with quadratic weighting, accuracy improved from 0.30 to 0.33 (Figure 6). The constant 2 under the NonlinearA scenario caused accuracies to increase from 0.30 (ssGBLUP) to 0.35 (wssGBLUP) (Figure 8). Removing the haplotype from the G in Model 2 led to a substantial accuracy loss, which was partially recovered when weighting G (Figure 7). In the scenario where the haplotype effect was added to the GEBVs, the accuracy with ssGBLUP was 0.28, while the accuracy with wssGBLUP was 0.31.

Figure 7. Accuracy expressed as the correlation between the (g)EBVs and corrected phenotypes and regression coefficient of the corrected phenotype on the (g)EBVs (bias) for two 5-fold cross-validation scenarios with K-means clustering under Model 2 under weighted ssGBLUP performed for three iterations when using genomic information with the quadratic weighting approach. The haplotype effect is added to (g)EBVs without the haplotype effect (A) and with the haplotype effect (B). The values were averaged across the five replicates, and the error bars represent the standard deviations.
The prediction accuracy of the haplotype effects alone was 0.23, which approaches the accuracy achieved with PBLUP. In this validation, one of the K-means groups presented a correlation of 0.83, due to a shift in haplotype frequency. This group was removed from the calculations in this scenario. When adding the haplotype effects to the PBLUP prediction, the accuracy increased to 0.3, which is similar to the results obtained with the entire SNP chip. The effect of carrying zero, one, or two copies of the haplotype was −1.34, −3.81, and +3.1 survival days, respectively. Surprisingly, the effect of this haplotype is not additive because having one copy resulted in lower survival than having no copies. This response may be due to the distribution of the other haplotypes in the QTL region, which, despite their lower frequency, do have varying effect levels on the survival phenotype.
Under PBLUP, the b1 for the random cross validation and K-means was 0.79 with both approaches and a standard deviation of 0.08 and 0.05, respectively. Additional values of b1 for the distinct approaches are reported in Figures 6–9. The GEBVs were inflated (b1 less than 1) for PBLUP (b1 = 0.79, sd = 0.09), and ssGBLUP with quadratic weighting further increased the inflation of GEBV (Figure 8). Including the haplotype effect in Model 2 resulted in less inflated GEBVs (b1 = 0.95) (Figure 7). NonlinearA with a constant of 2 and a limit of 50 significantly reduced inflation, converging on 0.97 when calculated with the K-means approach (Figure 8).

Figure 8. Accuracy expressed as the correlation between the (g)EBVs and corrected phenotypes and regression coefficient of the corrected phenotype on the (g)EBVs (bias) for two 5-fold cross-validation scenarios with K-means clustering under ssGBLUP under the nonlinear approach adopted with a constant value of 1.125, 1.15, and 2, with limits of 50 (A) and 10 (B) for ten iterations. The values were averaged across the five replicates, and the error bars represent the standard deviations.
3.5 Accuracy and bias when excluding SNPs
When excluding “Major SNP” explaining more than 0.5% of the additive genetic variance from the genotypic file, the accuracy of prediction achieved with ssGBLUP decreased by 0.05 compared to when all markers are considered (Figure 7). In the same scenario, SNP weighting caused accuracy to decrease when using the constant and limit of 2 and 50, respectively. When more conservative parameters were used, the decrease in accuracy was less accentuated. To test whether the loss in accuracy was due to the reduction in panel density, one additional scenario in which 251 SNPs were randomly excluded was tested, and no impact on accuracy was observed (Results not shown).
After removing the “Common SNP,” there was a noticeable decrease in accuracy under NonlinearA with a constant of 2 and a limit of 50. The values from the last iteration ranged from 0.35 when all SNPs were included (Figure 8) to 0.12 after the elimination of the common SNPs (Figure 9) and to 0.21 after excluding major SNPs. When the approach was NonlinearA with a constant of 1.125 and a limit of 10, the initial decrease reported in Iteration 1 was compensated for when convergence was achieved.
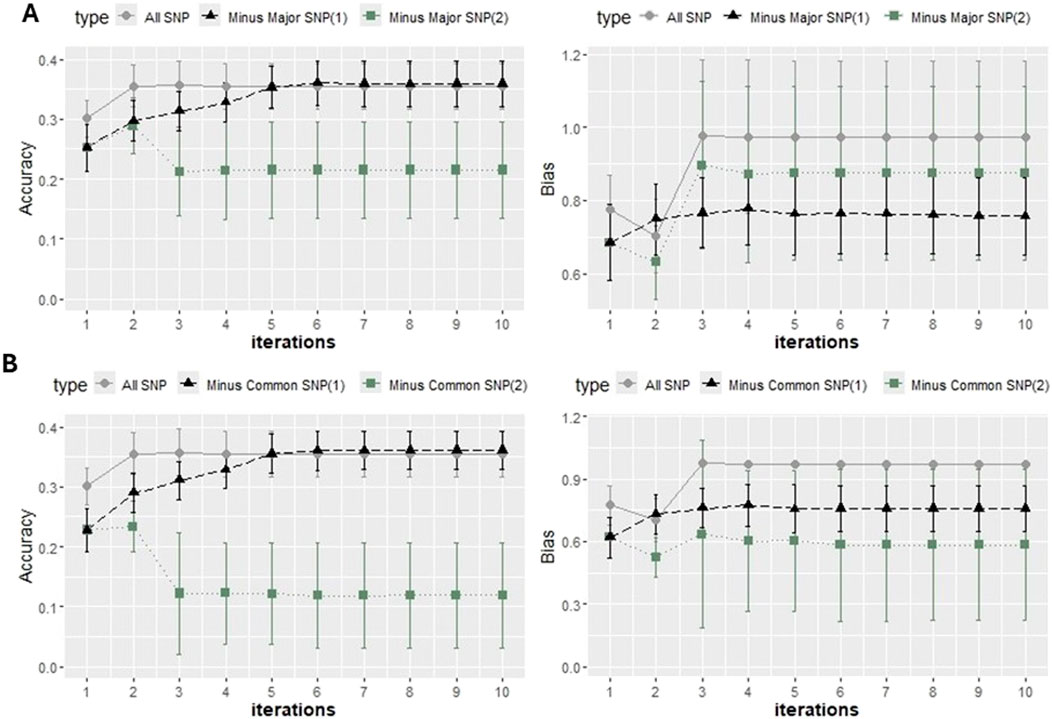
Figure 9. Accuracy expressed as the correlation between the (g)EBVs and corrected phenotypes and regression coefficient of the corrected phenotype on the (g)EBVs (bias) with two 5-fold cross-validation scenarios using K-means clustering under ssGBLUP with the NonlinearA approach adopted with a constant value of 1.125 and a limit of 10 (A) and a constant value of 2 and a limit of 50 (B). All SNPs for the genotypic file included all markers after quality control. “Minus Major SNP” identifies that major SNPs were removed (−251 SNPs), and Minus Common SNP identifies that common SNPs were removed (−397 SNPs). The values were averaged across the five replicates, and the error bars represent the standard deviations.
4 Discussion
Previously, we identified two significant QTL for BCWD resistance on chromosomes Omy08 and Omy25p_OmyA31 in the Troutlodge May spawning line (Vallejo R. L. et al., 2017; 2022), which have been shown to be effective in a marker-assisted selection (MAS) breeding strategy in that line (Liu et al., 2018; 2022). For simplicity, we will refer to Omy25p_OmyA31 as OmyA31 for this discussion. In this study, we confirmed that the QTL located in the same genome regions on OmyA31 and Omy08 also exist in the genetically distinct February spawning line of Troutlodge, Inc. The OmyA31 QTL was found to have a larger effect on resistance to BCWD than the Omy08 QTL, and it has a dominant haplotype with possible implications for use in MAS in this commercially important rainbow trout line. Candidate genes co-located in this QTL genomic region were previously identified and implicated (Liu et al., 2022; Vallejo et al., 2022). Further analyses combining data from the two aquaculture populations are currently underway, aiming to further refine the QTL region in an attempt to pinpoint the causative gene and causative DNA sequence variant or variants.
Statistical and computational methods were applied to investigate the genetic basis of resistance to BCWD in this U.S. aquaculture line of rainbow trout. This study identified QTLs associated with BCWD survival while assessing outcomes from distinct models and approaches. Identifying QTL for BCWD resistance is expected to be more precise when SNP weighting approaches are used, due to the oligogenic nature of the trait in rainbow trout (Vallejo et al., 2018; 2022). The loss in accuracy when deleting major SNPs and dominant haplotype further validates the link between such markers and BCWD resistance. SNP weighting promoted greater accuracy estimates when all SNP markers were accounted for. Lastly, the results confirm that using different GWAS approaches might optimize QTL discovery and in silico validation.
4.1 Major genomic regions detected in GWAS
SNPs and QTL associated with BCWD resistance vary between populations (Vallejo R. L. et al., 2017). However, major QTL found in different analyses were validated for MAS (Liu et al., 2018). The implementation adopted in the current research computed the percentage of the additive genetic variance explained by windows of SNPs. However, the amount of variance to determine association varies across studies (Tiezzi and Maltecca, 2015; Han and Peñagaricano, 2016). In the GWAS with complete data in this study, we identified QTL as windows of 51 SNPs that explained more than 0.5% of the additive genetic variance. This approach aimed to identify windows harboring genomic regions associated with the trait (Marigorta and Navarro, 2013; Zhang et al., 2016). The two largest QTL peaks we detected in Omy25p (OmyA31) and in Omy08 agreed with previous reporting of QTL for resistance to BCWD in rainbow trout (Palti et al., 2015b; 2015a; Liu et al., 2018; Vallejo R. L. et al., 2017; 2022; Mathiessen et al., 2023).
An additional method to target genomic regions of importance for BCWD resistance was proposed in the current work. In this approach, subgroups were created using K-means clustering, and major SNPs present in all subgroups were identified. SNPs that explained more than 2% of the additive genetic variance and were consistent across subgroups were selected. Major SNPs were identified in all chromosomes with the exception of Omy16 and Omy24. QTL associated with resistance to BCWD were reported in previous studies on several chromosomes (Johnson et al., 2008; Wiens et al., 2013b; Campbell et al., 2014; Quillet et al., 2014; Vallejo et al., 2014; Vallejo R. L. et al., 2017; Liu et al., 2015; Palti et al., 2015b; Fraslin et al., 2019). Genes located in detected associated regions may provide insight into the biological mechanisms involved in BCWD resistance. A discussion of the potential candidate genes located near the large-effect QTL on chromosomes Omy8 and Omy25 can be found in previous publications (Liu et al., 2022; Vallejo et al., 2022). The approach used in this research used the percentage of variance explained to identify associations instead of p-values. A hypothesis testing using frequentist p-values in ssGBLUP was implemented by Aguilar et al. (2019). However, the use of p-values may not identify differences between regions regarding their effect. On the other hand, calculating the percentage of variance explained may underestimate some regions, especially when major QTLs exist and weighted approaches for the genomic relation matrix are used.
The sample selection used in this study might have biased the GWAS results and the estimates of the prediction accuracy of GBLUP models. Most of the samples used for GWAS and GBLUP estimates came from a single tank, where we used unbiased sampling of all the families from the population, but the samples that were genotyped from the other two tanks were pre-selected specifically from families with higher breeding values for other aquaculture production traits. The degree of potential bias due to pre-selected data is currently unknown but likely depends on the correlation of the other traits with resistance to BCWD and the intensity of selective breeding practiced.
Changes in the effects of SNPs and GWAS-associated regions may be a consequence of genetic diversity among populations, sample size variations, environmental influences on trait expression, the complexity of studied traits, different genotyping methods, population structures, statistical approaches, linkage disequilibrium variations, or inconsistencies in phenotype definitions (Uffelmann et al., 2021). Additionally, changes may also be a consequence of the small effective population size and subsequent small number of independent chromosome segments promoting collinearity and a high variance inflation factor for the estimators (Fragomeni et al., 2014; Dodd et al., 2022). Therefore, the gene associations discovered in single studies might not definitively represent the biology of the trait. Thus, there is a need for additional methods to validate SNP associations to strengthen the overall reliability and generalization of GWAS findings.
4.2 Variance components and genetic parameters
Differences were detected between the variance components obtained with the pedigree-based model (PBLUP) and genomic-enabled models (ssGBLUP). Lower heritability estimates were found with ssGBLUP. A similar pattern of reduced additive genetic variance and heritability with GBLUP models was noticed in previous studies (Vallejo R. et al., 2017; 2021). The ssGBLUP model considers additional information about the genetic structure of the population, which might allow for better estimating true genetic relationships, compensate for incomplete and inaccurate pedigree, and reduce bias (Aguilar et al., 2010; Cesarani et al., 2019; Misztal et al., 2020). The lower standard error in our heritability estimates generated with ssGBLUP may reflect a more stable and precise approach. Additionally, PBLUP assumes that the founder population is the base population and that the founders are unrelated (Falconer, 1960), while with marker-based models, the base population is the training population (Van Eenennaam et al., 2014). Nonetheless, PBLUP may pose issues for more closely related genotypes because the breeding value, which contributes to the phenotype, is more likely to be confounded with the Mendelian sampling term (Daetwyler et al., 2007). That occurs because gene copies inherited can still vary due to the randomness in genetic inheritance, and this artifact is expected to be less problematic when using genomic information for better estimating genetic relationships (Vallejo et al., 2021). Model 2, with the exclusion of the dominant haplotype from the genotype file under ssGBLUP, led to additional loss in the genetic variance component. This loss is an additional indicator of the large effect that this haplotype has on the BCWD resistance phenotypes.
4.3 Cross-validation scenarios
The K-fold validation process is largely adopted for assessment of genomic prediction approaches (Brøndum et al., 2011; Daetwyler et al., 2013; Schrauf et al., 2021). In this method, the genotyped individuals are divided into K random subsets, wherein each set is used for the training population of the other groups, and the omitted group is used for validation of the results. The K-means clustering method has been proposed to minimize the relationship between members of the training and validation sets that causes inflated accuracy (Saatchi et al., 2011). The advantage of using such an approach is that it would restrain the additional covariance that exists between variables due to kinship because K-means tends to cluster more homogeneous groups (Silva et al., 2016). Boddhireddy et al. (2014) observed that with K-means, cross-validation accuracies were consistently smaller than those of other approaches, similar to the findings of this study. Ventura et al. (2016) identified that clustering individuals based on genotypes could help find genotype errors and better reference populations. They also found that the number of animals in each cluster can impact the predictions and that groups with smaller sizes tend to have accuracy estimates with larger sampling variance. Additionally, the relationships between the training and the validation datasets can impact realized genomic selection accuracy (Saatchi et al., 2012). The random group cross validation increases the prediction accuracy by increasing the average relationship between the training and validation populations (Pszczola et al., 2012). Such values may result in overestimation of accuracy due to overfitting and consequently poor model selection.
4.4 Accuracy of weighted and unweighted ssGBLUP for different scenarios
Gains in prediction accuracy of BCWD resistance have been detected in SNP weighting and variable selection approaches with greater accuracy than unweighted models (Vallejo R. et al., 2017). Such differences may be attributed mainly to the oligogenic genetic architecture of the trait in study. The same pattern is observed in the results of this work. Santana et al. (2023) observed a decline in accuracy for traits controlled by 1000 QTL and 2000 QTL when using quadratic weights, while a trait controlled by 100 QTL experienced accuracy gains with the same method. The adequate weighting strategy varies based on trait genetic architecture (Lopes et al., 2017; Lourenco et al., 2017). NonlinearA weights have been shown to be more stable than quadratic weights (Zhang et al., 2016; Fragomeni et al., 2019). However, NonlinearA weighting depends on predetermined equation parameters (VanRaden, 2008). Incorrect parameters lead to low accuracy and biased predictions (Santana et al., 2023).
The strategy to remove major SNPs in this study was adopted to enhance the understanding of the association of such SNPs with BCWD resistance. How accuracy was affected with the different SNP arrays was compared, and the cases where major SNPs and the dominant haplotype were removed caused accuracy to decrease. Weighting SNPs in the “Minus Major SNP” scenario further decreased accuracy, indicating that the markers removed are likely of higher influence, especially when weighting approaches allowed a large departure from normality. When removing major SNPs, the response due to weighting is expected to be close to the response of a polygenic trait. For this reason, quadratic weights and extreme values in the NonlinearA equation resulted in low accuracy. In a similar approach, Vallejo et al. (2018) detected a sharp decline in the accuracy of the BayesB predictions between using the higher density panel without Omy8 and Omy25 and using a 500 SNP panel without Omy8 and Omy25. In our study, the random removal of a few hundred SNPs from the array with 36,000 did not impact the prediction accuracy (results not shown), demonstrating that the loss in accuracy is not due to reduced density of the panel. Similarly, Kriaridou et al. (2020) observed that, at levels above 2,000 SNPs, changes in panel densities did not significantly affect the accuracy of predictions across various aquaculture species. The research found consistent prediction accuracies across a range of panel densities, spanning from 2,000 to 7,000, with increments of 100 SNPs per panel.
Because of the complexity of traits’ genetic architecture, many variable selection approaches have been implemented and demonstrated relevant findings even for polygenic traits. MacLeod et al. (2016) investigated the use of BayesR and Bayes RC while exploiting biological priors and inclusion of putative variants with distinct distributions for the SNP effects assumed. BayesR employs a Markov chain Monte Carlo methodology to estimate variant effects using prior biological knowledge. These effects are modeled as a mixture distribution comprising four normal distributions, with one of these representing a null distribution. BayesRC shared a similar approach with BayesR except that a priori independent biological information was used to allocate each variant to a specific class. BayesRC improved the accuracy of QTL discovery and genomic prediction and was shown to be useful while accounting for biological knowledge regarding functional regions of the genome. Such approaches could be beneficial for traits with a polygenic architecture but with a few major regions, such as BCWD resistance.
The gains in accuracy in PBLUP obtained by adding the haplotype effect were higher than those described by Lopes et al. (2017). Such differences are likely due to the magnitude of the QTL identified in this study. However, the population structure may also have an influence on those findings, and more research on the causality of the QTL should be performed before commercial implementation of a marker-assisted selection program. The current results encourage the inclusion of the single marker in a pedigree-based breeding program. However, a selection program based on a single genomic region may lead to a quick fixation of the allele and haplotype within populations, so constant genetic screening is very important if the MAS approach is being considered.
Removing major SNPs caused subsequent losses in accuracy and gave additional insight into the association between genetic markers and the studied trait. The strategy of selecting consistent major SNPs across more homogeneous groups served to bolster confidence in the significance of specific genetic markers. Identifying similar associations across diverse genetic groups such as breeds, lines, and families serves to further enhance the credibility of variant causality (van den Berg et al., 2016). Hence, clustering genotypes and identifying more homogeneous groups for cross validation may help in the process of establishing associations. Removing a major QTL and including it as a fixed effect caused the accuracy of prediction to decrease more than in the other scenarios, indicating an important association between the dominant haplotype and BCWD resistance. However, that accuracy can be recovered when the haplotype effect is included in the breeding value. Therefore, incorporating QTL information into genomic selection methods is a promising application. Previously, the QTL in chromosome Omy25 was shown to be potentially useful for marker-assisted selection in other commercial rainbow trout lines, resulting in accuracies higher than family-based selection (Liu et al., 2018; 2022; Vallejo et al., 2022; Mathiessen et al., 2023). MAS stands out as a viable and cost-effective alternative for selective breeding to improve resistance to BCWD in rainbow trout because of the cost savings in genotyping and because it does not require recurring phenotyping for model retraining in each generation.
5 Conclusion
In this study, a successful implementation of GWAS and genomic prediction for resistance to BCWD was achieved in an important commercial rainbow trout line that has not been previously investigated for this trait, resulting in higher prediction accuracy through genomic selection. Comparative analysis of different cross-validation methods suggested that K-means reduced overfitting. The incorporation of SNP weighting further substantiated the underlying oligogenic architecture of the trait under investigation. Bias was minimal in ssGBLUP when the major effect haplotype on Omy25/OmyA31 was included as a fixed effect and in weighted ssGBLUP with optimized equation parameters. Additionally, a decrease in accuracy upon the exclusion of major SNPs was observed and serves as supplementary evidence of their effect on phenotypes. Alternative validation methodology unveiled a new set of major-effect SNPs. Removing a major haplotype from the SNP panel resulted in a substantial reduction in the prediction accuracy and modification of the genetic architecture. Conversely, the inclusion of the major haplotype effect as a fixed effect illustrated its potential utility in marker-assisted selection as previously reported for two other commercial lines of rainbow trout.
Data availability statement
The original contributions presented in the study are included in the article/supplementary material; further inquiries can be directed to the corresponding author.
Ethics statement
As farm animals have been used in a commercial breeding program, these fish are exempt from regulation under the U.S. Animal Welfare Act and, therefore, are not subject to oversight by an Institutional Animal Care and Use Committee or other such ethics committee. This exemption is defined in U.S. Code title 7, chapter 54, section 2132g. However, experimentation and handling were conducted in accordance with U.S. government principles for the use and care of vertebrate animals used in testing, research, and training, which include provisions to minimize animal suffering. Specific measures for amelioration of animal suffering during the fish pathogen testing included minimization of handling and maintenance of optimal water temperature and oxygen saturation. Additionally, the fish were fed a standard fish meal diet to satiation daily. Fish near death from severe symptoms of infection during the observation period were removed and terminated (by immersion in a lethal dose of MS-222) before the collection of fin tissue to minimize suffering. After the 24-day observation period, surviving fish were terminated by immersion in a lethal dose of MS-222 before sampling and disposal. The studies were conducted in accordance with the local legislation and institutional requirements. Written informed consent was obtained from the owners for the participation of their animals in this study.
Author contributions
BS: Formal Analysis, Investigation, Methodology, Software, Validation, Writing – original draft, Writing – review and editing. YP: Conceptualization, Data curation, Funding acquisition, Investigation, Methodology, Project administration, Resources, Supervision, Validation, Writing – review and editing. GG: Data curation, Methodology, Software, Writing – review and editing. VT: Data curation, Methodology, Writing – review and editing. KM: Conceptualization, Data curation, Investigation, Methodology, Project administration, Resources, Supervision, Writing – review and editing. BF: Conceptualization, Formal Analysis, Methodology, Project administration, Resources, Software, Supervision, Validation, Writing – review and editing.
Funding
The author(s) declare that financial support was received for the research and/or publication of this article. This project was supported by the USDA Agricultural Research Service in-house project number 8082-31000-013.
Acknowledgments
Mention of trade names or commercial products in this publication is solely for the purpose of providing specific information and does not imply recommendation or endorsement by the U.S. government. USDA is an equal opportunity provider and employer.
Conflict of interest
Author KM was employed by Hendrix Genetics.
The remaining authors declare that the research was conducted in the absence of any commercial or financial relationships that could be construed as a potential conflict of interest.
Generative AI statement
The author(s) declare that no Generative AI was used in the creation of this manuscript.
Any alternative text (alt text) provided alongside figures in this article has been generated by Frontiers with the support of artificial intelligence and reasonable efforts have been made to ensure accuracy, including review by the authors wherever possible. If you identify any issues, please contact us.
Publisher’s note
All claims expressed in this article are solely those of the authors and do not necessarily represent those of their affiliated organizations, or those of the publisher, the editors and the reviewers. Any product that may be evaluated in this article, or claim that may be made by its manufacturer, is not guaranteed or endorsed by the publisher.
References
Aguilar, I., Misztal, I., Johnson, D. L., Legarra, A., Tsuruta, S., and Lawlor, T. J. (2010). Hot topic: a unified approach to utilize phenotypic, full pedigree, and genomic information for genetic evaluation of Holstein final score. J. Dairy Sci. 93, 743–752. doi:10.3168/jds.2009-2730
Aguilar, I., Misztal, I., Tsuruta, S., Legarra, A., and Wang, H. (2014). “PREGSF90–POSTGSF90: computational tools for the implementation of single-step genomic selection and genome-wide association with ungenotyped individuals in BLUPF90 programs,” in Proceedings of the 10th world congress of genetics applied to livestock production (Vancouver, BC, Canada: WCGALP).
Aguilar, I., Legarra, A., Cardoso, F., Masuda, Y., Lourenco, D., and Misztal, I. (2019). Frequentist p-values for large-scale-single step genome-wide association, with an application to birth weight in American Angus cattle. Genet. Sel. Evol. 51, 28–8. doi:10.1186/s12711-019-0469-3
Ahmed, R. O., Ali, A., Al-Tobasei, R., Leeds, T., Kenney, B., and Salem, M. (2022). Weighted single-step GWAS identifies genes influencing fillet color in rainbow trout. Genes 13, 1331. doi:10.3390/genes13081331
Ali, A., Al-Tobasei, R., Lourenco, D., Leeds, T., Kenney, B., and Salem, M. (2019). Genome-wide association study identifies genomic loci affecting filet firmness and protein content in rainbow trout. Front. Genet. 10, 386. doi:10.3389/fgene.2019.00386
Boddhireddy, P., Kelly, M. J., Northcutt, S., Prayaga, K. C., Rumph, J., and DeNise, S. (2014). Genomic predictions in Angus cattle: comparisons of sample size, response variables, and clustering methods for cross-validation. J. Animal Sci. 92, 485–497. doi:10.2527/jas.2013-6757
Brøndum, R. F., Rius-Vilarrasa, E., Strandén, I., Su, G., Guldbrandtsen, B., Fikse, W. F., et al. (2011). Reliabilities of genomic prediction using combined reference data of the Nordic Red dairy cattle populations. J. Dairy Sci. 94, 4700–4707. doi:10.3168/jds.2010-3765
Calboli, F. C. F., Koskinen, H., Nousianen, A., Fraslin, C., Houston, R. D., and Kause, A. (2022). Conserved QTL and chromosomal inversion affect resistance to columnaris disease in 2 rainbow trout (Oncorhyncus mykiss) populations. G3 Genes|Genomes|Genetics 12, jkac137. doi:10.1093/g3journal/jkac137
Campbell, N. R., LaPatra, S. E., Overturf, K., Towner, R., and Narum, S. R. (2014). Association mapping of disease resistance traits in rainbow trout using restriction site associated DNA sequencing. G3 Genes, Genomes, Genet. 4, 2473–2481. doi:10.1534/g3.114.014621
Cesarani, A., Pocrnic, I., Macciotta, N. P. P., Fragomeni, B. O., Misztal, I., and Lourenco, D. A. L. (2019). Bias in heritability estimates from genomic restricted maximum likelihood methods under different genotyping strategies. J. Animal Breed. Genet. 136, 40–50. doi:10.1111/jbg.12367
Christensen, O. F., and Lund, M. S. (2010). Genomic prediction when some animals are not genotyped. Genet. Sel. Evol. 42, 2–8. doi:10.1186/1297-9686-42-2
Daetwyler, H. D., Villanueva, B., Bijma, P., and Woolliams, J. A. (2007). Inbreeding in genome-wide selection. J. Animal Breed. Genet. 124, 369–376. doi:10.1111/j.1439-0388.2007.00693.x
Daetwyler, H. D., Calus, M. P. L., Pong-Wong, R., de los Campos, G., and Hickey, J. M. (2013). Genomic prediction in animals and plants: simulation of data, validation, reporting, and benchmarking. Genetics 193, 347–365. doi:10.1534/genetics.112.147983
Dalsgaard, I., and Madsen, L. (2000). Bacterial pathogens in rainbow trout, Oncorhynchus mykiss (Walbaum), reared at Danish freshwater farms. J. Fish Dis. 23, 199–209. doi:10.1046/j.1365-2761.2000.00242.x
Dodd, G. R., Gray, K., Huang, Y., and Fragomeni, B. (2022). Single-step GBLUP and GWAS analyses suggests implementation of unweighted two trait approach for heat stress in swine. Animals 12, 388. doi:10.3390/ani12030388
Falconer, D. S. (1960). Introduction to quantitative genetics. 1st Edn. Edinburgh and London: Oliver & Boyd.
Fragomeni, B. de O., Misztal, I., Lourenco, D. L., Aguilar, I., Okimoto, R., and Muir, W. M. (2014). Changes in variance explained by top SNP windows over generations for three traits in broiler chicken. Front. Genet. 5, 332. doi:10.3389/fgene.2014.00332
Fragomeni, B. O., Lourenco, D. A. L., Masuda, Y., Legarra, A., and Misztal, I. (2017). Incorporation of causative quantitative trait nucleotides in single-step GBLUP. Genet. Sel. Evol. 49, 59. doi:10.1186/s12711-017-0335-0
Fragomeni, B. O., Lourenco, D. A. L., Legarra, A., VanRaden, P. M., and Misztal, I. (2019). Alternative SNP weighting for single-step genomic best linear unbiased predictor evaluation of stature in US Holsteins in the presence of selected sequence variants. J. Dairy Sci. 102, 10012–10019. doi:10.3168/jds.2019-16262
Fraslin, C., Brard-Fudulea, S., D’Ambrosio, J., Bestin, A., Charles, M., Haffray, P., et al. (2019). Rainbow trout resistance to bacterial cold water disease: two new quantitative trait loci identified after a natural disease outbreak on a French farm. Anim. Genet. 50, 293–297. doi:10.1111/age.12777
Fraslin, C., Koskinen, H., Nousianen, A., Houston, R. D., and Kause, A. (2022). Genome-wide association and genomic prediction of resistance to Flavobacterium columnare in a farmed rainbow trout population. Aquaculture 557, 738332. doi:10.1016/j.aquaculture.2022.738332
Fraslin, C., Robledo, D., Kause, A., and Houston, R. D. (2023). Potential of imputation for cost-efficient genomic selection for resistance to Flavobacterium columnare in rainbow trout (Oncorhynchus mykiss). bioRxiv 2023–01. doi:10.1101/2023.01.04.522693
Gao, G., Magadan, S., Waldbieser, G. C., Youngblood, R. C., Wheeler, P. A., Scheffler, B. E., et al. (2021). A long reads-based de-novo assembly of the genome of the Arlee homozygous line reveals chromosomal rearrangements in rainbow trout. G3 Genes|Genomes|Genetics 11, jkab052. doi:10.1093/g3journal/jkab052
Garcia, A., Tsuruta, S., Gao, G., Palti, Y., Lourenco, D., and Leeds, T. (2023). Genomic selection models substantially improve the accuracy of genetic merit predictions for fillet yield and body weight in rainbow trout using a multi-trait model and multi-generation progeny testing. Genet. Sel. Evol. 55, 11. doi:10.1186/s12711-023-00782-6
Goddard, M. E., Kemper, K. E., MacLeod, I. M., Chamberlain, A. J., and Hayes, B. J. (2016). Genetics of complex traits: prediction of phenotype, identification of causal polymorphisms and genetic architecture. Proc. R. Soc. B Biol. Sci. 283, 20160569. doi:10.1098/rspb.2016.0569
Han, Y., and Peñagaricano, F. (2016). Unravelling the genomic architecture of bull fertility in Holstein cattle. BMC Genet. 17, 143. doi:10.1186/s12863-016-0454-6
Hoare, R., Ngo, T. P. H., Bartie, K. L., and Adams, A. (2017). Efficacy of a polyvalent immersion vaccine against Flavobacterium psychrophilum and evaluation of immune response to vaccination in rainbow trout fry (Onchorynchus mykiss L.). Veterinary Res. 48, 43. doi:10.1186/s13567-017-0448-z
Hoare, R., Jung, S.-J., Ngo, T. P. H., Bartie, K. L., Thompson, K. D., and Adams, A. (2019). Efficacy of a polyvalent injectable vaccine against Flavobacterium psychrophilum administered to rainbow trout (Oncorhynchus mykiss L.). J. Fish Dis. 42, 229–236. doi:10.1111/jfd.12919
Johnson, N. A., Vallejo, R. L., Silverstein, J. T., Welch, T. J., Wiens, G. D., Hallerman, E. M., et al. (2008). Suggestive association of major Histocompatibility IB genetic markers with resistance to bacterial cold water disease in rainbow trout (Oncorhynchus mykiss). Mar. Biotechnol. 10, 429–437. doi:10.1007/s10126-007-9080-7
Kriaridou, C., Tsairidou, S., Houston, R. D., and Robledo, D. (2020). Genomic prediction using low density marker panels in aquaculture: performance across species, traits, and genotyping platforms. Front. Genet. 11, 124. doi:10.3389/fgene.2020.00124
Kudinov, A. A., Nousiainen, A., Koskinen, H., and Kause, A. (2024). Single-step genomic prediction for body weight and maturity age in Finnish rainbow trout (Oncorhynchus mykiss). Aquaculture 585, 740677. doi:10.1016/j.aquaculture.2024.740677
Lafrentz, B. R., Lindstrom, N. M., Lapatra, S. E., Call, D. R., and Cain, K. D. (2007). Electrophoretic and Western blot analyses of the lipopolysaccharide and glycocalyx of Flavobacterium psychrophilum. Fish and Shellfish Immunol. 23, 770–780. doi:10.1016/j.fsi.2007.02.005
Lafrentz, B. R., Lapatra, S. E., Call, D. R., Wiens, G. D., and Cain, K. D. (2009). Proteomic analysis of Flavobacterium psychrophilum cultured in vivo and in iron-limited media. Dis. Aquatic Org. 87, 171–182. doi:10.3354/dao02122
Lafrentz, B. R., Lapatra, S. E., Call, D. R., Wiens, G. D., and Cain, K. D. (2011). Identification of immunogenic proteins within distinct molecular mass fractions of Flavobacterium psychrophilum. J. Fish Dis. 34, 823–830. doi:10.1111/j.1365-2761.2011.01297.x
Lee, M. C. S., and Fidock, D. A. (2014). CRISPR-mediated genome editing of Plasmodium falciparum malaria parasites. Genome Med. 6, 63. doi:10.1186/s13073-014-0063-9
Leeds, T. D., Silverstein, J. T., Weber, G. M., Vallejo, R. L., Palti, Y., Rexroad, C. E., et al. (2010). Response to selection for bacterial cold water disease resistance in rainbow trout. J. Anim. Sci. 88, 1936–1946. doi:10.2527/jas.2009-2538
Legarra, A., Robert-Granié, C., Manfredi, E., and Elsen, J.-M. (2008). Performance of genomic selection in mice. Genetics 180, 611–618. doi:10.1534/genetics.108.088575
Legarra, A., Aguilar, I., and Misztal, I. (2009). A relationship matrix including full pedigree and genomic information. J. Dairy Sci. 92, 4656–4663. doi:10.3168/jds.2009-2061
Legarra, A., Christensen, O. F., Aguilar, I., and Misztal, I. (2014). Single Step, a general approach for genomic selection. Livest. Sci. 166, 54–65. doi:10.1016/j.livsci.2014.04.029
Liu, S., Vallejo, R. L., Palti, Y., Gao, G., Marancik, D. P., Hernandez, A. G., et al. (2015). Identification of single nucleotide polymorphism markers associated with bacterial cold water disease resistance and spleen size in rainbow trout. Front. Genet. 6, 298. doi:10.3389/fgene.2015.00298
Liu, S., Palti, Y., Gao, G., and Rexroad, C. E. (2016). Development and validation of a SNP panel for parentage assignment in rainbow trout. Aquaculture 452, 178–182. doi:10.1016/j.aquaculture.2015.11.001
Liu, S., Palti, Y., Martin, K. E., Parsons, J. E., and Rexroad, C. E. (2017). Assessment of genetic differentiation and genetic assignment of commercial rainbow trout strains using a SNP panel. Aquaculture 468, 120–125. doi:10.1016/j.aquaculture.2016.10.004
Liu, S., Vallejo, R. L., Evenhuis, J. P., Martin, K. E., Hamilton, A., Gao, G., et al. (2018). Retrospective evaluation of marker-assisted selection for resistance to bacterial cold water disease in three generations of a commercial rainbow trout breeding population. Front. Genet. 9, 286. doi:10.3389/fgene.2018.00286
Liu, S., Martin, K. E., Gao, G., Long, R., Evenhuis, J. P., Leeds, T. D., et al. (2022). Identification of haplotypes associated with resistance to bacterial cold water disease in rainbow trout using whole-genome resequencing. Front. Genet. 13, 936806. doi:10.3389/fgene.2022.936806
Loch, T. P., and Faisal, M. (2015). Emerging flavobacterial infections in fish: a review. J. Adv. Res. 6, 283–300. doi:10.1016/j.jare.2014.10.009
Lopes, M. S., Bovenhuis, H., van Son, M., Nordbø, Ø., Grindflek, E. H., Knol, E. F., et al. (2017). Using markers with large effect in genetic and genomic predictions. J. Animal Sci. 95, 59–71. doi:10.2527/jas.2016.0754
Lourenco, D., Tsuruta, S., Fragomeni, B., Masuda, Y., Aguilar, I., Legarra, A., et al. (2015). Genetic evaluation using single-step genomic best linear unbiased predictor in American Angus. J. animal Sci. 93, 2653–2662. doi:10.2527/jas.2014-8836
Lourenco, D. A. L., Fragomeni, B. O., Bradford, H. L., Menezes, I. R., Ferraz, J. B. S., Aguilar, I., et al. (2017). Implications of SNP weighting on single-step genomic predictions for different reference population sizes. J. Animal Breed. Genet. 134, 463–471. doi:10.1111/jbg.12288
MacLeod, I. M., Bowman, P. J., Vander Jagt, C. J., Haile-Mariam, M., Kemper, K. E., Chamberlain, A. J., et al. (2016). Exploiting biological priors and sequence variants enhances QTL discovery and genomic prediction of complex traits. BMC Genomics 17, 144. doi:10.1186/s12864-016-2443-6
Madsen, L., and Dalsgaard, I. (1999). Reproducible methods for experimental infection with Flavobacterium psychrophilum in rainbow trout Oncorhynchus mykiss. Dis. Aquatic Org. 36, 169–176. doi:10.3354/dao036169
Marancik, D., Gao, G., Paneru, B., Ma, H., Hernandez, A. G., Salem, M., et al. (2015). Whole-body transcriptome of selectively bred, resistant-control-and susceptible-line rainbow trout following experimental challenge with Flavobacterium psychrophilum. Front. Genet. 5, 453. doi:10.3389/fgene.2014.00453
Marigorta, U. M., and Navarro, A. (2013). High trans-ethnic Replicability of GWAS results implies common causal variants. PLOS Genet. 9, e1003566. doi:10.1371/journal.pgen.1003566
Mathiessen, H., Duan, Y., Marana, M. H., Zuo, S., Karami, A. M., Jafaar, R., et al. (2023). Validation of a QTL for Flavobacterium psychrophilum resistance in rainbow trout Oncorhynchus mykiss. Aquac. Rep. 30, 101573. doi:10.1016/j.aqrep.2023.101573
Mehrban, H., Lee, D. H., Moradi, M. H., IlCho, C., Naserkheil, M., and Ibáñez-Escriche, N. (2017). Predictive performance of genomic selection methods for carcass traits in Hanwoo beef cattle: impacts of the genetic architecture. Genet. Sel. Evol. 49, 1. doi:10.1186/s12711-016-0283-0
Meuwissen, T. H. E., Hayes, B. J., and Goddard, M. E. (2001). Prediction of total genetic value using genome-wide dense marker maps. Genetics 157, 1819–1829. doi:10.1093/genetics/157.4.1819
Misztal, I., Tsuruta, S., Lourenco, D., Aguilar, I., Legarra, A., and Vitezica, Z. (2015). Manual for BLUPF90 family of programs. Available online at: http://nce.ads.uga.edu/wiki/lib/exe/fetch.php?media=blupf90_all2.pdf.
Misztal, I., Lourenco, D., and Legarra, A. (2020). Current status of genomic evaluation. J. Animal Sci. 98, skaa101. doi:10.1093/jas/skaa101
Moghaddar, N., Brown, D. J., Swan, A. A., Gurman, P. M., Li, L., and van der Werf, J. H. (2022). Genomic prediction in a numerically small breed population using prioritized genetic markers from whole-genome sequence data. J. Animal Breed. Genet. 139, 71–83. doi:10.1111/jbg.12638
Muir, W. M., Wong, G. K.-S., Zhang, Y., Wang, J., Groenen, M. A. M., Crooijmans, R. P. M. A., et al. (2008). Genome-wide assessment of worldwide chicken SNP genetic diversity indicates significant absence of rare alleles in commercial breeds. Proc. Natl. Acad. Sci. U. S. A. 105, 17312–17317. doi:10.1073/pnas.0806569105
Nematollahi, A., Decostere, A., Pasmans, F., and Haesebrouck, F. (2003). Flavobacterium psychrophilum infections in salmonid fish. J. Fish Dis. 26, 563–574. doi:10.1046/j.1365-2761.2003.00488.x
Nilsen, H., Johansen, R., Colquhoun, D. J., Kaada, I., Bottolfsen, K., Vågnes, Ø., et al. (2011). Flavobacterium psychrophilum associated with septicaemia and necrotic myositis in Atlantic salmon Salmo salar: a case report. Dis. Aquatic Org. 97, 37–46. doi:10.3354/dao02390
Palti, Y., Gao, G., Liu, S., Kent, M. P., Lien, S., Miller, M. R., et al. (2015a). The development and characterization of a 57K single nucleotide polymorphism array for rainbow trout. Mol. Ecol. Resour. 15, 662–672. doi:10.1111/1755-0998.12337
Palti, Y., Vallejo, R. L., Gao, G., Liu, S., Hernandez, A. G., Parsons, J. E., et al. (2015b). Detection and validation of QTL affecting bacterial cold water disease resistance in rainbow trout using restriction-site associated DNA sequencing. PLoS ONE, 10, e0138435. doi:10.1371/journal.pone.0138435
Palti, Y., Vallejo, R. L., Purcell, M. K., Gao, G., Shewbridge, K. L., Long, R. L., et al. (2024). Genome-wide association analysis of the resistance to infectious hematopoietic necrosis virus in two rainbow trout aquaculture lines confirms oligogenic architecture with several moderate effect quantitative trait loci. Front. Genet. 15, 1394656. doi:10.3389/fgene.2024.1394656
Pszczola, M., Strabel, T., Mulder, H. A., and Calus, M. P. L. (2012). Reliability of direct genomic values for animals with different relationships within and to the reference population. J. Dairy Sci. 95, 389–400. doi:10.3168/jds.2011-4338
Quillet, E., Dechamp, N., Hervet, C., Krieg, F., Chantry-Darmon, C., Boussaha, M., et al. (2014). “Genetic bases of resistance versus susceptibility to Flavobacterium psychrophilum in rainbow trout,” in 10. World congress on genetics applied to livestock production (WCGALP) (Vancouver, Canada).
Reis Neto, R. V., Yoshida, G. M., Lhorente, J. P., and Yáñez, J. M. (2019). Genome-wide association analysis for body weight identifies candidate genes related to development and metabolism in rainbow trout (Oncorhynchus mykiss). Mol. Genet. Genomics 294, 563–571. doi:10.1007/s00438-018-1518-2
Saatchi, M., McClure, M., McKay, S., Rolf, M., Kim, J., Decker, J., et al. (2011). Accuracies of genomic breeding values in American Angus beef cattle using K-means clustering for cross-validation. Genet. Sel. Evol. 43, 40. doi:10.1186/1297-9686-43-40
Saatchi, M., Schnabel, R. D., Rolf, M. M., Taylor, J. F., and Garrick, D. J. (2012). Accuracy of direct genomic breeding values for nationally evaluated traits in US Limousin and Simmental beef cattle. Genet. Sel. Evol. 44, 38–10. doi:10.1186/1297-9686-44-38
Santana, B., Riser, M., Hay, E., and Fragomeni, B. de O. (2023). Alternative SNP weighting for multi-step and single-step genomic BLUP in the presence of causative variants. J. Animal Breed. Genet. 140, 679–694. doi:10.1111/jbg.12817
Schrauf, M., de los Campos, G., and Munilla, S. (2021). Comparing genomic prediction models by means of cross validation. Front. Plant Sci. 12, 734512. doi:10.3389/fpls.2021.734512
Silva, R., Fragomeni, B., Lourenco, D., Magalhães, A., Irano, N., Carvalheiro, R., et al. (2016). Accuracies of genomic prediction of feed efficiency traits using different prediction and validation methods in an experimental Nelore cattle population. J. Animal Sci. 94, 3613–3623. doi:10.2527/jas.2016-0401
Silva, R. M. O., Evenhuis, J. P., Vallejo, R. L., Gao, G., Martin, K. E., Leeds, T. D., et al. (2019). Whole-genome mapping of quantitative trait loci and accuracy of genomic predictions for resistance to columnaris disease in two rainbow trout breeding populations. Genet. Sel. Evol. 51, 42. doi:10.1186/s12711-019-0484-4
Silverstein, J. T., Vallejo, R. L., Palti, Y., Leeds, T. D., Rexroad, C. E., Welch, T. J., et al. (2009). Rainbow trout resistance to bacterial cold-water disease is moderately heritable and is not adversely correlated with growth. J. Anim. Sci. 87, 860–867. doi:10.2527/jas.2008-1157
Strandén, I., and Garrick, D. (2009). Technical note: derivation of equivalent computing algorithms for genomic predictions and reliabilities of animal merit. J. dairy Sci. 92, 2971–2975. doi:10.3168/jds.2008-1929
Sudheesh, P. S., Lafrentz, B. R., Call, D. R., Siems, W. F., Lapatra, S. E., Wiens, G. D., et al. (2007). Identification of potential vaccine target antigens by immunoproteomic analysis of a virulent and a non-virulent strain of the fish pathogen Flavobacterium psychrophilum. Dis. Aquatic Org. 74, 37–47. doi:10.3354/dao074037
Tiezzi, F., and Maltecca, C. (2015). Accounting for trait architecture in genomic predictions of US Holstein cattle using a weighted realized relationship matrix. Genet. Sel. Evol. 47, 24. doi:10.1186/s12711-015-0100-1
Uffelmann, E., Huang, Q., Munung, N., de Vries, J., Okada, Y., Martin, A., et al. (2021). Genome-wide association studies. Nat. Rev. Methods Prim. 1, 59–21. doi:10.1038/s43586-021-00056-9
Vallejo, R. L., Palti, Y., Liu, S., Evenhuis, J. P., Gao, G., Rexroad, C. E., et al. (2014). Detection of QTL in rainbow trout affecting survival when challenged with Flavobacterium psychrophilum. Mar. Biotechnol. 16, 349–360. doi:10.1007/s10126-013-9553-9
Vallejo R., R., Leeds, T., Gao, G., Parsons, J., Martin, K., Evenhuis, J., et al. (2017). Genomic selection models double the accuracy of predicted breeding values for bacterial cold water disease resistance compared to a traditional pedigree-based model in rainbow trout aquaculture. Genet. Sel. Evol. 49, 17. doi:10.1186/s12711-017-0293-6
Vallejo, R. L., Liu, S., Gao, G., Fragomeni, B. O., Hernandez, A. G., Leeds, T. D., et al. (2017). Similar genetic architecture with shared and unique quantitative trait loci for bacterial cold water disease resistance in two rainbow trout breeding populations. Front. Genet. 8, 156. doi:10.3389/fgene.2017.00156
Vallejo, R. L., Silva, R. M. O., Evenhuis, J. P., Gao, G., Liu, S., Parsons, J. E., et al. (2018). Accurate genomic predictions for BCWD resistance in rainbow trout are achieved using low-density SNP panels: evidence that long-range LD is a major contributing factor. J. Animal Breed. Genet. 135, 263–274. doi:10.1111/jbg.12335
Vallejo, R., Cheng, H., Fragomeni, B., Shewbridge, K., Gao, G., MacMillan, J., et al. (2019). Genome-wide association analysis and accuracy of genome-enabled breeding value predictions for resistance to infectious hematopoietic necrosis virus in a commercial rainbow trout breeding population. Genet. Sel. Evol. 51, 47. doi:10.1186/s12711-019-0489-z
Vallejo, R. L., Cheng, H., Fragomeni, B. O., Gao, G., Silva, R. M. O., Martin, K. E., et al. (2021). The accuracy of genomic predictions for bacterial cold water disease resistance remains higher than the pedigree-based model one generation after model training in a commercial rainbow trout breeding population. Aquaculture 545, 737164. doi:10.1016/j.aquaculture.2021.737164
Vallejo, R., Evenhuis, J., Cheng, H., Fragomeni, B., Gao, G., Liu, S., et al. (2022). Genome-wide mapping of quantitative trait loci that can be used in marker-assisted selection for resistance to bacterial cold water disease in two commercial rainbow trout breeding populations. Aquaculture 560, 738574. doi:10.1016/j.aquaculture.2022.738574
van den Berg, I., Boichard, D., and Lund, M. S. (2016). Comparing power and precision of within-breed and multibreed genome-wide association studies of production traits using whole-genome sequence data for 5 French and Danish dairy cattle breeds. J. Dairy Sci. 99, 8932–8945. doi:10.3168/jds.2016-11073
Van Eenennaam, A. L., Weigel, K. A., Young, A. E., Cleveland, M. A., and Dekkers, J. C. M. (2014). Applied animal genomics: results from the field. Annu. Rev. Animal Biosci. 2, 105–139. doi:10.1146/annurev-animal-022513-114119
VanRaden, P. M. (2008). Efficient methods to compute genomic predictions. J. Dairy Sci. 91, 4414–4423. doi:10.3168/jds.2007-0980
VanRaden, P., Null, D., Sargolzaei, M., Wiggans, G., Tooker, M., Cole, J., et al. (2013). Genomic imputation and evaluation using high-density Holstein genotypes. J. dairy Sci. 96, 668–678. doi:10.3168/jds.2012-5702
VanRaden, P. M., Sun, C., and O’Connell, J. R. (2015). Fast imputation using medium or low-coverage sequence data. BMC Genet. 16, 82–12. doi:10.1186/s12863-015-0243-7
Ventura, R., Larmer, S., Schenkel, F. S., Miller, S. P., and Sullivan, P. (2016). Genomic clustering helps to improve prediction in a multibreed population. J. Animal Sci. 94, 1844–1856. doi:10.2527/jas.2016-0322
Vitezica, Z. G., Aguilar, I., Misztal, I., and Legarra, A. (2011). Bias in genomic predictions for populations under selection. Genet. Res. 93, 357–366. doi:10.1017/S001667231100022X
Wang, H., Misztal, I., Aguilar, I., Legarra, A., and Muir, W. M. (2012). Genome-wide association mapping including phenotypes from relatives without genotypes. Genet. Res. 94, 73–83. doi:10.1017/S0016672312000274
Wiens, G. D., Lapatra, S. E., Welch, T. J., Evenhuis, J. P., Rexroad Iii, C. E., and Leeds, T. D. (2013a). On-farm performance of rainbow trout (Oncorhynchus mykiss) selectively bred for resistance to bacterial cold water disease: effect of rearing environment on survival phenotype. Aquaculture 388-391, 128–136. doi:10.1016/j.aquaculture.2013.01.018
Wiens, G. D., Vallejo, R. L., Leeds, T. D., Palti, Y., Hadidi, S., Liu, S., et al. (2013b). Assessment of genetic correlation between bacterial cold water disease resistance and spleen index in a domesticated population of rainbow trout: identification of QTL on chromosome Omy19. PLOS ONE 8, e75749. doi:10.1371/journal.pone.0075749
Wiens, G. D., Lapatra, S. E., Welch, T. J., Rexroad, C., Call, D. R., Cain, K. D., et al. (2014). Complete genome sequence of Flavobacterium psychrophilum strain CSF259-93, used to select rainbow trout for increased genetic resistance against bacterial cold water disease. Genome announc. 2, e00889-14. doi:10.1128/genomeA.00889-14
Wiens, G. D., Palti, Y., and Leeds, T. D. (2018). Three generations of selective breeding improved rainbow trout (Oncorhynchus mykiss) disease resistance against natural challenge with Flavobacterium psychrophilum during early life-stage rearing. Aquaculture 497, 414–421. doi:10.1016/j.aquaculture.2018.07.064
Wiens, G. D., Marancik, D. P., Chadwick, C. C., Osbourn, K., Reid, R. M., and Leeds, T. D. (2023). Plasma proteomic profiling of bacterial cold water disease-resistant and -susceptible rainbow trout lines and biomarker discovery. Front. Immunol. 14, 1265386. doi:10.3389/fimmu.2023.1265386
Yoshida, G., Bangera, R., Carvalheiro, R., Correa, K., Figueroa, R., Lhorente, J., et al. (2018). Genomic prediction accuracy for resistance against *Piscirickettsia salmonis* in farmed rainbow trout. G3 Genes| Genomes| Genet. 8, 719. doi:10.1534/g3.117.300499
Keywords: rainbow trout, disease resistance, genomic predictions, oligogenic trait, quantitative trait loci, prediction accuracy
Citation: Santana B, Palti Y, Gao G, Tripathi V, Martin KE and Fragomeni BO (2025) Genome-wide association analysis of resistance to bacterial cold-water disease in an important rainbow trout aquaculture breeding population. Front. Genet. 16:1582138. doi: 10.3389/fgene.2025.1582138
Received: 24 February 2025; Accepted: 20 August 2025;
Published: 18 September 2025.
Edited by:
Adriana Mércia Guaratini Ibelli, Embrapa Pecuária Sudeste, BrazilReviewed by:
Antti Kause, Natural Resources Institute Finland (Luke), FinlandAmr Ahmed Abdelrahim Gamil, Norwegian University of Life Sciences, Norway
Copyright © 2025 Santana, Palti, Gao, Tripathi, Martin and Fragomeni. This is an open-access article distributed under the terms of the Creative Commons Attribution License (CC BY). The use, distribution or reproduction in other forums is permitted, provided the original author(s) and the copyright owner(s) are credited and that the original publication in this journal is cited, in accordance with accepted academic practice. No use, distribution or reproduction is permitted which does not comply with these terms.
*Correspondence: Yniv Palti, eW5pdi5wYWx0aUB1c2RhLmdvdg==