 Xiaoyuan Meng1
 Zhongcheng Han
- 1Department of Orthopedics, People’s Hospital of Xinjiang Uygur Autonomous Region, Urumqi, China
- 2Department of Oncology, People’s Hospital of Xinjiang Uygur Autonomous Region, Urumqi, China
- 3Operating Theater, People’s Hospital of Xinjiang Uygur Autonomous Region, Urumqi, China
Background: Long-term clinical outcomes for patients with osteosarcoma have shown little improvement over the past few decades. Identifying novel molecular targets to inhibit osteosarcoma cell growth remains an urgent challenge.
Methods: Explore the function of mtRNA in the occurrence and development of osteosarcoma utilizing bioinformatics analysis of the Gene Expression Omnibus (GEO) microarray dataset. The Network Analyst tool was used to analyze GSE73120. Differentially expressed genes (DEGs) were identified using GEO2R and analyzed using NetworkAnalyst. Gene Ontology (GO) and Kyoto Encyclopedia of Genes and Genomes (KEGG) enrichment analysis were performed using Metascape and WebGestalt. A protein–protein interaction (PPI) network was constructed through the STRING database and visualized with Cytoscape. The MCODE algorithm was used to identify key modules, and CytoHubba was applied to determine hub genes. Validation of hub genes was conducted using the GEPIA database.
Results: A total of 104 DEGs were identified, including 89 upregulated and 15 downregulated genes. GO and KEGG analyses revealed that these DEGs were enriched in pathways related to connective tissue development, collagen trimer, and extracellular matrix structural components. The PPI network analysis identified seven hub genes. Among them, COL1A1, PDGFRB, and SPARC were confirmed as sarcoma-related genes using the GEPIA database.
Conclusion: Our findings suggest that COL1A1, PDGFRB, and SPARC may be involved in mtRNA-driven tumorigenesis and could serve as promising therapeutic targets for osteosarcoma.
1 Introduction
Osteosarcoma arises from primitive mesenchymal cells that produce osteoid or immature bone. It is the most common primary malignant bone tumor in adolescents and young adults. Incidence peaks between ages 0 and 24, reaching approximately 4.4 cases per million annually in this age group (Mirabello et al., 2009; Ge et al., 2022; Guillon et al., 2011; Xing et al., 2014). Although advanced progress has been made in many fields, such as pathophysiology, tumor immunology, and genetics, long-term clinical outcomes for patients with osteosarcoma have shown no significant improvement during the past few decades (Yu and Yao, 2024; Misaghi et al., 2018; Bernthal et al., 2012). Hence, finding a novel target to inhibit osteosarcoma cell growth is an urgent problem to be solved.
In human cells, mitochondrial RNA (mtRNA) codes 13 essential proteins of the oxidative phosphorylation (OXPHOS) system, along with 22 mitochondrial tRNAs (mt-tRNAs) and 2 mitochondrial RNAs (mt-RNAs) (Taanman, 1999; Jedynak-Slyvka et al., 2021). Crucially, disruption in mtRNA processing or degradation, such as in RNase-mediated cleavage of polycistronic transcripts or failure to remove aberrant RNAs, can impair mitochondrial function at several levels (Wallace, 2012). Poorly processed or unstable mt-mRNAs and mt-tRNAs impair the translation of the 13 mitochondrial-encoded OXPHOS subunits ND1-6, COXI-III, ATP6/8, and CYB, reducing their levels and preventing proper assembly of complexes I–V, particularly I, IV, and V (11). This disruption collapses the proton gradient, sharply diminishing ATP synthesis, and forcing cells to upregulate glycolysis and alternative substrate-level phosphorylation (Seyfried et al., 2020). In cancers such as osteosarcoma, this metabolic shift supports proliferation under hypoxia while increasing reactive oxygen species (ROS), DNA damage, and survival signaling (Tufail et al., 2024). Although similar mtRNA-driven oncogenic mechanisms have been documented in lung and breast cancers (Shapovalov et al., 2011), their specific effects on OXPHOS integrity, ATP production, and tumor cell survival in osteosarcoma remain to be elucidated.
To investigate the role of mtRNA in osteosarcoma, we analyzed the GSE73120 dataset from the Gene Expression Omnibus (GEO) database. This dataset includes gene expression profiles from 143B osteosarcoma cells containing mitochondrial DNA (mtDNA) and their rho-zero counterparts lacking mtDNA. Different expression analysis was performed using the GEO2R tool to identify genes with significant expression differences between the two groups. Gene Ontology (GO) and Kyoto Encyclopedia of Genes and Genomes (KEGG) pathway enrichment analyses were conducted to elucidate the biological functions and pathways associated with the differentially expressed genes (DEGs). A protein–protein interaction (PPI) network was constructed, and the hub genes were acquired using the Maximal Clique Centrality (MCC) and Molecular Complex Detection (MOCDE) algorithm. Finally, the gene expression profiling interactive analysis (GEPIA) database was utilized to assess the expression levels and prognostic significance of the hub genes in sarcoma.
2 Materials and methods
2.1 Data sources
We queried GEO with “osteosarcoma” and “Homo sapiens” and retrieved dataset GSE73120 (Lee et al., 2016), which contains gene expression profiles from 143B osteosarcoma tumors either harboring their endogenous mtDNA or their rho-zero counterparts lacking mtDNA. The data were generated using the GPL10558 Illumina HumanHT-12 V4.0 expression beadchip, enabling genome-wide transcriptomic analysis across both tumor types (Lee et al., 2016).
2.2 Differential expression analysis
DEGs were identified using GEO2R (https://www.ncbi.nlm.nih.gov/geo/geo2r/), a web-based tool that applies the limma and GEOquery R packages to compare gene expression between the mtDNA-proficient (OM) and mtDNA-deficient (WOM) 143B osteosarcoma groups (Love et al., 2014). We considered genes to be significantly differentially expressed if they met the adjusted p-value <0.05 and |log2 fold change (FC)| >1.
2.3 Enrichment analyses
Functional enrichment of DEGs was performed using Metascape (https://metascape.org/gp/index.html#/main/step1) and WebGestalt (http://www.webgestalt.org/), which integrate the GO and KEGG pathway databases (Zhou et al., 2019). The visualization of the results of the enrichment analyses used the Xiantao website (https://www.xiantao.love/). An adjusted p-value <0.05 was considered significant.
2.4 PPI network analysis and the hub genes
The STRING (https://cn.string-db.org/) database was used to construct a PPI network, and Cytoscape v.3.7.1 software was used to visualize the network. A combined score >0.4 was the standard to identify the significant PPIs. Hub genes were identified using the CytoHubba plugin’s MCC algorithm, and network modules were extracted using MCODE.
2.5 Hub gene expression in sarcoma
Hub genes were validated using the GEPIA database (http://gepia.cancer-pku.cn/index.html), which integrates The Cancer Genome Analysis (TCGA) and genotype tissue expression (GTEx) data. We compared expression levels between sarcoma (SARC) and matched normal tissues, assessed overall survival associations, and examined inter-gene correlations using Spearman analysis.
2.6 Statistical analysis
All statistical evaluations were performed using R (version 4.1.0). GEO2R and enrichment tools applied built-in corrections (Benjamini–Hochberg FDR). Spearman’s rank correlation was employed for gene co-expression analysis. A two-tailed p-value <0.05 was considered statistically significant throughout.
3 Results
3.1 Identification of DEGs in GSE73120
Analysis of GSE73120 via GEO2R, with standard standardization (Figure 1A), identified 104 DEGs, comprising 89 upregulated and 15 downregulated genes in mtDNA-proficient versus -deficient 143B osteosarcoma cells (Supplementary Table S1). A volcano plot and a heatmap (Figures 1B,C) demonstrated clear separation between mtRNA-competent and mtRNA-deficient samples based on mitochondrial gene expression patterns.
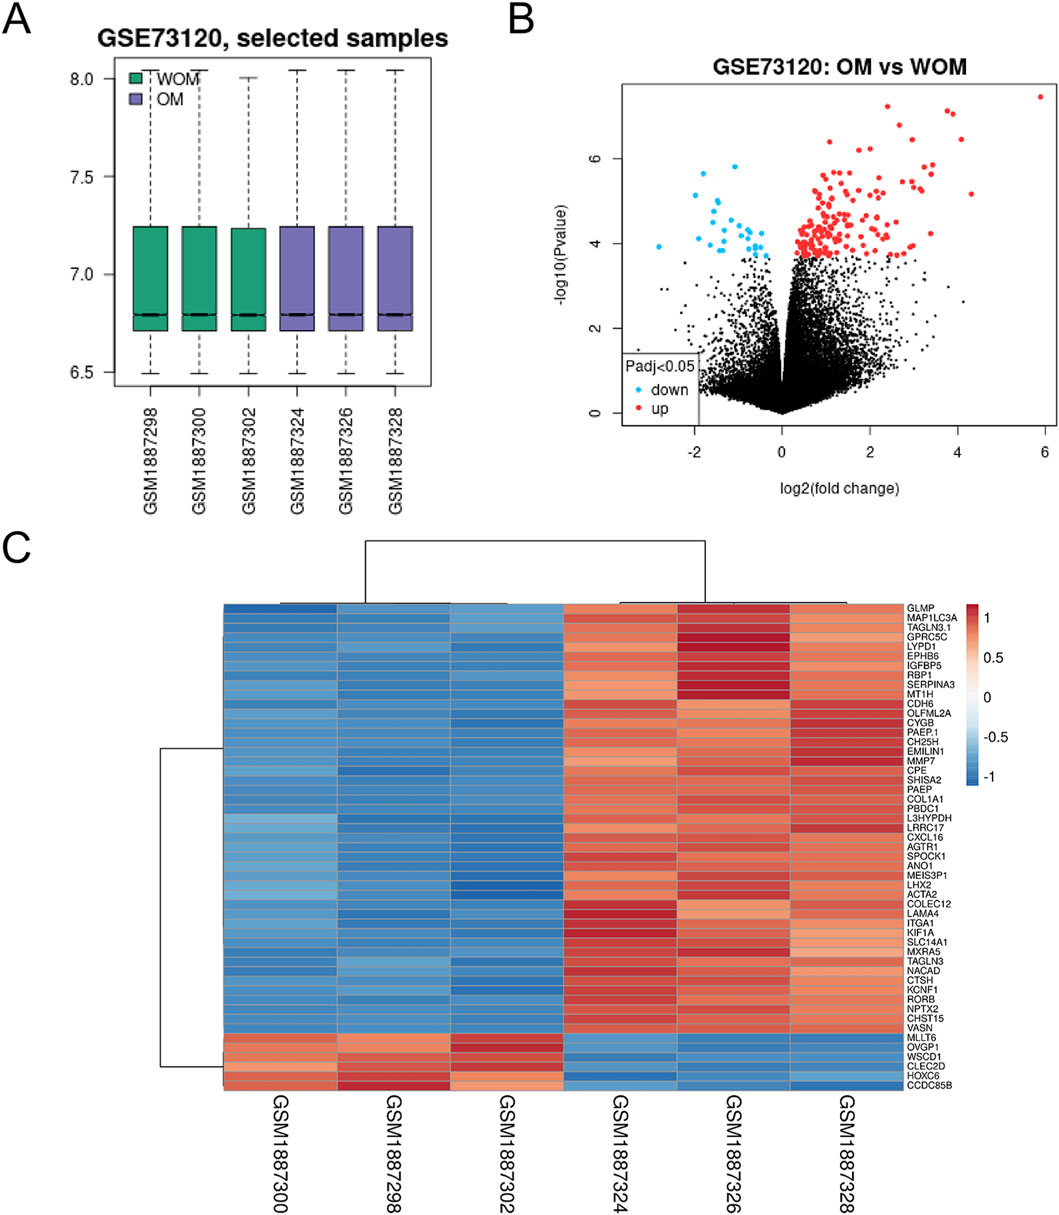
Figure 1. Identification of DEGs in the GSE73120 osteosarcoma dataset. (A) The normalization of the osteosarcoma dataset; (B) volcano plot of gene expression profile data in WOM and OM samples; (C) the heat map of the dataset demonstrated distinguished features between WOM and OM samples.
3.2 Functional enrichment analysis of mitochondria-related DEGs
By uploading the mitochondria-related DEGs into the Xiantao webpage and Metascape, the results of the enrichment analyses indicated that the mitochondria-related DEGs were involved in extracellular matrix structural constituents, regulation of hepatic stellate cell activation, biological regulation, membrane, and protein binding (Figures 2A–D, 3A–C; Supplementary Table S2). Notably, gene set enrichment analysis consistently identified terms related to extracellular matrix and collagen formation (Figures 2E–G, 3A–C).
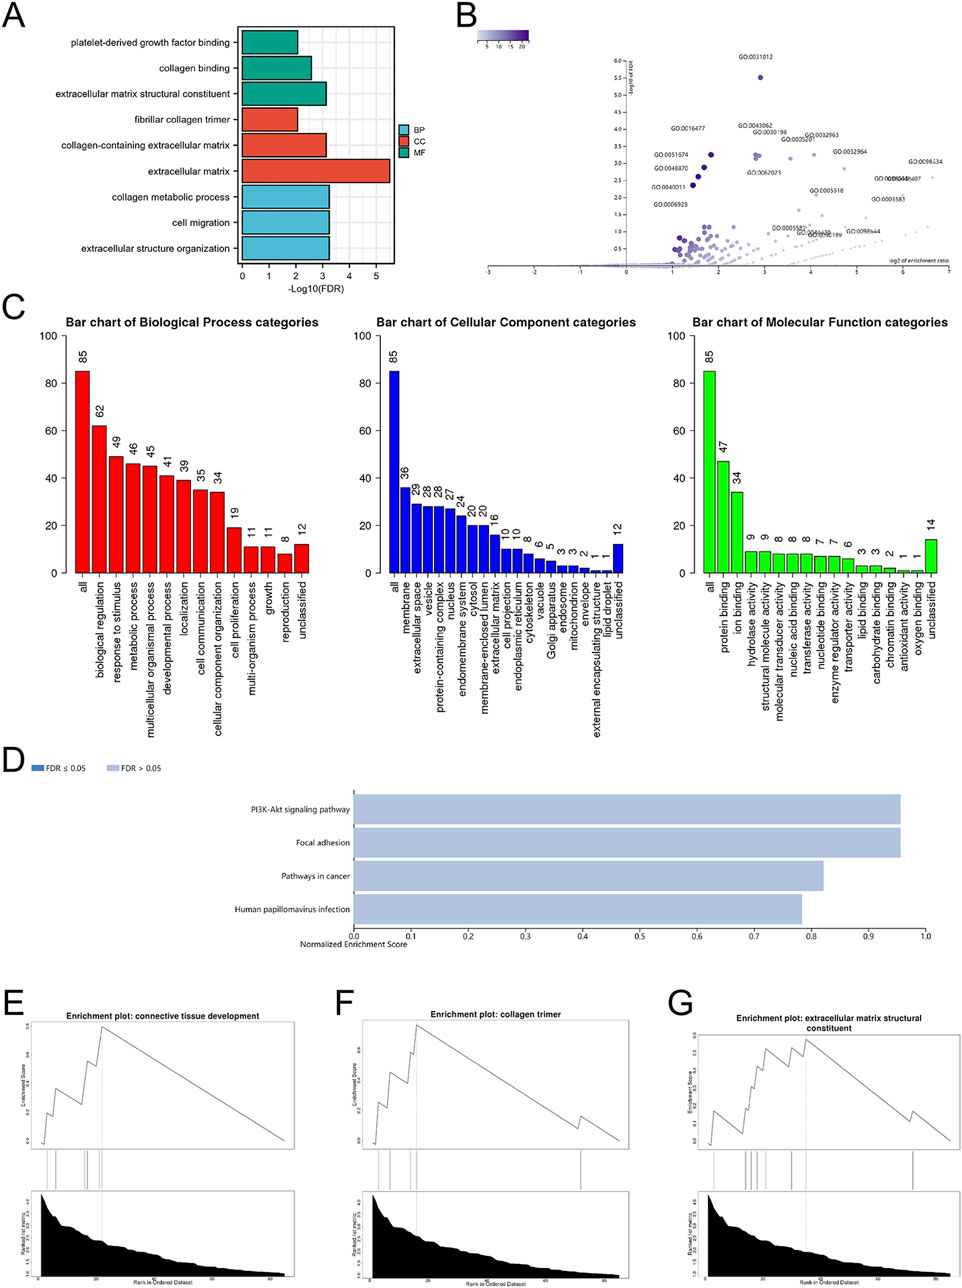
Figure 2. The enrichment pathway analysis of DEGs. (A) The significant GO pathways enriched by DEGs; volcano plot (B) and bar graph (C) of the GO enrichment pathway analysis of DEGs using WebGestalt; (D) bar graph of the KEGG enrichment pathway analysis of DEGs using WebGestalt; the gene set enrichment analysis of DEGs using WebGestalt (E–G).
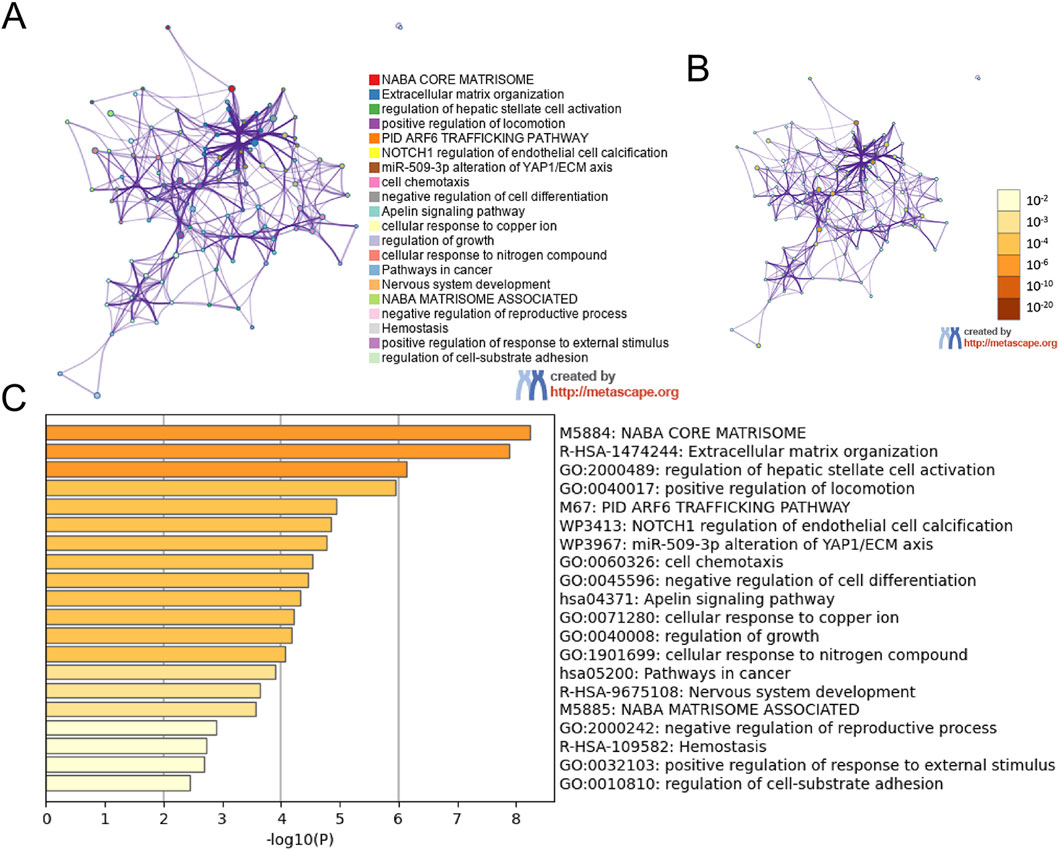
Figure 3. The enrichment pathway analysis of DEGs. The pathways network of DEGs using Metascape: (A) colored by cluster ID, where nodes that share the same cluster ID are typically close to each other; (B) colored by p-value, where terms containing more genes tend to have a more significant p-value; (C) the enrichment pathway analysis of DEGs using Metascape.
3.3 PPI analysis of mitochondria-related DEGs
The PPI network was constructed using STRING and Cytoscape and revealed a densely interconnected module (Figure 4A; Supplementary Table S3), from which CytoHubba’s MCC algorithm ranked COL5A1, ITGA1, PDGFRB, SPARC, COL1A1, ITGA11, LAMA4, ACTA2, COL5A2, and MMP9 as top hub genes (Figure 4B). Further MCODE clustering confirmed COL5A1, ITGA1, PDGFRB, SPARC, COL1A1, LAMA4, and MMP9 as members of a core mitochondrial extracellular matrix-related module. A Venn diagram illustrated the overlap among these candidate hubs (Figure 4C).
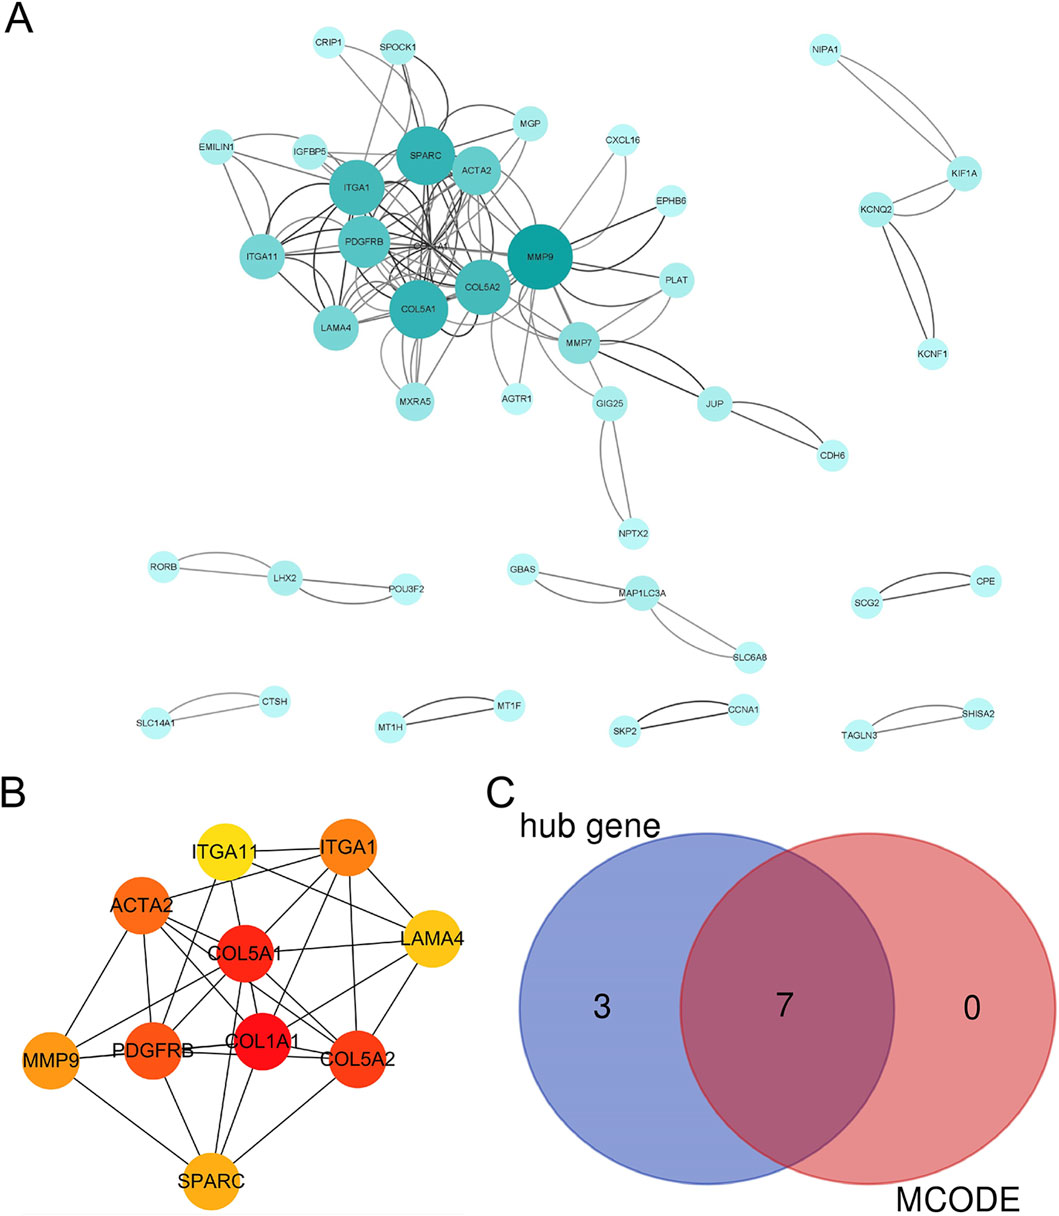
Figure 4. The PPI analysis of DEGs. (A) The PPI analysis of ferroptosis-related DEGs, colored by degree centrality; (B) the top 10 DEGs using MCC; (C) a Venn diagram of DEGs using the MCC and MCODE analysis module.
3.4 Validation of hub gene expression in sarcoma
Gene expression data for sarcoma were extracted and analyzed using the GEPIA database (Figure 5A). Through this analysis, COL1A1, PDGFRB, and SPARC were identified as sarcoma-related genes. Specifically, COL1A1 was found to be highly expressed in 13 tumor types, including breast invasive carcinoma (BRCA), diffuse large B-cell lymphoma (DLBC), esophageal carcinoma (ESCA), glioblastoma multiforme (GBM), head and neck squamous cell carcinoma (HNSC), kidney chromophobe (KICH), liver hepatocellular carcinoma (LIHC), lung adenocarcinoma (LUAD), lung squamous cell carcinoma (LUSC), pancreatic adenocarcinoma (PAAD), stomach adenocarcinoma (STAD), thyroid carcinoma (THCA), and thymoma (THYM). In contrast, low expression of COL1A1 was observed in cervical squamous cell carcinoma and endocervical adenocarcinoma (CESC), as well as uterine corpus endometrial carcinoma (UCEC) (Figure 6A).
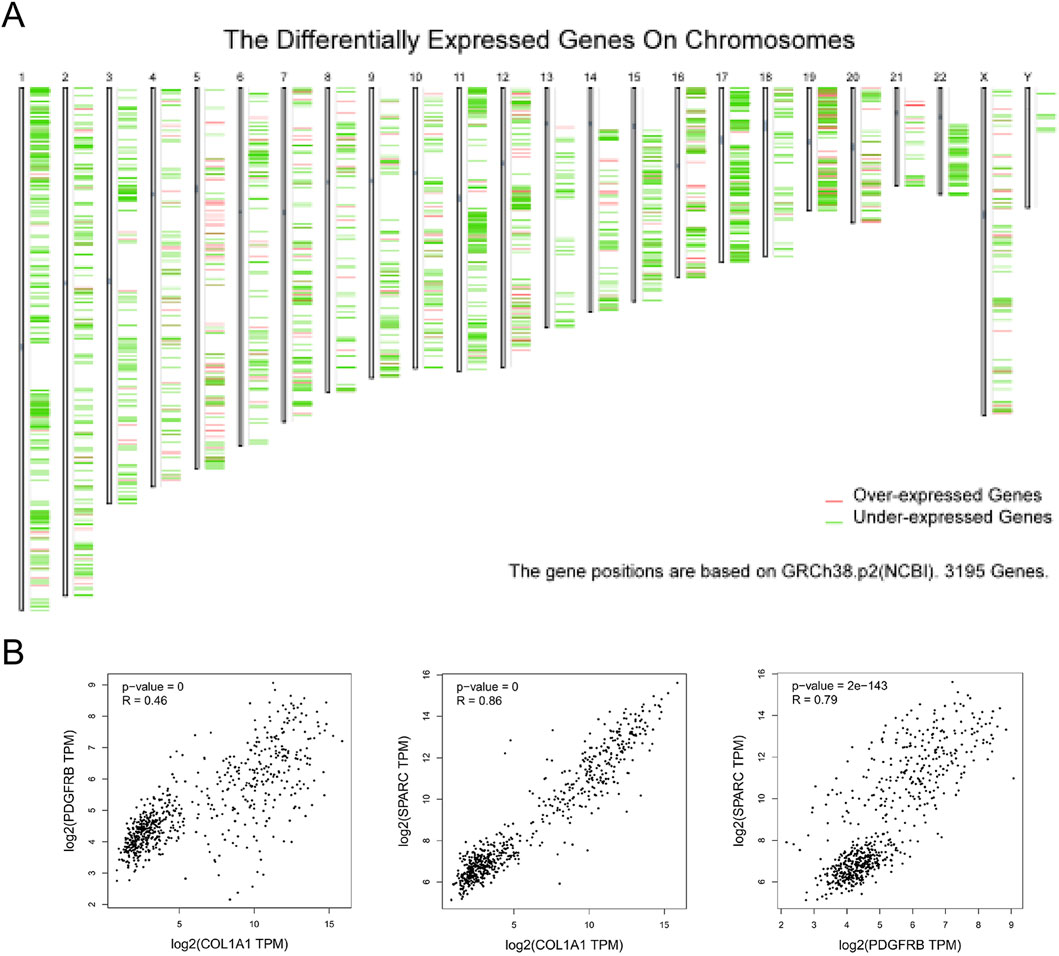
Figure 5. The distribution of differently expressed genes and their correlation in SARC. (A) The distribution of differently expressed genes on chromosomes in SARC; (B) the correlation among three hub genes.

Figure 6. COL1A1 expression in cancer. (A) COL1A1 expression profile across all tumor samples and paired normal tissues in TCGA; (B) the overall survival analysis of COL1A1 expression in SARC; (C) expression of COL1A1 in SARC on box plots; (D) the median expression of tumor and normal samples in BodyMap. Red, tumor samples; green, normal samples.
PDGFRB exhibited high expression in six tumor cell lines, including DLBC, HNSC, LIHC, PAAD, STAD, and THYM, and low expression in 12 tumor cell lines, including adrenocortical carcinoma (ACC), bladder urothelial carcinoma (BLCA), KICH, kidney renal papillary cell carcinoma (KIRP), LUAD, LUSC, ovarian serous cystadenocarcinoma (OV), prostate adenocarcinoma (PRAD), skin cutaneous melanoma (SKCM), THCA, UCEC, and uterine carcinosarcoma (UCS) (Figure 7A).
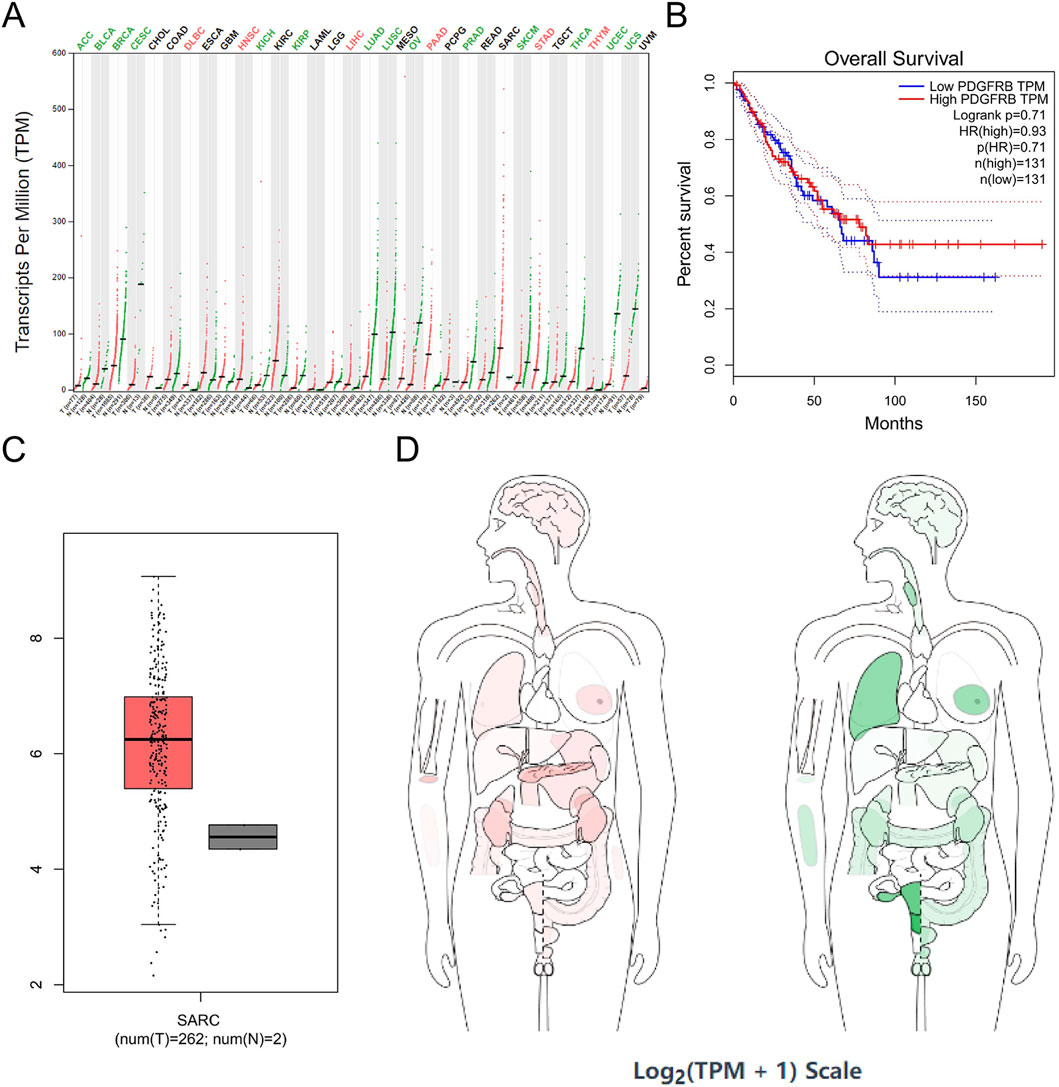
Figure 7. PDGFRB expression in cancer. (A) PDGFRB expression profile across all tumor samples and paired normal tissues in TCGA; (B) the overall survival analysis of PDGFRB expression in SARC; (C) expression of PDGFRB in SARC on box plots; (D) the median expression of tumor and normal samples in BodyMap. Red, tumor samples; green, normal samples.
SPARC was highly expressed in 15 tumor cell lines, such as ACC, BRCA, colon adenocarcinoma (COAD), DLBC, ESCA, GBM, HNSC, kidney renal clear cell carcinoma (KIRC), brain lower-grade glioma (LGG), LIHC, PAAD, rectum adenocarcinoma (READ), SKCM, STAD, and THYM, and was expressed at a low level in UCEC (Figure 8A). In addition, correlation analysis among COL1A1, PDGFRB, and SPARC revealed a significant interrelationship (Figure 5B). However, survival analysis indicated that the expression levels of these genes did not significantly influence the overall survival (OS) in sarcoma patients (Figures 6B,7B,8B, , ). Moreover, analysis of paired tumor and normal tissue samples showed no significant differential expression of COL1A1, PDGFRB, and SPARC (Figures 6C,7C,8C,D, , ).
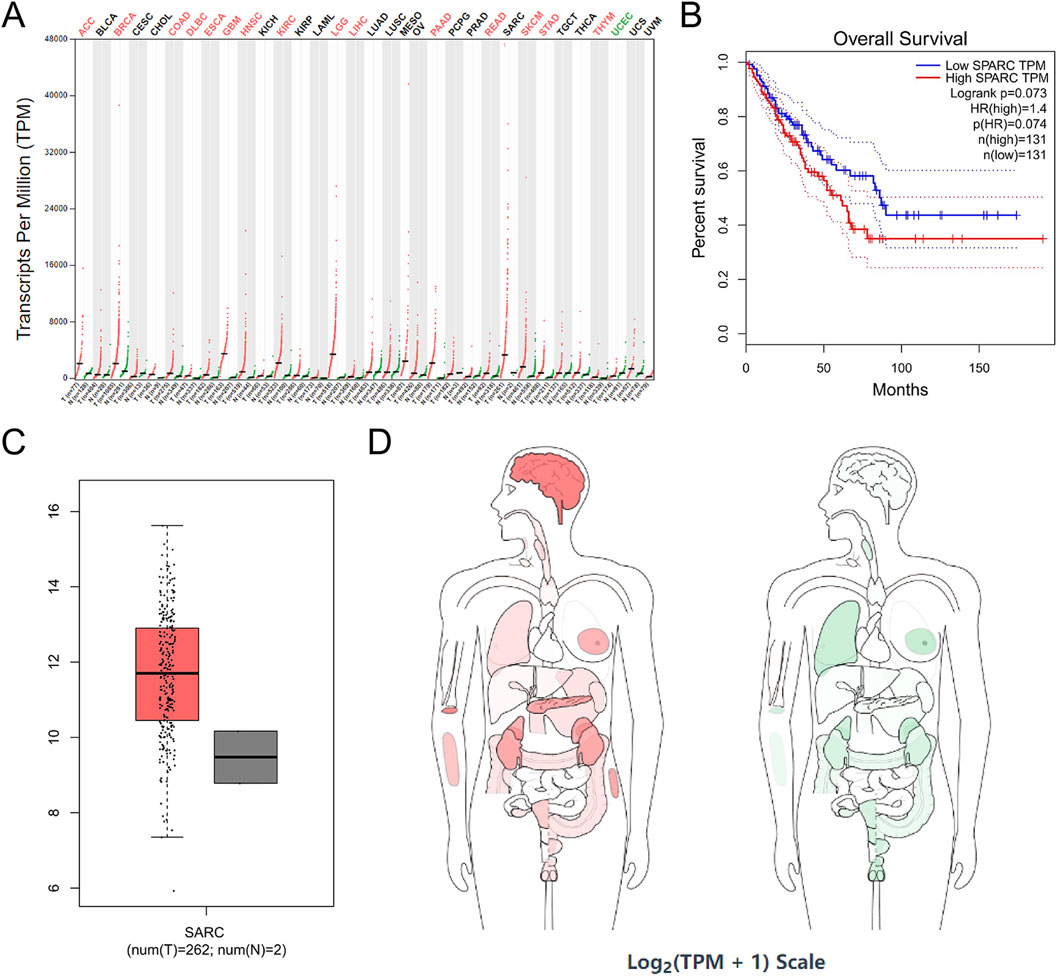
Figure 8. SPARC expression in cancer. (A) SPARC expression profile across all tumor samples and paired normal tissues in TCGA; (B) the overall survival analysis of SPARC expression in SARC; (C) expression of SPARC in SARC on box plots; (D) the median expression of tumor and normal samples in BodyMap. Red, tumor samples; green, normal samples.
4 Discussion
Mitochondria, the cell’s powerhouses, generate ATP through oxidative OXPHOS, relying critically on mitochondrial RNA (mtRNA) for expression of OXPHOS components. Notably, osteosarcoma is characterized by increased OXPHOS and ATP production, which correlate with increased cell migration and aggressive phenotypes (Huan et al., 2024; Han et al., 2021; Yu et al., 2021). Han et al. reported that RNA polymerase mitochondrial (POLRMT), essential for mtRNA transcription, is significantly upregulated in osteosarcoma, and its inhibition impairs mtRNA synthesis, mitochondrial function, and tumor growth (Huan et al., 2024; Han et al., 2021; Yu et al., 2021; Li et al., 2023; Kong et al., 2024). To further investigate the role of mtRNA in osteosarcoma, we analyzed the mitochondria-related dataset GSE73120, aiming to clarify how mtRNA abundance influences mitochondrial dynamics and tumor progression.
Analysis of the GSE73120 dataset identified 104 differentially expressed genes, comprising 89 upregulated and 15 downregulated transcripts. GO and KEGG analyses revealed that mitochondria-related DEGs are enriched in biological processes and cellular components such as connective tissue development, collagen trimers, and extracellular matrix (ECM) structural constituents. A subsequent PPI network, analyzed using MCC and MCODE algorithms, highlighted COL5A1, ITGA1, PDGFRB, SPARC, COL1A1, LAMA4, and MMP9 as central hub genes. We further validated these candidates via the GEPIA database, narrowing down to COL1A1, PDGFRB, and SPARC as the most significantly associated with osteosarcoma progression. These data support the involvement of COL1A1, PDGFRB, and SPARC in mtRNA-driven tumorigenesis in osteosarcoma.
COL1A1, encoding the pro-alpha1 chains of type I collagen, which is a fibril-forming collagen abundant in bone, cornea, dermis, and tendon, has also been linked to mitochondrial homeostasis (Dalgleish et al., 2008). In non-cancer models, COL1A1 knockdown increases reactive oxygen species (ROS) and disrupts mitochondrial membrane potential (ΔΨm) (Yuan et al., 2020; Fu et al., 2019). This finding suggests that reduced COL1A1 expression may exacerbate mitochondrial stress initiated by mtRNA depletion, creating a vicious cycle of oxidative damage and energy imbalance in osteosarcoma cells. Building on this concept of mitochondrial dysfunction, PDGFRB emerges as a key mediator of metabolic adaptation. PDGFRB encodes a cell-surface tyrosine kinase receptor that, in osteosarcoma HOS cells, drives aerobic glycolysis through the PI3K/AKT/mTOR/c-Myc pathway while preserving ΔΨm (Tang et al., 2022; An et al., 2024; Xiang et al., 2023). Therefore, when mtRNA is depleted in 143B cells, diminished PDGFRB expression not only impairs this glycolytic shift but also leaves cells unable to compensate for reduced oxidative phosphorylation. Moreover, mitochondrial dysfunction itself may feedback to suppress PDGFRB transcription via reduced mTOR/Akt signaling (Zhang et al., 2007), reinforcing energy stress and inhibiting proliferation under hypoxic conditions.
Extending beyond intracellular metabolism, SPARC serves as a bridge between mitochondrial health and ECM dynamics (Wei et al., 2012; McCurdy et al., 2011). SPARC is a cysteine-rich, acidic matrix-associated glycoprotein that, in C2C12 myoblasts, upregulates mitochondrial proteins UQCRC2 and SDHB via the ILK/AMPK pathway (Melouane et al., 2019; Melouane et al., 2018; Cai et al., 2023) and participates in the mitochondrial unfolded protein response under stress (Gaspar et al., 2023). In mtRNA-deficient 143B tumors, reduced SPARC expression could, therefore, disrupt ECM-mitochondria crosstalk, weaken quality control mechanisms, and facilitate invasive behavior through altered matrix remodeling. These observations support an integrated model: mtRNA loss undermines mitochondrial protein synthesis and function, which in turn suppresses COL1A1, PDGFRB, and SPARC through distinct but interconnected pathways. The downregulation of COL1A1 amplifies ROS and ΔΨm collapse, decreased PDGFRB limits glycolytic compensation, and reduced SPARC disrupts ECM-mitochondria signaling. Collectively, this network drives oxidative stress, metabolic imbalance, and matrix remodeling, promoting osteosarcoma progression under conditions of mitochondrial stress.
5 Limitations
This study has limitations. First, pathway enrichment analyses such as GO and KEGG, while informative, may produce false negatives or biased results due to underlying method assumptions and gene correlations (Ge et al., 2022; Tamayo et al., 2016; Glass and Girvan, 2014; Qiu et al., 2021). Consequently, some mitochondrial-related loci adjacent to our identified DEGs may have been overlooked. Second, the sample size of the GSE73120 dataset (143B mtDNA-proficient and rho tumors) was limited, reducing statistical power and generalizability. Finally, although we identified COL1A1, PDGFRB, and SPARC as potential mediators of mtRNA-driven tumorigenesis, experimental validation remains essential. Functional studies, such as loss-and gain-of-function assays, metabolic and ROS measurements, and in vivo xenografts, will be crucial to establish causal links and assess therapeutic potential.
6 Conclusion
Our analysis of GSE73120 revealed 104 DEGs enriched in extracellular matrix-related pathways, notably connective tissue development and collagen trimer formation. Network analysis and GEPIA validation highlighted COL1A1, PDGFRB, and SPARC as central hub genes linked to mtRNA-dependent tumorigenesis. We propose a model in which mtRNA depletion triggers mitochondrial dysfunction, leading to suppression of these three genes, accumulation of ROS, energetic imbalance, and ECM remodeling, thereby promoting osteosarcoma progression. These insights lay the groundwork for future functional studies and potential therapeutic targeting in mtRNA-related osteosarcoma.
Data availability statement
The original contributions presented in the study are included in the article/Supplementary Material, further inquiries can be directed to the corresponding author.
Author contributions
XM: Conceptualization, Data curation, Formal Analysis, Investigation, Methodology, Project administration, Resources, Software, Supervision, Validation, Visualization, Writing – original draft, Writing – review and editing. ZH: Conceptualization, Data curation, Formal Analysis, Funding acquisition, Investigation, Methodology, Project administration, Resources, Software, Supervision, Validation, Visualization, Writing – original draft, Writing – review and editing. WY: Data curation, Formal Analysis, Investigation, Resources, Software, Validation, Visualization, Writing – original draft, Writing – review and editing. ZW: Data curation, Formal Analysis, Investigation, Resources, Software, Validation, Visualization, Writing – original draft, Writing – review and editing. LM: Data curation, Formal Analysis, Investigation, Resources, Software, Validation, Visualization, Writing – original draft, Writing – review and editing. HL: Data curation, Formal Analysis, Investigation, Resources, Software, Validation, Visualization, Writing – original draft, Writing – review and editing.
Funding
The author(s) declare that financial support was received for the research and/or publication of this article. This work was supported by grants obtained from the Natural Science Foundation of Xinjiang Uygur Autonomous Region (2022D01C139).
Conflict of interest
The authors declare that the research was conducted in the absence of any commercial or financial relationships that could be construed as a potential conflict of interest.
Generative AI statement
The author(s) declare that no Generative AI was used in the creation of this manuscript.
Any alternative text (alt text) provided alongside figures in this article has been generated by Frontiers with the support of artificial intelligence and reasonable efforts have been made to ensure accuracy, including review by the authors wherever possible. If you identify any issues, please contact us.
Publisher’s note
All claims expressed in this article are solely those of the authors and do not necessarily represent those of their affiliated organizations, or those of the publisher, the editors and the reviewers. Any product that may be evaluated in this article, or claim that may be made by its manufacturer, is not guaranteed or endorsed by the publisher.
Supplementary material
The Supplementary Material for this article can be found online at: https://www.frontiersin.org/articles/10.3389/fgene.2025.1588581/full#supplementary-material
SUPPLEMENTARY TABLE 1 | Identification of de-expressed genes in GSE7312.
SUPPLEMENTARY TABLE 2 | Functional enrichment analyses of DEGs.
SUPPLEMENTARY TABLE 3 | PPI network analysis of DEGs.
Abbreviations
DEGs, different expression genes; GEO, Gene Expression Omnibus; mtRNA, mitochondrial RNA; NCBI, National Center of Biotechnology Information.
References
An, F., Chang, W., Song, J., Zhang, J., Li, Z., Gao, P., et al. (2024). Reprogramming of glucose metabolism: metabolic alterations in the progression of osteosarcoma. J. Bone Oncol. 44, 100521. doi:10.1016/j.jbo.2024.100521
Bernthal, N. M., Federman, N., Eilber, F. R., Nelson, S. D., Eckardt, J. J., Eilber, F. C., et al. (2012). Long-term results (>25 years) of a randomized, prospective clinical trial evaluating chemotherapy in patients with high-grade, operable osteosarcoma. Cancer 118 (23), 5888–5893. doi:10.1002/cncr.27651
Cai, L., Shi, L., Peng, Z., Sun, Y., and Chen, J. (2023). Ageing of skeletal muscle extracellular matrix and mitochondria: finding a potential link. Ann. Med. 55 (2), 2240707. doi:10.1080/07853890.2023.2240707
Dalgleish, T., Rolfe, J., Golden, A. M., Dunn, B. D., and Barnard, P. J. (2008). Reduced autobiographical memory specificity and posttraumatic stress: exploring the contributions of impaired executive control and affect regulation. J. Abnorm. Psychol. 117 (1), 236–241. doi:10.1037/0021-843X.117.1.236
Fu, X. H., Chen, C. Z., Wang, Y., Peng, Y. X., Wang, W. H., Yuan, B., et al. (2019). COL1A1 affects apoptosis by regulating oxidative stress and autophagy in Bovine cumulus cells. Theriogenology 139, 81–89. doi:10.1016/j.theriogenology.2019.07.024
Gaspar, R. S., Katashima, C. K., Crisol, B. M., Carneiro, F. S., Sampaio, I., Silveira, L. D. R., et al. (2023). Physical exercise elicits UPR(mt) in the skeletal muscle: the role of c-Jun N-terminal kinase. Mol. Metab. 78, 101816. doi:10.1016/j.molmet.2023.101816
Ge, W., Yue, M., Wang, Y., Wang, Y., Xue, S., Shentu, D., et al. (2022). A novel molecular signature of cancer-associated fibroblasts predicts prognosis and immunotherapy response in pancreatic cancer. Int. J. Mol. Sci. 24 (1), 156. doi:10.3390/ijms24010156
Glass, K., and Girvan, M. (2014). Annotation enrichment analysis: an alternative method for evaluating the functional properties of gene sets. Sci. Rep. 4, 4191. doi:10.1038/srep04191
Guillon, M. A., Mary, P. M., Brugière, L., Marec-Bérard, P., Pacquement, H. D., Schmitt, C., et al. (2011). Clinical characteristics and prognosis of osteosarcoma in young children: a retrospective series of 15 cases. BMC Cancer 11, 407. doi:10.1186/1471-2407-11-407
Han, Q. C., Zhang, X. Y., Yan, P. H., Chen, S. F., Liu, F. F., Zhu, Y. R., et al. (2021). Identification of mitochondrial RNA polymerase as a potential therapeutic target of osteosarcoma. Cell Death Discov. 7 (1), 393. doi:10.1038/s41420-021-00780-x
Huan, M. J., Fu, P. P., Chen, X., Wang, Z. X., Ma, Z. R., Cai, S. Z., et al. (2024). Identification of the central role of RNA polymerase mitochondrial for angiogenesis. Cell Commun. Signal 22 (1), 343. doi:10.1186/s12964-024-01712-9
Jedynak-Slyvka, M., Jabczynska, A., and Szczesny, R. J. (2021). Human mitochondrial RNA processing and modifications: overview. Int. J. Mol. Sci. 22 (15), 7999. doi:10.3390/ijms22157999
Kong, Y., Li, X., Zhang, H., Fu, B., Jiang, H. Y., Yang, H. L., et al. (2024). Targeting POLRMT by a first-in-class inhibitor IMT1 inhibits osteosarcoma cell growth in vitro and in vivo. Cell Death Dis. 15 (1), 57. doi:10.1038/s41419-024-06444-9
Lee, W. T., Cain, J. E., Cuddihy, A., Johnson, J., Dickinson, A., Yeung, K. Y., et al. (2016). Mitochondrial DNA plasticity is an essential inducer of tumorigenesis. Cell Death Discov. 2, 16016. doi:10.1038/cddiscovery.2016.16
Li, X., Yao, L., Wang, T., Gu, X., Wu, Y., and Jiang, T. (2023). Identification of the mitochondrial protein POLRMT as a potential therapeutic target of prostate cancer. Cell Death Dis. 14 (10), 665. doi:10.1038/s41419-023-06203-2
Love, M. I., Huber, W., and Anders, S. (2014). Moderated estimation of fold change and dispersion for RNA-seq data with DESeq2. Genome Biol. 15 (12), 550. doi:10.1186/s13059-014-0550-8
McCurdy, S. M., Dai, Q., Zhang, J., Zamilpa, R., Ramirez, T. A., Dayah, T., et al. (2011). SPARC mediates early extracellular matrix remodeling following myocardial infarction. Am. J. Physiol. Heart Circ. Physiol. 301 (2), H497–H505. doi:10.1152/ajpheart.01070.2010
Melouane, A., Carbonell, A., Yoshioka, M., Puymirat, J., and St-Amand, J. (2018). Implication of SPARC in the modulation of the extracellular matrix and mitochondrial function in muscle cells. PLoS One 13 (2), e0192714. doi:10.1371/journal.pone.0192714
Melouane, A., Yoshioka, M., Kanzaki, M., and St-Amand, J. (2019). Sparc, an EPS-induced gene, modulates the extracellular matrix and mitochondrial function via ILK/AMPK pathways in C2C12 cells. Life Sci. 229, 277–287. doi:10.1016/j.lfs.2019.05.070
Mirabello, L., Troisi, R. J., and Savage, S. A. (2009). Osteosarcoma incidence and survival rates from 1973 to 2004: data from the Surveillance, Epidemiology, and End Results Program. Cancer 115 (7), 1531–1543. doi:10.1002/cncr.24121
Misaghi, A., Goldin, A., Awad, M., and Kulidjian, A. A. (2018). Osteosarcoma: a comprehensive review. Sicot J. 4, 12. doi:10.1051/sicotj/2017028
Qiu, Z., Du, X., Chen, K., Dai, Y., Wang, S., Xiao, J., et al. (2021). Gene signatures with predictive and prognostic survival values in human osteosarcoma. PeerJ 9, e10633. doi:10.7717/peerj.10633
Seyfried, T. N., Arismendi-Morillo, G., Mukherjee, P., and Chinopoulos, C. (2020). On the origin of ATP synthesis in cancer. iScience 23 (11), 101761. doi:10.1016/j.isci.2020.101761
Shapovalov, Y., Hoffman, D., Zuch, D., de Mesy Bentley, K. L., and Eliseev, R. A. (2011). Mitochondrial dysfunction in cancer cells due to aberrant mitochondrial replication. J. Biol. Chem. 286 (25), 22331–22338. doi:10.1074/jbc.M111.250092
Taanman, J. W. (1999). The mitochondrial genome: structure, transcription, translation and replication. Biochim. Biophys. Acta 1410 (2), 103–123. doi:10.1016/s0005-2728(98)00161-3
Tamayo, P., Steinhardt, G., Liberzon, A., and Mesirov, J. P. (2016). The limitations of simple gene set enrichment analysis assuming gene Independence. Stat. Methods Med. Res. 25 (1), 472–487. doi:10.1177/0962280212460441
Tang, H. Y., Guo, J. Q., Sang, B. T., Cheng, J. N., and Wu, X. M. (2022). PDGFRβ modulates aerobic glycolysis in osteosarcoma HOS cells via the PI3K/AKT/mTOR/c-Myc pathway. Biochem. Cell Biol. 100 (1), 75–84. doi:10.1139/bcb-2021-0305
Tufail, M., Jiang, C. H., and Li, N. (2024). Altered metabolism in cancer: insights into energy pathways and therapeutic targets. Mol. Cancer 23 (1), 203. doi:10.1186/s12943-024-02119-3
Wallace, D. C. (2012). Mitochondria and cancer. Nat. Rev. Cancer 12 (10), 685–698. doi:10.1038/nrc3365
Wei, H. Y., Liu, J. L., Lv, B. J., Xing, L., and Fu, S. Y. (2012). SPARC modulates expression of extracellular matrix genes in human trabecular meshwork cells. Acta Ophthalmol. 90 (2), e138–e143. doi:10.1111/j.1755-3768.2011.02283.x
Xiang, Y., Yang, Y., Liu, J., and Yang, X. (2023). Functional role of MicroRNA/PI3K/AKT axis in osteosarcoma. Front. Oncol. 13, 1219211. doi:10.3389/fonc.2023.1219211
Xing, D., Qasem, S. A., Owusu, K., Zhang, K., Siegal, G. P., and Wei, S. (2014). Changing prognostic factors in osteosarcoma: analysis of 381 cases from two institutions. Hum. Pathol. 45 (8), 1688–1696. doi:10.1016/j.humpath.2014.04.010
Yu, S., and Yao, X. (2024). Advances on immunotherapy for osteosarcoma. Mol. Cancer 23 (1), 192. doi:10.1186/s12943-024-02105-9
Yu, H. J., Xiao, G. L., Zhao, Y. Y., Wang, X. X., and Lan, R. (2021). Targeting mitochondrial metabolism and RNA polymerase POLRMT to overcome multidrug resistance in cancer. Front. Chem. 9, 775226. doi:10.3389/fchem.2021.775226
Yuan, M., Gong, M., Zhang, Z., Meng, L., Tse, G., Zhao, Y., et al. (2020). Hyperglycemia induces endoplasmic reticulum stress in atrial cardiomyocytes, and Mitofusin-2 downregulation prevents mitochondrial dysfunction and subsequent cell death. Oxid. Med. Cell Longev. 2020, 6569728. doi:10.1155/2020/6569728
Zhang, H., Bajraszewski, N., Wu, E., Wang, H., Moseman, A. P., Dabora, S. L., et al. (2007). PDGFRs are critical for PI3K/Akt activation and negatively regulated by mTOR. J. Clin. Invest 117 (3), 730–738. doi:10.1172/JCI28984
Keywords: osteosarcoma, mtRNA, hub genes, bioinformatics analysis, COL1A1
Citation: Meng X, Han Z, Yeerken W, Wang Z, Ma L and Liu H (2025) Uncovering differential gene expression between mtRNA-positive and -negative osteosarcoma cells: implications beyond mitochondrial function. Front. Genet. 16:1588581. doi: 10.3389/fgene.2025.1588581
Received: 20 March 2025; Accepted: 11 August 2025;
Published: 17 September 2025.
Edited by:
Weihang Li, Fourth Military Medical University, ChinaReviewed by:
Feng Gao, The Sixth Affiliated Hospital of Sun Yat-sen University, ChinaFederica Scotto di Carlo, National Research Council (CNR), Italy
Copyright © 2025 Meng, Han, Yeerken, Wang, Ma and Liu. This is an open-access article distributed under the terms of the Creative Commons Attribution License (CC BY). The use, distribution or reproduction in other forums is permitted, provided the original author(s) and the copyright owner(s) are credited and that the original publication in this journal is cited, in accordance with accepted academic practice. No use, distribution or reproduction is permitted which does not comply with these terms.
*Correspondence: Zhongcheng Han, MjQ2NTQzMTc4MUBxcS5jb20=