 Binbin Du1†
 Qifei Wang2†
 Song Gao2Fan Yang3Lei Zhang3Xiao Zhang3Dongao Huo3Jia Wu1Xingen Zhang1Fang Li1Baowei Lu1*Fengxia An1*
- 1College of Biotechnology and Pharmaceutical Engineering, West Anhui University, Lu’an, Anhui, China
- 2Institute of Crop and Nuclear Technology Utilization, Zhejiang Academy of Agricultural Sciences, Hangzhou, Zhejiang, China
- 3College of Biological Sciences and Technology, Taiyuan Normal University, Taiyuan, Shanxi, China
As an important food crop and nutritional source, mungbean has prioritized yield improvement as a key objective in breeding programs. In present study, we conducted a QTL meta-analysis to integrate 660 QTLs related to yield and yield-related traits in mungbean published over the past 20 years. A total of 590 initial QTLs were mapped onto a high-density consensus map, resulting in the identification of 72 meta-QTLs (MQTLs). These MQTLs were unevenly distributed across 11 linkage groups (LGs) with an average confidence interval (CI) of 1.21 cM, which was 6.26-fold narrower than the average CI of the initial QTLs. Among these 72 MQTLs, 20 were validated in a genome-wide association study (GWAS) for yield and yield-related traits in mungbean. Orthologous MQTL analysis revealed that 22 mungbean MQTLs were collinear with 19 MQTLs in common bean for yield and yield-related traits. In addition, 20 breeder’s MQTLs were screened from the 72 MQTLs, and 339 gene models were identified within the breeder’s MQTL regions. Twenty-two mungbean orthologs of yield-related genes such as seed germination, tiller number, and plant height in rice and Arabidopsis were identified in the breeder’s MQTL regions using homology analysis. This study contributes to understanding the genetic mechanisms for yield and yield-related traits and provides new ideas for the genetic improvement and breeding of mungbean.
Introduction
Mungbean (Vigna radiata L.), as one of the most important legumes, provides a vital source of nutrition for human beings due to its high protein and carbohydrate content (Somta et al., 2007). Additionally, mungbean is widely cultivated for both food and medicinal purposes, owing to its health benefits such as clearing heat and toxins and quenching thirst (Tang et al., 2014). The low yield of mungbean, with an average grain yield of only about 700 kg per hectare (Islam et al., 2014), coupled with its lower economic returns compared to traditional crops, has led to a gradual decline in its cultivation area. This yield stagnation is exacerbated by global challenges such as insect pests, diseases (e.g., mungbean yellow mosaic virus and bruchid infestations), and environmental stresses including drought and soil salinity, which disproportionately affect smallholder farmers in Asia and Africa (Pandey et al., 2018). This trend has seriously affected the development of the mungbean cultivation industry in China and other major producing countries like India and Myanmar, where climate variability further threatens production stability (Nair et al., 2019). Therefore, improving yield remains a key objective of mungbean breeding (Nair and Schreinemachers, 2020). In mungbean, grain yield is influenced not only by the number of pods per plant, number of grains per pod, and the 100-grain weight traits, but also by plant height, number of branches, pod morphology, leaf morphology, and fertility period are also important factors affecting mungbean yield (Ahmad and Belwal, 2020).
Understanding the genetic basis of yield and yield-related traits is essential for genetic improvement and achieving breeding goals in mungbean. To date, several studies have employed linkage analysis in mungbean to identify quantitative trait loci (QTL) for yield-related traits such as 100-grain weight, pod length, plant height, and grain morphology (Humphry et al., 2005; Isemura et al., 2012; Liu et al., 2017; Ye et al., 2021; Vu et al., 2022). Nevertheless, the results of QTL linkage analyses based on segregating populations are susceptible to various factors, including the types and densities of markers used to construct genetic maps, parental selection, the types and sizes of mapping populations, the experimental environments, and differences in statistical analysis methods (Zhang et al., 2017). Notably, although numerous QTLs can be identified in segregating populations, most of them are minor-effect QTLs with relatively low stability and reliability (Brachi et al., 2010), which limits their application in molecular-assisted selection (MAS) and gene cloning.
In addition to QTL linkage analysis, genome-wide association studies (GWAS) have also been employed as a reliable technique for identifying candidate genes associated with complex quantitative traits in mungbean (Breria et al., 2020; Liu J. H. et al., 2022; Chang et al., 2023; Manjunatha et al., 2023). The mutual validation of quantitative traits using both QTL linkage analysis and GWAS has led to the discovery of key loci for the target trait in several studies (Zhang et al., 2019; Song et al., 2020; Wei et al., 2021), such as the identification of QTrl.saw-2D.2, an important QTL controlling root length, through linkage and association analyses in wheat (Zheng et al., 2019). This indicates that combining QTL linkage analysis and GWAS results is beneficial in identifying key genomic regions for important yield traits in mungbean.
QTL meta-analysis is a statistical genetics approach integrating multiple QTL datasets via a consensus genetic map, which integrates QTL results from different mapping populations, traits, and environments through statistical methods to identify the consistency and validity of the QTLs to obtain meta-QTLs (MQTL) (Goffinet and Gerber, 2000; Sosnowski et al., 2012). In recent years, QTL meta-analysis has been applied to multiple crops for different quantitative traits, such as grain quality traits, flag leaf morphology and yield-related traits in wheat (Yang et al., 2021; Du et al., 2022; Gudi et al., 2022; Saini et al., 2022; Vasistha et al., 2024), grain weight, resistance, and yield-related traits in rice (Khahani et al., 2020; Li et al., 2020; Anilkumar et al., 2022), popping traits, root-related traits and grain yield traits in maize (Pan et al., 2017; Guo et al., 2018; Kumar et al., 2021), and grain quality traits, resistance and yield-related traits in barley (Akbari et al., 2022; Du et al., 2024a; Du et al., 2024b). Meanwhile, QTL meta-analysis was performed for certain agronomic traits in legume crops, such as grain quality traits in soybean (Chen et al., 2021) and grain quality traits and yield-related traits in pigeonpea (Halladakeri et al., 2023). However, QTL meta-analysis for mungbean has not yet been reported. This study represents the first effort to integrate QTL data from various studies to identify MQTL for yield and yield-related traits in mungbean.
In this study, a QTL meta-analysis was conducted based on 18 QTL studies focused on yield and yield-related traits in mungbean to identify MQTLs and candidate genes associated with yield and yield-related traits such as 100-grain weight, plant height, grain morphology, fertility, and pod morphology. The main objectives of this study were (i) to identify stable and reliable MQTLs for yield and yield-related traits in mungbean; (ii) to compare GWAS results for yield and yield-related traits in mungbean with MQTLs; (iii) to identify orthologous MQTL by comparing synteny and colinearity among mungbean, soybean, and pigeonpea; and (iv) to identify prospective candidate genes within the breeder’s MQTL regions.
Materials and methods
Construction of consensus genetic maps and QTL meta-analysis
A high-density consensus genetic map was generated by integrating seven reference genetic maps using the R package LPmerge (Endelman and Plomion, 2014). The detailed LPmerge code is listed in Supplementary Data S1. The integrated maps included: (i) “Mungbean-Berken × ACC41-RIL” (Humphry et al., 2005); (ii) “Mungbean-JP211874 × JP229096-BC1F1” (Isemura et al., 2012); (iii) “Mungbean-Berken × ACC41-RIL” (Wu et al., 2014); (iv) “Mungbean-VC2917 × ZL-RIL” (Liu et al., 2017); (v) “Mungbean-Huaye1 × Zijing1-F2” (Wang et al., 2017); (vi) “Mungbean-Dahuaye × Jilv9-RIL” (Wang et al., 2020); (vii) “Mungbean-Sulu16-10 × Weilu11-F2” (Ye et al., 2021).
Following map integration, the consensus map and initial QTL data were imported into BioMercator V4.2.3 for analysis (Supplementary Table S1). Initial QTLs were projected onto the consensus map using the QTLProj module (Veyrieras et al., 2007). QTL meta-analysis was performed via the Veyrieras two-step method to identify MQTLs (Sosnowski et al., 2012). Firstly, QTL clustering was performed on each chromosome using BioMercator’s standard parameters. The optimal number of MQTLs was determined by comparing five statistical criteria: Akaike information criterion (AIC), AIC correction, AIC3, Bayesian information criterion (BIC), and Average Weight of Evidence (AWE). The model with the frequent values across all criteria was selected. Second, Second, the 95% confidence interval (CI) and peak position of each MQTL were defined based on the best-fit model from the first stage. Initial QTLs falling within the MQTL CI were integrated, while those failing to meet the minimum AIC threshold were excluded (Aloryi et al., 2024). Information on the files corresponding to the first step (_model.txt) and the second step (_table.txt) is provided in Supplementary Data S2. MQTLs were systematically named according to their chromosomal locations (e.g., MQTLLG1-1, MQTLLG1-2). The phenotypic variance explained (PVE) by each MQTL was calculated as the mean PVE of its constituent QTLs.
Data collection of QTL for yield and yield-related traits
Literature searches were conducted across databases including Google Scholar (https://scholar.google.com/), PubMed (https://pubmed.ncbi.nlm.nih.gov/), and CNKI (https://www.cnki.net/) for the systematic search for QTL studies on yield and yield-related traits in mungbean published from 2005 to present. From these studies, we extracted the following parameters: parental composition of the population, population type and size, measured traits, molecular marker types, QTL flanking markers, logarithm of odds (LOD) scores, phenotypic variance explained (PVE) or R2, and confidence interval (CI) (Supplementary Tables S2, S3). QTLs lacking reported LOD scores were assigned a default value of 3, while those with missing PVE values were excluded. For several QTLs with missing CI information, CI (95%) was calculated using population-specific formulas (Darvasi and Soller, 1997; Guo et al., 2006).
(1)
(2)
(3)
These initial QTLs were associated with 71 different traits, categorized into nine groups: (i) growth period-related traits (22 traits such as branching stage, days to flowering, days to harvest, and days to maturity); (ii) yield traits (yield per block, yield index, yield per plant, biomass index and biomass); (iii) branch number (branch number per plant and number of branches); (iv) leaf related traits (chlorophyll content, leaf width, maximum leaf area, and other 8 traits); (v) hundred-grain weight; (vi) plant height and plant height related traits (plant height, number of nods, main stem length, plant height index and stem internode length); (vii) pod related traits (pod number per plant, total number of pods, pod length and other 7 traits); (viii) seed related traits (hard seedness, seed diameter, seed length and other 9 traits); (ix) other traits (12 traits such as main stem thickness, growth habit, germinating percentage) (Supplementary Table S4).
Physical mapping and GWAS validation of MQTLs
To determine the physical location of these MQTLs, we performed BLASTn alignment of MQTL flanking marker sequences against the V. radiata L. reference genome (Kang et al., 2014) available via EnsemblPlants (https://plants.ensembl.org/). However, due to insufficient sequence information for most flanking markers, direct physical localization was unfeasible. We therefore calculated physical locations using the following genetic-to-physical conversion formula (Prakash et al., 2022):
Chromosomal physical lengths were obtained from the mungbean reference genome, while genetic lengths were derived from our consensus map constructed. For GWAS validation, we compiled marker-trait associations (MTAs) from six GWAS studies associated with yield and yield-related traits in mungbean (published in 2018–2023), recording population size, traits, marker types, and MTA counts (Table 2). MQTLs were considered validated if their physical intervals overlapped with ≥1 MTA.
Orthologous MQTL analysis among legume crops
To identify the OrMQTLs for yield and yield-related traits in mungbean, pigeonpea, and common bean, the following steps were taken: (i) identify conserved regions in the genomes of mungbean, pigeonpea, and common bean using synteny and colinearity analyses with the ‘BioMart’ tool in the EnsemblPlants database (https://plants.ensembl.org/biomart/); (ii) screen for pigeonpea and common bean orthologs within the region of the MQTL in mungbean genomes; (iii) compare the physical positions of the pigeonpea and common bean orthologs to the MQTL regions of the corresponding yield and yield-related traits (Halladakeri et al., 2023; Izquierdo et al., 2023), and consider the MQTLs of pigeonpea and common bean that contain at least four of the corresponding genes as OrMQTLs for mungbean. The synteny analysis between mungbean, pigeonpea, and common bean genomes was plotted using Tbtools software (Chen et al., 2020).
Candidate gene mining within breeder’s MQTL regions
According to the criteria developed by Löffler et al. (2009), MQTLs with genetic distances <2 cM, containing at least four initial QTLs from different studies, and with PVE >10% were screened as breeder’s MQTLs for candidate gene mining. The information of gene models within the breeder’s MQTL regions was searched using the EnsemblPlants database (https://plants.ensembl.org/). To identify candidate genes, a comparative genomics approach was implemented to mine orthologs of yield-related genes from rice and Arabidopsis thaliana within the breeder’s MQTL regions of the mungbean genome.
Results
Consensus genetic map
A high-density consensus genetic map was constructed using the R package LPmerge to integrate seven previously published genetic maps in mungbean. The consensus genetic map spanned a genetic distance of 1,679.58 cM and contained 3,497 markers, with an average genetic distance between markers of 0.48 cM (Table 1; Supplementary Table S1). The genetic length of individual linkage groups ranged from 87.80 cM (LG11) to 246.60 cM (LG2), with an average length of 152.69 cM across all linkage groups. The number of markers per linkage group varied from 212 (LG11) to 426 (LG1), with an average of 317.91 markers per linkage group. The marker density of individual linkage groups ranged from 1.40 (LG4) to 3.32 (LG5) markers per cM, with an overall average density of 2.22 markers per cM (Figure 1e; Table 1).
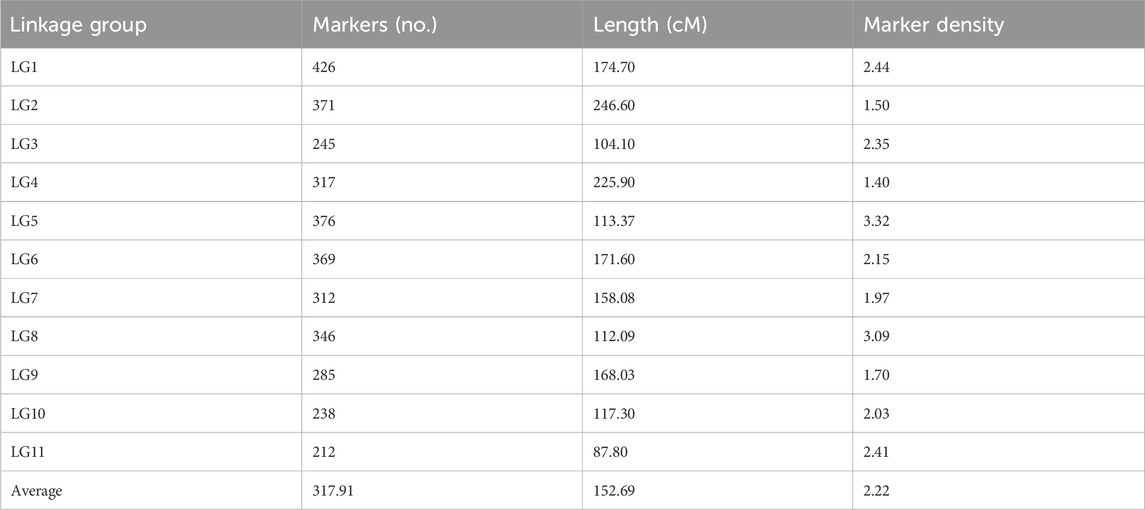
Table 1. Detailed information on the high-density consensus genetic map in mungbean
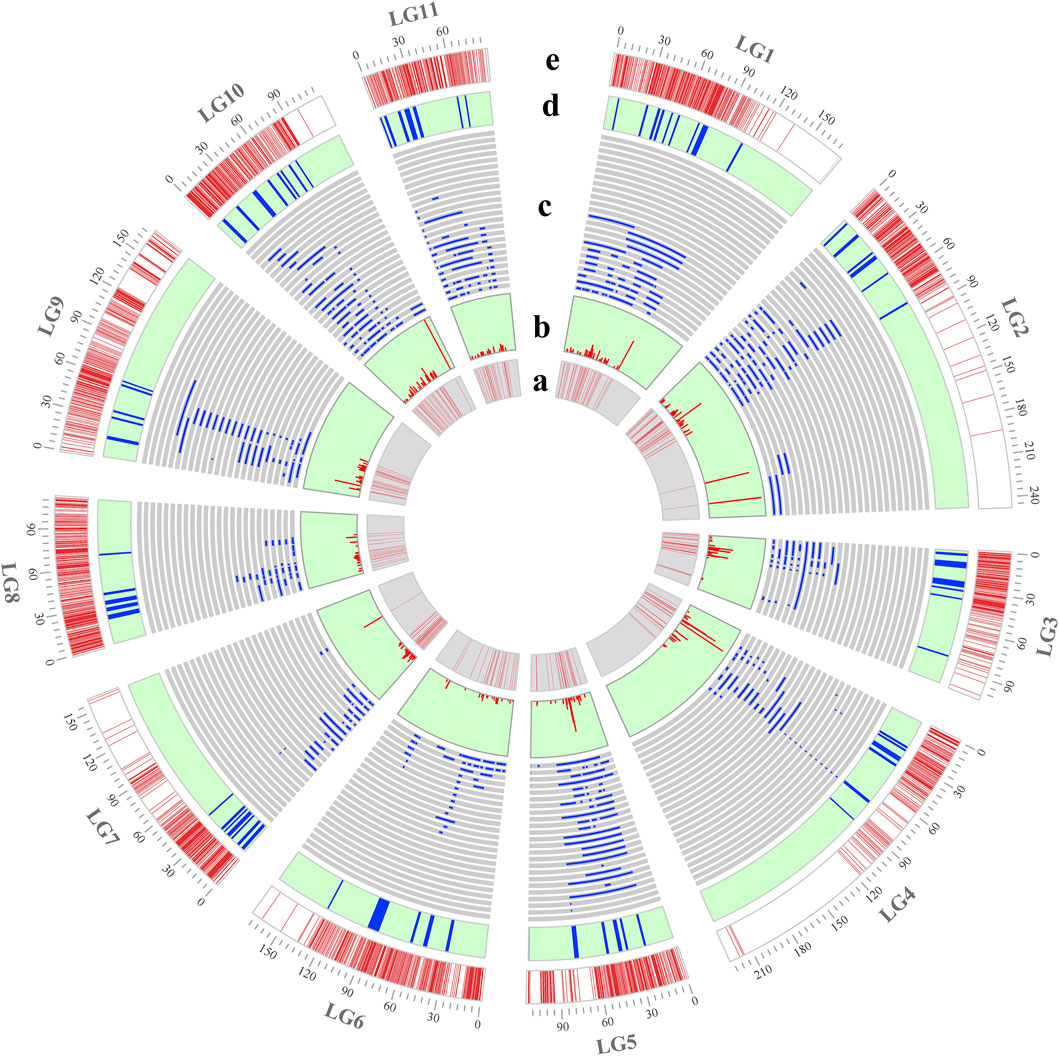
Figure 1. Position of initial QTLs and MQTLs on the consensus genetic map. (a) Density of initial QTLs: regions with low or high marker densities are indicated in light and dark red, respectively; (b) PVE value of each initial QTL; (c) position of initial QTLs on the consensus genetic map; (d) position of MQTLs on the consensus genetic map; and (e) density of molecular markers per linkage group.
Characterisation of initial QTL for yield and yield-related traits
A total of 660 QTLs from 18 independent studies (2005–2023) involving QTL mapping for yield and yield-related traits in mungbean were collected during 2005–2023 for meta-analysis (Supplementary Tables S2, S3). These studies included a total of 21 different QTL mapping populations, including 12 RIL populations, 6 F2 populations, 2 F3 populations, and 1 backcross population, with population sizes ranging from 100 to 261 (Supplementary Table S2). The yield and yield-related traits analyzed were categorized into nine types (Supplementary Table S4). Among these, the number of QTLs associated with growth period-related traits, pod-related traits, plant height, hundred-grain weight and grain-related traits was relatively high, accounting for 20.3%, 15.61%, 14.7%, 14.24% and 12.58% of the total number of QTLs, respectively, while the remaining traits represented a smaller proportion (Figure 2a). These QTLs were unevenly distributed across the linkage groups, with LG2 containing the highest number of QTL at 14.70% (97/660), LG8 having the lowest at 5.90% (39/660), and the remaining linkage groups ranging from 46 to 82 QTLs each (Figure 1a,c; Figure 2b). The logarithm of odds (LOD) scores for these QTLs ranged from 2 to 97.25, with the majority (63.6%) falling between 2 and 6 (Figure 2c). The phenotypic variance explained (PVE) by individual QTLs ranged from 1.32% to 99.51%, with an average value of 14.2%, and 41.5% were distributed within 5%–10% range (Figure 1b; Figure 2d).
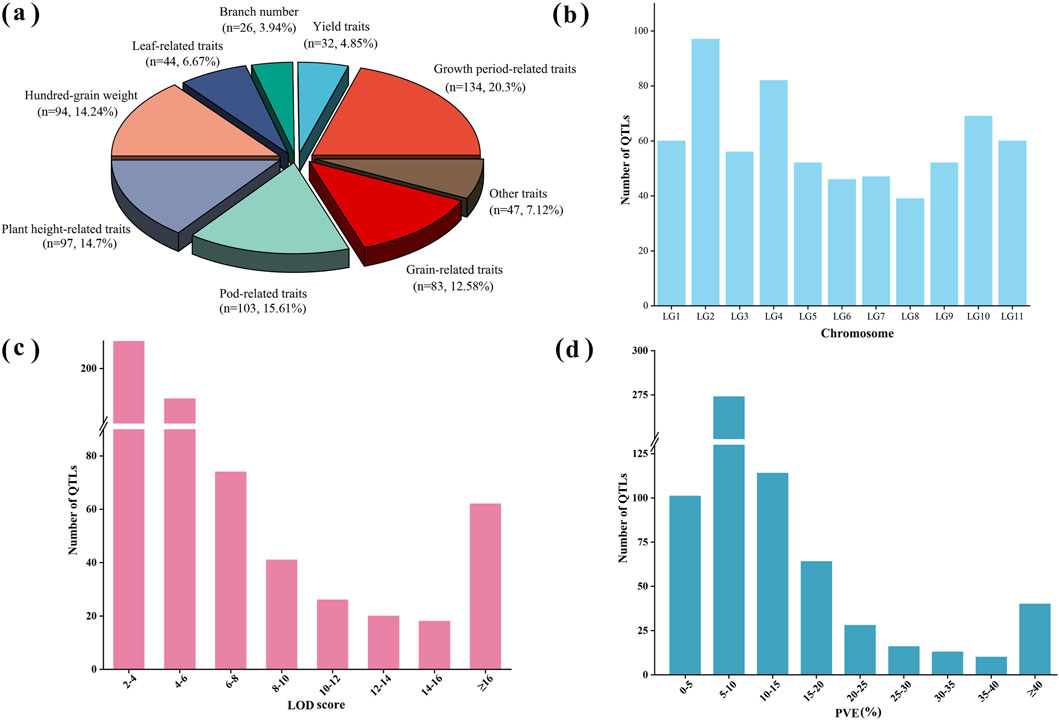
Figure 2. Information on initial QTLs for yield and yield-related traits in mungbean. (a) Percentage of initial QTLs for different types of traits; (b) Distribution of initial QTLs on linkage groups; (c) Frequency distribution of LOD scores of initial QTLs; (d) Frequency distribution of PVE (%) of initial QTLs.
MQTL analysis for yield and yield-related traits
Among the 660 initial QTLs for yield and yield-related traits, 590 were screened for mapping onto the consensus genetic map after excluding QTLs with missing PVE values or flanking markers for meta-analysis. Of these 590 initial QTLs, meta-analysis integrated 553 QTLs into 72 MQTLs, while 37 QTLs remained as individual QTLs without overlapping any MQTL (Supplementary Table S5). The MQTLs were unevenly distributed across the linkage groups, with the number of MQTLs ranging from 5 in LG6, LG8, and LG9 to 9 in LG1 (Figure 1d). Each MQTL contained at least 2 initial QTLs, and 64 MQTLs consisted of no fewer than 3 initial QTLs, with MQTLLG4-6 comprising up to 46 initial QTLs (Figure 3a; Supplementary Table S5). Among the 72 MQTLs, 75% (54/72) were associated with at least three yield and yield-related traits, and MQTLLG2-5 and MQTLLG4-6 affected 18 yield and yield-related traits simultaneously (Figure 3a; Supplementary Table S5). The confidence intervals (CIs) of these MQTLs ranged from 0.09 to 8.28 cM, with an average CI of 1.21 cM, representing a 6.26-fold reduction compared to the average CI of the initial QTL. The reduction in CI varied significantly across all linkage groups, with the largest reduction observed in LG9 (12.59-fold) and the smallest in LG3 (2.16-fold) (Figure 3b).
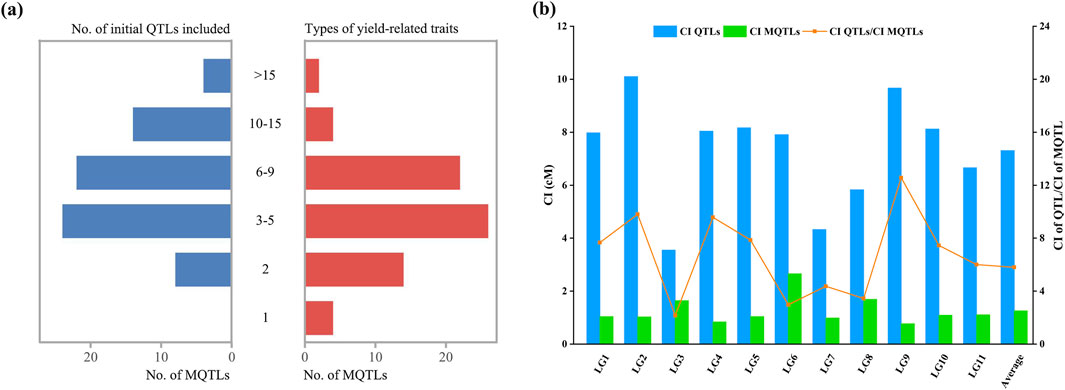
Figure 3. Basic information of the MQTLs. (a) Number of MQTLs containing the number of initial QTLs (left) and the number of MQTLs containing the number of different yield-related traits (right); (b) Comparison of confidence intervals between the initial QTLs (blue bars) and the MQTLs (cyan bars); The orange line represents the reduced fold of the QTL confidence interval.
GWAS-MTA verification MQTLs
A total of 5,563 marker-trait associations (MTAs) were identified from six GWAS studies on yield and yield-related traits in mungbean published since 2018 to date (Table 2; Supplementary Table S6). The physical locations of these MTAs were compared with the 72 MQTLs. Among the 72 MQTLs, 20 were co-located with at least one MTA from the GWAS. Most of these MQTLs (7/20) were co-located with only one MTA, while MQTLLG7-2 (625 MTAs), MQTLLG7-5 (47 MTAs), and MQTLLG11-4 (98 MTAs) were co-located with multiple MTAs. Among the 20 GWAS-validated MQTLs, 11 were validated by only one of the six GWAS studies, five MQTLs (MQTLLG6-1, MQTLLG6-3, MQTLLG6-5, MQTLLG7-5, and MQTLLG10-1) were validated in two GWAS studies, three MQTLs (MQTLLG7-2, MQTLLG8-2 and MQTLLG11-4) were validated in three GWAS studies, and one MQTL (MQTLLG8-3) was validated in four GWAS studies (Supplementary Table S6).
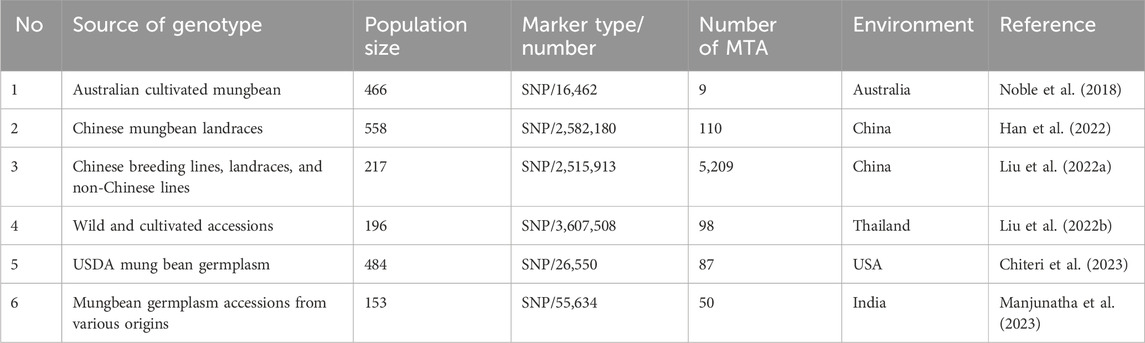
Table 2. Details of the GWAS used to validate the MQTL.
Conserved genomic regions and orthologous MQTL among legume crops
Synteny analysis of the conserved genomic regions between mungbean, pigeonpea and common bean revealed that mungbean has 1,404 orthologs with pigeonpea and 1,504 orthologs with common bean (Supplementary Table S7). Among the 552 conserved genomic regions identified between mungbean and common bean, 15 common bean MQTLs were identified as orthologous MQTLs (OrMQTL) to 22 mungbean MQTLs. For example, the mungbean MQTLLG8-3 was orthologous to two common bean MQTLs (MQTL-YC7.5 and MQTL-YC8.3), and the MQTLLG6-4 was isogenic to three common bean MQTLs (MQTL YC1.2, MQTL-YC6.1 and MQTL-YC8.3). Additionally, the number of conserved gene models between OrMQTLs in mungbean and common bean ranged from 4 (MQTLLG7-6) to 108 (MQTLLG6-4), with 11 OrMQTLs containing at least 20 conserved gene models. Among the 33 MQTLs for agronomic traits, fertility restoration, and seed quality traits in pigeonpea, only 18 conserved gene models were identified in mungbean. This limited number was attributed to the small number of gene models within the MQTL regions, and no OrMQTLs were identified between mungbean and pigeonpea (Figure 4; Supplementary Table S7).
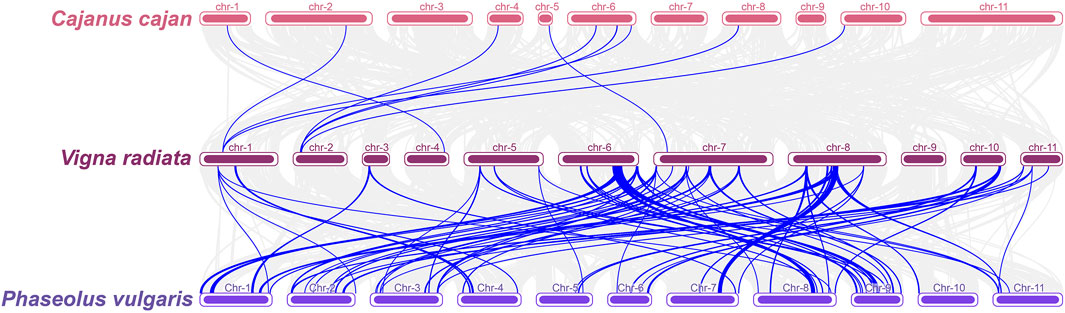
Figure 4. Colinearity analysis of Vigna radiata with two legume crops (Cajanus cajan and Phaseolus vulgaris). Gray lines indicate blocks of covariates between Vigna radiata and two other legume crops, and blue lines highlight homologous gene models within MQTL regions for the three legume crops.
Candidate gene mining based on orthologs within breeder’s MQTL regions
Twenty breeder’s MQTLs were screened for candidate gene mining in MQTL. These breeder’s MQTLs were associated with several mungbean yield and yield-related traits, indicating that key candidate genes controlling these traits might be located within these breeder’s MQTL regions (Supplementary Table S5). A total of 339 gene models were identified within these breeder’s MQTL regions, with the number of gene models per breeder’s MQTL ranged from 1 (MQTLLG3-4, MQTLLG9-4, and MQTLLG9-5) to 125 (MQTLLG7-2) (Supplementary Table S8). To further explore candidate genes affecting yield-related traits in mungbean, 22 mungbean orthologs of Arabidopsis and rice genes related to yield traits such as tiller number, starch synthesis, seed germination, and plant height were identified within the breeder’s MQTL regions through homology comparison with rice and Arabidopsis. Among these, 10 orthologs were derived from rice and 13 from A. thaliana, with one gene being identical to a rice gene (Supplementary Table S9).
Discussion
QTL meta-analysis reveals genetic architecture of yield and yield-related traits
Integrating 660 QTLs from diverse studies revealed genomic hotspots on LG2 and LG4 (Figure 2b), with over 14% of QTLs clustering on LG2. This uneven distribution aligns with synteny patterns in common bean (Izquierdo et al., 2023), suggesting conserved selection pressure on these regions. Notably, the preponderance of QTLs associated with growth period-related traits, pod-related traits, plant height, and grain weight highlights these as key determinants of yield potential (Figure 2a). This observation aligns with reported genetic control mechanisms in other legume crops (Izquierdo et al., 2023). These QTL were unevenly distributed across linkage groups (Figure 2b), suggests the existence of genomic hotspots with concentrated genetic potential for yield improvement in mungbean.
As the first QTL meta-analysis in mungbean, our study integrated seven published genetic maps to construct a high-density consensus genetic map (Supplementary Table S1). Through integration of seven published genetic maps, we constructed a high-density consensus genetic map (Supplementary Table S1), mapping most of the initial QTLs (590 out of 660) to this consensus map, and 72 MQTLs were identified via meta-analysis (Figures 1D,E). The statistical confidence of MQTLs correlates positively with the number of underlying component QTLs (Quraishi et al., 2017). Notably, 75% of our MQTLs incorporated ≥3 initial QTLs, with 58.3% (42/72) containing ≥6 component QTLs (Figure 3a), suggesting that these MQTLs have high reliability. Moreover, the average CI of MQTLs was reduced 6.26-fold compared to that of initial QTLs (Figure 3b). From these, we identified 20 breeder’s MQTLs characterized by high contributions (PVE >10%), narrow CIs (<2 cM), and more initial QTLs (≥4). Significantly, most of these breeder’s MQTLs exhibited pleiotropic effects on multiple yield-related traits, with three key loci (MQTLLG2-5, MQTLLG4-6, and MQTLLG9-4) influencing ≥10 yield-related traits (Supplementary Table S5), highlighting their potential for simultaneous improvement of multiple yield components.
GWAS-MTA validation of MQTLs
GWAS based on linkage disequilibrium can detect minor-effect alleles that are missed in biparental populations. MTAs identified in GWAS can be used to validate candidate genes for QTL mapping (Han et al., 2018; Sallam et al., 2022). Using GWAS-MTA to validate the accuracy of MQTL results has been reported in QTL meta-analysis in legume crops such as soybean, pigeonpea, and common bean (Chen et al., 2021; Halladakeri et al., 2023; Izquierdo et al., 2023). In the present study, 27.8% (20/72) of the MQTL were validated in six GWAS studies published in recent years for yield and yield-related traits in mungbean (Supplementary Table S6). Of these validated MQTLs, the majority (7/20) showed overlap with a single MTA, while 55% (11/20) were supported by only one GWAS dataset. Notably, four critical MQTLs (MQTLLG7-2, MQTLLG8-2, MQTLLG8-3, and MQTLLG11-4) exhibited co-located with multiple MTAs across ≥3 GWAS studies (Supplementary Table S6), strongly suggesting that these genomic regions likely harbor key genetic determinants of yield and yield-related traits. These high-confidence loci (e.g., MQTLLG7-2 and MQTLLG8-3) represent prime targets for MAS, particularly due to their pleiotropic effects on ≥10 traits (Supplementary Table S5).
Conservation of OrMQTLs in other legume crops
Comparative synteny analysis revealed conserved OrMQTLs associated with agronomically important traits among legume crops including mungbean, pigeonpea, and common bean (Halladakeri et al., 2023; Izquierdo et al., 2023). Specifically, we identified 22 conserved OrMQTLs sharing synteny between mungbean and common bean genomes (Figure 4), suggesting strong evolutionary selection pressures to preserve these regions due to their functional importance in legume biology. These conserved loci harbor numerous uncharacterized genes in mungbean that represent promising targets for future functional studies. Characterizing genes within OrMQTLs could elucidate the genetic networks regulating yield and yield-related traits across legume species and provide insights into the molecular basis of trait evolution in legume crops. Furthermore, molecular markers derived from these syntenic regions hold potential for accelerating marker-assisted breeding strategies aimed at enhancing yield in mungbean (Saini et al., 2022).
Candidate gene identification in breeder’s MQTL regions
As traditional model plants, A. thaliana and rice possess extensively characterized genomic resources, making synteny analysis between mungbean and these species a valuable strategy for identifying candidate genes associated with agronomically important traits (Gaut, 2002). To precisely map MQTLs to physical genomic positions, we applied the methodology of Prakash et al. (2022), which calculates physical coordinates using chromosomal genetic-to-physical length ratios, as direct alignment of MQTL-flanking markers to the mungbean reference genome was hindered by low sequence identity and alignment scores. Within the 20 breeder’s MQTL regions, we identified 339 gene models, including 22 mungbean orthologs of known regulators of tiller number, starch synthesis, seed germination, plant height, and yield in Arabidopsis and rice (Supplementary Table S9). Notably, the MQTLLG7-2 region harbors Vradi07g07390, an ortholog of the rice amino acid transporter gene OsLHT1 that critically influences plant growth and yield (Wang et al., 2019), and Vradi07g07630, which shares homology with the rice ABA receptor gene OsPYL/RCAR10 implicated in seed germination (Kim et al., 2012). Furthermore, the MQTLLG5-3 region contains Vradi05g08600, a functional ortholog of both the rice leaf morphology gene YUCCA6 (Zhang et al., 2021), and and the Arabidopsis flowering time regulator YUC8 (Ståldal et al., 2012), suggesting pleiotropic roles in yield-related traits. The findings not only advances our understanding of the genetic control of yield in mungbean but also provides a foundation for the development of molecular markers and the implementation of MAS in mungbean breeding programs.
Conclusion
In conclusion, the integration of QTL meta-analysis, GWAS validation, orthologous MQTL, and comparative genomics has provided a comprehensive understanding of the genetic architecture underlying yield and yield-related traits in mungbean. This study identified a total of 72 MQTLs, with the average CI being narrowed down by 6.26-fold compared to the initial QTLs. Among these, 20 MQTLs were validated through GWAS-MTAs, while 22 OrMQTLs were detected across different legume crops through colinearity analysis. Furthermore, 22 mungbean orthologs of yield and yield-related genes from rice and Arabidopsis were identified in the breeder’s MQTL regions using a comparative genomics approach. These findings significantly enhance our understanding of the genetic mechanisms governing yield and yield-related traits in mungbean, providing valuable insights for future breeding programs.
Data availability statement
The original contributions presented in the study are included in the article/Supplementary Material, further inquiries can be directed to the corresponding authors.
Author contributions
BD: Writing – review and editing, Writing – original draft. QW: Writing – original draft, Writing – review and editing. SG: Data curation, Writing – original draft. FY: Data curation, Writing – original draft. LZ: Investigation, Writing – original draft. XaZ: Investigation, Writing – original draft. DH: Investigation, Writing – review and editing. JW: Data curation, Writing – original draft. XnZ: Writing – original draft, Investigation. FL: Investigation, Writing – original draft. BL: Writing – review and editing, Writing – original draft. FA: Writing – review and editing, Writing – original draft.
Funding
The author(s) declare that financial support was received for the research and/or publication of this article. This work was supported by the fund for High-level Talents Research Initiation Funding Project (Grant No. WGKQ2022029, WGKQ2023012, WGKQ2022080 and WGKQ2022023), the Open Fund of Anhui Engineering Laboratory for Conservation and Sustainable Utilization of Traditional Chinese Medicine Resources (TCMRPSU-2022–07), the Fund of Traditional Chinese Medicine Institute of Anhui Dabie Mountain (TCMADM-2024–18).
Conflict of interest
The authors declare that the research was conducted in the absence of any commercial or financial relationships that could be construed as a potential conflict of interest.
Generative AI statement
The author(s) declare that no Generative AI was used in the creation of this manuscript.
Publisher’s note
All claims expressed in this article are solely those of the authors and do not necessarily represent those of their affiliated organizations, or those of the publisher, the editors and the reviewers. Any product that may be evaluated in this article, or claim that may be made by its manufacturer, is not guaranteed or endorsed by the publisher.
Supplementary material
The Supplementary Material for this article can be found online at: https://www.frontiersin.org/articles/10.3389/fgene.2025.1600979/full#supplementary-material
References
Ahmad, S., and Belwal, V. (2020). Study of correlation and path analysis for yield and yield attributing traits in mungbean [Vigna radiata (L.) Wilczek]. Int. J. Chem. Stud. 8, 2140–2143. doi:10.22271/chemi.2020.v8.i1af.8586
Akbari, M., Sabouri, H., Sajadi, S. J., Yarahmadi, S., Ahangar, L., Abedi, A., et al. (2022). Mega meta-QTLs: a strategy for the production of golden barley (Hordeum vulgare L.) tolerant to abiotic stresses. Genes 13, 2087. doi:10.3390/genes13112087
Aloryi, K. D., Okpala, N. E., Guo, H., Karikari, B., Amo, A., Bello, S. H., et al. (2024). Integrated meta-analysis and transcriptomics pinpoint genomic loci and novel candidate genes associated with submergence tolerance in rice. BMC Genomics 25, 338. doi:10.1186/s12864-024-10219-z
Anilkumar, C., Sah, R. P., Muhammed, A. P., Behera, S., Singh, N., Prakash, N. R., et al. (2022). Understanding complex genetic architecture of rice grain weight through QTL-meta analysis and candidate gene identification. Sci. Rep. 12, 13832. doi:10.1038/s41598-022-17402-w
Brachi, B., Faure, N., Horton, M., Flahauw, E., Vazquez, A., Nordborg, M., et al. (2010). Linkage and association mapping of Arabidopsis thaliana flowering time in nature. PLoS Genet. 6, e1000940. doi:10.1371/journal.pgen.1000940
Breria, C. M., Hsieh, C. H., Yen, T. B., Yen, J. Y., Noble, T. J., and Schafleitner, R. (2020). A SNP-based genome-wide association study to mine genetic loci associated to salinity tolerance in mungbean (Vigna radiata L.). Genes 11, 759. doi:10.3390/genes11070759
Chang, Y. J., Peng, L., Ji, L., Wang, S. M., Wang, L. F., and Wu, J. (2023). Genome-wide association study identified genomic regions associated with drought tolerance in mungbean (Vigna radiata (L.) R. Wilczek). Theor. Appl. Genet. 136, 40. doi:10.1007/s00122-023-04303-3
Chen, C. J., Chen, H., Zhang, Y., Thomas, H. R., Frank, M. H., He, Y. H., et al. (2020). TBtools: an integrative toolkit developed for interactive analyses of big biological data. Mol. Plant 13, 1194–1202. doi:10.1016/j.molp.2020.06.009
Chen, H., Pan, X. W., Wang, F. F., Liu, C. K., Wang, X., Li, Y. S., et al. (2021). Novel QTL and meta-QTL mapping for major quality traits in soybean. Front. Plant Sci. 12, 774270. doi:10.3389/fpls.2021.774270
Chiteri, K. O., Chiranjeevi, S., Jubery, T. Z., Rairdin, A., Dutta, S., Ganapathysubramanian, B., et al. (2023). Dissecting the genetic architecture of leaf morphology traits in mungbean (Vigna radiata (L.) Wizcek) using genome-wide association study. Plant Phenome J. 6, e20062. doi:10.1002/ppj2.20062
Darvasi, A., and Soller, M. (1997). A simple method to calculate resolving power and confidence interval of QTL map location. Behav. Genet. 27, 125–132. doi:10.1023/A:1025685324830
Du, B. B., Wu, J., Islam, M. S., Sun, C. Y., Lu, B. W., Wei, P. P., et al. (2022). Genome-wide meta-analysis of QTL for morphological related traits of flag leaf in bread wheat. PLoS One 17, e0276602. doi:10.1371/journal.pone.0276602
Du, B. B., Wu, J., Wang, Q. M., Sun, C. Y., Sun, G. L., Zhou, J., et al. (2024a). Genome-wide screening of meta-QTL and candidate genes controlling yield and yield-related traits in barley (Hordeum vulgare L.). PLoS One 19, e0303751. doi:10.1371/journal.pone.0303751
Du, B. B., Wu, J. D., Wang, M., Wu, J., Sun, C. Y., Zhang, X. G., et al. (2024b). Detection of consensus genomic regions and candidate genes for quality traits in barley using QTL meta-analysis. Front. Plant Sci. 14, 1319889. doi:10.3389/fpls.2023.1319889
Endelman, J. B., and Plomion, C. (2014). LPmerge: an R package for merging genetic maps by linear programming. Bioinformatics 30, 1623–1624. doi:10.1093/bioinformatics/btu091
Gaut, B. S. (2002). Evolutionary dynamics of grass genomes. New Phytol. 154, 15–28. doi:10.1046/j.1469-8137.2002.00352.x
Goffinet, B., and Gerber, S. (2000). Quantitative trait loci: a meta-analysis. Genetics 155, 463–473. doi:10.1093/genetics/155.1.463
Gudi, S., Saini, D. K., Singh, G., Halladakeri, P., Kumar, P., Shamshad, M., et al. (2022). Unravelling consensus genomic regions associated with quality traits in wheat using meta-analysis of quantitative trait loci. Planta 255, 115. doi:10.1007/s00425-022-03904-4
Guo, B., Sleper, D. A., Lu, P., Shannon, J. G., Nguyen, H. T., and Arelli, P. R. (2006). QTLs associated with resistance to soybean cyst nematode in soybean: meta-analysis of QTL locations. Crop Sci. 46, 595–602. doi:10.2135/cropsci2005.04-0036-2
Guo, J., Chen, L., Li, Y. X., Shi, Y. S., Song, Y. C., Zhang, D. F., et al. (2018). Meta-QTL analysis and identification of candidate genes related to root traits in maize. Euphytica 214, 223. doi:10.1007/s10681-018-2283-3
Halladakeri, P., Gudi, S., Akhtar, S., Singh, G., Saini, D. K., Hilli, H. J., et al. (2023). Meta-analysis of the quantitative trait loci associated with agronomic traits, fertility restoration, disease resistance, and seed quality traits in pigeonpea (Cajanus cajan L.). Plant Genome 16, e20342. doi:10.1002/tpg2.20342
Han, K., Lee, H. Y., Ro, N. Y., Hur, O. S., Lee, J. H., Kwon, J. K., et al. (2018). QTL mapping and GWAS reveal candidate genes controlling capsaicinoid content in Capsicum. Plant Biotechnol. J. 16, 1546–1558. doi:10.1111/pbi.12894
Han, X. S., Li, L., Chen, H. W., Liu, L. J., Sun, L. Q., Wang, X. M., et al. (2022). Resequencing of 558 Chinese mungbean landraces identifies genetic loci associated with key agronomic traits. Front. Plant Sci. 13, 1043784. doi:10.3389/fpls.2022.1043784
Humphry, M. E., Lambrides, C. J., Chapman, S. C., Aitken, E. a.B., Imrie, B. C., Lawn, R. J., et al. (2005). Relationships between hard-seededness and seed weight in mungbean (Vigna radiata) assessed by QTL analysis. Plant Breed. 124, 292–298. doi:10.1111/j.1439-0523.2005.01084.x
Isemura, T., Kaga, A., Tabata, S., Somta, P., Srinives, P., Shimizu, T., et al. (2012). Construction of a genetic linkage map and genetic analysis of domestication related traits in mungbean (Vigna radiata). PLoS One 7, e41304. doi:10.1371/journal.pone.0041304
Islam, M. A., Islam, M. R., Haque, M. E., Yeasmin, F., and Hossain, M. A. (2014). Impacts of famers' participation in upscaling technologies on mungbean (Vigna radiata L.) production in the south-western region of Bangladesh. Agriculturists 12, 39–47. doi:10.3329/agric.v12i2.21730
Izquierdo, P., Kelly, J. D., Beebe, S. E., and Cichy, K. (2023). Combination of meta-analysis of QTL and GWAS to uncover the genetic architecture of seed yield and seed yield components in common bean. Plant Genome 16, e20328. doi:10.1002/tpg2.20328
Kang, Y. J., Kim, S. K., Kim, M. Y., Lestari, P., Kim, K. H., Ha, B. K., et al. (2014). Genome sequence of mungbean and insights into evolution within Vigna species. Nat. Commun. 5, 5443. doi:10.1038/ncomms6443
Khahani, B., Tavakol, E., Shariati, V., and Fornara, F. (2020). Genome wide screening and comparative genome analysis for Meta-QTLs, ortho-MQTLs and candidate genes controlling yield and yield-related traits in rice. BMC Genomics 21, 294. doi:10.1186/s12864-020-6702-1
Kim, H., Hwang, H., Hong, J. W., Lee, Y. N., Ahn, I. P., Yoon, I. S., et al. (2012). A rice orthologue of the ABA receptor, OsPYL/RCAR5, is a positive regulator of the ABA signal transduction pathway in seed germination and early seedling growth. J. Exp. Bot. 63, 1013–1024. doi:10.1093/jxb/err338
Kumar, A., Kaur, S., Rakshit, S., Choudhary, M., Das, A. K., and Kumar, R. R. (2021). Meta-analysis of QTLs associated with popping traits in maize (Zea mays L.). PLoS One 16, e0256389. doi:10.1371/journal.pone.0256389
Li, X. W., Zheng, H. L., Wu, W. S., Liu, H., Wang, J., Jia, Y., et al. (2020). QTL mapping and candidate gene analysis for alkali tolerance in Japonica rice at the bud stage based on linkage mapping and genome-wide association study. Rice 13, 48. doi:10.1186/s12284-020-00412-5
Liu, C. Y., Wang, Y., Peng, J. X., Fan, B. J., Xu, D. X., Wu, J., et al. (2022a). High-quality genome assembly and pan-genome studies facilitate genetic discovery in mung bean and its improvement. Plant Commun. 3, 100352. doi:10.1016/j.xplc.2022.100352
Liu, C. Y., Wu, J., Wang, L. F., Fan, B. J., Cao, Z. M., Su, Q. Z., et al. (2017). Quantitative trait locus mapping under irrigated and drought treatments based on a novel genetic linkage map in mungbean (Vigna radiata L.). Theor. Appl. Genet. 130, 2375–2393. doi:10.1007/s00122-017-2965-6
Liu, J. H., Lin, Y., Chen, J. B., Yan, Q., Xue, C. C., Wu, R. R., et al. (2022b). Genome-wide association studies provide genetic insights into natural variation of seed-size-related traits in mungbean. Front. Plant Sci. 13, 997988. doi:10.3389/fpls.2022.997988
Löffler, M., Schön, C. C., and Miedaner, T. (2009). Revealing the genetic architecture of FHB resistance in hexaploid wheat (Triticum aestivum L.) by QTL meta-analysis. Mol. Breed. 23, 473–488. doi:10.1007/s11032-008-9250-y
Manjunatha, P. B., Aski, M. S., Mishra, G. P., Gupta, S., Devate, N. B., Singh, A., et al. (2023). Genome-wide association studies for phenological and agronomic traits in mungbean (Vigna radiata L. Wilczek). Front. Plant Sci. 14, 1209288. doi:10.3389/fpls.2023.1209288
Nair, R., and Schreinemachers, P. (2020). “Global status and economic importance of Mungbean,” in The mungbean genome. Editors R. M. Nair, R. Schafleitner, and S. H. Lee (Cham: Springer), 1–8.
Nair, R. M., Pandey, A. K., War, A. R., Hanumantharao, B., Shwe, T., Alam, A. K. M. M., et al. (2019). Biotic and abiotic constraints in mungbean production-progress in genetic improvement. Front. Plant Sci. 10, 1340. doi:10.3389/fpls.2019.01340
Noble, T. J., Tao, Y. F., Mace, E. S., Williams, B., Jordan, D. R., Douglas, C. A., et al. (2018). Characterization of linkage disequilibrium and population structure in a mungbean diversity panel. Front. Plant Sci. 8, 2102. doi:10.3389/fpls.2017.02102
Pan, L. M., Yin, Z. T., Huang, Y. Q., Chen, J., Zhu, L., Zhao, Y., et al. (2017). QTL for maize grain yield identified by QTL mapping in six environments and consensus loci for grain weight detected by meta-analysis. Plant Breed. 136, 820–833. doi:10.1111/pbr.12524
Pandey, A. K., Burlakoti, R. R., Kenyon, L., and Nair, R. M. (2018). Perspectives and challenges for sustainable management of fungal diseases of mungbean [Vigna radiata (L.) R. Wilczek var. radiata]: a review. Front. Environ. Sci. 6, 53. doi:10.3389/fenvs.2018.00053
Prakash, N. R., Lokeshkumar, B. M., Rathor, S., Warraich, A. S., Yadav, S., Vinaykumar, N. M., et al. (2022). Meta-analysis and validation of genomic loci governing seedling and reproductive stage salinity tolerance in rice. Physiol. Plant. 174, e13629. doi:10.1111/ppl.13629
Quraishi, U. M., Pont, C., Ain, Q., Flores, R., Burlot, L., Alaux, M., et al. (2017). Combined genomic and genetic data integration of major agronomical traits in bread wheat (Triticum aestivum L.). Front. Plant Sci. 8, 1843. doi:10.3389/fpls.2017.01843
Saini, D. K., Srivastava, P., Pal, N., and Gupta, P. K. (2022). Meta-QTLs, ortho-meta-QTLs and candidate genes for grain yield and associated traits in wheat (Triticum aestivum L.). Theor. Appl. Genet. 135, 1049–1081. doi:10.1007/s00122-021-04018-3
Sallam, A., Eltaher, S., Alqudah, A. M., Belamkar, V., and Baenziger, P. S. (2022). Combined GWAS and QTL mapping revealed candidate genes and SNP network controlling recovery and tolerance traits associated with drought tolerance in seedling winter wheat. Genomics 114, 110358. doi:10.1016/j.ygeno.2022.110358
Somta, P., Ammaranan, C., Ooi, P. a.C., and Srinives, P. (2007). Inheritance of seed resistance to bruchids in cultivated mungbean (Vigna radiata, L. Wilczek). Euphytica 155, 47–55. doi:10.1007/s10681-006-9299-9
Song, J., Sun, X., Zhang, K. X., Liu, S. L., Wang, J. J., Yang, C., et al. (2020). Identification of QTL and genes for pod number in soybean by linkage analysis and genome-wide association studies. Mol. Breed. 40, 60–14. doi:10.1007/s11032-020-01140-w
Sosnowski, O., Charcosset, A., and Joets, J. (2012). BioMercator V3: an upgrade of genetic map compilation and quantitative trait loci meta-analysis algorithms. Bioinformatics 28, 2082–2083. doi:10.1093/bioinformatics/bts313
Ståldal, V., Cierlik, I., Chen, S., Landberg, K., Baylis, T., Myrenås, M., et al. (2012). The Arabidopsis thaliana transcriptional activator STYLISH1 regulates genes affecting stamen development, cell expansion and timing of flowering. Plant Mol. Biol. 78, 545–559. doi:10.1007/s11103-012-9888-z
Tang, D. Y., Dong, Y. M., Ren, H. K., Li, L., and He, C. F. (2014). A review of phytochemistry, metabolite changes, and medicinal uses of the common food mung bean and its sprouts (Vigna radiata). J Chem. Central J. 8, 4. doi:10.1186/1752-153X-8-4
Vasistha, N. K., Sharma, V., Singh, S., Kaur, R., Kumar, A., Ravat, V. K., et al. (2024). Meta-QTL analysis and identification of candidate genes for multiple-traits associated with spot blotch resistance in bread wheat. Sci. Rep. 14, 13083. doi:10.1038/s41598-024-63924-w
Veyrieras, J. B., Goffinet, B., and Charcosset, A. (2007). MetaQTL: a package of new computational methods for the meta-analysis of QTL mapping experiments. BMC Bioinforma. 8, 49. doi:10.1186/1471-2105-8-49
Vu, T. T., Kilian, A., Carling, J., and Lawn, R. J. (2022). Consensus genetic map and QTLs for morphological and agronomical traits in mungbean using DArT markers. Physiol. Mol. Bio Pla 28, 1277–1295. doi:10.1007/s12298-022-01201-8
Wang, J., Li, J. L., Liu, Z. X., Yuan, X. X., Wang, S. H., Chen, H. L., et al. (2020). Construction of a high-density genetic map and its application for QTL mapping of leaflet shapes in mung bean (Vigna radiata L.). Front. Genet. 11, 1032. doi:10.3389/fgene.2020.01032
Wang, J. H., Zhang, Y. W., Cheng, X. Z., and Wang, L. X. (2017). Construction of genetic map and identification of QTLs related to agronomic traits in mung bean. Acta Agron. Sin. 43, 1096–1102. doi:10.3724/SP.J.1006.2017.01096
Wang, X. H., Yang, G. Z., Shi, M. X., Hao, D. L., Wei, Q. X., Wang, Z. G., et al. (2019). Disruption of an amino acid transporter LHT1 leads to growth inhibition and low yields in rice. BMC Plant Biol. 19, 268. doi:10.1186/s12870-019-1885-9
Wei, Z. R., Yuan, Q. L., Lin, H., Li, X. X., Zhang, C., Gao, H. S., et al. (2021). Linkage analysis, GWAS, transcriptome analysis to identify candidate genes for rice seedlings in response to high temperature stress. BMC Plant Biol. 21, 85. doi:10.1186/s12870-021-02857-2
Wu, C. S., Wang, L. X., Wang, S. H., Chen, H. L., Wu, J. X., Chen, X. Z., et al. (2014). Construction of a genetic linkage map in mungbean. Sci. Agric. Sin. 47, 2088–2098. doi:10.3864/j.issn.0578-1752.2014.11.003
Yang, Y., Amo, A., Wei, D., Chai, Y. M., Zheng, J., Qiao, P. F., et al. (2021). Large-scale integration of meta-QTL and genome-wide association study discovers the genomic regions and candidate genes for yield and yield-related traits in bread wheat. Theor. Appl. Genet. 134, 3083–3109. doi:10.1007/s00122-021-03881-4
Ye, W. J., Yang, Y., Wang, P. R., Zhang, Y., Zhang, L. Y., Tian, D. F., et al. (2021). InDel marker development and QTL analysis of agronomic traits in mung bean [Vigna radiate (L.) Wilczek]. Mol. Breed. 41, 66. doi:10.1007/s11032-021-01233-0
Zhang, T., You, J., Zhang, Y., Yao, W. Y., Chen, W. B., Duan, Q. N., et al. (2021). LF1 regulates the lateral organs polarity development in rice. New Phytol. 231, 1265–1277. doi:10.1111/nph.17220
Zhang, T. F., Wu, T. T., Wang, L. W., Jiang, B. G., Zhen, C. X., Yuan, S., et al. (2019). A combined linkage and GWAS analysis identifies QTLs linked to soybean seed protein and oil content. Int. J. Mol. Sci. 20, 5915. doi:10.3390/ijms20235915
Zhang, X., Shabala, S., Koutoulis, A., Shabala, L., and Zhou, M. (2017). Meta-analysis of major QTL for abiotic stress tolerance in barley and implications for barley breeding. Planta 245, 283–295. doi:10.1007/s00425-016-2605-4
Keywords: mungbean, yield, QTL meta-analysis, meta-QTL, candidate gene
Citation: Du B, Wang Q, Gao S, Yang F, Zhang L, Zhang X, Huo D, Wu J, Zhang X, Li F, Lu B and An F (2025) Genetic dissection of yield and yield-related traits in mungbean based on QTL meta-analysis. Front. Genet. 16:1600979. doi: 10.3389/fgene.2025.1600979
Received: 27 March 2025; Accepted: 24 April 2025;
Published: 08 May 2025.
Edited by:
Dinesh Kumar Saini, Texas Tech University, United StatesReviewed by:
Kelvin Dodzi Aloryi, University of Florida, United StatesNathan John Fumia, Hawaii Agriculture Research Center, United States
Copyright © 2025 Du, Wang, Gao, Yang, Zhang, Zhang, Huo, Wu, Zhang, Li, Lu and An. This is an open-access article distributed under the terms of the Creative Commons Attribution License (CC BY). The use, distribution or reproduction in other forums is permitted, provided the original author(s) and the copyright owner(s) are credited and that the original publication in this journal is cited, in accordance with accepted academic practice. No use, distribution or reproduction is permitted which does not comply with these terms.
*Correspondence: Baowei Lu, bHVfYmFvd2VpMUAxMjYuY29t; Fengxia An, YW5fZmVuZ3hpYUAxNjMuY29t
†These authors have contributed equally to this work