 Cheng Wu1,2
 Chuanfa Fang
- 1Department of Gastrointestinal and Hernia Surgery, Ganzhou Hospital-Nanfang Hospital, Southern Medical University, Ganzhou, China
- 2Department of Gastrointestinal and Hernia Surgery, The Affiliated Ganzhou Hospital of Nanchang University, Ganzhou, China
Background: Gastric cancer (GC) is a leading cause of cancer-related mortality; however, biomarkers predicting its immunotherapy resistance remain scarce. Vascular cell adhesion molecule (VCAM)-1, an immune cell adhesion mediator, is implicated in tumor progression; however, its prognostic and immunomodulatory roles in GC remain unclear.
Methods: In this study, we analyzed VCAM-1 expression and its clinical relevance in GC using RNA-sequencing data from The Cancer Genome Atlas. Differential gene analysis, gene set enrichment analysis (GSEA), and single-sample GSEA were used to identify the underlying pathways and immune infiltration patterns. Validation was performed via Cox regression, receiver operating characteristic, and immunohistochemical (Human Protein Atlas database) analyses.
Results: VCAM-1 expression levels were significantly upregulated in the GC tissues (p < 0.001) and correlated with advanced T stage (p = 0.046), N stage (p = 0.047), and poor overall survival (hazard ratio = 1.54; p = 0.046). GSEA linked VCAM-1 expression to various immune pathways (e.g., interleukin-17 signaling), and single-sample GSEA revealed its positive associations with the Th1, cytotoxic, and CD8+ T cell proportions (p < 0.05) and inverse correlation with the Th17 cell proportion. Immunohistochemistry revealed elevated VCAM-1 protein levels in the tumors.
Conclusion: VCAM-1 is a novel prognostic biomarker driving immunosuppressive microenvironmental remodeling in GC. Furthermore, its dual roles in immune regulation highlight its potential to optimize GC immunotherapy.
Introduction
Gastric cancer (GC), a prevalent digestive system malignancy, is the leading cause of cancer-related morbidity and mortality worldwide (Bray et al., 2024). Recently, clinical management of GC has significantly improved, primarily due to the introduction and application of immune checkpoint blockade therapies (Lu et al., 2022). These therapies target the key immune checkpoints, specifically programmed cell death protein 1 and cytotoxic T-lymphocyte-associated protein 4, to rejuvenate the activity and potentiate the antitumor effects of T cells (Wang et al., 2022). Despite recent advancements, therapeutic benefits remain limited and are primarily observed in only some patients. Unfortunately, a significant proportion of patients exhibit immune tolerance and disease progression after treatment, highlighting the urgent need to elucidate the underlying immune regulatory mechanisms and identify the key targets in GC. Further exploration is crucial for the development of effective therapeutic strategies to improve the patient outcomes.
Initially characterized in 1989 for its vital role in mediating cell adhesion in melanoma (Osborn et al., 1989; Rice and Bevilacqua, 1989), vascular cell adhesion molecule (VCAM)-1 has garnered significant attention as a crucial factor for the development and progression of solid tumors, particularly breast cancer and GC (Chen et al., 2011; Kuai et al., 2012). VCAM-1 is a prominent component of metastasis-specific gene signatures in breast cancer, playing a crucial role in modulating the metastatic processes (Minn et al., 2005). Abnormal VCAM-1 expression promotes lung and bone metastases in breast cancer (Chen et al., 2011).
VCAM-1 interacts with integrin VLA-4 in monocytes and tumor-associated macrophages, recruiting it to the lung tissues. Tumor-associated macrophages and monocytes protect the tumor cells by facilitating immune evasion. Macrophages accumulate around the tumor cells through the binding of VLA-4 to homologous VCAM-1 (Gil-Bernabe et al., 2012; Qian and Pollard, 2010). Wu et al. reported that VCAM-1 expression correlates with increased immune resistance in renal cancer (Wu et al., 1995). Furthermore, VCAM-1 binding to VLA-4 on their surfaces triggers T cell migration (Rose et al., 2002).
Currently, the complex relationship between VCAM-1 expression and immune cell infiltration and its effects on the patient overall survival (OS) and tumor infiltration patterns remain unknown. To bridge this knowledge gap, we used bioinformatics techniques to examine the VCAM-1 expression patterns in GC cells and tissues. Our analysis revealed that high VCAM-1 levels were correlated with the patient clinicopathological characteristics and prognosis in GC. Our results also revealed the correlation between elevated VCAM-1 levels and immune infiltration, providing novel insights into the intricate interplay between VCAM-1 and the GC immune microenvironment. Our findings can aid in the identification of novel therapeutic targets and improvement of clinical outcomes in patients with GC.
Methods
Data acquisition and preliminary analysis
RNA sequencing data (The Cancer Genome Atlas [TCGA]–stomach adenocarcinoma cohort; n = 375 tumor and 32 normal samples) in TPM format were obtained from TCGA database (https://portal.gdc.cancer.gov/), which covers 33 diverse cancer types. The data were subjected to rigorous preprocessing, particularly focusing on the VCAM-1 expression profiles. Subsequently, Wilcoxon rank-sum test was performed to assess the VCAM-1 expression changes using the built-in stats package within the R statistical software (version 4.2.1) environment. Moreover, visualization capabilities of ggplot2 (version 3.3.6) were used to create intricate graphical representations highlighting the complex VCAM-1 expression patterns across different tumor types.
Differentially expressed gene analysis
HTSeq-count samples were divided into high and low expression groups using the median VCAM-1 level as the cut-off. Patients were stratified into the high and low VCAM-1 expression groups based on the median VCAM-1 expression level, which is a commonly used threshold in transcriptomic studies for a balanced group size and clinical relevance (van Hoorn et al., 2017). Subsequent analysis was performed using DESeq2 (version 1.36.0) and edgeR (version 3.38.2), with statistical significance determined by an adjusted p-value <0.05 and absolute log2-fold change (|log2FC|) > 1.5, which served as thresholds to identify DEGs.
Enrichment analysis
Functional enrichment analysis was performed using the ClusterProfiler package in R (version 4.4.4) to identify the Gene Ontology (GO) terms, followed by gene set enrichment analysis (GSEA). DEGs were selected based on VCAM-1 expression. GO analysis involves three main categories: Cellular components, molecular functions, and biological processes. GSEA is a computational method evaluating the statistical significance and consistency of gene expression changes for a specified gene set under two biological conditions. The normalized enrichment score and adjusted p-value were used as the criteria to prioritize the enriched pathways for each phenotype. Gene sets with false discovery rates <0.25 and adjusted p-values <0.05 were considered to be significantly enriched.
Immune infiltration analysis
Using the GSVA package (version 1.46.0) (Hanzelmann et al., 2013) in R, single-sample GSEA was conducted to explore the relationship between VCAM-1 and the signature genes in 24 immune cell types. We systematically analyzed the immune infiltrates associated with VCAM-1 using published literature (Bindea et al., 2013). Both Spearman’s correlation and Wilcoxon rank-sum tests were used to compare immune cell infiltration between the VCAM-1 high and low expression groups.
Protein–protein interaction network
Next, protein–protein interaction network of coregulated DEGs and functional interactions among proteins were analyzed using the Search Tool for the Retrieval of Interacting Genes/Proteins database (http://string-db.org) (Szklarczyk et al., 2019). The results were visualized using the Cytoscape software.
Validation analysis
Immunohistochemistry data from the Human Protein Atlas database (https://www.proteinatlas.org/) were analyzed to further validate our findings. This analysis provided visual evidence of the VCAM-1 expression patterns in the normal and tumor tissues.
Statistical analyses
Statistical data from TCGA database were processed using R (version 4.2.1). Wilcoxon rank-sum and signed-rank tests were used to compare the VCAM-1 expression levels between patients with GC and healthy controls. Associations between VCAM-1 levels and various clinicopathological factors were assessed via Welch’s one-way analysis of variance, followed by the Bonferroni correction or t-test, as appropriate. Hazard ratio (HR) for OS was estimated using univariate Cox proportional hazard regression models, whereas HR for individual factors was determined using 95% confidence intervals. Receiver operating characteristic (ROC) analysis of VCAM-1 was performed using the pROC package, yielding an area under the curve of 0.5–1.0, indicating 50%–100% discrimination ability. Time-dependent ROC curve analysis was conducted to assess the ability of VCAM-1 to predict the GC outcomes at one, three, and 5 years. ROC analysis for VCAM-1 diagnostic accuracy estimation (tumor vs. normal) and time-dependent ROC analysis for survival prediction were performed using TCGA–stomach adenocarcinoma cohort. All statistical tests were considered significant at two-tailed p-values ≤0.05.
Results
Clinical characteristics
Using TCGA database, our analysis of VCAM-1 expression patterns in various cancer and normal tissues revealed the notable upregulation of VCAM-1 levels in most cancer types (Figure 1A). Specifically, both unpaired and paired differential expression analyses of the normal and GC cohorts revealed significantly higher VCAM-1 levels in the tumor tissues than in the normal tissues (Figures 1B,C). Clinical characteristics, including age, sex, TNM staging, pathological stage, histological grade, and survival, of 375 patients with GC are summarized in Table 1. The study cohort consisted of 241 males and 134 females. Fisher’s exact test revealed a significant correlation between VCAM-1 expression and patient OS (p = 0.029). Additionally, chi-square analysis indicated the correlations between VCAM-1 expression and pathological stage (p < 0.001), T stage (p = 0.046), N stage (p = 0.074, approaching significance), and histological grade (p < 0.001), with no significant correlation observed with the other clinicopathological features. To further explore the VCAM-1 expression patterns in tumors, we analyzed immunohistochemistry data from the Human Protein Atlas database. Notably, normal tissues exhibited negative VCAM-1 staining, in contrast to tumor tissues, which exhibited medium-to-strong VCAM-1 staining. This suggests that VCAM-1 expression levels are upregulated in malignancies (Figure 1D). These findings suggest VCAM-1 as a potential biomarker and therapeutic target for various cancer types, including GC.
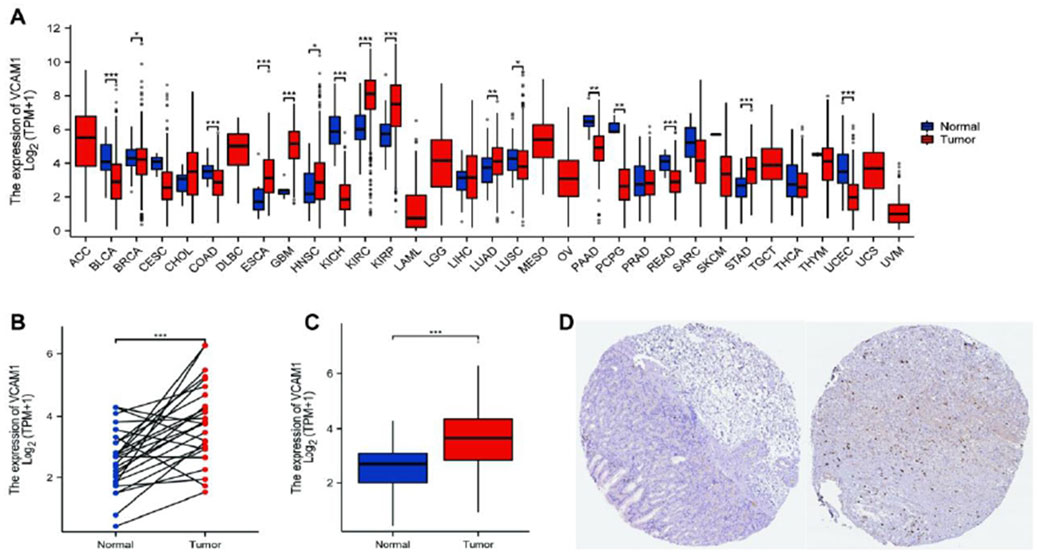
Figure 1. Expression level of VCAM-1 gene in GC. (A) VCAM1 expression (log2 (TPM+1)) across TCGA cancer types (T) vs. normal tissues (N). Red: Tumor, Blue: Normal. Wilcoxon rank-sum test. (B) VCAM1 expression in GC tumors vs. paired adjacent normal tissues (n = 27 pairs). Paired Wilcoxon test, p < 0.01. (C) VCAM1 expression in unpaired GC tumors vs. normal tissues. Wilcoxon rank-sum test. (D) Representative IHC images from HPA database showing VCAM-1 protein expression (brown stain) in normal gastric tissue (negative) and GC tissue (medium/strong). *P < 0.05; **P < 0.01; ***P < 0.001.
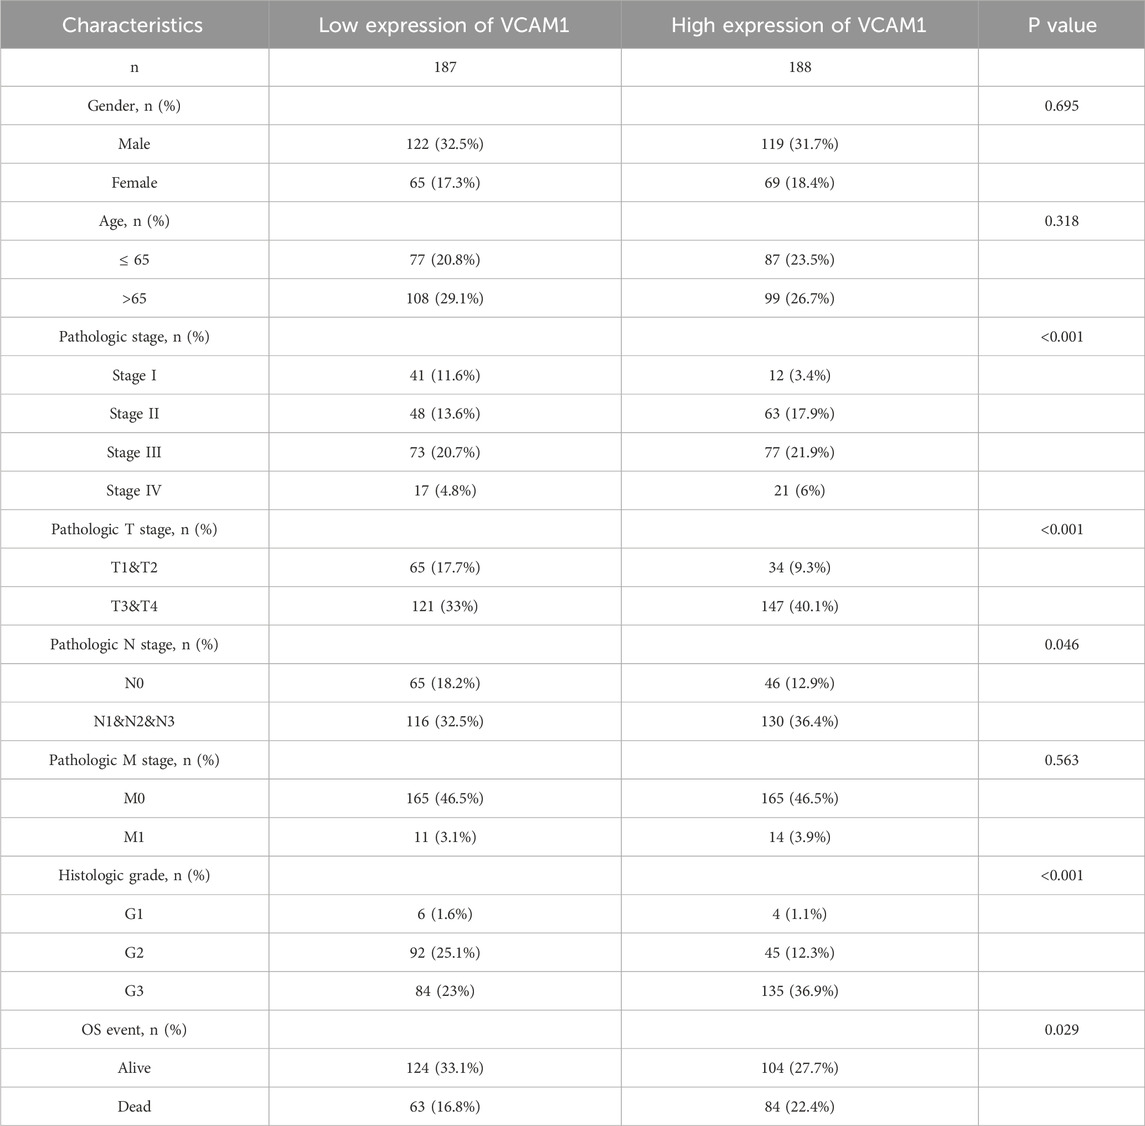
Table 1. Demographic and clinicopathological parameters of high and low VCAM-1 expression group patients with GC in TCGA.
Associations between VCAM-1 expression and various clinicopathologic variables
Welch’s one-way analysis of variance revealed significant correlations between VCAM-1 expression and both the M stage and histologic grade of GC (Figures 2C,E). Additionally, t-tests confirmed the significant correlations between VCAM-1 expression and T, N, and overall pathological stages (Figures 2A,B,D). Logistic regression analysis reinforced these associations, indicating VCAM-1 as a crucial predictor of the T stage (p < 0.001), N stage (p = 0.047), and histological grade (p < 0.001; Table 2). Figure 2F shows the VCAM-1 expression distribution, survival status of patients with GC, and corresponding risk scores. Blue dots indicate the increased patients with GC, whereas red dots indicate the deceased patients with GC. Horizontal line indicates the median risk score, clearly separating the low-risk (left, low VCAM-1 expression) and high-risk (right, high VCAM-1 expression) groups. As the risk score increased, a notable trend emerged, with an incremental increase in the deceased patient (red dots) proportion, indicating poor survival outcomes and high mortality risk in the high-risk group. To validate the diagnostic accuracy of VCAM-1, we performed ROC analysis, which yielded an area under the curve of 0.76 (95% confidence interval: 0.685–0.836; Figure 2G). Additionally, we conducted time-dependent ROC analysis to evaluate the predictive capacity of VCAM-1 for OS at one, three, and 5 years (Figure 2H). Based on the median VCAM-1 level, patients with GC were divided into the high and low VCAM-1 expression groups, with the high expression group showing a strong association with poor OS, as indicated by an HR of 1.54 (95% confidence interval: 1.01–2.36; p = 0.046) in Figure 2I. These results confirm the clinical importance of VCAM-1 as a promising biomarker for the risk stratification and prognostic prediction of GC.
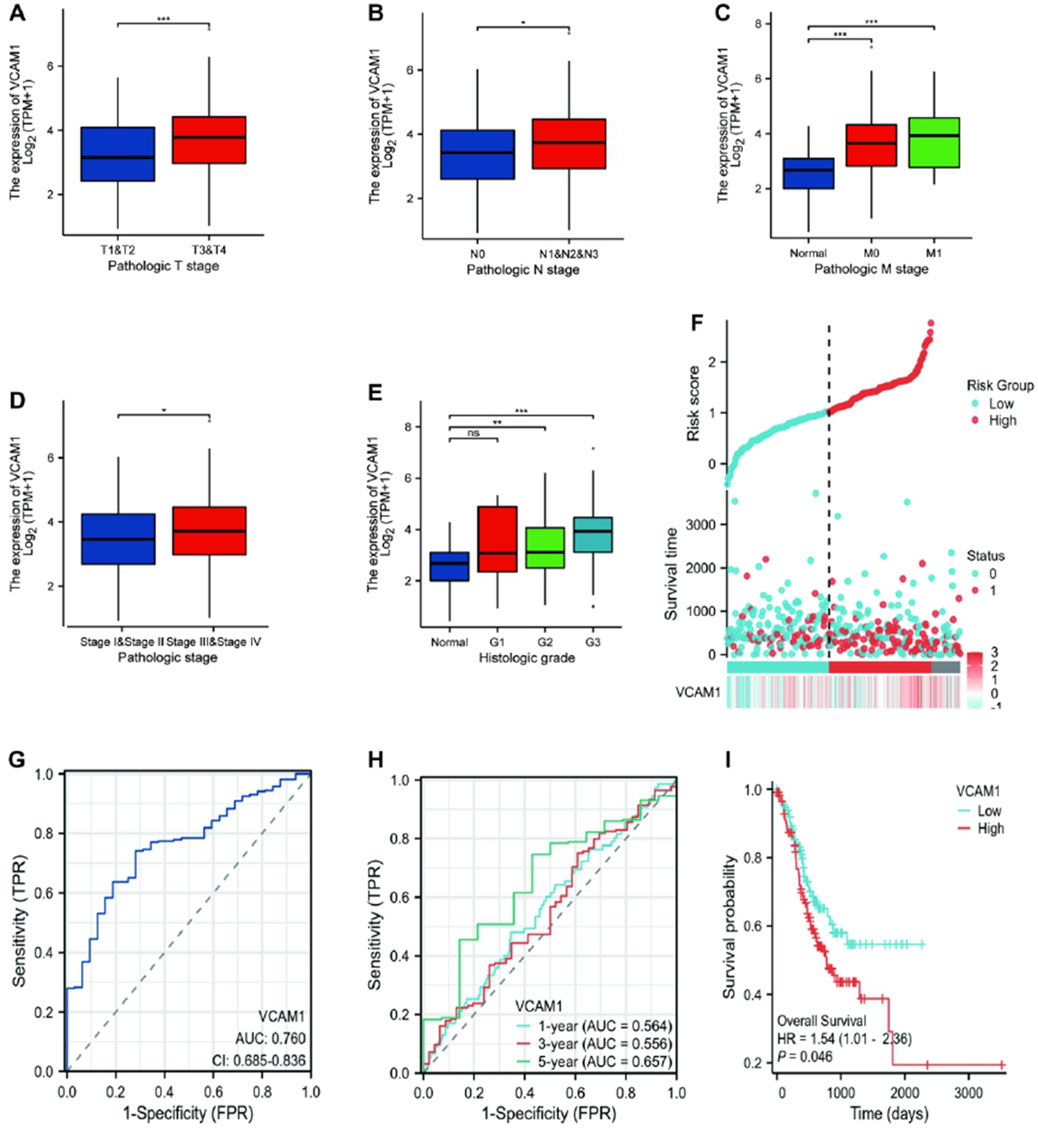
Figure 2. Association between the VCAM-1 expression and different clinicopathologic characteristics. (A–E) Boxplots showing VCAM1 expression (log2 (TPM+1)) across (A) T stages, (B) N stages, (C) M stages, (D) Pathologic stages, (E) Histologic grades. Welch’s ANOVA or t-test p-values shown. (F) Distribution of VCAM1 expression (ordered left to right), patient survival status (Blue dots: inceased patients; Red dots: deceased patients), and risk score. Vertical dashed line: Median risk score separating Low (Left) and High (Right) risk groups. (G) ROC curve for VCAM1 diagnostic power (Tumor vs. Normal). AUC and 95% CI shown. (H) Time-dependent ROC curves for VCAM1 predicting 1-, 3-, and 5-year overall survival. AUC values shown. (I) Kaplan-Meier survival curves for High vs. Low VCAM1 expression groups. Log-rank p-value and Hazard Ratio (HR) with 95% CI shown.
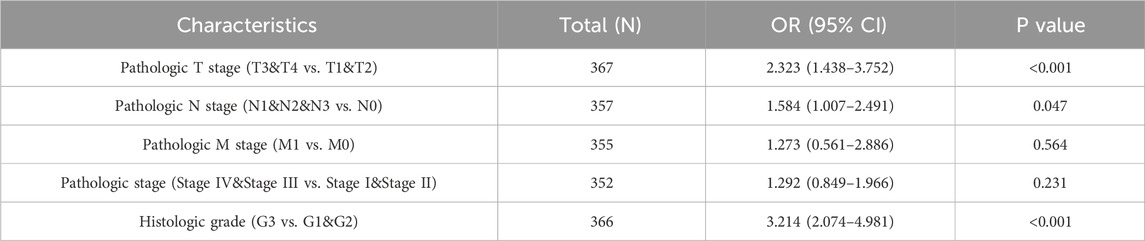
Table 2. VCAM-1 expression correlated with clinicopathological characteristics analyzed by logistic regression.
Association between VCAM-1 expression and immune infiltration
Spearman’s correlation analysis was conducted to examine the association between VCAM-1 expression (in TPM format) and immune cell infiltration quantified using the single-sample GSEA scores. Our results revealed that VCAM-1 expression was positively correlated with Th1, natural killer (NK), and cytotoxic and CD8+ T cell infiltration (Figures 3A–D). Notably, infiltration of these immune cell subsets was significantly higher in the VCAM-1 high expression group than in the VCAM-1 low expression group (p < 0.05; Figure 3E). VCAM-1 expression was also positively correlated with the infiltration of multiple immune cell types, including T cells, macrophages, dendritic cells (immature and activated), T follicular helper cells, effector memory T cells, B cells, regulatory T cells, plasmacytoid dendritic cells, mast cells, and central memory T cells. In contrast, an inverse correlation was observed between VCAM-1 expression and NK CD56bright and Th17 cell infiltration (Figure 3F). These results suggest the crucial role of VCAM-1 in regulating the immune infiltration patterns in GC. A heatmap was plotted to further understand the complexity of the correlations among the 24 distinct tumor-infiltrating immune cell subpopulations (Figure 3G). The heat map provided a comprehensive snapshot of the varying degrees of correlation among different immune cell subsets, revealing intricate patterns potentially affecting the immunobiology of GC.
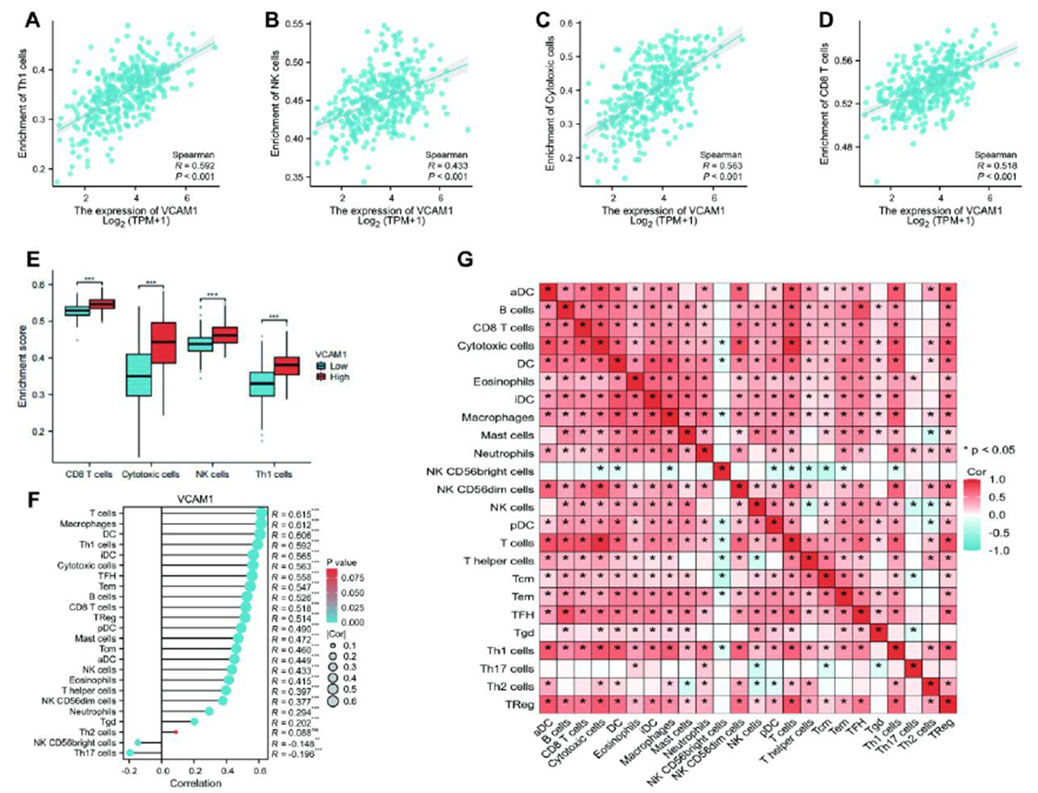
Figure 3. The results of analysis between VCAM-1 expression and immune infiltration. (A–D) Scatter plots showing Spearman correlation (r and p-value) between VCAM1 expression (log2 (TPM+1)) and SSGSEA scores for (A) Th1 cells, (B) NK cells, (C) Cytotoxic cells, (D) CD8+ T cells. (E) Boxplots comparing ssGSEA scores of key immune cells between High and Low VCAM1 groups (Wilcoxon rank-sum test, *p < 0.05). (F) Bar plot showing Spearman correlation coefficients (r) between VCAM1 expression and ssGSEA scores of 24 immune cell types. *p < 0.05. (G) Heatmap of Spearman correlation coefficients among ssGSEA scores of 24 immune cell types in GC samples. Color scale: Red (positive), Blue (negative).
Differential expression analysis of VCAM-1 in GC
Using stringent cut-off criteria of |log2FC| > 1.5 and adjusted p-value <0.05, we analyzed the HTSeq-count data from TCGA, identifying a cohort of 875 DEGs related to VCAM-1. DEG expression patterns were visualized using a volcano plot that provided a clear overview of their significance and magnitude of change (Figure 4A). To evaluate potential correlations, the top 5 genes positively or negatively correlated with VCAM-1 were selected for co-expression heatmap visualization (Figure 4B). In terms of functional implications, GO analysis revealed the significant regulatory roles of VCAM-1-associated DEGs in various biological processes, including epidermis development, keratinization, keratinocyte differentiation, epidermal cell differentiation, skin development, immunoglobulin binding, calcium-dependent protein binding, and interleukin-17 signaling. Notably, these DEGs were also observed in the structural components of the epidermis, cytoskeleton, and hematopoietic cell lineages, highlighting their diverse functions (Figure 4C). To visualize the complex network of VCAM-1 and its co-expression partners among the identified VCAM-1-related DEGs, a network diagram was created to provide insights into their potential interactions and functional modules (Figure 4D). To uncover the specific biological functions of VCAM-1 at the pathway level, we performed GSEA of GC datasets stratified by low and high VCAM-1 expression. This analysis revealed the Kyoto Encyclopedia of Genes and Genomes pathways significantly associated with VCAM-1, providing valuable insights into its potential action mechanisms (Figures 4E,F). These findings highlight the significance of VCAM-1 in GC, facilitating its further functional validation and therapeutic exploration.
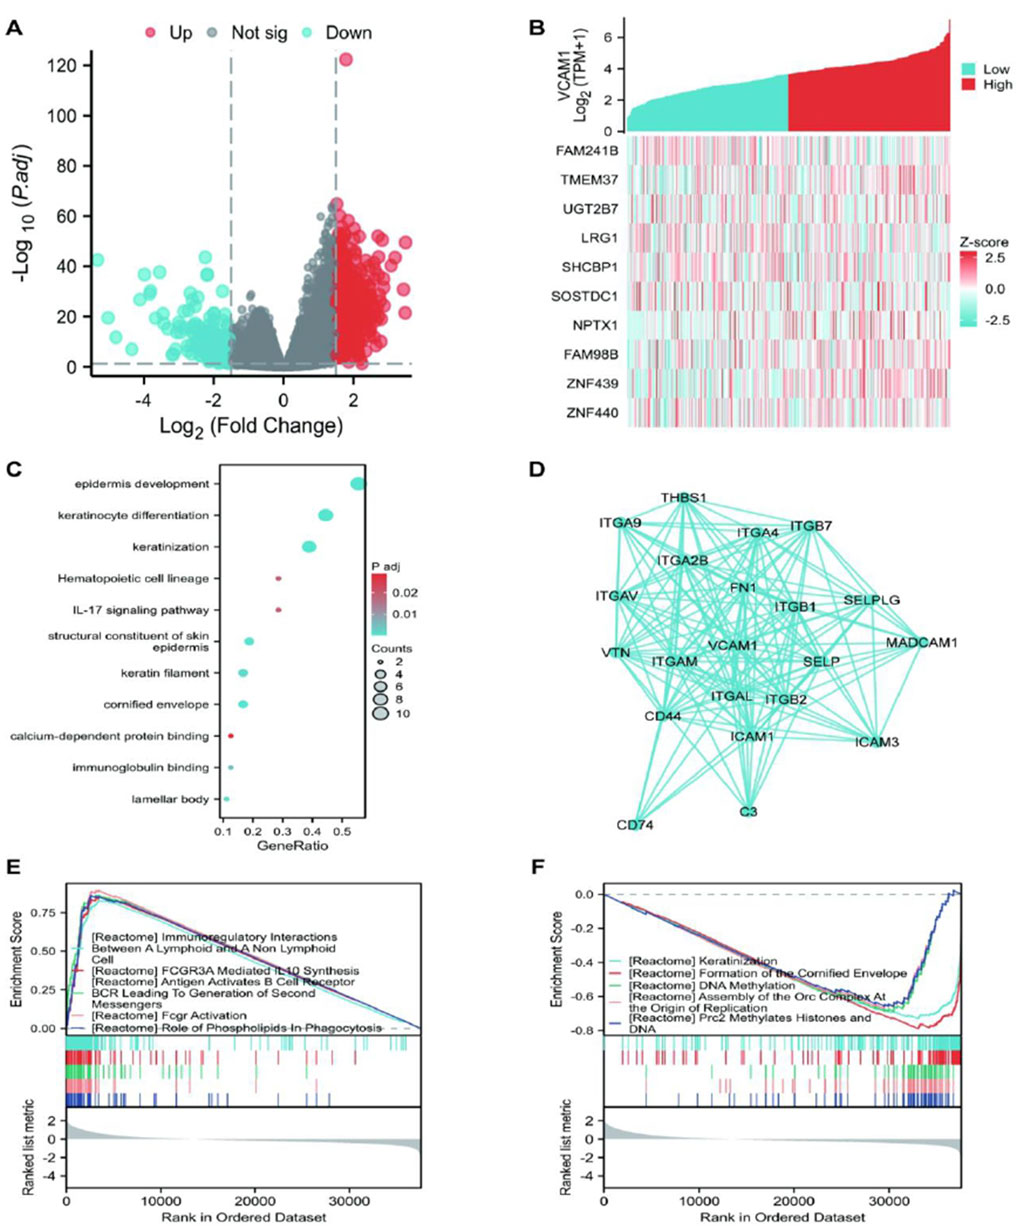
Figure 4. The results of differentially expressed gene (DEG) analysis and Enrichment analysis of VCAM-1 gene in GC. (A) Volcano plot of DEGs (|log2FC|> 1.5, adj. p < 0.05). Red dots: Significantly upregulated genes; Blue dots: Significantly downregulated genes; Gray dots: Non-significant genes. Dashed lines indicate cutoffs. (B) Heatmap showing expression (Z-score) of the top 10 genes positively (Red) and negatively (Blue) correlated with VCAM1. (C) Top enriched GO Biological Process terms for VCAM1-associated DEGs. Dot size represents gene count, color represents adjusted p-value. (D) PPI network of top VCAM1-interacting partners from STRING database (confidence score >0.7). (E,F) Top enriched KEGG pathways from GSEA in High vs. Low VCAM1 groups. NES: Normalized Enrichment Score, FDR: False Discovery Rate.
Discussion
Immune checkpoint blockade therapy has significantly advanced GC treatment (Patel et al., 2022). However, it faces various challenges, such as immunotherapy resistance and immune evasion (Zhang et al., 2021), necessitating the identification of new biomarkers to predict the immunotherapy efficacy. Therefore, in this study, we investigated VCAM-1 expression in GC and its correlation with patient prognosis using bioinformatics tools. We also analyzed the VCAM-1 regulation patterns in immune cells within the GC tumor microenvironment (TME). Our findings suggest VCAM-1 as a potential prognostic predictor for patients with GC and immune infiltration.
In this study, VCAM-1 levels were significantly upregulated in the GC tissues, consistent with a previous report on VCAM-1 overexpression in various cancer types (Schlesinger and Bendas, 2015). This study revealed the strong correlation between high VCAM-1 expression and poor patient prognosis. Expression of VCAM-1, a glycoprotein, is induced by various factors, including the tumor necrosis factor-α, reactive oxygen species, and oxidized low-density lipoproteins (Cook-Mills et al., 2011). VCAM-1 silencing inhibits cancer cell proliferation and is associated with poor prognosis in GC patients (Li et al., 2023). Notably, VCAM-1 is a promising candidate to improve GC prognosis and treatment.
Using differential gene expression analysis, we identified a set of key tumor-associated genes, including TMEM37, UGT2B7, LRG1, and SHCBP1. TMEM37 is an independent prognostic marker for colon cancer (Li et al., 2018). UGT2B7 activation disrupts the estrogen homeostasis in breasts, exacerbating breast tumor metastasis (Xu et al., 2024). Moreover, activation of the angiogenic factor, LRG1, promotes colorectal cancer progression (Zhu et al., 2023). SHCBP1 knockdown significantly inhibits the proliferation and migration of pancreatic cancer cells in vitro (Ma et al., 2024). These findings underscore the crucial role of VCAM-1 in the regulation of various tumor-related genes, ultimately influencing tumor formation and progression.
In addition to evaluating the prognostic importance of VCAM-1, this study explored its complex interplay with the TME, focusing specifically on its strong correlation with immune cell infiltration. TME, encompassing tumor-associated fibroblasts, immune cells, angiogenic cells, and the extracellular matrix, is a vital site for GC cell growth and metastasis. Intercellular interactions and cytokines secreted within the TME collectively contribute to GC progression and immune evasion (Yu et al., 2007). For example, increased B7-H1 (programmed death-ligand 1) expression on GC cell surface inhibits T cell activity, enabling tumor cells to evade immune surveillance (Liu et al., 2022). Furthermore, GC cells promote immune evasion by secreting immunosuppressive factors, such as the transforming growth factor-β and interleukin-10, thereby affecting the immune cell functions in the TME (Yu et al., 2007). This study revealed the strong correlation between elevated VCAM-1 expression and immune cell (including Th1, NK, and cytotoxic and CD8+ T cells) infiltration in GC tissues (Figures 3A–G). Th1 cells are vital immune cells facilitating the elimination of cancer cells via innate immune effectors, such as cytotoxic T lymphocytes, NK cells, and macrophages (Gao et al., 2021). NK cells, a subset of innate lymphoid cells, exhibit diverse killing mechanisms and have recently garnered attention for potential immunotherapy applications (Zhang et al., 2023). Upon entering tumor sites, NK–tumor interactions trigger comprehensive activation signals for various killing activities, including cytolytic granule release, death receptor–ligand interactions, and antibody-dependent cellular cytotoxicity (Huntington et al., 2020). CD8+ T cells specifically target and kill tumor cells, playing crucial roles in various cancers (van der Leun et al., 2020).
VCAM-1 activates the AKT–mechanistic target of rapamycin kinase pathway, which mediates the C-X-C motif chemokine ligand 1 expression and promotes human GC-derived mesenchymal stem cell recruitment, thereby increasing immunosuppression and GC progression (Zhao et al., 2024). This pathway explains the correlation between high VCAM-1 expression and poor patient prognosis and altered immune infiltration observed in this study. VCAM-1-mediated VLA-4 binding recruits tumor-associated macrophages (e.g., in breast cancer metastases to the lungs (Chen et al., 2011)). A negative correlation was observed between VCAM-1 expression and Th17 cell infiltration (p < 0.05; Figure 3F) in this study. The balance between Th17 and regulatory T cell proportions is an important factor regulating autoimmunity and cancer (Knochelmann et al., 2018). This GC-specific Th17 association possibly contributes to an aggressive phenotype and limited immunotherapy responses in patients with high VCAM-1 expression.
VCAM-1 potentially plays active roles in recruiting and activating specific immune cell populations, particularly T cells and macrophages, which subsequently shape the antitumor immune landscape. The complex relationship between VCAM-1 expression and immune cell infiltration highlights the multifunctional role of this adhesion molecule in gastric cells. VCAM-1 facilitated the influx of immune cells into the tumor site, potentially orchestrating an immune response to promote or inhibit tumor progression, depending on the context and specific immune cell subsets involved. Therefore, elucidation of the precise mechanisms governing VCAM-1-mediated immune cell recruitment and activation is important for the development of novel therapeutic strategies to modulate the TME and enhance the antitumor immunity.
This study has some limitations. First, although the crucial role of VCAM-1 in GC tumorigenesis was identified, further in vitro and in vivo experiments are necessary to validate the correlation between VCAM-1 expression and GC progression and elucidate the fundamental action mechanisms of VCAM-1 in driving GC progression. Second, clinical studies are vital to assess the associations between VCAM-1 expression and various clinical characteristics, including tumor staging and prognostic significance, of patients with GC. These evaluations are crucial to gain deeper insights into the ways in which VCAM-1 expression patterns can guide patient stratification and inform treatment decisions to improve the patient outcomes.
In summary, this study highlighted the significance of VCAM-1 as a prognostic biomarker and pivotal regulator of immune cell infiltration and TME dynamics in GC. Future studies should explore the molecular mechanisms underlying VCAM-1 immunomodulatory effects and assess its therapeutic potential for GC. These efforts can contribute to the development of innovative diagnostic, prognostic, and therapeutic approaches for this devastating disease.
Data availability statement
The datasets presented in this study can be found in online repositories. The names of the repository/repositories and accession number(s) can be found in the article/supplementary material.
Author contributions
CW: Writing – original draft, Writing – review and editing. YL: Investigation, Writing – review and editing. CL: Data curation, Methodology, Writing – review and editing. CF: Conceptualization, Funding acquisition, Writing – review and editing.
Funding
The author(s) declare that financial support was received for the research and/or publication of this article. This study was supported by the Fengshan Engineering Disciplines Program (Grant No. 2023040016) and Jiangxi Provincial Health Commission Science and Technology Project (Grant No. 202410879).
Acknowledgments
This study used TCGA database to obtain valuable data resources.
Conflict of interest
The authors declare that this study was conducted in the absence of any commercial or financial relationships that could be construed as potential conflicts of interest.
Generative AI statement
The author(s) declare that no Generative AI was used in the creation of this manuscript.
Any alternative text (alt text) provided alongside figures in this article has been generated by Frontiers with the support of artificial intelligence and reasonable efforts have been made to ensure accuracy, including review by the authors wherever possible. If you identify any issues, please contact us.
Publisher’s note
All claims expressed in this article are solely those of the authors and do not necessarily represent those of their affiliated organizations, or those of the publisher, the editors and the reviewers. Any product that may be evaluated in this article, or claim that may be made by its manufacturer, is not guaranteed or endorsed by the publisher.
References
Bindea, G., Mlecnik, B., Tosolini, M., Kirilovsky, A., Waldner, M., Obenauf, A. C., et al. (2013). Spatiotemporal dynamics of intratumoral immune cells reveal the immune landscape in human cancer. Immunity 39 (4), 782–795. doi:10.1016/j.immuni.2013.10.003
Bray, F., Laversanne, M., Sung, H., Ferlay, J., Siegel, R. L., Soerjomataram, I., et al. (2024). Global cancer statistics 2022: globocan estimates of incidence and mortality worldwide for 36 cancers in 185 countries. CA. Cancer J. Clin. 74 (3), 229–263. doi:10.3322/caac.21834
Chen, Q., Zhang, X. H., and Massague, J. (2011). Macrophage binding to receptor vcam-1 transmits survival signals in breast cancer cells that invade the lungs. Cancer Cell 20 (4), 538–549. doi:10.1016/j.ccr.2011.08.025
Cook-Mills, J. M., Marchese, M. E., and Abdala-Valencia, H. (2011). Vascular cell adhesion molecule-1 expression and signaling during disease: regulation by reactive oxygen species and antioxidants. Antioxid. Redox Signal. 15 (6), 1607–1638. doi:10.1089/ars.2010.3522
Gao, S., Hsu, T. W., and Li, M. O. (2021). Immunity beyond cancer cells: perspective from tumor tissue. Trends Cancer 7 (11), 1010–1019. doi:10.1016/j.trecan.2021.06.007
Gil-Bernabe, A. M., Ferjancic, S., Tlalka, M., Zhao, L., Allen, P. D., Im, J. H., et al. (2012). Recruitment of monocytes/macrophages by tissue factor-mediated coagulation is essential for metastatic cell survival and premetastatic niche establishment in mice. Blood 119 (13), 3164–3175. doi:10.1182/blood-2011-08-376426
Hanzelmann, S., Castelo, R., and Guinney, J. (2013). Gsva: gene set variation analysis for microarray and rna-seq data. BMC Bioinformatics 14, 7. doi:10.1186/1471-2105-14-7
Huntington, N. D., Cursons, J., and Rautela, J. (2020). The cancer-natural killer cell immunity cycle. Nat. Rev. Cancer 20 (8), 437–454. doi:10.1038/s41568-020-0272-z
Knochelmann, H. M., Dwyer, C. J., Bailey, S. R., Amaya, S. M., Elston, D. M., Mazza-McCrann, J. M., et al. (2018). When worlds collide: th17 and treg cells in cancer and autoimmunity. Cell. Mol. Immunol. 15 (5), 458–469. doi:10.1038/s41423-018-0004-4
Kuai, W. X., Wang, Q., Yang, X. Z., Zhao, Y., Yu, R., and Tang, X. J. (2012). Interleukin-8 associates with adhesion, migration, invasion and chemosensitivity of human gastric cancer cells. World J. Gastroenterol. 18 (9), 979–985. doi:10.3748/wjg.v18.i9.979
Li, C., Shen, Z., Zhou, Y., and Yu, W. (2018). Independent prognostic genes and mechanism investigation for colon cancer. Biol. Res. 51 (1), 10. doi:10.1186/s40659-018-0158-7
Li, X., Wang, Y., Zhai, Z., Mao, Q., Chen, D., Xiao, L., et al. (2023). Predicting response to immunotherapy in gastric cancer via assessing perineural invasion-mediated inflammation in tumor microenvironment. J. Exp. Clin. Cancer Res. 42 (1), 206. doi:10.1186/s13046-023-02730-0
Liu, Y., Li, C., Lu, Y., Liu, C., and Yang, W. (2022). Tumor microenvironment-mediated immune tolerance in development and treatment of gastric cancer. Front. Immunol. 13, 1016817. doi:10.3389/fimmu.2022.1016817
Lu, L. G., Zhou, Z. L., Wang, X. Y., Liu, B. Y., Lu, J. Y., Liu, S., et al. (2022). Pd-l1 blockade liberates intrinsic antitumourigenic properties of glycolytic macrophages in hepatocellular carcinoma. Gut 71 (12), 2551–2560. doi:10.1136/gutjnl-2021-326350
Ma, Z., Gu, Q., Dai, Y., Wang, Q., Shi, W., and Jiao, Z. (2024). Therapeutic potential of shcbp1 inhibitor azd5582 in pancreatic cancer treatment. Cancer Sci. 115 (3), 820–835. doi:10.1111/cas.16059
Minn, A. J., Gupta, G. P., Siegel, P. M., Bos, P. D., Shu, W., Giri, D. D., et al. (2005). Genes that mediate breast cancer metastasis to lung. Nature 436 (7050), 518–524. doi:10.1038/nature03799
Osborn, L., Hession, C., Tizard, R., Vassallo, C., Luhowskyj, S., Chi-Rosso, G., et al. (1989). Direct expression cloning of vascular cell adhesion molecule 1, a cytokine-induced endothelial protein that binds to lymphocytes. Cell 59 (6), 1203–1211. doi:10.1016/0092-8674(89)90775-7
Patel, R. S., Romero, R., Watson, E. V., Liang, A. C., Burger, M., Westcott, P., et al. (2022). A gata4-regulated secretory program suppresses tumors through recruitment of cytotoxic cd8 t cells. Nat. Commun. 13 (1), 256. doi:10.1038/s41467-021-27731-5
Qian, B. Z., and Pollard, J. W. (2010). Macrophage diversity enhances tumor progression and metastasis. Cell 141 (1), 39–51. doi:10.1016/j.cell.2010.03.014
Rice, G. E., and Bevilacqua, M. P. (1989). An inducible endothelial cell surface glycoprotein mediates melanoma adhesion. Science 246 (4935), 1303–1306. doi:10.1126/science.2588007
Rose, D. M., Han, J., and Ginsberg, M. H. (2002). Alpha4 integrins and the immune response. Immunol. Rev. 186, 118–124. doi:10.1034/j.1600-065x.2002.18611.x
Schlesinger, M., and Bendas, G. (2015). Vascular cell adhesion molecule-1 (vcam-1)—an increasing insight into its role in tumorigenicity and metastasis. Int. J. Cancer 136 (11), 2504–2514. doi:10.1002/ijc.28927
Szklarczyk, D., Gable, A. L., Lyon, D., Junge, A., Wyder, S., Huerta-Cepas, J., et al. (2019). String v11: protein-protein association networks with increased coverage, supporting functional discovery in genome-wide experimental datasets. Nucleic Acids Res. 47 (D1), D607–D613. doi:10.1093/nar/gky1131
van der Leun, A. M., Thommen, D. S., and Schumacher, T. N. (2020). Cd8(+) t cell states in human cancer: insights from single-cell analysis. Nat. Rev. Cancer 20 (4), 218–232. doi:10.1038/s41568-019-0235-4
van Hoorn, R., Tummers, M., Booth, A., Gerhardus, A., Rehfuess, E., Hind, D., et al. (2017). The development of champ: a checklist for the appraisal of moderators and predictors. BMC Med. Res. Methodol. 17 (1), 173. doi:10.1186/s12874-017-0451-0
Wang, Y., Zhang, H., Liu, C., Wang, Z., Wu, W., Zhang, N., et al. (2022). Immune checkpoint modulators in cancer immunotherapy: recent advances and emerging concepts. J. Hematol. Oncol. 15 (1), 111. doi:10.1186/s13045-022-01325-0
Wu, T. C., Guarnieri, F. G., Staveley-O'Carroll, K. F., Viscidi, R. P., Levitsky, H. I., Hedrick, L., et al. (1995). Engineering an intracellular pathway for major histocompatibility complex class ii presentation of antigens. Proc. Natl. Acad. Sci. U. S. A. 92 (25), 11671–11675. doi:10.1073/pnas.92.25.11671
Xu, J., Zhou, Y., He, S., Wang, Y., Ma, J., Li, C., et al. (2024). Activation of the yy1-ugt2b7 axis promotes mammary estrogen homeostasis dysregulation and exacerbates breast tumor metastasis. Drug Metab. Dispos. 52 (5), 408–421. doi:10.1124/dmd.124.001640
Yu, H., Kortylewski, M., and Pardoll, D. (2007). Crosstalk between cancer and immune cells: role of stat3 in the tumour microenvironment. Nat. Rev. Immunol. 7 (1), 41–51. doi:10.1038/nri1995
Zhang, Y., Yang, H., Zhao, J., Wan, P., Hu, Y., Lv, K., et al. (2021). Activation of mat2a-rip1 signaling axis reprograms monocytes in gastric cancer. J. Immunother. Cancer 9 (2), e001364. doi:10.1136/jitc-2020-001364
Zhang, Y., Zhou, W., Yang, J., Yang, J., and Wang, W. (2023). Chimeric antigen receptor engineered natural killer cells for cancer therapy. Exp. Hematol. Oncol. 12 (1), 70. doi:10.1186/s40164-023-00431-0
Zhao, Y., Jiang, J., Zhou, P., Deng, K., Liu, Z., Yang, M., et al. (2024). H3k18 lactylation-mediated vcam1 expression promotes gastric cancer progression and metastasis via akt-mtor-cxcl1 axis. Biochem. Pharmacol. 222, 116120. doi:10.1016/j.bcp.2024.116120
Keywords: VCAM-1, gastric cancer, prognostic biomarker, immune infiltration, TCGA database
Citation: Wu C, Liu Y, Liu C and Fang C (2025) VCAM-1 predicts poor prognosis and modulates immune infiltration in gastric cancer: a TCGA-based bioinformatics study. Front. Genet. 16:1602929. doi: 10.3389/fgene.2025.1602929
Received: 30 March 2025; Accepted: 04 August 2025;
Published: 25 August 2025.
Edited by:
Songxiao Xu, University of Chinese Academy of Sciences, ChinaReviewed by:
Yuanshuai Huang, Southwest Medical University, ChinaQian Zhang, AmCare Genomics Lab, China
Copyright © 2025 Wu, Liu, Liu and Fang. This is an open-access article distributed under the terms of the Creative Commons Attribution License (CC BY). The use, distribution or reproduction in other forums is permitted, provided the original author(s) and the copyright owner(s) are credited and that the original publication in this journal is cited, in accordance with accepted academic practice. No use, distribution or reproduction is permitted which does not comply with these terms.
*Correspondence: Chuanfa Fang, ZmFuZ2NmNjExMzg3MkAxNjMuY29t