 Xianzhi Liu
 Mingmin Liang
 Ge Yu
Ge Yu Shichang Tang
 Ouxiang Wu1*
 Bin Zeng
 Lei Wang
- 1School of Information Engineering, Hunan Vocational College of Electronic and Technology, Changsha, China
- 2School of Intelligent Equipment, Hunan Vocational College of Electronic and Technology, Changsha, China
- 3School of Continuing Education, Central South University of Forestry and Technology, Changsha, China
- 4Big Data Innovation and Entrepreneurship Education Center of Hunan Province, Changsha University, Changsha, China
Introduction: Predicting the relationship between diseases and microbes can significantly enhance disease diagnosis and treatment, while providing crucial scientific support for public health, ecological health, and drug development.
Methods: In this manuscript, we introduce an innovative computational model named BANSMDA, which integrates Bilinear Attention Networks with sparse autoencoder to uncover hidden connections between microbes and diseases. In BANSMDA, we first constructed a heterogeneous microbe-disease network by integrating multiple Gaussian similarity measures for diseases and microbes, along with known microbe-disease associations. And then, we employed a BAN-based autoencoder and a sparse autoencoder module to learn node representations within this newly constructed heterogeneous network. Finally, we evaluated the prediction performance of BANSMDA using a 5-fold cross-validation framework.
Conclusion: Experiments results showed that BANSMDA achieved superior performance compared to other cutting-edge methods. To further assess its effectiveness, we carried out case studies on two common diseases (including Asthma and Colorectal carcinoma) and two important microbial genera (including Escherichia and Bacteroides), and in the top 20 predicted microbes, there were 19 and 20 having been confirmed by published literature respectively. Besides, in the top 20 predicted diseases, there were 19 and 19 having been confirmed by published literature separately. Therefore, it is easy to conclude that BANSMDA can achieve satisfactory prediction ability.
Introduction
A multitude of studies has underscored the significant influence that parasitic microbial communities within the human body exert on our metabolic processes (Kau et al., 2011). These microbes offer a range of benefits to humans, including the collection and storage of energy, the facilitation of organic compound absorption, and the defense against external microbes and diseases (Kim et al., 2018). Moreover, shifts within these microbial populations can potentially influence our health (Racanelli et al., 2018). Research also indicates that the onset of chronic diseases is intricately linked to the symbiotic microbiota that reside within us, particularly anomalies in the gut microbiota’s genome, which may lead to alterations in the human genome (Sampson et al., 2016). Furthermore, the diversity of microbial communities is closely associated with the incidence and progression of cardiovascular and neurodegenerative diseases, exerting a substantial impact on human health (Toya et al., 2020; Cryan and Dinan, 2012). Consequently, the deliberate modulation of the human microbiota’s abundance presents a promising avenue for bolstering our disease resistance and enhancing global health (Desbonnet et al., 2010). Specifically, fine-tuning the equilibrium of the gut microbiota can aid in combating viral infections. Additionally, the supplementation of lactobacilli and bifidobacteria not only assists in pain relief but also plays a role in regulating emotions and reducing anxiety, highlighting the multifaceted benefits of these microbial allies (Turnbaugh et al., 2007).
Given the inextricable links between microbes and human health, scientists have embarked on numerous microbiome-based disease research projects since the 21st century (Gilbert et al., 2010; Sun et al., 2018). However, traditional wet-lab methods for detecting microbial-disease associations, such as culture-dependent and quantitative methods, are time-consuming, requiring extensive periods for cultivation, observation, and detection of a wide variety of microbes. These methods also suffer from a degree of arbitrariness and inherent risks. To surmount the limitations of biological research, the application of computational methods has been on the rise in recent years, spurred by rapid advancements in biotechnology. Additionally, experimentally validated databases linking microbes to diseases, such as HMDAD (Ma et al., 2017) and Disbiome (Janssens et al., 2018), have been established, providing invaluable data resources for scientific inquiry. These databases serve as a treasure trove of information, facilitating a deeper understanding of the complex interplay between microorganisms and human health. For instance, reference (Park et al., 2021) employs sophisticated computational approaches, including hierarchical long short-term memory (LSTM) networks and ensemble parsing models, to unravel the complex associations between microbes and diseases. Reference (Lu et al., 2023) employs a cutting-edge combination of autoencoders and graph convolutional networks to predict potential associations between microbes and diseases. Reference (Chen et al., 2024a) introduces a pioneering human microbiota disease association prediction model that is grounded in multi-view latent feature learning, and reference (Hu et al., 2023) introduces a microbe-disease association prediction model based on generative adversarial networks.
In this manuscript, we proposed an innovative forecasting framework named BANSMDA to infer possible microbe-disease associations by combining Bilinear Attention Networks (BAN) with sparse autoencoder (SAE). By fusing the nuanced feature interactions discerned by BAN (Liang et al., 2025) with the proficiency of SAE in feature dimensionality reduction and representation learning, BANSMDA is expected to deliver more precise and dependable predictions within the realm of microbe-disease associations. As depicted in Figure 1, the key contributions of the BANSMDA encompass the following innovative aspects.
(1) A novel heterogeneous network B composed of microbes and diseases has been created by integrating the functional similarity network of microbes, the functional similarity network of diseases, and the existing microbe-disease associations.
(2) Utilize the BAN framework and the SEA framework respectively to derive node attribute representations within the heterogeneous network B.
(3) Integrate the attribute representations of the two types of nodes, leveraging their multiple original features, to construct comprehensive node features within network B.
(4) Calculate potential association scores for microbe-disease pairs using their feature matrices.
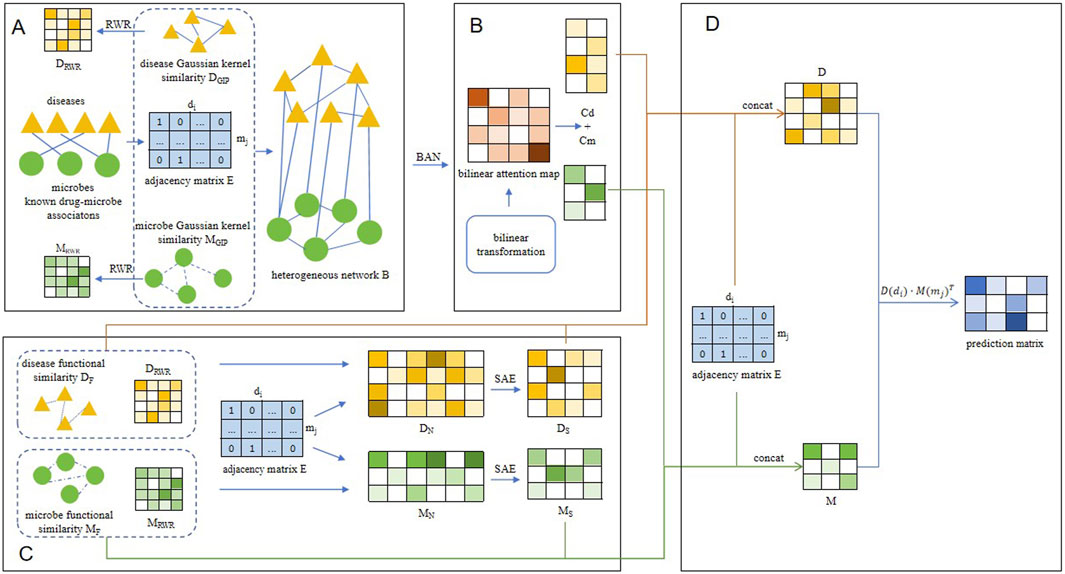
Figure 1. The overall structure diagram of BANSMDA. (A) The heterogeneous microbe-disease network was established by amalgamating the microbe Gaussian similarity network, the disease Gaussian similarity network, and known associations between microbes and diseases. (B) Learning node representation based on BAN. (C) Learning node representation based on SAE. (D) Predicting the final scores of potential microbe-disease associations.
Materials and methods
Data sources
In this section, we would download known microbe-disease associations from public databases including HMDAD and Disbiome separately, among them, HMDAD (Ma et al., 2017) was compiled by Ma et al., in 2017, and after eliminating duplicate entries, we downloaded 450 distinct association pairs involving 39 diseases and 292 microbes. Besides, Disbiome (Janssens et al., 2018) was compiled by Janssens Y et al., in 2018, and after eliminating duplicate entries, we extracted 5,573 established associations between 240 diseases and 1,098 microbes. Detailed statistical information was shown in Table 1.
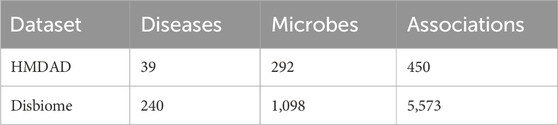
Table 1. The specific statistical data.
Methods
Microbe-disease incidence matrix
The incidence matrix
Microbe/Disease Gaussian kernel similarity
The similarity
In the Gaussian kernel similarity,
Absolutely, the Gaussian kernel similarity
Microbe/disease functional similarity
Under the premise that diseases with similar characteristics are likely to interact with analogous genes (Wei and Liu, 2020; Xu and Li, 2006), we proceeded to calculate the functional similarity of diseases based on the functional associations among genes implicated in these diseases. The recently unveiled HumanNet v2.0 database serves as a potent tool for efficiently accessing gene interactions (Hwang et al., 2019; Long et al., 2021), with each interaction being accompanied by a log-likelihood score (LLS). This LLS quantifies the likelihood of a functional connection existing between genes. For a pair of diseases, denoted as
where
where
where
In terms of microbe functional similarity, we employed the methodology advanced by Kamneva. (2017). To ascertain the functional similarity among microbes. To meticulously determine the functional similarity for any given pair of microbes, we initially sourced the protein-protein functional association network from the STRING v11 database (Szklarczyk et al., 2019). Utilizing the similarity scores derived therefrom, we constructed a microbe functional similarity matrix,
Constructing the heterogeneous network
By fusing the microbe-disease adjacency matrix with the disease Gaussian kernel similarity matrix and the microbe Gaussian kernel similarity matrix, as shown in Equation 10, we have crafted a heterogeneous network:
where
BAN model
Bilinear Attention Networks (BAN), introduced by Kim in 2018, are composed of a central component known as the bilinear attention mechanism, which is designed to learn the distribution of attention by considering the bilinear interactions between input channels. This network employs two critical techniques to enhance feature interaction and manage complex data relationships: bilinear transformation and attention mechanisms. Bilinear transformation, which uses a weight matrix and an additive bias to process input features, is adept at revealing nuanced relationships within complex datasets, providing a robust framework for analyzing interactions. Its formula can be expressed as:
In Equation 11,
In Equation 12, H1 denotes the weight matrix from the input layer to the hidden layer, b1 represents the bias vector of the hidden layer, and x, defined in Equation 11, corresponds to the input vector. In Equation 13, H2 and b2 are the weight matrix from the hidden layer to the output layer and the output layer’s bias vector, respectively. By substituting Equation 12 into Equation 13, we derive the final output y and a streamlined forward propagation formula, Equation 14, which explicitly formalizes the computation process. The activation function used within the network is ReLU, as defined in formula 15, which introduces non-linearity to the model and helps in learning complex patterns. The feature vector that undergoes processing by this ReLU activation function is referred to as
By feeding the heterogeneous network
SAE model
To effectively capture both the local and global topological intrinsic features of nodes, we have further implemented an enhanced version of Random Walk with Restart (RWR) on the
In Equation 16,
Following the aforementioned RWR process, it becomes evident that we can derive a new matrix
Consequently, by amalgamating all the matrices E,
Similarly, by integrating E,
Then, use the above two matrices as inputs to the sparse autoencoder (SAE). SAE excel in feature extraction and dimensionality reduction, enabling them to distill crucial features from intricate microbial data and reduce its complexity, which is particularly valuable for managing high-dimensional biomedical data. Additionally, the incorporation of sparsity penalties within SAE helps to constrain the activation of neurons in the hidden layer, thereby enhancing the model’s feature extraction capabilities. This sparse representation not only boosts predictive accuracy but also contributes to the interpretability of the model. SAE consists of the following steps:
Encoding process: Input data x is converted into a hidden layer representation h through an encoder, and
Among them,
Decoding process: The hidden layer representation h is reconstructed back to the original data
Among them,
Refactoring loss: Refactoring error is an indicator that measures the difference between the reconstructed data
Sparsity loss: To introduce sparsity, SAE adds a sparsity penalty term to the loss function, which is typically based on L1 regularization. The specific form is shown in Equation 23:
where
Total loss function: The total loss function, which is the sum of the reconstruction loss and the sparsity loss, serves as the objective function for optimization during the training process. It can be articulated as shown in Equation 24:
Consequently, by feeding the disease matrix
Microbe/disease feature matrix
Based on the processing results of BAN and SAE models, by integrating the disease matrix
Similarly, integrating the microbial matrix
Calculating the final predicted scores of potential microbe-disease associations
The dot product of two vectors serves as an effective mechanism for modeling interactions, highlighting the shared aspects of these interactions while diminishing the distinct information they might carry. Consequently, for any given disease
Experiments and results
In this part, we began by conducting a sensitivity analysis of crucial parameters to improve the model’s effectiveness. Next, we chose six state-of-the-art techniques to benchmark against BANSMDA. Additionally, to confirm the model’s reliability, we selected two exemplary microbes and diseases for evaluation.
Parameter sensitivity analysis
Considering the actual situation of the model, we identified and analyzed four parameters that have a significant impact on the final prediction results. These include the L2 regularization parameter
In this section, our objective is to determine the optimal settings while maintaining the separation of the training and testing datasets. Specifically, The range of values for
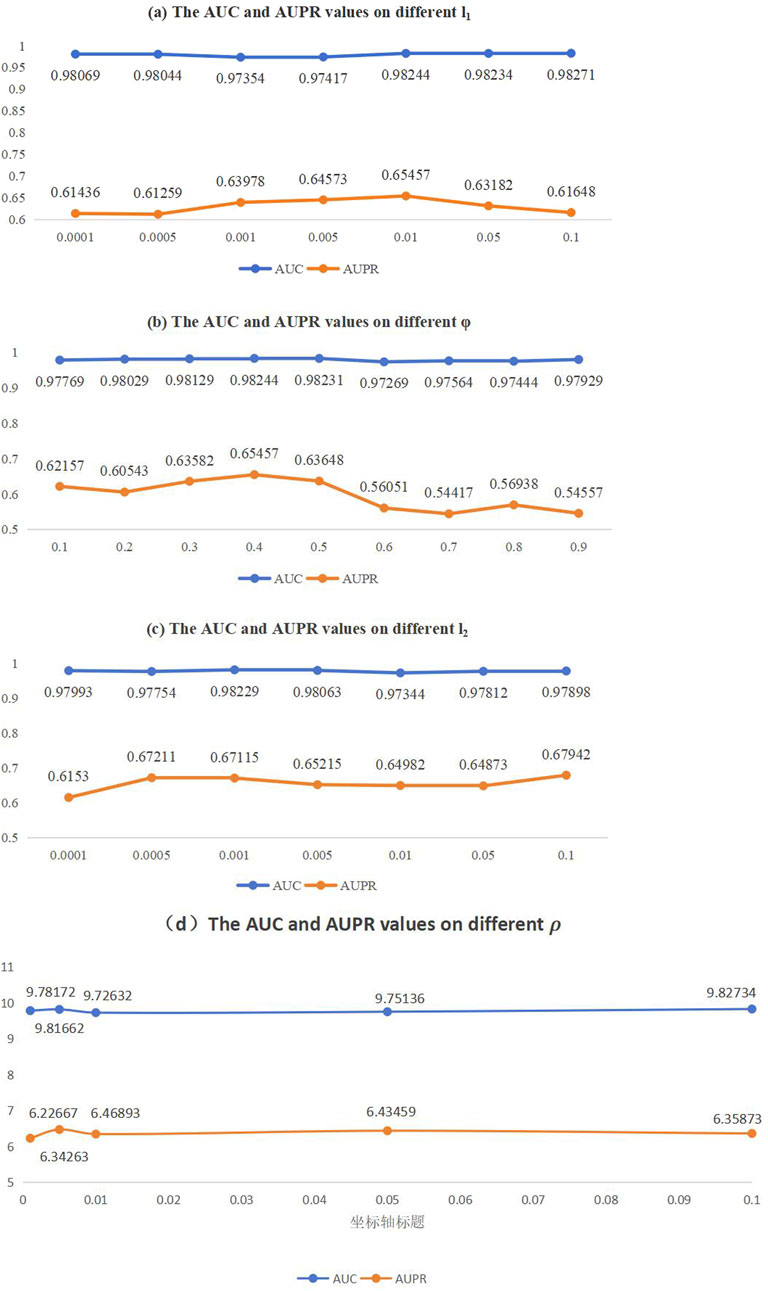
Figure 2. AUC and AUPR values on different parameter sensitivity analysis. (A) The AUC and AUPR values on different
Comparison with advanced methods
To further validate the predictive accuracy of BANSMDA, this section includes a comparative analysis with six prominent and competitive approaches. In the experiment, we employed the same 5-fold cross-validation technique on the HMDAD dataset for each method to ensure fair and consistent comparisons.
MOSFL-LNP (Chen et al., 2024b): This method involves preprocessing a similarity matrix, integrating low-order and high-order learning, optimizing and solving the associated equations, and finally normalizing the predicted association score matrix.
LRLSHMDA (Wang et al., 2017): This is a semi-supervised computational model utilizes the Gaussian interaction profile kernel similarity and the Laplacian regularized least squares classifier to predict the Potential Microbe-Disease associations.
BIRWMP (Shen et al., 2018): This method is a computational model based on bidirectional random walk, which predicts potential microbe-disease associations by conducting multipath analysis on microbe and disease similarity networks.
NTSHMDA (Luo and Long, 2020): A computational model based on neighborhood topology similarity, which is used for predicting the potential microbe-disease associations.
KATZHMDA (Chen et al., 2016): This is a computational method based on the KATZ algorithm, which calculates the association between microbes and diseases by considering the number and length of paths connecting two nodes in a microbe-disease heterogeneous network.
HMDA_Pred (Fan et al., 2020): This method is a novel computer model based on multi-data integration and network consistency projection, used for calculating the associations between microbes and diseases.
We assessed the performance of these models under their default parameter settings and five-fold cross-validation. By leveraging the HMDAD dataset, We comprehensively evaluated our model using four key metrics: AUC, AUPR, Accuracy, and F - score, all of which were obtained through averaging over five - fold cross - validation. The results are detailed in Table 2 and visualized in Figure 3, demonstrating the superior predictive performance and accuracy of the BANSMDA model compared to other methods.
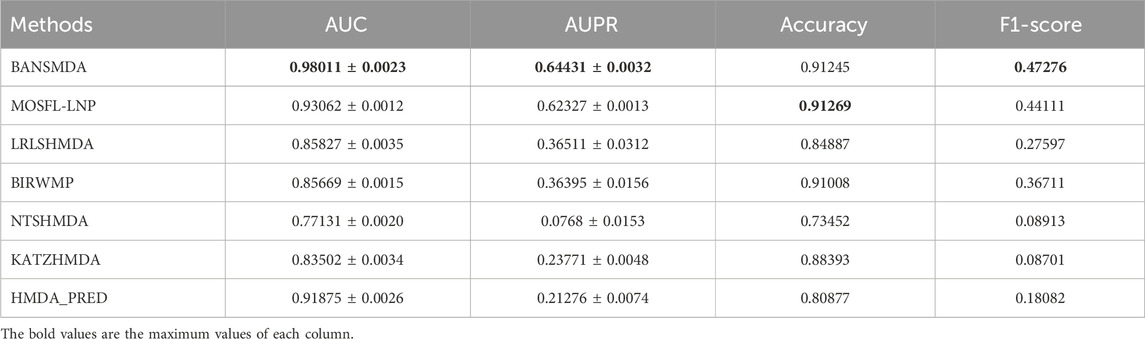
Table 2. Results of the compared methods.

Figure 3. AUC and AUPR curves of six competitive methods based on the HMDAD dataset. (A) AUC curves of six competitive methods based on the HMDAD dataset. (B) AUPR curves of six competitive methods based on the HMDAD dataset.
As detailed in Table 2, BANSMDA exhibits outstanding performance across three evaluation metrics: AUC, AUPR, and F1-Score. Specifically, compared to the MOSFL-LNP model, BANSMDA achieves a 5.31% improvement in AUC and a 3.37% improvement in AUPR. While slightly inferior to MOSFL-LNP in terms of Accuracy, the difference is negligible (only 0.00024). Collectively, these results confirm that BANSMDA is a highly efficient model for predicting microbe-disease associations.
As showen in Figure 4, we visualize the learned encoder weights and hidden layer activations to demonstrate the interpretability of the sparse representations. The results show that each hidden unit specializes in specific input features and exhibits sparse, selective activation patterns across samples, supporting our claim that the SAE produces interpretable representations.
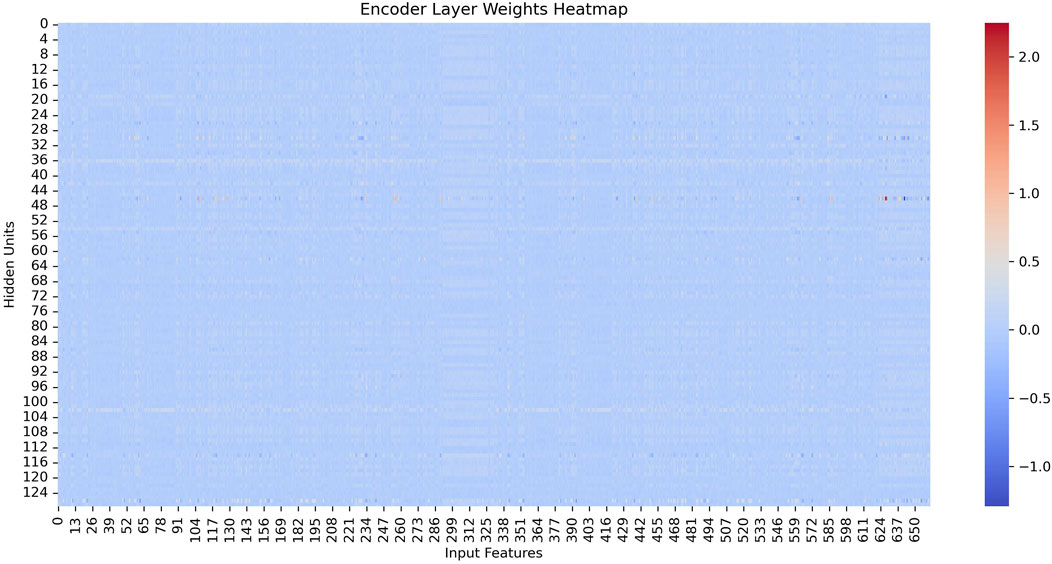
Figure 4. The encoder weight heat map of SAE.
Figure 4 shows the heatmap of the encoder weights after training. We observe that each hidden unit (row) assigns substantial weights to only a small subset of input features (columns), with most weights close to zero. This suggests that each hidden neuron specializes in detecting specific feature patterns in the input rather than responding indiscriminately to all dimensions. Such specialization is desirable because it allows us to attribute meaningful feature combinations to individual hidden units, enhancing interpretability of the learned representation.
Figure 5 depicts the hidden-layer activations at epoch 100. These heatmaps illustrate the activations of 32 hidden units (x-axis) across a batch of input samples (y-axis). We note two key observations: (1) the activations are sparse—for each sample, only a few hidden units exhibit high activation values, while most remain near zero; (2) the activation patterns are distinct and consistent—different hidden units activate for different samples, and the same unit responds consistently to similar samples across epochs. These findings indicate that the hidden layer learns a set of specialized, non-redundant detectors that respond selectively to specific input patterns.
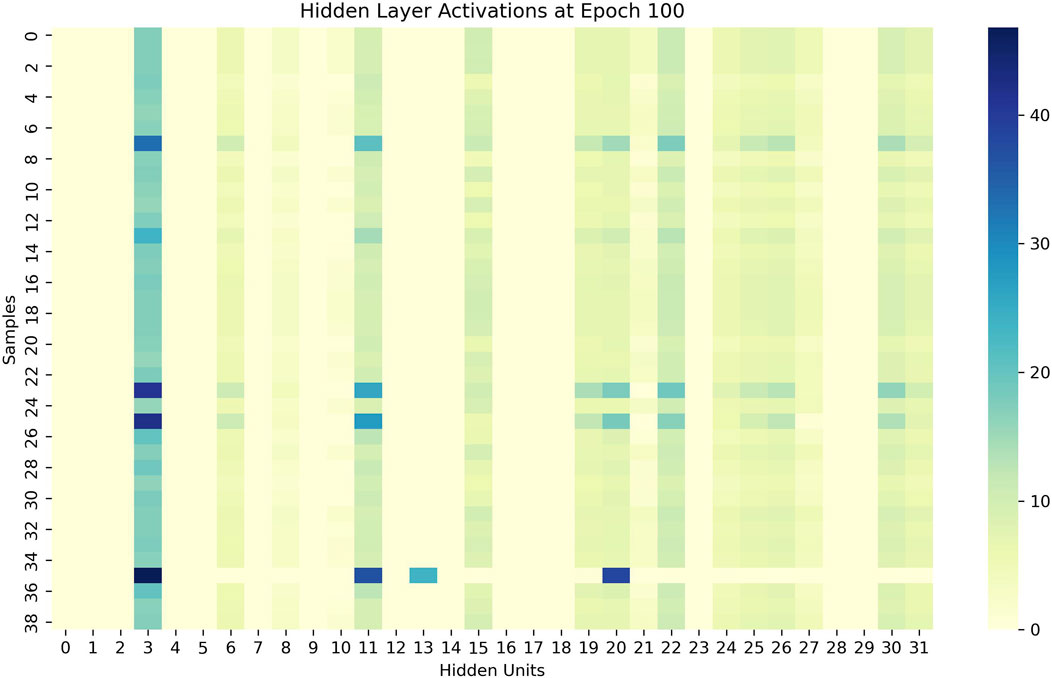
Figure 5. The encoder weight heat map of SAE.
Case study
To rigorously assess the predictive performance of the BANSMDA model, we conducted case study validation using two prevalent diseases (Asthma and Colorectal carcinoma) and two clinically significant microbial genera (Escherichia and Bacteroides).
Asthma is a common chronic inflammatory disease originating in the lower airways, characterized by persistent airway inflammation (Polyxeni et al., 2021). Clinical manifestations include recurrent episodes of wheezing, coughing, chest tightness, and shortness of breath, typically exacerbated during nocturnal or early morning periods (James, 2015). A growing body of evidence from multiple references underscores a significant correlation between the pathogenesis of asthma and specific microbiota, such as Helicobacter pylori (Zhi et al., 2021), Proteobacteria (Kian, 2017), and Bacteroidetes (Chie, 2023). Based on the predictive scores, microbes associated with asthma were ranked in descending order according to their respective scores. As illustrated in Table 3, among the top 20 predicted microbes associated with Asthma, 19 have been confirmed by existing research indexed in PubMed.
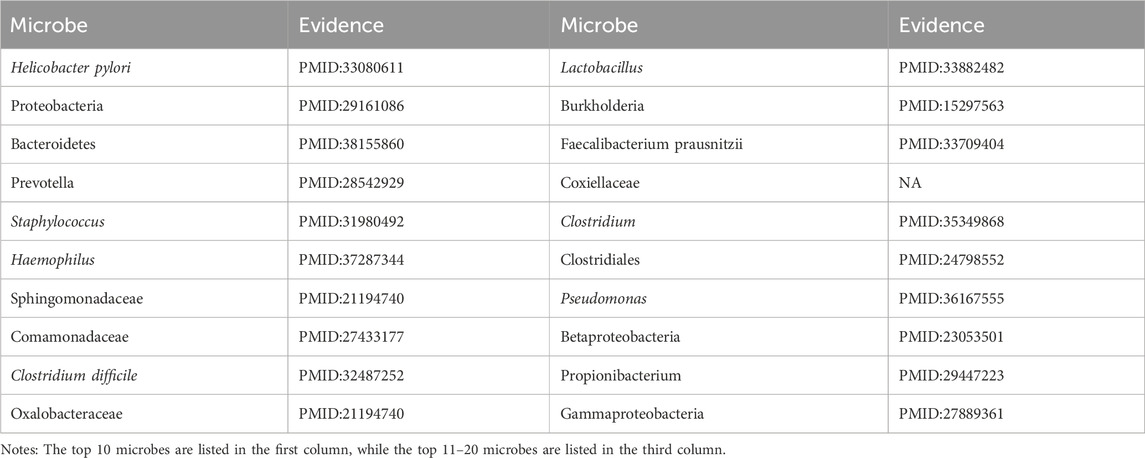
Table 3. Top 20 Asthma-associated candidate microbes on HMDAD.
Colorectal carcinoma ranks as the third most common cancer globally (Chie, 2023; Inés et al., 2017). The gut microbiota is intricately involved in its development, with ecological imbalances capable of inducing colorectal carcinoma through chronic inflammatory pathways. Key bacterial taxa implicated in this multifaceted process include Clostridium (Hui et al., 2023), Bacteroides (Yasutoshi et al., 2024), and Enterobacteriaceae (Rashmi et al., 2016). As illustrated in Table 4, all of the top 20 predicted microbes associated with Colorectal carcinoma have been confirmed by existing studies in PubMed.
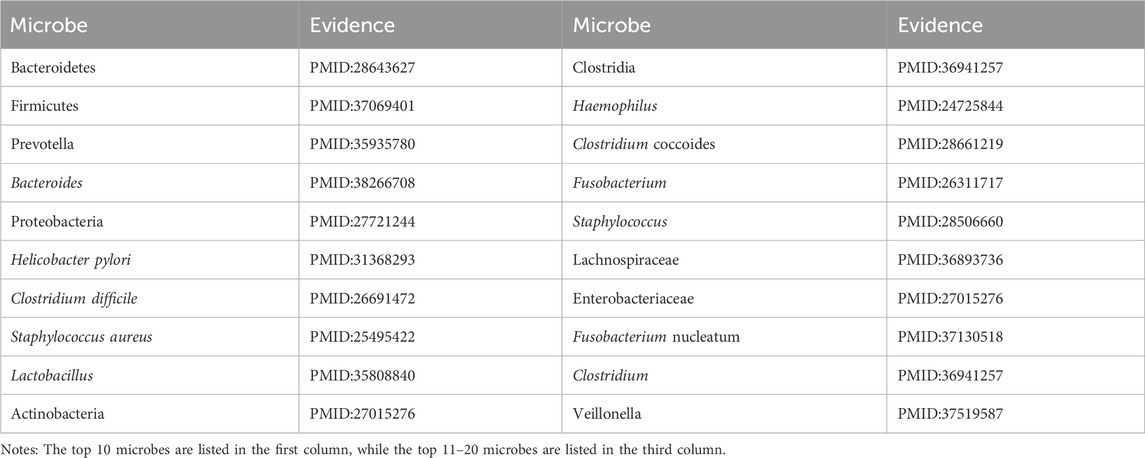
Table 4. Top 20 Colorectal carcinoma-associated candidate microbes on HMDAD.
Escherichia is a bacterium that embodies a dual identity, capable of functioning as both a symbiotic microbe and a pathogenic agent within the host’s body (Olivier et al., 2010). Recent research has demonstrated that specific strains of Escherichia are capable of causing a range of intestinal infections, including diarrhea and enteritis (James, 2005). Moreover, Escherichia can extend its pathogenicity beyond the gut to cause extraintestinal infections through mechanisms like fecal contamination or hematogenous dissemination (Kevin et al., 2019). As illustrated in Table 5, among the top 20 predicted diseases associated with Escherichia, 19 have been confirmed by existing research indexed in PubMed.
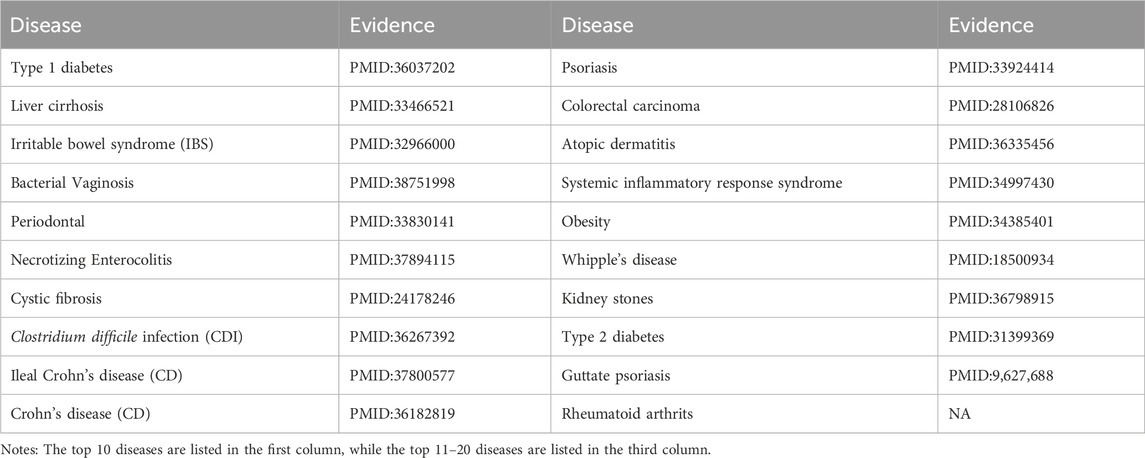
Table 5. Top 20 Escherichia-associated candidate diseases on HMDAD.
Bacteroidetes are significant clinical pathogens that, when they breach the intestinal barrier, can induce severe pathology. This includes bacteremia and the formation of abscesses in various parts of the body (Hannah, 2007). As illustrated in Table 6, among the top 20 predicted diseases associated with Bacteroidetes, 19 have been confirmed by existing research indexed in PubMed.
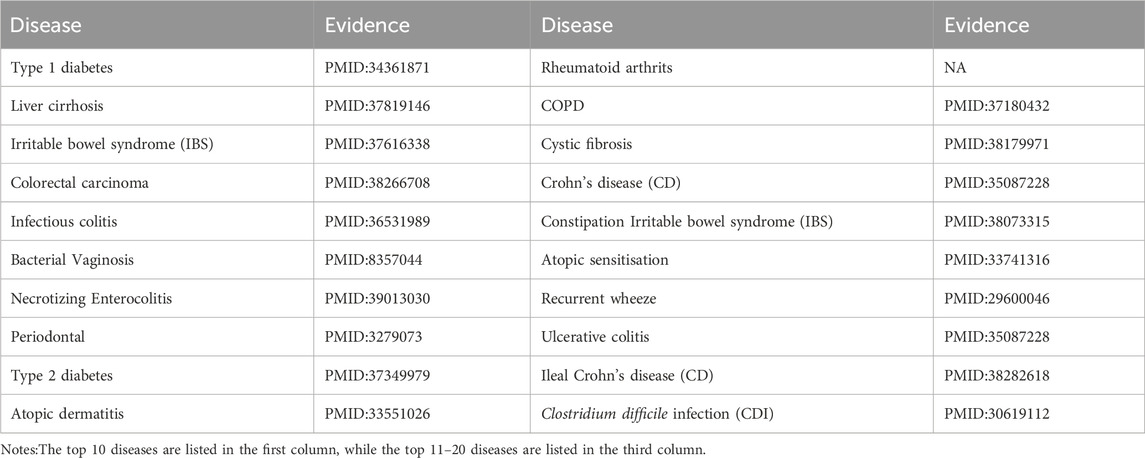
Table 6. Top 20 Bacteroidetes-associated candidate diseases on HMDAD.
In summary, these case studies provide additional evidence for the ability of the BANSMDA model to predict potential associations between microbes and diseases.
Discussion
In the present research, we developed the BANSMDA model, a predictive framework combining Bilinear Attention Networks (BAN) and Sparse Autoencoders (SAE) to identify microbe-disease associations. Our model demonstrates superior performance over existing methods in capturing intricate microbe-disease relationships. However, data scarcity and excessive parameters in the BAN component may induce overfitting, potentially compromising generalization capability in real-world scenarios. Future improvements should focus on integrating biological knowledge, refining model architecture to reduce parameter redundancy, and implementing data augmentation strategies to address data limitations. Balancing model complexity against sparse datasets remains a critical challenge for practical implementation.
The significant gap between AUC-ROC and AUPR values discrepancy reflects the extreme class imbalance in HMDAD (0.5%–2% positive samples). AUPR specifically evaluates positive class identification, while AUC-ROC measures overall class discrimination. This imbalance fundamentally constrains AUPR performance, as demonstrated in prior literature. Potential solutions include rigorous negative sample validation and AUPR-optimized training objectives to enhance positive association detection.
In this study, hyperparameter validation was implemented through a combined approach of partial grid search and typical values, constrained by computational resources in this study. Specifically, given the limited sample size, the sparsity target and penalty coefficient were set to relatively low values to prevent over-regularization. Final results were obtained by averaging across multiple runs to minimize potential errors from computational limitations. Experimental results demonstrate that this approach yields hyperparameters enabling model performance approaching the theoretical optimum.
Conclusion
In this study, we introduce a novel model called BANSMDA to predict potential associations between microorganisms and diseases. And experimental results demonstrated the superior performance of BANSMDA. It is important to highlight that data related to microbes and diseases are often characterized by sparsity. While SAE can mitigate overfitting to some extent, the substantial number of parameters introduced by BAN models may still lead to overfitting, particularly when the volume of available data is limited. This, in turn, can compromise model performance. Future research could further enhance the model’s performance by incorporating additional biological knowledge, refining the model architecture, or employing data augmentation techniques.
Data availability statement
Publicly available datasets were analyzed in this study. This data can be found here: http://www.cuilab.cn/hmdad.
Author contributions
XL: Writing – review and editing, Formal Analysis, Software, Methodology, Investigation, Data curation, Writing – original draft, Validation, Project administration, Conceptualization. ML: Writing – original draft, Writing – review and editing, Investigation, Formal Analysis, Software, Methodology, Data curation, Project administration, Validation, Conceptualization. GY: Writing – review and editing, Investigation, Supervision, Validation, Funding acquisition. ST: Writing – review and editing, Investigation, Software, Data curation, Project administration. OW: Writing – review and editing, Investigation, Resources, Conceptualization, Visualization. BZ: Formal Analysis, Project administration, Funding acquisition, Writing – review and editing. LW: Conceptualization, Resources, Funding acquisition, Writing – review and editing, Validation, Formal Analysis, Supervision, Data curation, Project administration, Methodology.
Funding
The author(s) declare that financial support was received for the research and/or publication of this article. This work was partly sponsored by the National Natural Science Foundation of China (No. 62272064), the Natural Science Foundation of Hunan Province (No. 2023JJ60185 and No. 2025JJ90184), the Scientific Research Project of Hunan Provincial Department of Education (No. 23C0543 and No. 23C0544), and the Key project of Changsha Science and technology Plan (No. KQ2203001).
Acknowledgments
The authors thank the referees for suggestions that helped improve the paper substantially.
Conflict of interest
The authors declare that the research was conducted in the absence of any commercial or financial relationships that could be construed as a potential conflict of interest.
Generative AI statement
The author(s) declare that no Generative AI was used in the creation of this manuscript.
Publisher’s note
All claims expressed in this article are solely those of the authors and do not necessarily represent those of their affiliated organizations, or those of the publisher, the editors and the reviewers. Any product that may be evaluated in this article, or claim that may be made by its manufacturer, is not guaranteed or endorsed by the publisher.
References
Chen, R., Xie, G., Lin, Z., Gu, G., Yu, Y., Yu, J., et al. (2024b). Predicting microbe-disease associations based on a linear neighborhood label propagation method with multi-order similarity fusion learning. Interdiscip. Sci. Comput. Life Sci. 16 (2), 345–360. doi:10.1007/s12539-024-00607-0
Chen, X., Huang, Y. A., You, Z. H., Yan, G. Y., and Wang, X. S. (2016). A novel approach based on KATZ measure to predict associations of human microbiota with non-infectious diseases. Bioinformatics 33 (5), 733–739. doi:10.1093/bioinformatics/btw715
Chen, Z., Zhang, L., Li, J., and Fu, M. (2024a). MLFLHMDA: predicting human microbe-disease association based on multi-view latent feature learning. Front. Microbiol. 15, 1353278. doi:10.3389/fmicb.2024.1353278
Chie, M. (2023). Sputum microbiota and inflammatory subtypes in asthma, COPD, and its overlap. J. Allergy Clin. Immunol. Glob. 3 (1), 100194. doi:10.1016/j.jacig.2023.100194
Cryan, J. F., and Dinan, T. G. (2012). Mind-altering microorganisms: the impact of the gut microbiota on brain and behaviour. Nat. Rev. Neurosci. 13 (10), 701–712. doi:10.1038/nrn3346
Desbonnet, L., Garrett, L., Clarke, G., Kiely, B., Cryan, J. F., and Dinan, T. G. (2010). Effects of the probiotic Bifidobacterium infantis in the maternal separation model of depression. Neuroscience 170 (4), 1179–1188. doi:10.1016/j.neuroscience.2010.08.005
Fan, Y., Chen, M., Zhu, Q., and Wang, W. (2020). Inferring disease-associated microbes based on multi-data integration and network consistency projection. Front. Bioeng. Biotechnol. 8, 831. Available online at: https://10.3389/fbioe.2020.00831.
Gilbert, J. A., Meyer, F., Antonopoulos, D., Balaji, P., Brown, C. T., Brown, C. T., et al. (2010). Meeting report: the terabase metagenomics workshop and the vision of an Earth microbiome project. Stand. Genomic Sci. 3 (3), 243–248. doi:10.4056/sigs.1433550
Hannah, M. W. (2007). Bacteroides: the good, the bad, and the nitty-gritty. Clin. Microbiol. Rev. 20 (4), 593–621. Available online at: https://10.1128/CMR.00008-07.
Hu, W., Yang, X., Wang, L., and Zhu, X. (2023). MADGAN:A microbe-disease association prediction model based on generative adversarial networks. Front. Microbiol. 14, 1159076. doi:10.3389/fmicb.2023.1159076
Hui, X., Luo, H., Zhang, J., Li, K., and Lee, M. H. (2023). Therapeutic potential of Clostridium butyricum anticancer effects in colorectal cancer. Gut Microbes 15 (1), 2186114. doi:10.1080/19490976.2023.2186114
Hwang, S., Kim, C. Y., Yang, S., Kim, E., Hart, T., Marcotte, E. M., et al. (2019). HumanNet v2: human gene networks for disease research. Nucleic Acids Res. 47 (D1), D573-D580–80. doi:10.1093/nar/gky1126
Inés, M., Sánchez-de-Diego, C., Pradilla Dieste, A., Cerrada, E., and Rodriguez Yoldi, M. J. (2017). Colorectal carcinoma: a general overview and future perspectives in colorectal cancer. Int. J. Mol. Sci. 18 (1), 197. doi:10.3390/ijms18010197
James, B. (2005). Pathogenic Escherichia coli. Int. J. Med. Microbiol. 295 (6-7), 355–356. Available online at: https://10.1016/j.ijmm.2005.06.008.
James, W. M. (2015). Asthma: definitions and pathophysiology. Int. Forum Allergy Rhinol. 5 (1), S2–S6. doi:10.1002/alr.21609
Janssens, Y., Nielandt, J., Bronselaer, A., Debunne, N., Verbeke, F., Wynendaele, E., et al. (2018). Disbiome database: linking the microbiome to disease. BMC Microbiol. 18 (1), 50. doi:10.1186/s12866-018-1197-5
Kamneva, O. (2017). Genome composition and phylogeny of microbes predict their co-occurrence in the environment. PLoS Comput. Biol. 13, e1005366. doi:10.1371/journal.pcbi.1005366
Kau, A. L., Ahern, P. P., Griffin, N. W., Goodman, A. L., and Gordon, J. I. (2011). Human nutrition, the gut microbiome and the immune system. Nature 474 (7351), 327–336. doi:10.1038/nature10213
Kevin, O., Omattage, N. S., Spaulding, C. N., and Hultgren, S. J. (2019). Reaching the end of the line: urinary tract infections. Microbiol. Spectr. 7 (3). doi:10.1128/microbiolspec.bai-0014-2019
Kian, F. C. (2017). Potential role of the lung microbiome in shaping asthma phenotypes. Ann. Am. Thorac. Soc. 14 (Suppl. ment_5), S326–S331. doi:10.1513/AnnalsATS.201702-138AW
Kim, N., Yun, M., Oh, Y. J., and Choi, H. J. (2018). Mind-altering with the gut: modulation of the gut-brain axis with probiotics. J. Microbiol. 56 (3), 172–182. doi:10.1007/s12275-018-8032-4
Liang, M. M., Liu, X., Li, J., Chen, Q., Zeng, B., Wang, Z., et al. (2025). BANNMDA: a computational model for predicting potential microbe-drug associations based on bilinear attention networks and nuclear norm minimization. Front. Microbiol. 15, 1497886. Available online at: https://10.3389/fmicb.2024.1497886.
Long, Y., Luo, J., Zhang, Y., and Xia, Y. (2021). Predicting human microbe-disease associations via graph attention networks with inductive matrix completion. Brief. Bioinform 22 (3), bbaa146. doi:10.1093/bib/bbaa146
Lu, S., Liang, Y., Li, L., Miao, R., Liao, S., Zou, Y., et al. (2023). Predicting potential microbe-disease associations based on auto-encoder and graph convolution network. BMC Bioinforma. 24 (1), 476. doi:10.1186/s12859-023-05611-7
Luo, J., and Long, Y. (2020). NTSHMDA: prediction of human microbe-disease association based on random walk by integrating network topological similarity. IEEE/ACM Trans Comput. Biol Bioinf 17 (4), 1341–1351. doi:10.1109/TCBB.2018.2883041
Ma, W., Zhang, L., Zeng, P., Huang, C., Li, J., Geng, B., et al. (2017). An analysis of human microbe-disease associations. Briefings Bioinforma. 18 (1), 85–97. doi:10.1093/bib/bbw005
Olivier, T., Skurnik, D., Picard, B., and Denamur, E. (2010). The population genetics of commensal Escherichia coli. Nat. Rev. Microbiol. 8 (3), 207–217. Available online at: https://10.1038/nrmicro2298.
Park, Y., Lee, J., Moon, H., Choi, Y. S., and Rho, M. (2021). Discovering microbe-disease associations from the literature using a hierarchical long short-term memory network and an ensemble parser model. Sci. Rep. 11 (1), 4490. doi:10.1038/s41598-021-83966-8
Polyxeni, N., Photiades, A., Zervas, E., Xanthou, G., and Samitas, K. (2021). Genetics and epigenetics in asthma. Int. J. Mol. Sci. 22 (5), 2412. doi:10.3390/ijms22052412
Racanelli, A. C., Ann Kikkers, S., Choi, A. M. K., and Cloonan, S. M. (2018). Autophagy and inflammation in chronic respiratory disease. Autophagy 14 (2), 221–232. doi:10.1080/15548627.2017.1389823
Rashmi, S., Ahn, J., Sampson, J. N., Shi, J., Yu, G., Xiong, X., et al. (2016). Fecal microbiota, fecal metabolome, and colorectal cancer interrelations. PLoS One 11 (3), e0152126. doi:10.1371/journal.pone.0152126
Sampson, T. R., Debelius, J. W., Thron, T., Janssen, S., Shastri, G. G., Ilhan, Z. E., et al. (2016). Gut microbiota regulate motor deficits and neuroinflammation in a model of parkinson’s disease. Cell 167 (6), 1469–1480. doi:10.1016/j.cell.2016.11.018
Shen, X., Zhu, H., Jiang, X., Hu, X., and Yang, J. (2018). “A novel approach based on Bi-Random walk to predict microbe-disease associations,” in Intelligent computing methodologies. Lecture notes in computer science. Editors D. S. Huang, M. M. Gromiha, K. Han, and A. Hussain (Springer International Publishing), 10956, 746–752. doi:10.1007/978-3-319-95957-3_78
Sun, Y. Z., Zhang, D. H., Cai, S. B., Ming, Z., Li, J. Q., and Chen, X. (2018). MDAD: a special resource for microbe-drug associations. Front. Cell. Infect. Microbiol. 8, 424. doi:10.3389/fcimb.2018.00424
Szklarczyk, D., Gable, A. L., Lyon, D., Junge, A., Wyder, S., Huerta-Cepas, J., et al. (2019). STRING v11. Protein-protein association networks with increased coverage, supporting functional discovery in genome-wide experimental datasets. Nucleic Acids Res. 47, D607-D613–613. doi:10.1093/nar/gky1131
Toya, T., Corban, M. T., Marrietta, E., Horwath, I. E., Lerman, L. O., Murray, J. A., et al. (2020). Coronary artery disease is associated with an altered gut microbiome composition. PLOS ONE 15 (1), e0227147. doi:10.1371/journal.pone.0227147
Turnbaugh, P. J., Ley, R. E., Hamady, M., Fraser-Liggett, C. M., Knight, R., and Gordon, J. I. (2007). The human microbiome project. Nature 449 (7164), 804–810. doi:10.1038/nature06244
Wang, F., Huang, Z. A., Chen, X., Zhu, Z., Wen, Z., Zhao, J., et al. (2017). LRLSHMDA: laplacian regularized least squares for human microbe–disease association prediction. Sci. Rep. 7 (1), 7601. doi:10.1038/s41598-017-08127-2
Wei, H., and Liu, B. (2020). iCircDA-MF: identification of circRNA-disease associations based on matrix factorization. Brief. Bioinform 21 (4), 1356–1367. doi:10.1093/bib/bbz057
Xu, J., and Li, Y. (2006). Discovering disease-genes by topological features in human proteinprotein interaction network. Bioinformatics 22 (22), 2800–2805. doi:10.1093/bioinformatics/btl467
Xuan, P., Gao, L., Sheng, N., Zhang, T., and Nakaguchi, T. (2020). Graph convolutional autoencoder and fully-connected autoencoder with attention mechanism based method for predicting drug–disease associations. IEEE J. Biomed. Health Inf. 25 (5), 1793–1804. doi:10.1109/JBHI.2020.3039502
Yasutoshi, T., Kawamura, H., Okadome, K., Ugai, S., Haruki, K., Arima, K., et al. (2024). Enrichment of Bacteroides fragilis and enterotoxigenic Bacteroides fragilis in CpG island methylator phenotype-high colorectal carcinoma. Clin. Microbiol. Infect. 30 (5), 630–636. doi:10.1016/j.cmi.2024.01.013
Keywords: computational model, microbe-disease associations, bilinear attention networks, sparse autoencoder, prediction
Citation: Liu X, Liang M, Yu G, Tang S, Wu O, Zeng B and Wang L (2025) BANSMDA: a computational model for predicting potential microbe-disease associations based on bilinear attention networks and sparse autoencoders. Front. Genet. 16:1618472. doi: 10.3389/fgene.2025.1618472
Received: 26 April 2025; Accepted: 07 July 2025;
Published: 08 August 2025.
Edited by:
Lei Chen, Shanghai Maritime University, ChinaReviewed by:
Xin Jin, Biotechnology HPC Software Applications Institute (BHSAI), United StatesShengbo Wu, Tianjin University, China
Copyright © 2025 Liu, Liang, Yu, Tang, Wu, Zeng and Wang. This is an open-access article distributed under the terms of the Creative Commons Attribution License (CC BY). The use, distribution or reproduction in other forums is permitted, provided the original author(s) and the copyright owner(s) are credited and that the original publication in this journal is cited, in accordance with accepted academic practice. No use, distribution or reproduction is permitted which does not comply with these terms.
*Correspondence: Xianzhi Liu, bHh6MTk5MjAxMjVAMTYzLmNvbQ==; Mingmin Liang, MTE3NTg1ODYyOUBxcS5jb20=; Ouxiang Wu, MzQ3NTE3NDUwQHFxLmNvbQ==