 Liang Gao
 Hua Qian
- Department of Gynecology, The Affiliated Taizhou People’s Hospital of Nanjing Medical University, Taizhou School of Clinical Medicine, Nanjing Medical University, Taizhou, China
Introduction: This study aims to identify differentially expressed genes (DEGs) in endometrial carcinoma (EC) through bioinformatics analysis and investigate their roles in early diagnosis and prognosis.
Methods: EC-related gene datasets were retrieved from the NCBI and analyzed using R packages to screen for DEGs. Primers were designed for selected DEGs, and their expression levels were validated via qPCR. Logistic regression, survival analysis, Cox proportional hazards models, and random forest models were employed to evaluate associations between DEGs and clinical outcomes.
Results: Bioinformatics analysis identified significantly upregulated genes (Erb-B2, PIK3CA, CCND1, VEGF, KIT) and downregulated genes (PTEN, E-cadherin, p53). Logistic regression revealed Erb-B2 as a protective factor against poor prognosis, whereas E-cadherin and P53 were risk genes. Clinical markers CA125, CA199, and IL-9 also emerged as prognostic risk factors. Survival analysis demonstrated significant divergence between good and poor prognosis groups (P < 0.05), with HR < 1 for Erb-B2 and p53 (protective effects) and HR > 1 for E-cadherin, CA125, CA199, and IL-9 (risk effects). The random forest model highlighted CA199 as a pivotal prognostic biomarker, while decision tree analysis enabled effective patient stratification based on CA125 and CA199 thresholds.
Conclusion: The identified DEGs and clinical indicators hold significant potential for improving early diagnosis and prognostic evaluation in EC. These findings provide novel biomarkers and theoretical foundations for precision medicine, guiding risk stratification and personalized therapeutic strategies.
1 Introduction
Endometrial carcinoma (EC), one of the three most prevalent malignancies in the female reproductive system, has demonstrated a rising global incidence, posing a significant threat to women’s health and quality of life (Cai et al., 2021). Early diagnosis and accurate prognostic evaluation are critical for improving survival outcomes in EC patients, as they enable clinicians to tailor individualized therapeutic strategies while avoiding overtreatment or undertreatment. However, current diagnostic modalities for early-stage EC are limited by invasiveness, low patient acceptance, and the frequent absence of overt symptoms in early phases, leading to underdiagnosis. Although existing prognostic markers hold clinical utility, their predictive capacity for individual outcomes remains insufficient to meet the demands of precision medicine (Zheng et al., 2025). The rapid advancement of genomic technologies has unlocked substantial potential for bioinformatics in cancer research (Zeng et al., 2021). By systematically mining and analyzing large-scale gene expression datasets, bioinformatics approaches can identify differentially expressed genes (DEGs) associated with tumorigenesis, progression, and prognosis. These DEGs may serve as potential biomarkers, offering novel avenues for early detection and prognostic stratification in EC (Yang et al., 2025). This study aims to leverage bioinformatics tools to screen DEGs with significant expression alterations in EC and investigate their roles in early diagnosis and prognostic evaluation. The findings are expected to provide scientific evidence and theoretical support for advancing precision diagnostics and therapeutics in EC.
2 Materials and methods
2.1 General characteristics
A total of 202 patients diagnosed with EC between January 2017 and January 2020 were retrospectively enrolled and stratified into a good prognosis group (n = 129) and a poor prognosis group (n = 73) based on clinical outcomes. No significant differences in baseline demographic or clinical characteristics were observed between the groups (P > 0.05; Table 1). However, there was a difference in the distribution of each type between the good prognosis group and the poor prognosis group (P = 0.013; Table 1), and the CNH type accounted for a higher proportion in the poor prognosis group (57.53% vs. 35.66%) This study was approved by the Ethics Committee of The Affiliated Taizhou People’s Hospital of Nanjing Medical University, and written informed consent was obtained from all participants or their families.
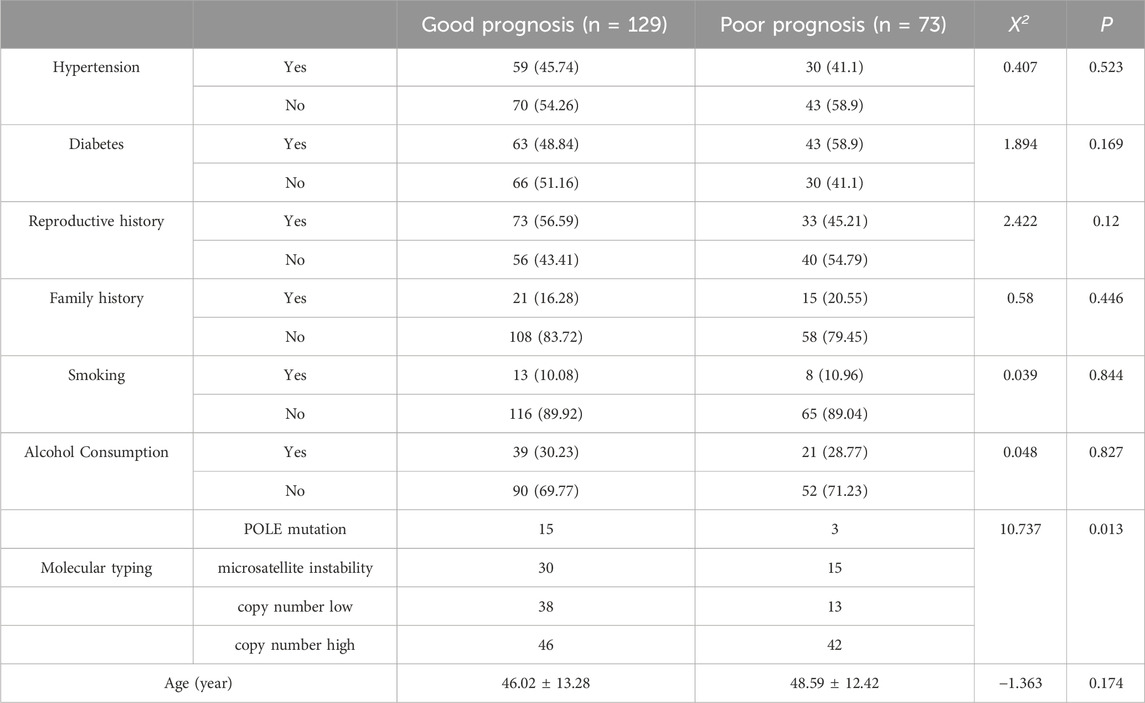
Table 1. General information.
Inclusion criteria comprised: (1) diagnosis of EC confirmed by postoperative pathological examination in accordance with the guidelines from the Diagnosis and Management of Endometrial Cancer (Braun et al., 2016); (2) availability of comprehensive clinical records; (3) stringent quality control (QC) of analytical data; (4) complete gene expression profiles covering all targets of interest without significant missing values or outliers; and (5) signed informed consent forms. Exclusion criteria included: (1) concurrent malignancies; (2) prior neoadjuvant therapies (e.g., chemotherapy, radiotherapy) that might alter tumor gene expression profiles; (3) suboptimal sample quality; and (4) incomplete follow-up data.
2.2 Bioinformatics analysis
The Gene Expression Omnibus (GEO) dataset GSE120490, comprising EC patient samples, was downloaded from the National Center for Biotechnology Information (NCBI) using the GEOquery package in R. Raw data were preprocessed and normalized, followed by gene identifier (ID) matching and differential expression analysis using the stringr, limma, and tidyverse packages. Gene Ontology (GO) enrichment analysis was performed with the clusterProfiler, org. Hs.e.g.,.db and enrichplot packages. Unsupervised dimensionality reduction using PCA was performed to verify the intrinsic expression differences between tumor tissue and normal tissue, while excluding technical batch effects. To further quantify the association between gene expression and sample grouping, a supervised dimensionality reduction model was constructed using partial least squares discriminant analysis (PLS-DA) (Mallardo et al., 2024). Using ‘tumor vs. normal’ or ‘good prognosis vs. poor prognosis’ as the dependent variable and DEGs expression level as the independent variable; Calculate R2 Y (model interpretability) and Q2 (predictive ability) through 10 fold cross validation to verify the reliability of the model. To refine biomarker candidates, feature selection was conducted via Least Absolute Shrinkage and Selection Operator (LASSO) regression, minimizing overfitting while identifying genes with the strongest prognostic relevance.
2.3 Indicator detection and follow-up
Lavage fluid in the uterine cavity was collected from patients and labeled for subsequent processing. Total cellular RNA was extracted using an RNA extraction kit (Tiangen Biotech Co., Ltd., China) and reverse-transcribed into complementary DNA (cDNA) with a reverse transcription (RT) kit. Primers were designed for target genes identified through prior screening, and quantitative polymerase chain reaction (qPCR) was performed using the synthesized cDNA as the template. Glyceraldehyde-3-phosphate dehydrogenase (GAPDH) served as the endogenous reference gene, while peripheral blood mononuclear cells (PBMCs) from healthy individuals undergoing routine physical examinations in our hospital were used as controls. Relative gene expression levels ≥ 2-fold compared to controls were defined as significant upregulation. Primer sequences are listed in Table 2. Genes exhibiting significant upregulation or downregulation (≥2-fold change) relative to healthy controls were assigned a binary value of 1, while others were coded as 0. Postoperative follow-up was conducted for 5 years, with patients experiencing recurrence or mortality classified into the poor prognosis group, and the remaining cases categorized into the good prognosis group.
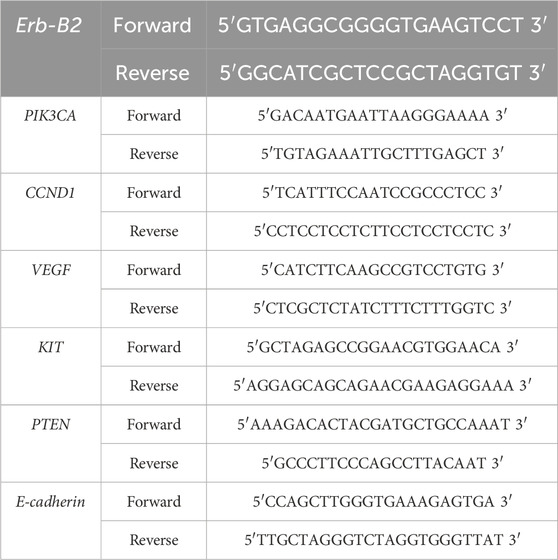
Table 2. Primer sequences.
Peripheral venous blood samples (6 mL) were routinely collected from fasting patients preoperatively and centrifuged to isolate serum for subsequent analysis. Complete blood count parameters, including hemoglobin (Hb), white blood cell count (WBC), red blood cell count (RBC), and platelet count (PLT), were measured using an automated hematology analyzer. Serum levels of carbohydrate antigen 125 (CA125), carbohydrate antigen 199 (CA199), and interleukin-9 (IL-9) were quantified via chemiluminescence immunoassay (CLIA) following standardized protocols.
2.4 Statistical methods
Data processing and analyses were performed using SPSS Statistics 27.0 and R software version 4.4.3. Normally distributed continuous variables were expressed as mean ± standard deviation (
3 Results
3.1 DEG screening
As shown in Figure 1, box plots (Figure 1A) and principal component analysis (PCA) plots of the GEO dataset GSE120490 (n = 145 samples) revealed no significant batch effects or inter-sample variability (P > 0.05). PCA analysis showed that the GSE120490 samples were clustered into two main clusters (Figure 1B), and the dataset included tumor tissue and normal tissue data. Further analysis confirmed that this grouping was driven by sample type (PCA1 contribution rate of 32.7%), rather than technical batch effects. Meanwhile, after correcting for batch effects using the SVA package in R language, the grouping trend remained significant, indicating biological differences. This is consistent with the inherent differences in gene expression profiles between tumor tissue and normal tissue. The PLS-DA (Figure 1C) score plot shows complete separation of tumor and normal tissue samples on the first principal component (explanatory power 41.2%) (R2 Y = 0.89, Q2 = 0.82), indicating a strong explanatory power of gene expression for sample types. Volcano plot (Figure 2A) was used to screen DEGs based on the statistical difference of gene expression level only, which was used to distinguish the abnormal expression genes in tumor tissues from normal tissues, and did not involve the association analysis with clinical prognosis outcome; The core genes related to prognosis were gradually screened through lasso regression (Section 2.2) and multiple regression (Section 2.5). Differential expression analysis (adjusted P < 0.05) identified 178 significantly upregulated genes, 200 downregulated genes, and 23,142 non-DEGs (Figure 2B). GO enrichment analysis demonstrated distinct functional annotations across biological processes (BP), molecular functions (MF), and cellular components (CC) (Figure 3).

Figure 1. Data distribution (A) Box plot of gene expression distribution; (B) PCA plot of sample clustering (Group represents sample grouping in GSE120490: Yes = endometrial cancer tissue sample, No = normal endometrial tissue sample).
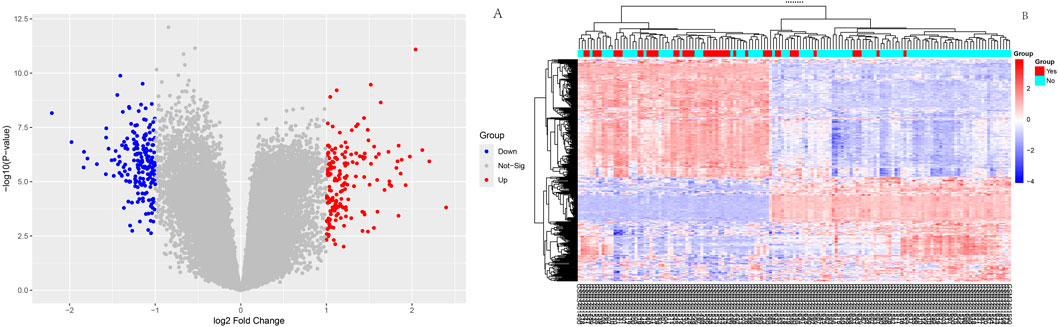
Figure 2. Differential expression analysis Volcano diagram: Red dots represent significantly upregulated genes, blue dots represent significantly downregulated genes, and gray dots represent non DEGs; This figure only reflects the differential expression of genes between tumors and normal tissues, and is not directly related to clinical prognosis outcomes; (B):Heatmap of differentially expressed genes.
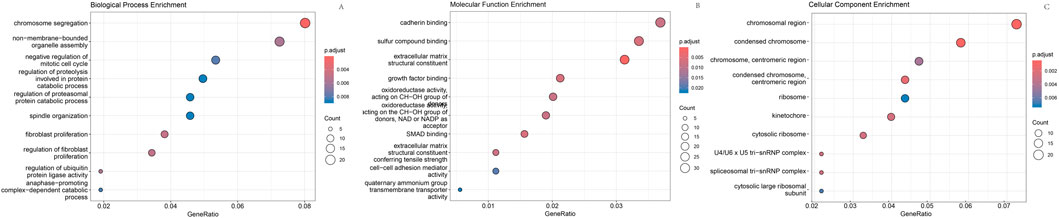
Figure 3. GO enrichment analysis. (A) Enriched biological processes; (B) Enriched molecular functions; (C) Enriched cellular components.
3.2 LASSO regression for feature gene screening
The 378 significant DEGs were subjected to LASSO regression to identify key predictive features. During variable selection, the penalty coefficient (λ) was systematically compressed across all 378 initial predictors. Optimal λ (λ = 0.013) was determined via cross-validation, minimizing the mean squared error while balancing model parsimony and goodness-of-fit. This process yielded a refined predictive model incorporating eight genes: Erb-B2, CCND1, PIK3CA, VEGF, KIT, PTEN, E-cadherin, and p53 (Figure 4).
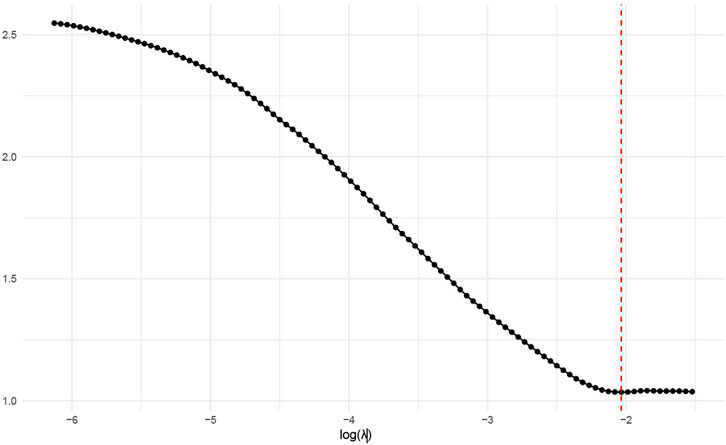
Figure 4. Relationship between log(λ) values and model error.
3.3 Comparison of gene expression and clinical indicators between groups
Based on qPCR results, gene expression changes were assessed by comparing each group’s data with healthy controls. Independent samples t-tests revealed significant differences in the expression of Erb-B2, PIK3CA, VEGF, KIT, PTEN, E-cadherin, and p53 (P < 0.05), whereas CCND1 showed no significant variation (P > 0.05). Similarly, tumor markers CA125 and CA199, RBC, and the inflammatory cytokine IL-9 exhibited statistically significant intergroup differences (Table 3).
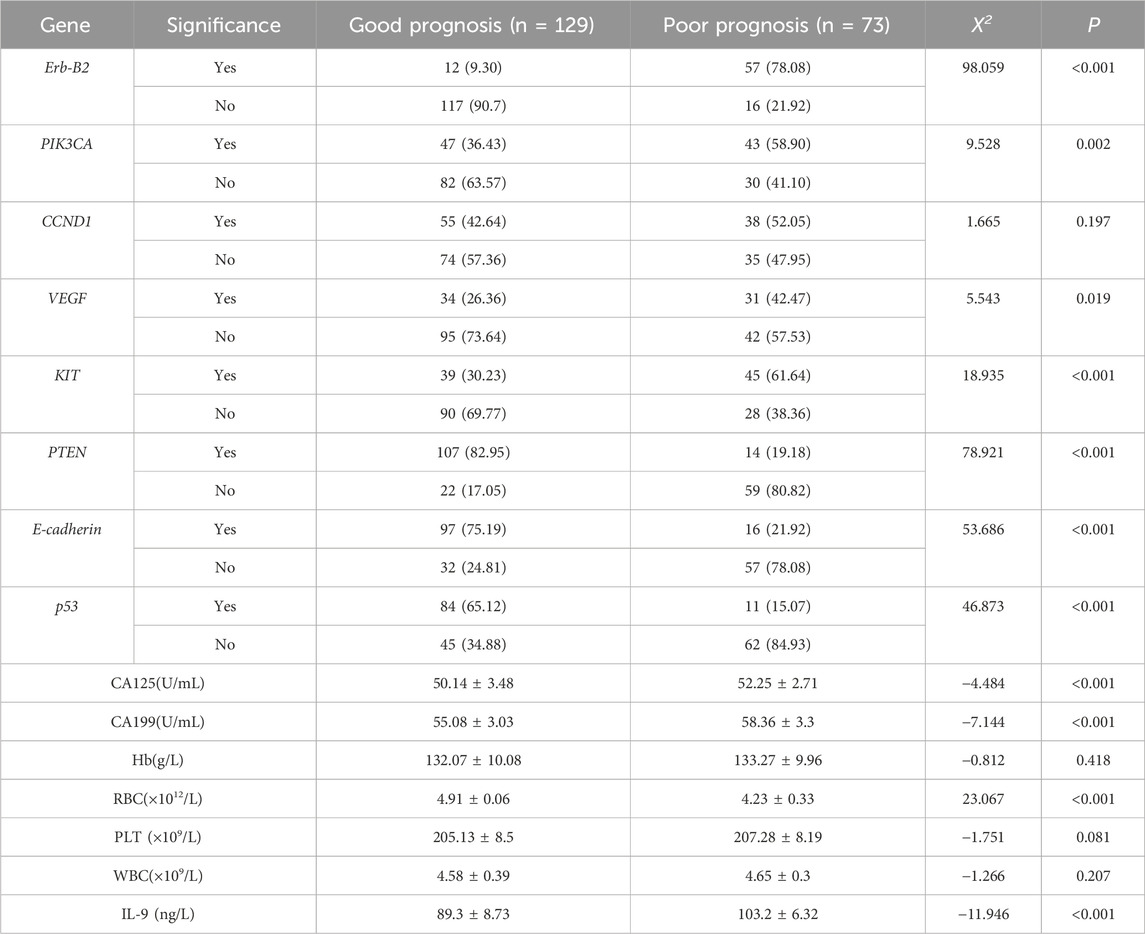
Table 3. Differential gene expression and clinical indicator analysis.
3.4 Subgroup analysis results
To explore the associations between molecular subtypes, clinical indicators, gene expression, and prognosis, subgroup analyses were performed based on four molecular subtypes of endometrial carcinoma (EC): POLE mutation (POLE), microsatellite instability (MSI), copy number low (CNL), and copy number high (CNH).No statistically significant differences were observed in clinical indicators [TIME, CA125, CA199, hemoglobin (Hb), red blood cell count (RBC), platelet count (PLT), white blood cell count (WBC), and interleukin-9 (IL-9)] among the four molecular subtypes (all P > 0.05; Table 4). Differential expression patterns of key genes (identified via LASSO regression) were observed across molecular subtypes, with two genes showing statistically significant associations. The proportion of ERBB2-positive cases varied significantly among subtypes (P = 0.0151),the CNL subtype had the lowest ERBB2 positivity (19%), while the POLE subtype showed the highest (50%); VEGF positivity also differed significantly across subtypes (P = 0.0103). The CNL subtype had the lowest VEGF positivity (17.5%), whereas the MSI subtype showed the highest (46.2%). For other genes (PIK3CA, CCND1, KIT, PTEN, E-cadherin, p53), no statistically significant differences in expression distribution were observed across subtypes (all P > 0.05), though trends were noted (e.g., CCND1 positivity was highest in MSI (56.4%) and lowest in POLE (30%); Table 4). Prognostic outcomes (good vs. poor) showed a trend across subtypes, though not statistically significant (P = 0.2721). The CNL subtype had the highest proportion of good prognosis cases (73%), while the CNH subtype had the lowest (57.8%). This is consistent with prior observations that CNH is overrepresented in the poor prognosis group (57.53% vs. 35.66% in good prognosis group).
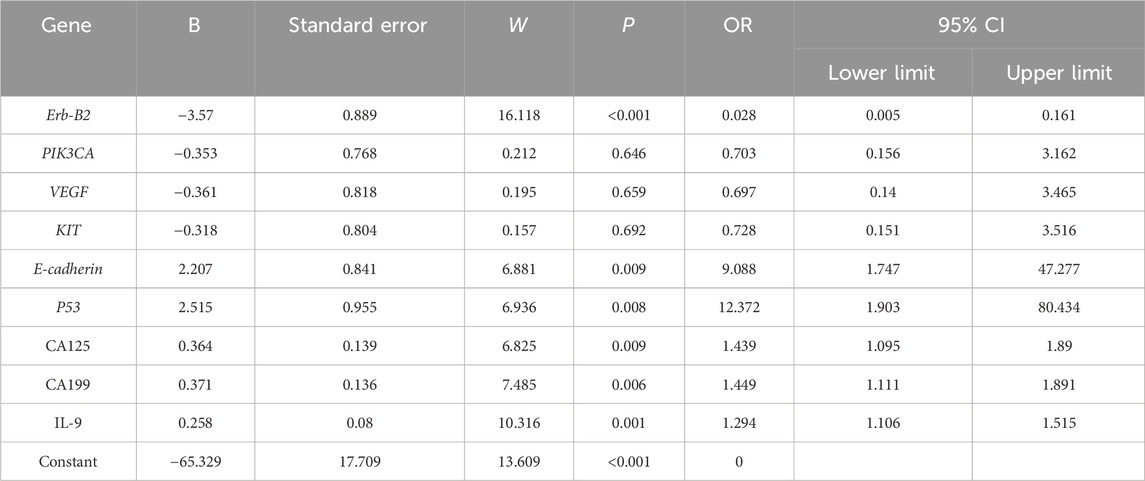
Table 4. Results of multivariate binary logistic regression analysis.
3.5 Multivariate binary logistic regression analysis
Factors demonstrating significant differences underwent collinearity diagnostics, revealing a variance inflation factor (VIF) > 5 for the gene PTEN and the clinical indicator RBC, indicating substantial multicollinearity. These variables were subsequently excluded from further analysis. Multivariate binary logistic regression analysis of the remaining factors identified Erb-B2 as a protective factor against poor prognosis in EC patients, while E-cadherin3 and p53 emerged as risk factors for adverse outcomes. Clinical markers CA125, CA199, and IL-9 were also significantly associated with increased risk of poor prognosis (Table 5).
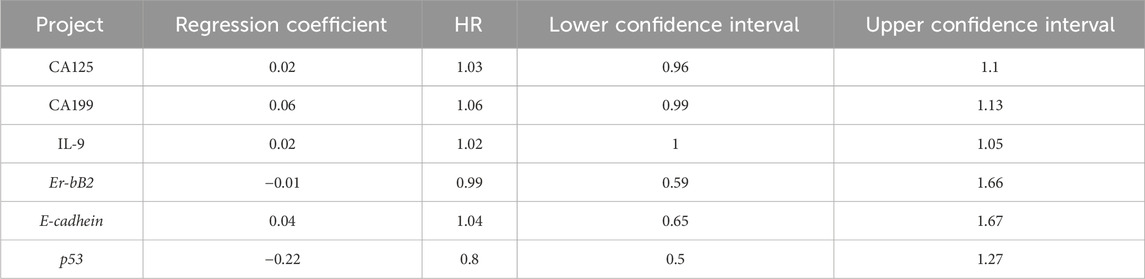
Table 5. Cox proportional hazards regression results.
3.6 Survival analysis results
To verify the clinical effectiveness of prognostic grouping, K-M survival analysis was conducted. The results showed that the 5-year survival rate of the good prognostic group (62.0%–100%) was significantly higher than that of the poor prognostic group (45.2%–100%). The Log rank test confirmed that there was a statistically significant difference in survival curves between the two groups, which proves that the initial prognostic grouping has clinical significance. (P < 0.05; Figure 5). Cox proportional hazards regression analysis incorporating factors identified by logistic regression revealed hazard ratios (HR) < 1 for Erb-B2 and p53, indicating protective effects, while E-cadherin exhibited an HR > 1, signifying increased risk. Clinical markers CA125, CA199, and IL-9 also showed HR > 1, correlating with elevated risk of adverse outcomes (Table 6; Figure 6).
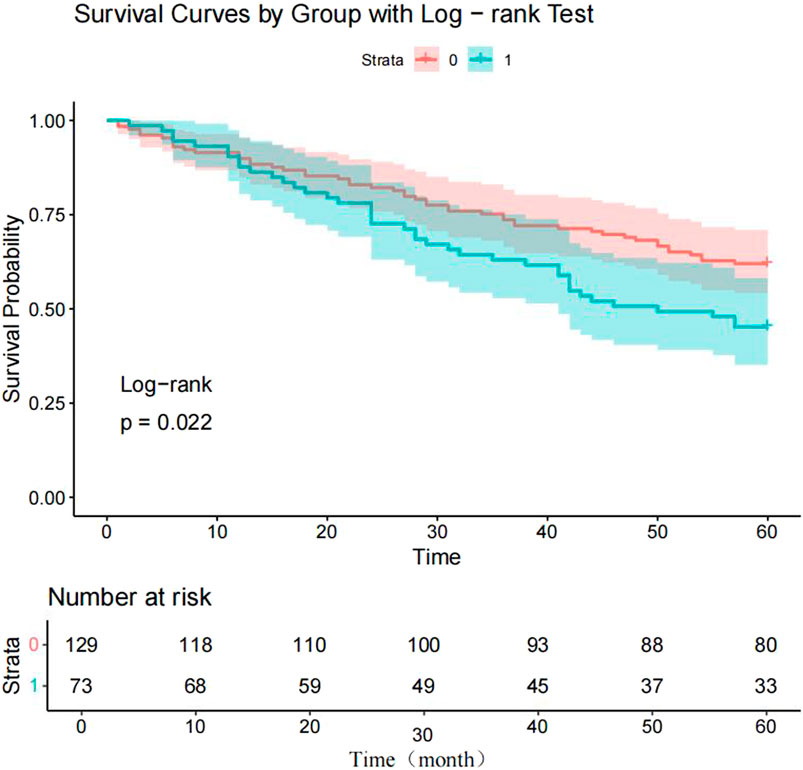
Figure 5. Kaplan-Meier survival curves for endometrial carcinoma (EC) patients. Note: 0 = good prognosis group; 1 = poor prognosis group.
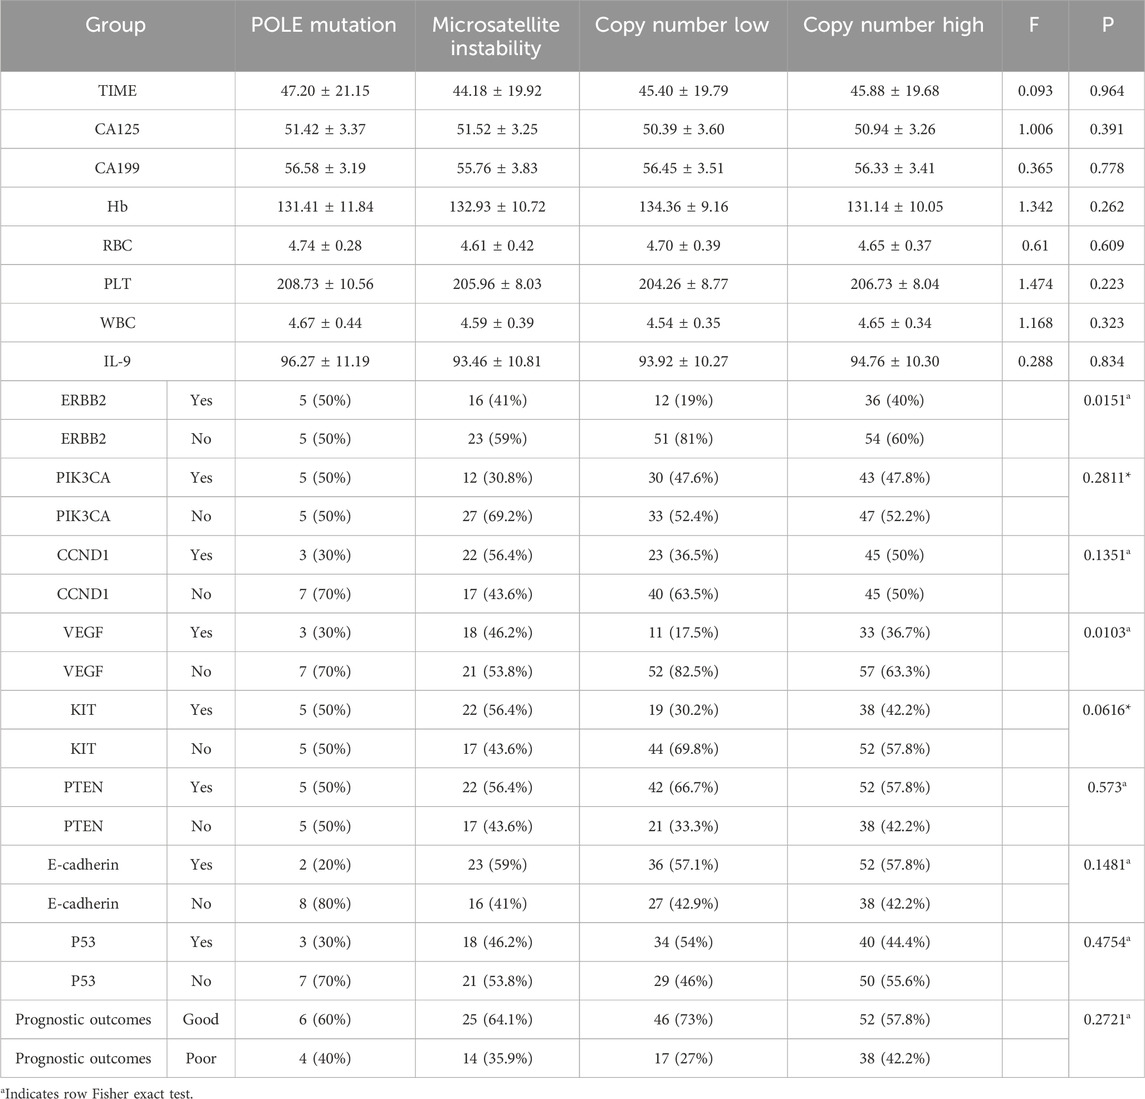
Table 6. Subgroup analysis results.
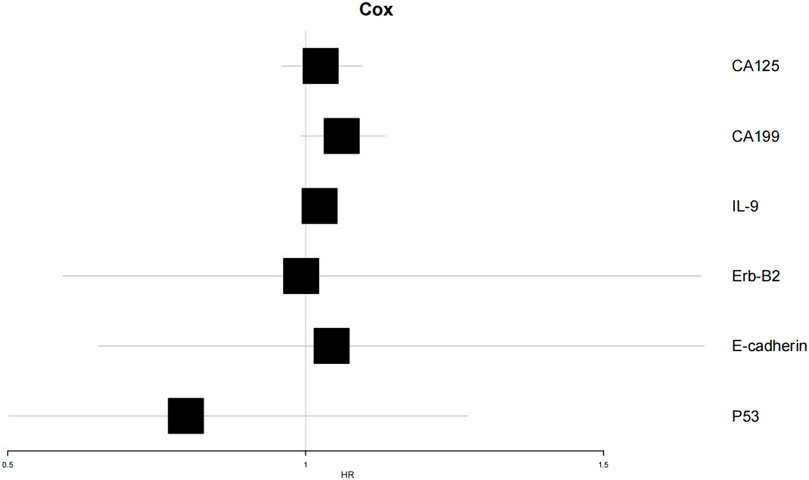
Figure 6. Forest plot of Cox proportional hazards regression analysis.
3.7 Construction of random forest model
A random forest model was constructed using the screened clinical indicators and genetic markers. Feature importance analysis revealed that CA199 exhibited relatively prominent positive importance in the model, suggesting its potential role as a key variable in correlation analyses or predictive modeling. Random forest feature importance ranking: CA199 (0.035)>IL-9 (0.028)>CA125 (0.022)>Erb-B2 (0.018); The decision tree is based on clinically detectable indicators to construct a hierarchical rule (Figure 7C) when CA199 > 56.8 U/mL (the clinical routine detection threshold is about 37 U/mL), the risk of poor prognosis is 2.3 times higher than below the threshold (68.7% vs. 29.4%); If both CA199 > 56.8 U/mL and CA125 > 51.2 U/mL are met, the risk of poor prognosis further increases to 72.3% (much higher than the overall poor prognosis rate of 36.1%) In contrast, E-cadherin, p53, and Erb-B2 displayed balanced but lower importance scores, indicating weaker contributions to outcome prediction. Directional importance analysis demonstrated variability in the magnitude and direction of variable impacts across events. CA199 showed higher positive importance for Event two (poor prognosis, represented by longer blue bars), whereas IL-9 exerted notable negative importance for Event 1 (favorable prognosis, indicated by longer red bars).
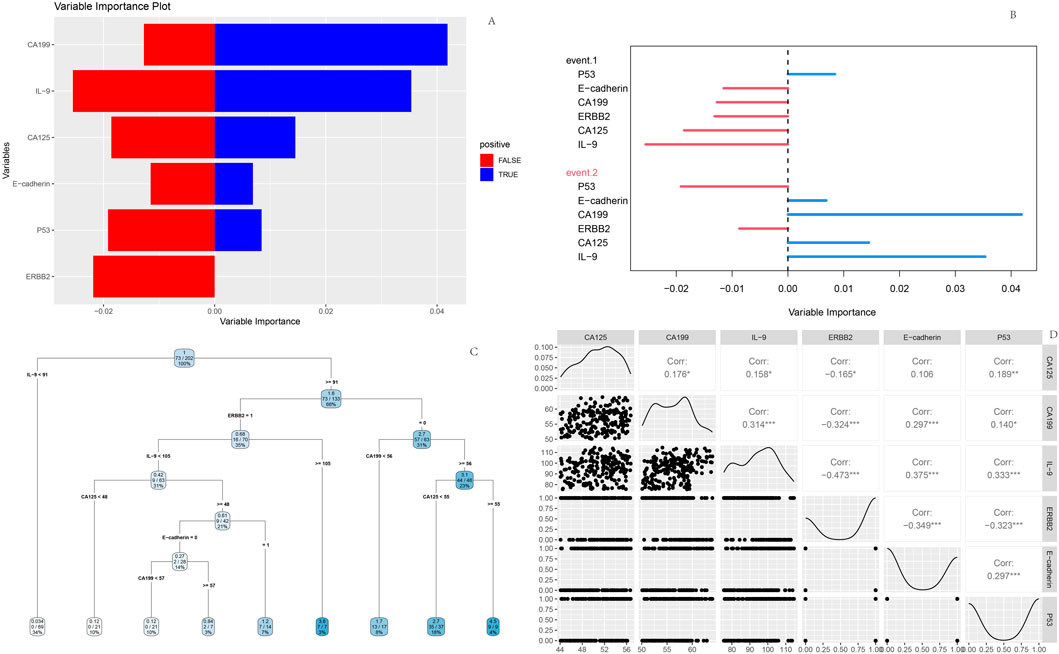
Figure 7. Random Forest model outputs (A) Feature importance plot; (B) Variable importance plot; (C) Decision tree; (D) Variable interaction matrix.
The decision tree diagram illustrated branching rules based on thresholds of CA125 and CA199 levels. Starting from the root node, data partitioning proceeded through sequential splits determined by these biomarkers, ultimately forming terminal leaf nodes for outcome classification. Interaction matrix analysis highlighted strong negative correlation (r = −0.473) between Erb-B2 and IL-9, reflecting their interconnected roles in prognostic stratification (Figure 7).
4 Discussion
EC, one of the most common malignancies in the female reproductive system, poses a significant threat to patient health. Beyond causing debilitating symptoms such as abnormal vaginal bleeding, discharge, and pain that severely impair quality of life, EC progression often involves local invasion and distant metastasis, markedly increasing complications and mortality risks (Gao et al., 2025). Current surgical interventions for EC, including comprehensive staging surgery, extrafascial hysterectomy, and laparoscopic procedures, yield variable prognoses influenced by tumor stage, histopathological subtype, and therapeutic approach (Cao et al., 2025). Given this severe disease burden and complex clinical management and prognostic landscape, our study employed bioinformatics to identify DEGs in EC and further constructed Cox proportional hazards and random forest models, providing clinicians with comprehensive and precise tools to better understand patient conditions and improve prediction of poor prognosis.
Through bioinformatics analysis, this study first screened significant DEGs, then selected feature genes via LASSO regression, and investigated their associations with the prognosis of EC patients. The results suggest a potential unique regulatory mechanism for Erb-B2 in EC, hypothesizing that Erb-B2 may delay disease progression and improve prognosis by activating certain tumor-suppressive signaling pathways or inhibiting the expression of proteins involved in tumor cell invasion and metastasis (Ye et al., 1996). Subsequent research could validate its specific mechanisms through cellular function experiments and explore whether enhancing Erb-B2 expression or activity could lead to the development of novel therapeutic strategies. In contrast, E-cadherin3 and p53, identified as risk genes, exhibited abnormal expression that negatively impacted EC prognosis. As a member of the cell adhesion molecule family, downregulated E-cadherin3 may disrupt intercellular junctions, enabling tumor cells to breach the basement membrane and undergo invasion and metastasis (Adzraku et al., 2023). Additionally, p53 showed an odds ratio (OR) of 12.372, indicating a strong association with EC prognosis, consistent with Bourdon’s findings (Bourdon, 2007). p53 is a critical tumor-suppressor gene in humans. Under normal physiological conditions, p53 protein responds to intracellular stress signals such as DNA damage (Wang et al., 2023), regulating the expression of downstream target genes to induce cell cycle arrest, DNA repair, or apoptosis, thereby maintaining genomic stability (Liu et al., 2024). However, during tumorigenesis, p53 frequently undergoes mutation (Kennedy and Lowe, 2022), and mutant p53 not only loses its original tumor-suppressive functions but may also acquire new pro-cancer functions (Chen et al., 2022). In EC, the high OR value of p53 suggests widespread mutation, with mutant p53 potentially worsening prognosis through multiple pathways. Clinically, CA125, CA199, and IL-9, identified as risk factors for poor prognosis, align with previous research on tumor markers and inflammatory cytokines in tumor progression (Zhao et al., 2021). The molecular subtyping analysis of our EC cohort, based on TCGA classification (POLE mutation, MSI, CNL, and CNH), revealed critical associations between subtype-specific characteristics, key gene expression, and clinical outcomes, enriching our understanding of EC heterogeneity. Notably, the CNL subtype exhibited the highest proportion of favorable prognosis (73%), consistent with prior observations that CNL is associated with better clinical outcomes due to its lower genomic instability and reduced aggressive features (Onoprienko et al., 2024). These indicators not only reflect tumor burden but may also participate in regulating the tumor microenvironment (Kartikasari et al., 2021). Therefore, dynamic monitoring of their levels can help clinicians timely assess treatment efficacy and adjust interventions.
Survival and random forest models constructed using the selected genes and clinical indicators demonstrated promising clinical utility. Survival curves showed significant differences in survival outcomes between EC patients with good and poor prognoses, providing an intuitive basis for initial clinical prognostic assessment. If there is a lack of K-M analysis to validate the effectiveness of grouping, the subsequent association analysis of the model for ‘prognostic grouping’ will lose its clinical basis. Therefore, K-M analysis is a key validation step that connects clinical grouping with statistical models. Clinically, CA19-9 could serve as a core indicator for prognostic evaluation in EC patients. Regular monitoring of its levels, combined with CA125 and IL-9, would enable dynamic assessment of disease progression and treatment response. Patients with abnormally elevated marker levels require close vigilance for poor prognosis risks and prompt treatment adjustments. Meanwhile, genetic testing for Erb-B2, p53, and E-cadherin in newly diagnosed EC patients can clarify their genetic status. For those with Erb-B2 overexpression or p53 mutation, combined targeted therapies (e.g., anti-Erb-B2 monoclonal antibodies) could be considered; for patients with E-cadherin expression loss, strategies to restore its function, such as immunomodulatory therapy, warrant exploration.
From a clinical practice perspective, the results of the random forest model have clear translational value: (1) CA199, CA125, and IL-9 are all routine serum testing indicators in clinical practice, which can be carried out in primary hospitals For preoperative patients, these three indicators can be used to quickly screen high-risk populations, and more intensive postoperative follow-up is recommended as a priority. (2) For patients with high levels of CA199 and CA125, preoperative neoadjuvant therapy (such as chemotherapy combined with anti angiogenic drugs) can be considered to reduce tumor burden and postoperative recurrence; (3) Although the importance of Erb-B2 is relatively low, its inclusion in the model as a target for approved targeted drugs (such as trastuzumab) provides a basis for precise stratification and targeted therapy. For example, for patients with Erb-B2 positive and CA199 normal, postoperative combined anti-Erb-B2 treatment can further reduce the risk of recurrence and avoid overtreatment (Wang et al., 2022).
5 Conclusion
In conclusion, this study successfully identified key DEGs through bioinformatics analysis and constructed a Cox proportional hazards model and a random forest model, providing important genetic targets and theoretical evidence for the early diagnosis and prognostic assessment of EC. These findings empower clinicians to predict prognosis more accurately and develop personalized treatment plans. However, this single-center study may produce selection bias, necessitating further validation through in vitro and in vivo experiments targeting these key genes (Erb-B2, p53 and E-cadherin) to explore innovative therapeutic strategies and improve treatment outcomes and quality of life for EC patients.
Data availability statement
The original contributions presented in the study are included in the article/supplementary material, further inquiries can be directed to the corresponding author.
Ethics statement
The studies involving humans were approved by The Affiliated Taizhou People’s Hospital of Nanjing Medical University. The studies were conducted in accordance with the local legislation and institutional requirements. The participants provided their written informed consent to participate in this study.
Author contributions
LG: Investigation, Conceptualization, Writing – original draft. DY: Supervision, Writing – review and editing, Data curation. AH: Writing – review annnd editing, Software, Investigation. HQ: Writing – original draft, Resources, Formal Analysis.
Funding
The author(s) declare that no financial support was received for the research and/or publication of this article.
Conflict of interest
The authors declare that the research was conducted in the absence of any commercial or financial relationships that could be construed as a potential conflict of interest.
Generative AI statement
The author(s) declare that no Generative AI was used in the creation of this manuscript.
Any alternative text (alt text) provided alongside figures in this article has been generated by Frontiers with the support of artificial intelligence and reasonable efforts have been made to ensure accuracy, including review by the authors wherever possible. If you identify any issues, please contact us.
Publisher’s note
All claims expressed in this article are solely those of the authors and do not necessarily represent those of their affiliated organizations, or those of the publisher, the editors and the reviewers. Any product that may be evaluated in this article, or claim that may be made by its manufacturer, is not guaranteed or endorsed by the publisher.
References
Adzraku, S. Y., Wang, G., Cao, C., Bao, Y., Wang, Y., Smith, A. O., et al. (2023). Robo4 inhibits gamma radiation-induced permeability of a murine microvascular endothelial cell by regulating the junctions. Cell Mol. Biol. Lett. 28, 2. doi:10.1186/s11658-022-00413-w
Bourdon, J. C. (2007). p53 and its isoforms in cancer. Br. J. Cancer 97, 277–282. doi:10.1038/sj.bjc.6603886
Braun, M. M., Overbeek-Wager, E. A., and Grumbo, R. J. (2016). Diagnosis and management of endometrial cancer. Am. Fam. Physician 93, 468–474.
Cai, Y., Wang, B., Xu, W., Liu, K., Gao, Y., Guo, C., et al. (2021). Endometrial cancer: genetic, metabolic characteristics, therapeutic strategies and nanomedicine. Curr. Med. Chem. 28, 8755–8781. doi:10.2174/0929867328666210705144456
Cao, X., Fang, J., Wei, Y., and Liang, S. (2025). Factors influencing disease-free survival after radical endometrial cancer surgery: an analysis of the competitive risk prediction mode. Am. J. Transl. Res. 17, 1265–1276. doi:10.62347/brvi1759
Chen, X., Zhang, T., Su, W., Dou, Z., Zhao, D., Jin, X., et al. (2022). Mutant p53 in cancer: from molecular mechanism to therapeutic modulation. Cell Death Dis. 13, 974. doi:10.1038/s41419-022-05408-1
Gao, H., Lu, Q., and Zhang, J. (2025). The prognostic significance and Co-Expression of fibroblast growth factor receptor 2 and c-Met in endometrial cancer. Int. J. Womens Health 17, 751–760. doi:10.2147/ijwh.S506565
Kartikasari, A. E. R., Huertas, C. S., Mitchell, A., and Plebanski, M. (2021). Tumor-induced inflammatory cytokines and the emerging diagnostic devices for cancer detection and prognosis. Front. Oncol. 11, 692142. doi:10.3389/fonc.2021.692142
Kennedy, M. C., and Lowe, S. W. (2022). Mutant p53: it's not all one and the same. Cell Death Differ. 29, 983–987. doi:10.1038/s41418-022-00989-y
Liu, Y., Su, Z., Tavana, O., and Gu, W. (2024). Understanding the complexity of p53 in a new era of tumor suppression. Cancer Cell 42, 946–967. doi:10.1016/j.ccell.2024.04.009
Mallardo, D., Fordellone, M., White, A., Vowinckel, J., Bailey, M., Sparano, F., et al. (2024). A combined proteomic and transcriptomic signature is predictive of response to Anti-PD-1 treatment: a retrospective study in metastatic melanoma patients. Int. J. Mol. Sci. 25, 9345. doi:10.3390/ijms25179345
Onoprienko, A., Hofstetter, G., Muellauer, L., Dorittke, T., Polterauer, S., Grimm, C., et al. (2024). Prognostic role of transcription factor ARID1A in patients with endometrial cancer of no specific molecular profile (NSMP) subtype. Int. J. Gynecol. Cancer 34, 840–846. doi:10.1136/ijgc-2023-005111
Wang, N., Cao, Y., Si, C., Shao, P., Su, G., Wang, K., et al. (2022). Emerging role of ERBB2 in targeted therapy for metastatic colorectal cancer: signaling pathways to therapeutic strategies. Cancers 14, 5160. doi:10.3390/cancers14205160
Wang, H., Guo, M., Wei, H., and Chen, Y. (2023). Targeting p53 pathways: mechanisms, structures, and advances in therapy. Signal Transduct. Target Ther. 8, 92. doi:10.1038/s41392-023-01347-1
Yang, X., Yang, Y., Zhao, M., Bai, H., and Fu, C. (2025). Identification of DYRK2 and TRIM32 as keloids programmed cell death-related biomarkers: insights from bioinformatics and machine learning in multiple cohorts. Comput. Methods Biomech. Biomed. Engin, 1–15. doi:10.1080/10255842.2025.2482129
Ye, J., Xu, R. H., Taylor-Papadimitriou, J., and Pitha, P. M. (1996). Sp1 binding plays a critical role in Erb-B2- and v-ras-mediated downregulation of alpha2-integrin expression in human mammary epithelial cells. Mol. Cell Biol. 16, 6178–6189. doi:10.1128/mcb.16.11.6178
Zeng, X., Shi, G., He, Q., and Zhu, P. (2021). Screening and predicted value of potential biomarkers for breast cancer using bioinformatics analysis. Sci. Rep. 11, 20799. doi:10.1038/s41598-021-00268-9
Zhao, H., Wu, L., Yan, G., Chen, Y., Zhou, M., Wu, Y., et al. (2021). Inflammation and tumor progression: signaling pathways and targeted intervention. Signal Transduct. Target Ther. 6, 263. doi:10.1038/s41392-021-00658-5
Keywords: bioinformatics analysis, diagnosis, prognosis, endometrial carcinoma, biomarkers
Citation: Gao L, Yuan D, Huang A and Qian H (2025) Bioinformatics-based identification of differentially expressed genes in endometrial carcinoma: implications for early diagnosis and prognostic stratification. Front. Genet. 16:1631060. doi: 10.3389/fgene.2025.1631060
Received: 19 May 2025; Accepted: 29 August 2025;
Published: 17 September 2025.
Edited by:
Domenico Mallardo, G. Pascale National Cancer Institute Foundation (IRCCS), ItalyReviewed by:
Stefan Kirov, Flare Therapeutics Inc., United StatesMario Fordellone, Università degli Studi della Campania Luigi Vanvitelli, Italy
Copyright © 2025 Gao, Yuan, Huang and Qian. This is an open-access article distributed under the terms of the Creative Commons Attribution License (CC BY). The use, distribution or reproduction in other forums is permitted, provided the original author(s) and the copyright owner(s) are credited and that the original publication in this journal is cited, in accordance with accepted academic practice. No use, distribution or reproduction is permitted which does not comply with these terms.
*Correspondence: Hua Qian, cWh0enJteXlAMTYzLmNvbQ==