 Jiaman Sun
 Ji Zhang
 Jinzhong Zhang
 Brett J. Ferguson
 Andrew Chen
- 1School of Life Science, Jiaying University, Meizhou, Guangdong, China
- 2Guangxi Academy of Agricultural Sciences, Nanning, China
- 3Guangzhou Academy of Agricultural and Rural Sciences, Guangzhou, China
- 4Integrative Legume Research Group, School of Agriculture and Food Sustainability, The University of Queensland, Brisbane, QLD, Australia
- 5School of Agriculture and Food Sustainability, The University of Queensland, Brisbane, QLD, Australia
Codon usage bias (CUB), a universal evolutionary phenomenon, reflects selective pressures shaping genome adaptation. The WRKY transcription factor family plays a pivotal role in regulating plant responses to physiological and biochemical stresses. This study investigates CUB patterns in 151 WRKY transcription factors of Musa acuminata ‘Guijiao 9′, a banana cultivar exhibiting resistance to Fusarium wilt Tropical Race 4 (TR4), to elucidate evolutionary drivers of stress adaptation. The codons of these transcription factors were selected based on their expression from RNA-Seq data. The average GC content of MaWRKY genes was 56.55%, with a GC3 content of 62.23%, indicating a preference for G/C-ending codons. Among the codons, 26 were identified as high frequency, with 22 ending in G or C. The high effective number of codons (ENC) values (35.03–60.14) suggested weak CUB. ENC-plot, PR2 bias plot, and neutrality analysis revealed that both natural selection and mutation pressure contributed to the observed CUB, with natural selection being the dominant factor influencing the codon usage of MaWRKY genes in M. acuminata ‘Guijiao 9'. Fifteen optimal codons, all ending in G or C, were identified. This analysis provides a theoretical foundation for further understanding the evolutionary mechanisms of WRKY genes in Musa.
1 Introduction
A codon is a triad nucleotide sequence on messenger RNA that encodes an amino acid. Synonymous codons encode the same amino acid, but species often prefer specific codons, leading to codon usage bias (CUB) (Grantham et al., 1980). Codon bias, influenced by mutation pressure, natural selection, and genetic drift (Bulmer, 1991), often correlates with higher gene expression (Ikemura, 1985; Sharp and Li, 1987). Mutation pressure causes deviations in nucleotide composition, while natural selection restricts codon usage bias to optimise protein production efficiency in highly expressed genes (Guan et al., 2018). Low-frequency codons support regulatory diversity of gene expression, playing an important role in the evolution and stability of species (Liu et al., 2010). Other influencing factors include nucleotide composition (Sueoka, 1962; Sueoka, 1988)), gene length (Eyre-Walker, 1996), expression level (Akashi, 1994), and tRNA abundance (Ikemura, 1981; 1985). In plants, monocotyledons prefer G/C-ending codons, while dicotyledons favor A/T-ending ones (Murray et al., 1989). Codon usage patterns help reveal evolutionary relationships among species (Dahal and bansal, 2025). GC content also serves as a distinguishing factor between these two groups of plants. Related species often exhibit similar codon usage biases, making it an important tool for inferring evolutionary relationships among different plant species (Morton, 1998; Muse and Gaut, 1994).
CUB reflects the origins, evolution, and mutations of species or genes, providing essential insights for gene function analysis, protein expression and protein structure research (Wu et al., 2015; He et al., 2016a). In recent years, studies on codon preference in gene families and individual genes across plants (Liu et al., 2020), animals (Uddin et al., 2020), viruses (Deb et al., 2020; Xin et al., 2020) and other organisms has been increasingly wide spread. WRKYs are among the largest plant transcription factor families, playing key roles in hormone synthesis, signaling, growth, metabolism and responses to biotic and abiotic stresses (Govardhana and Satyan, 2020; Li et al., 2020). The advent of next-generation sequencing technologies and bioinformatics tools has significantly enhanced comprehensive studies of WRKY transcription factors and their roles in plant adaptation to environmental stress (Wani et al., 2021; Goyal et al., 2023; Liu et al., 2023; Deng et al., 2024).
Banana (Musa spp.) is an important fruit crop, which supplies essential nutrients to millions of people around the world (Drenth and Kema, 2021). Cultivated Banana plants originated from natural intra- and inter specific hybridization between two diploid species, Musa acuminata (AA genome) and Musa balbisiana (BB genome) (Drenth and Kema, 2021). However, due to various biotic and abiotic stresses, global banana yields have significantly declined in recent years (Siamak and Zheng, 2018; Patel et al., 2019). One of the major diseases threatening the banana production dominated by ‘Cavendish’ from the AAA subgroup is the Fusarium wilt of banana, caused by Fusarium oxysporum f. sp. cubense tropical race 4 (FocTR4) (Zorrilla-Fontanesi et al., 2020; Roberts et al., 2024). Current efforts have been focused on containment and deterrence through biosecurity measures, biological control agents, integrated disease management strategies, and the development of resistant banana varieties (Swarupa et al., 2014; Ploetz and Randy, 2015; Dita et al., 2018; Pegg et al., 2019). Resistant (R) genes, such as Resistance Gene Analog 2 (RGA2), which was isolated from FocTR4-resistant M. acuminata ssp. malaccensis, demonstrated strong resistance in the field when over-expressed in ‘Cavendish’ transgenic lines (Dale et al., 2017). Forward genetic studies have also identified QTLs conferring resistance to FocTR4 and subtropical race 4 (Ahmad et al., 2020; Chen et al., 2023a; 2023b). Candidate R genes, specifically pattern recognition receptors, were identified.
Several WRKY genes, such as MaWRKY28, MaWRKY71, MaWRKY40 and MaWRKY22, have been associated with banana’s response to biotic stress, including FocTR4 (Sun et al., 2019; Li et al., 2012). However, research on the codon usage pattern of WRKY genes in banana has not been reported. Our previous research demonstrated that ‘Guijiao 9' (Musa acuminata) possesses strong resistance to FocTR4, with lower disease incidence and severity compared to susceptible banana cultivars (Sun et al., 2019). We hypothesized that codon optimization in defense-related genes accelerates stress-responsive translation. Recent studies demonstrate that resistant plant varieties exhibit stronger codon bias in immune genes than susceptible counterparts (Dahal and bansal, 2025). We thus propose that CUB patterns in WRKY transcription factors, key regulators of Fusarium defense pathways (Javed and Gao, 2023), reflect evolutionary adaptations that facilitate rapid pathogen response in ‘Guijiao 9'. In this study, 151 members of WRKY gene family were identified from the ‘Guijiao 9′ transcriptome data. Factors influencing codon preference of MaWRKY and potential evolutionary models were determined by analyzing the CUB of MaWRKY genes in ‘Guijiao 9'. These findings contribute to understanding the function of the WRKY gene family and provide insights for codon optimisation of MaWRKY genes in the regulation of biotic stress in banana.
2 Methods
2.1 Screening, identification and characterization of sequence
The coding sequences of WRKY transcription factors were initially extracted from the transcriptome database of Musa acuminata cultivar ‘Guijiao 9' (Supplementary File 1). To ensure comprehensive identification of all WRKY family members, we implemented a rigorous multi-step screening protocol. First, local BLAST searches (e-value cutoff: 1e-5) were performed to obtain corresponding amino acid and nucleotide sequences. Candidate sequences were then subjected to domain verification using HMMER 3.3 with the WRKY domain profile (PF03106) from PFAM database as reference (E-value < 0.01). All potential WRKY sequences were further validated through NCBI’s Conserved Domain Database (CDD) and only those containing the complete WRKYGQK motif were retained. Finally, open reading frames were predicted using ORFfinder with a minimum length requirement of 300 bp to ensure sequence integrity. Through this stringent screening pipeline, we identified 151 high-confidence MaWRKY genes with complete WRKY domains and intact coding sequences, which were subsequently used for comprehensive codon usage analysis (Supplementary File 2).
2.2 Indices of codon usage bias
Following the screening of MaWRKY gene CDS sequences, the key indices of CUB were calculated, including the effective number of codons (ENC), relative synonymous codon usage (RSCU), total GC content of each CDS (GC), and GC content at the first, second and third codon positions (GC1, GC2, GC3). Additionally, the nucleotide composition at synonymous third codon positions (A3s, T3s, G3s, C3s) was analyzed. These calculations were performed using the CodonW program (version 1.4.2) (Peden, 1986), with parameters validated for monocot genomes (Wright, 1990). Correlations between nucleotide contents were assessed using SPSS statistical software (version 23.0), with values exceeding 0.5 and below-0.5 indicating strong positive and strong negative correlations, respectively.
ENC is a standard indicator of CUB, with values from 20 (complete bias, one codon per amino acid) to 61 (no bias, equal usage of all synonymous codons) (Lu et al., 2005), which reflects the degree of CUB (Gao et al., 2022). The CUB is considered low if the ENC value is greater than 40 (Wright, 1990). RSCU measures the observed frequency of a codon relative to its frequency expected at random, independent of the amino acid composition of gene product (Wang et al., 2016). RSCU values equal to one imply uniform codon usage, values greater than one suggest preferential usage (positive bias), and values less than one denote reduced usage (negative bias) (Sharp and Li, 1986).
2.3 ENC-plot analysis
ENC-plot analysis is commonly used to identify factors influencing CUB by plotting ENC values against GC3s values. The standard curve represents the relationship between ENC and GC3s, helping to distinguish whether mutation pressure or natural selection is the dominant factor (Wright, 1990). When CUB is primarily driven by mutation pressure, data points typically lie on or just below the standard curve. In contrast, if natural selection and other factors play a larger role, the points tend to fall noticeably below the standard curve (Wright, 1990). However, the ENC-GC3s plot alone cannot conclusively distinguish the dominant force, because strong mutation pressure may push points below the curve, mimicking selection, and weak selection signals may be masked by mutational noise (Fuglsang, 2004; Plotkin and Kudla, 2011). Therefore, we employed complementary approaches including Parity Rule 2 Bias analysis, Neutrality Plot and Principle Component Analysis on RSCU to resolve this ambiguity.
2.4 Parity Rule 2 (PR2) bias plot analysis
A PR2 bias plot is created by plotting the AT bias (A3/(A3+ T3)) on the y-axis and the GC bias (G3/(G3 + C3)) on the x-axis. The midpoint at 0.5 indicates an equal balance between G = C and A = T, suggesting no significant bias from either mutation or selection pressure (Deb et al., 2020). If the genes are clustered near the center, it suggests that the base frequencies are relatively balanced, and the CUB is mainly affected by mutation pressure. Conversely, if the genes are far from the center, other factors may be affecting the CUB.
2.5 Neutrality plot analysis
A neutrality plot is used to assess the extent to which CUB is influenced by mutation versus selection in organisms, by comparing GC3 (x-axis) and GC12 (y-axis). In this plot, each gene is represented by a point. If the regression coefficient of the plot approaches 1 (complete neutrality), the points will show a clear pattern, indicating selection plays a significant role in CUB. If the regression coefficient deviates from 1, it suggests that factors other than mutation pressure are also influencing the CUB (Sueoka, 1988).
2.6 Principal Component Analysis (PCA) on RSCU
Principal Component Analysis or PCA is a multivariate statistical method to examine relationships among multiple variables, and is often applied to analyze trends in synonymous codon usage patterns (Kanaya et al., 1996). In this study, the RSCU values for 56 synonymous codons from MaWRKY genes was reduced from 151 dimensions (representing 151 MaWRKY genes) to two principal components through dimensionality reduction. Fifty-six synonymous codons did not include the initiation codon AUG, tryptophan codon UGG, the three triplet codons for Isoleucine, and the termination codons UAA, UAG, and UGA (Sueoka, 1988; Zhang et al., 2018).
2.7 Optimal codon analysis
The optimal codon plays a significant role in improving the speed and accuracy of translation (Duret and andMouchiroud, 1999). To predict the optimal codon for MaWRKY, the ΔRSCU method was applied (Sharp and Li, 1987; Ikemura, 1985). The 151 MaWRKY gene sequences were sorted based on their ENC values. The top 10% (n = 15) with the lowest ENC values and the bottom 10% (n = 15) with the highest ENC values were selected as extreme groups for optimal codon identification, and the RSCU values for the codons were calculated. A codon was designated as a high-expression superior codon if its RSCU value was higher in the high-expression group than in the low-expression group, and the difference between groups (ΔRSCU) met the threshold of ΔRSCU ≥ 0.08. These candidate codons were subsequently evaluated against the complete dataset. A codon was classified as an optimal codon only if its genome-wide RSCU value exceeded 1.0.
2.8 Statistical analysis
The CDS sequences of the MaWRKY were analyzed using CodonW (http://codonw.sourceforge.net/) and EMBOSS online software (http://www.bioinformatics.nl/emboss-explorer/). Codon-related parameters were statistically analyzed using Microsoft Office Excel 2016. ENC-plot analysis, Neutrality plot, and Box diagram were generated using Origin8.0 and HemI 1.0 (http://hemi.biocuckoo.org/down.php) software.
3 Results
3.1 Codon composition of MaWRKY genes reveals G/C bias
The codon composition and ENC values of 151 banana MaWRKY family members were statistically analyzed (Figure 1), with detailed codon bias parameters provided in Supplementary File 2. The ENC values ranged from 35.03 to 60.14, indicating varying levels of codon bias, although the overall CUB was weak. The average content of A3s and T3s was not significantly different from G3s and C3s (p > 0.05) (Figure 1A). However, the combined average content of G3s + C3s differed significantly from that of A3s + T3s. The average GC content was 56.55%, ranging from 44.7% to 70.6%, indicating a relatively high GC content and a preference for G/C-ending codons in MaWRKY genes. Analysis of G/C content at different codon positions showed that GC3s (62.23% on average) were much higher than GC1s and GC2s, suggesting preference for G or C at the third codon position. The first and second codon positions are relatively stable, while the third position shows greater fluctuation.
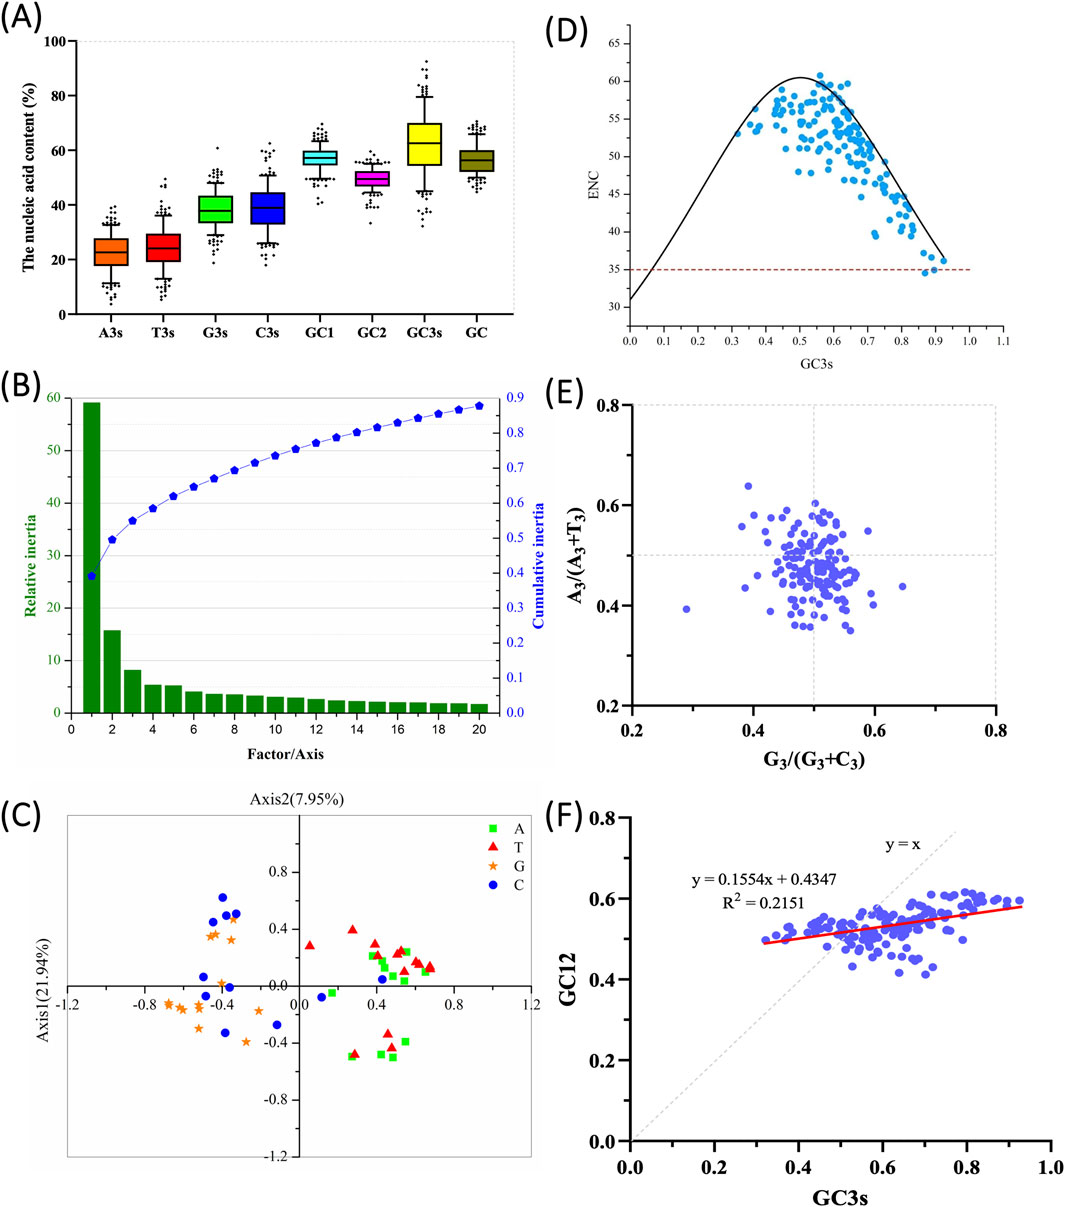
Figure 1. Codon usage analysis of the WRKY gene family in Musa acuminata ‘Guijiao 9’. (A) Nucleic acid composition of MaWRKY codons. The Y-axis represents the nucleic acid content, while the X-axis corresponds to the total GC content of each coding domain sequence (CDS), the nucleotide composition at the third codon position (A3s, T3s, G3s, C3s),the GC content at each codon position of GC1, GC2, and GC3 (representing the first, second, and third positions, respectively) for each CDS. (B) Principal component analysis (PCA) on the relative and cumulative contributions of the first 20 factors to the total variance. (C) PCA plot showing codon RSCU values on codons ending with A, T, G, or C. Green squares represent codons ending with A; red triangles indicate those ending with T, orange stars indicate codons ending with G, and blue circles indicate codons ending with C. (D) ENC-plot analysis of MaWRKY against GC3s. Points on or near the curve indicate bias caused by mutation pressure, while points away from the curve suggest influence from natural selection or other factors. The red-dotted line means the lowest ENC value of MaWRKY. (E) PR2 plot analysis. The midpoint at 0.5 represents an equal balance between G = C and A = T, indicating no bias between mutation and selection pressure. Deviations from 0.5 suggest that codon bias is primarily influenced by factors other than base mutation of gene-encoding amino acids. (F) Neutrality plot analysis of MaWRKY. The plot compares GC3 (x-axis) and GC12 (y-axis). A regression coefficient value less than 1.0 (complete neutrality) indicates an influence of natural selection or mutation pressure. The red straight line represents the fitted curve.
3.2 Codon usage parameter correlation analysis
The Pearson Correlation Coefficient for various codon usage indices was calculated and their values are presented in Table 1 to assess the relationships between factors influencing codon usage. ENC value showed a significant positive correlation with A3s (r = 0.706, p < 0.05) and T3s (r = 0.690, p < 0.05) but was negatively correlated with G3s (r = −0.609, p < 0.05), C3s (r = −0.691, p < 0.05), GC (r = −0.687, p < 0.05) and GC3s (r = −0.737, p < 0.05).These findings indicate that the nucleotide composition at the third position of synonymous codons has some subtle influence on CUB.
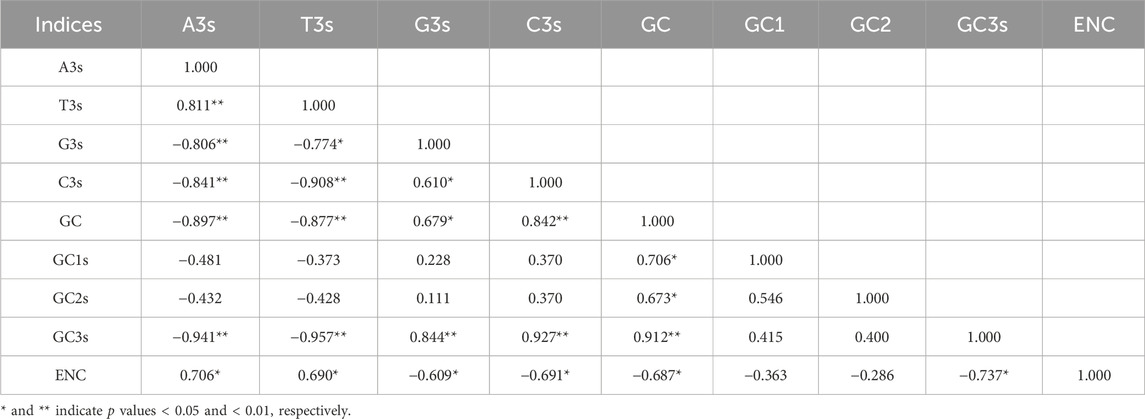
Table 1. Pearson correlation coefficients among parameters influencing codon bias in MaWRKY genes of Musa acuminata banana ‘Guijiao 9'. A3s, T3s, G3s and C3s denote the nucleotide content at the third codon position. GC represents the overall GC content of each coding domain sequence, while GC1, GC2, and GC3 refer to the GC content at the first, second, and third codon positions, respectively. ENC indicates Effective Number of Codons.
Additionally, G3s was positively correlated with C3s (r = 0.610, p < 0.05), GC3s (r = 0.844, p < 0.01) and GC (r = 0.679, p < 0.05). Conversely, A3s exhibited a negative correlation with G3s (r = −0.806, p < 0.01), C3s (r = −0.841, p < 0.01), GC3s (r = −0.941, p < 0.01) and GC (r = −0.897, p < 0.01). Similarly, T3s showed a negative correlation with G3s (r = −0.774, p < 0.05), C3s (r = −0.908, p < 0.01), GC3s (r = −0.957, p < 0.01), and GC (r = −0.877, p < 0.01) (Table 1). The lack of significant positive correlations indicates that A/T-ending codon usage frequency is not a primary determinant of CUB variation in MaWRKY genes, though minor influences cannot be excluded.
3.3 Principal Component Analysis
Principal Component Analysis (PCA) was performed on the RSCU values of MaWRKY genes sequences. The contribution of the first 20 factors to the variance in CUB is shown in Figure 1B. The first four factors accounted for 58.47% of the total variance, capturing the majority of the differences in codon usage patterns. Axis1, which accounted for the largest proportion of variance, was the principal axis explaining CUB and reflected the major source of variation in codon usage. PCA analysis of the 56 codons in MaWRKY family members, categorized by their endings (A, T, C or G), revealed distinct distribution patterns (Figure 1C). A/T codons formed dense clusters, contrasting with broadly distributed G/C codons, with those ending in C being spread across all four quadrants. These findings indicate a natural evolutionary or long-time domestication bias in banana codon usage toward G and C endings.
3.4 Factors affecting CUB in MaWRKY genes of Musa acuminata
ENC-plot analysis is commonly used to assess the effect of mutation pressure on CUB. The ENC values are plotted against GC3 values (Figure 1D). The standard curve shows that the relationship between ENC and GC3s is shaped primarily by mutation pressure rather than selection. The ENC values for MaWRKY family members generally align with the standard curve in the ENC-plot, indicating that mutation pressure is a major factor influencing CUB for these genes (Figure 1D). However, the ENC values of many MaWRKY genes deviate significantly from the standard curve (Figure 1D), suggesting that mutation pressure is not the sole factor driving codon bias. Other factors, such as natural selection and gene expression, may also contribute to the observed codon bias.
PR2 analysis was performed to assess the impact of mutation and selection pressure on codon usage by examining whether there was a mutation imbalance between A/T (U) and C/G. In the PR2 plot, A3/(A3 + T3) is plotted as the ordinate and G3/(G3+C3) as the abscissa for MaWRKY family members to explore the influence of evolutionary factors (Figure 1E). It could be seen that codon T and C of MaWRKY in the third position has a slight bias. It was in line with the view of that C and T are used more frequently than G and A in four-fold degenerate codon groups in monocot and dicot plant species (Kawabe and Miyashita, 2003). The A3/(A3 + T3) or G3/(G3 + C3) values for most MaWRKY genes deviated from 0.5, suggesting that codon bias was additionally influenced by factors other than base mutation in codon sequences (Figure 1E). This indicates that additional pressures, such as natural selection, likely played a role in the evolution of MaWRKY genes.
Neutrality plot analysis was performed by comparing GC3 (abscissa) and GC12 (ordinate) to examine the role of mutation-selection equilibrium in codon usage variation. A linear regression line was plotted with GC3 (abscissa) and GC12 (ordinate) values (Figure 1F). When the slope of the regression line approaches 1, it suggests that mutation pressure plays a dominant role in shaping CUB, whereas a slope near 0 indicates that natural selection is the primary influencing factor (Sueoka, 1988). In Figure 1F, the low coefficient of determination (R2 = 0.2151) indicates that only 21.5% of the variation in GC12 can be explained by GC3, suggesting that mutational pressure plays a limited role in shaping codon usage patterns. Moreover, the low slope value (0.1554) implies that the GC content at the third codon position has minimal influence on the first and second positions, further supporting the hypothesis that natural selection is the dominant force influencing CUB in MaWRKY genes (Figure 1F).
3.5 Relative synonymous codon usage (RSCU) in MaWRKYgene family
To investigate the patterns of synonymous codon usage bias in MaWRKY gene family, the RSCU of 56 synonymous codons (excluding the initiation and termination, isoleucine, and tryptophan codons) were analyzed. The results revealed 26 high-frequency codons (RSCU > 1) in MaWRKY family members, including AGG, AGA, CUC, CUG, UUG, AGC, UCC, UCG, GUG, GUC, ACC, ACG, GGC, GCC, GCU, CCG, CCA, UGC, AAG, UUC, AAC, GAG, UAC, CAG, CAC, and GAU, respectively (Figure 2). Among these, 22 codons ended in G/C, indicating a preference for G or C ending codons in MaWRKY members. The codon AGG of Arginine (RSCU = 1.800) exhibited the strongest preference, accounting for 30% of the synonymous codons. These high-frequency codons show preferential usage, which contributed to the deviation of MaWRKY genes from an ENC value of 61.
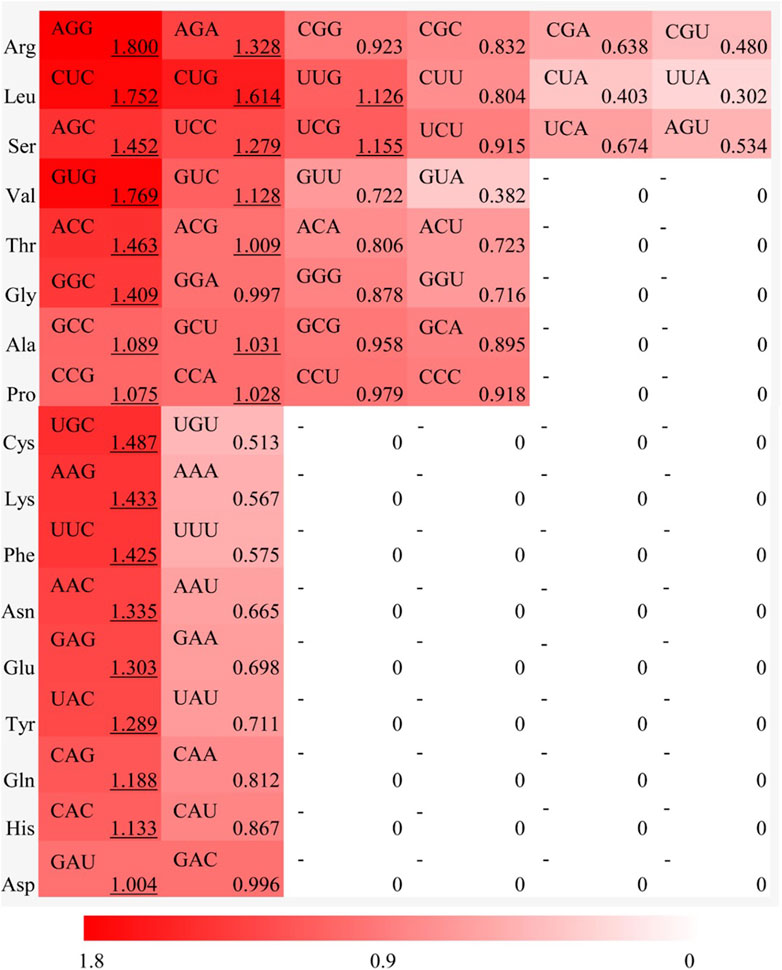
Figure 2. Relative synonymous codon usage (RSCU) analysis for each amino acid in MaWRKY gene family of Musa acuminata banana ‘Guijiao 9'. The red color bar represents the RSCU value, with deeper shades indicating higher RSCU values.
3.6 The optimal codons of MaWRKY genes
The optimal codons in MaWRKY genes of M. acuminata ‘Guijiao 9′ were identified by combining high-frequency codons (RSCU > 1) and highly expressed codons (ΔRSCU ≥ 0.08). The analysis revealed 24 highly expressed codons with ΔRSCU ≥ 0.08 (Table 2) and 26 high-frequency codons with RSCU > 1 (Figure 2). In total, 15 optimal codons were determined for MaWRKY genes in M. acuminata ‘Guijiao 9′, including CUC, CUG, GUG, UCC, AGC, CCG, ACC, GCC, UAC, CAC, CAG, AAC, GAG, UUC and GGC. Notably, all of these optimal codons end with G or C (Table 2).
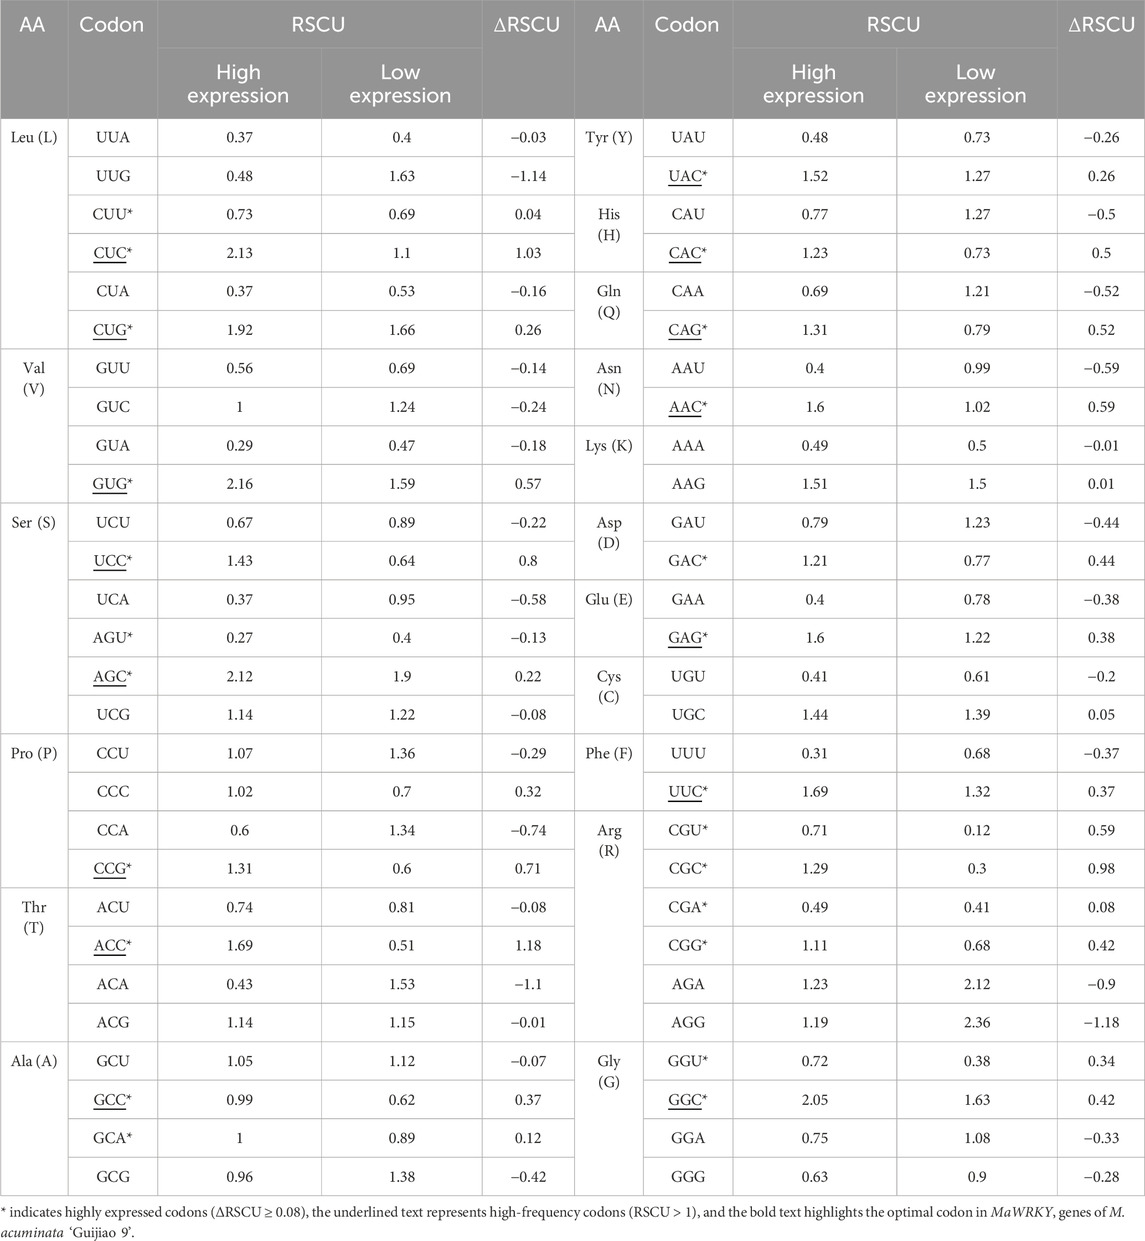
Table 2. Identification of optimal codons in MaWRKY genes of M. acuminata ‘Guijiao 9'.
4 Discussion
During the process of gene expression, the selective use of codons varies from species to species. Different organisms exhibit different preference for synonymous codons encoding the same amino acid, closely linked to their genetic characteristics. CUB can influence mRNA stability, transcription, protein translation accuracy, and protein folding, thereby fine-tuning gene expression. In the present study, 151 coding sequences of WRKY genes from M. acuminata ‘Guijiao 9′ were analyzed to investigate CUB and its potential influencing factors. The results revealed that MaWRKY genes in M. acuminata ‘Guijiao 9′ exhibit a preference for codons ending in G/C, similar to other monocotyledons, such as Musa basjoo, Zea mays and oryza sativa (Ma et al., 2015).
Overall, the CUB was weak, and the expression levels of these genes were low, indicating high variability in synonymous codon usage among MaWRKY genes. This is not surprising since the expression of WRKY genes is known to be induced by stress (Dong et al., 2003; Kayum et al., 2015). WRKY transcription factors exhibit constitutively low expression in non-stress environments through evolutionarily optimized transcriptional restraint (Rushton et al., 2010; Birchler and Yang, 2022), preventing unnecessary resource allocation (Tian et al., 2003) while enabling rapid stress response mobilization via chromatin poising (Li et al., 2020). Furthermore, the GC3 content showed greater variability than GC1 and GC2 with codons ending in G/C exhibiting a broad distribution. These results suggest that nucleotide composition plays a significant role in influencing CUB in MaWRKY genes. While mutation pressure played a role, natural selection was likely the primary factor in shaping the codon usage patterns of MaWRKY genes during evolution. In Ginkgo biloba, it was reported that certain genes were involved in environment adaptation preferentially using G/C-ending codons, with natural selection as the primary driver of CUB (He et al., 2016b). Interestingly, while monocotyledons like M. acuminata favor G/C-ending codons, dicotyledons such as Helianthus annuus (Gao et al., 2022) and Brassica napus (Li et al., 2013) exhibit a preference for A/T (U)-ending codons. In these dicotyledonous plant species, mutation pressure appears to play a larger role in shaping CUB (Gao et al., 2022; Li et al., 2013). Thus, the codon usage preferences vary significantly among different plant species, reflecting distinct evolutionary pressures and adaptations.
This work establishes codon usage patterns as evolutionary signatures of historical selection pressures, creating a predictive framework for future functional studies on WRKY-mediated stress responses in banana.
Data availability statement
The original contributions presented in the study are included in the article/Supplementary Material, further inquiries can be directed to the corresponding author. Publicly available datasets were analyzed in this study. This data can be found in NCBI, https://www.ncbi.nlm.nih.gov/datasets/taxonomy/214687/
Author contributions
JS: Resources, Writing – original draft, Supervision, Project administration, Funding acquisition, Writing – review and editing, Investigation, Methodology, Conceptualization. JiZ: Writing – review and editing, Data curation, Visualization, Methodology, Formal Analysis, Investigation. JnZ: Investigation, Supervision, Writing – review and editing, Formal Analysis. BF: Writing – review and editing, Supervision. AC: Formal Analysis, Supervision, Writing – original draft, Investigation, Writing – review and editing.
Funding
The author(s) declare that financial support was received for the research and/or publication of this article. This work was supported by Guangxi Natural Science Foundation (2021GXNSFAA196014) and Funding of Jiaying University (2022RC97). AC was supported by The Bill and Melinda Gates Foundation (Project Grant ID: OPP1093845) through its grant to the International Institute of Tropical Agriculture (IITA) under the project Accelerated Breeding of Better Bananas, grant number IITA 20600.15/0008-8—Phase II as well as Hort Innovation Australia through grant ‘BA21000’, using the banana research and development levy and contributions from the Australian Government. Hort Innovation is the grower-owned, not-for-profit research and development corporation for Australian horticulture.
Conflict of interest
The authors declare that the research was conducted in the absence of any commercial or financial relationships that could be construed as a potential conflict of interest.
Generative AI statement
The author(s) declare that no Generative AI was used in the creation of this manuscript.
Any alternative text (alt text) provided alongside figures in this article has been generated by Frontiers with the support of artificial intelligence and reasonable efforts have been made to ensure accuracy, including review by the authors wherever possible. If you identify any issues, please contact us.
Publisher’s note
All claims expressed in this article are solely those of the authors and do not necessarily represent those of their affiliated organizations, or those of the publisher, the editors and the reviewers. Any product that may be evaluated in this article, or claim that may be made by its manufacturer, is not guaranteed or endorsed by the publisher.
Supplementary material
The Supplementary Material for this article can be found online at: https://www.frontiersin.org/articles/10.3389/fgene.2025.1647037/full#supplementary-material
Abbreviations
CUB, Codon usage bias; ENC, Effective number of codons; RSCU, Relative synonymous codon usage; PCA, Principal component analysis; PR2, Parity Rule 2; GC1, GC2, GC3, The GC content at the first, second and third position, respectively; A3s, T3s, G3s, C3s, The content of each nucleotide of the codon at synonymous third positions.
References
Ahmad, F., Martawi, N. M., Poerba, Y. S., Hans, S., Henk, K., and Gert, H. J. (2020). Genetic mapping of fusarium wilt resistance in a wild banana musa Acuminatassp. Malaccensis accession. Theor. Appl. Genet. 133 (12), 3409–3418. doi:10.1007/s00122-020-03677-y
Akashi, H. (1994). Synonymous codon usage in drosophila Melanogaster: natural selection and translational accuracy. Genetics 136 (3), 927–935. doi:10.1093/genetics/136.3.927
Birchler, J. A., and Yang, H. (2022). The multiple fates of gene duplications: deletion, hypofunctionalization, subfunctionalization, neofunctionalization, dosage balance constraints, and neutral variation. Plant Cell. 34 (7), 2466–2474. doi:10.1093/plcell/koac076
Bulmer, M. (1991). The selection-mutation-drift theory of synonymous codon usage. Genetics 129 (3), 897–907. doi:10.1093/genetics/129.3.897
Chen, A., Sun, J. M., Martin, G., Gray, L. A., Hribová, E., Christelová, P., et al. (2023a). Identification of a major QTL-Controlling resistance to the subtropical race 4 of fusarium Oxysporumf. Sp. cubensein Musa acuminata ssp. Malaccensis. Pathogens 12 (2), 289. doi:10.3390/pathogens12020289
Chen, A., Sun, J. M., Viljoen, A., Mostert, D., Xie, Y. C., Mangila, L., et al. (2023b). Genetic mapping, candidate gene identification and marker validation for host plant resistance to the race 4 of Fusarium oxysporum F. sp. cubense using Musa acuminata ssp. malaccensis. Pathogens 12 (6), 820. doi:10.3390/pathogens12060820
Dahal, U., and bansal, A. (2025). Codon usage and antibiotic resistance: a hidden evolutionary mechanism. Biochimie. doi:10.1016/j.biochi.2025.07.027
Dale, J., James, A., Paul, J. Y., Khanna, H., Smith, M., Peraza-Echeverria, S., et al. (2017). Transgenic Cavendish bananas with resistance to Fusarium wilt tropical race 4. Nat. Commun. 8 (1), 1496. doi:10.1038/s41467-017-01670-6
Deb, B., Uddin, A., and Chakraborty, S. (2020). Codon usage pattern and its influencing factors in different genomes of hepadnaviruses. Arch. Virol. 165, 557–570. doi:10.1007/s00705-020-04533-6
Deng, P. J., Wang, Z., Li, W. Y., Chen, X. H., and Liu, D. Q. (2024). WRKY11 up-regulated dirigent expression to enhance lignin/lignans accumulation in Lilium regale Wilson during response to Fusarium wilt. J. Inte Agri. 23 (8), 2703–2722. doi:10.1016/j.jia.2023.07.032
Dita, M., Barquero, M., Heck, D., Mizubuti, E. S. G., and Staver, C. P. (2018). Fusarium wilt of banana: current knowledge on epidemiology and research needs toward sustainable disease management. Front. Plant Sci. 9, 1468. doi:10.3389/fpls.2018.01468
Dong, J., Chen, C., and Chen, Z. (2003). Expression profiles of the Arabidopsis WRKY gene superfamily during plant defense response. Plant Mol. Biol. 51, 21–37. doi:10.1023/a:1020780022549
Drenth, A., and Kema, G. (2021). The vulnerability of bananas to globally emerging disease threats. Phytopathology 111, 2146–2161. doi:10.1094/PHYTO-07-20-0311-RVW
Duret, L., and Mouchiroud, D. (1999). Expression pattern and, surprisingly, gene length shape codon usage in Caenorhabditis, Drosophila, and Arabidopsis. PANS 96, 4482–4487. doi:10.1073/pnas.96.8.4482
Eyre-Walker, A. (1996). Synonymous codon bias is related to gene length in Escherichia coli: selection for translational accuracy? Mol. Biol. Evol. 13 (6), 864–872. doi:10.1093/oxfordjournals.molbev.a025646
Fuglsang, A. (2004). The 'effective number of codons' revisited. Biochem. Biophys. Res. Commun. 317 (3), 957–964. doi:10.1016/j.bbrc.2004.03.138
Gao, Y., Lu, Y., Song, Y., and Jing, L. (2022). Analysis of codon usage bias of WRKY transcription factors in Helianthus annuus. BMC Genomic Data 23, 46. doi:10.1186/s12863-022-01064-8
Govardhana, M., and Satyan, K. B. (2020). In-silico Analysis of cucumber (Cucumis sativus L.) genome for WRKY transcription factors and cis-acting elements. Comput. Bio Chem. 85, 107212.
Goyal, P., Devi, R., Verma, B., Hussain, S., Arora, P., Tabassum, R., et al. (2023). WRKY transcription factors: evolution, regulation, and functional diversity in plants. Protoplasma. 260, 331–348. doi:10.1007/s00709-022-01794-7
Grantham, R., Gautier, C., Gouy, M., Mercier, R., and Pavé, A. (1980). Codon catalog usage and the genome hypothesis. Nucleic Acids Res. 8 (1), 49–62. doi:10.1093/nar/8.1.197-c
Guan, D. L., Ma, L. B., Salabat, K. M., Zhan, X. X., Xu, S. Q., and Xie, J. Y. (2018). Analysis of codon usage patterns in Hirudinariamanillensis reveals a preference for GC-ending codons caused by dominant selection constraints. BMC Genomics 19, 542. doi:10.1186/s12864-018-4937-x
He, B., Dong, H., Jiang, C., Cao, F., and Xu, L. A. (2016a). Analysis of codon usage patterns in Ginkgo biloba reveals codon usage tendency from A/U-ending to G/C-ending. Sci. Rep. 6, 35927. doi:10.1038/sre35927
He, B., Dong, H., Jiang, C., Cao, F. L., Tao, S. T., and Xu, L. A. (2016b). Analysis of codon usage patterns in Ginkgo bilobareveals codon usage tendency from A/U-ending to G/C ending. Sci. Rep. 6, 35927. doi:10.1038/srep35927
Ikemura, T. (1985). Codon usage and tRNA content in unicellular and multicellular organisms. Mol. Biol. Evol. 2 (1), 13–34. doi:10.1093/oxfordjournals.molbev.a040335
Ikemura, T. (1981). Correlation between the abundance of Escherichia coli transfer RNAs and the occurrence of the respective codons in its protein genes: a proposal for a synonymous codon choice that is optimal for the E. coli translational system. J. Mol. Biol. 151, 389–409.
Javed, T., and Gao, S. (2023). WRKY transcription factors in plant defense. Trends Genet. 39 (10), 787–801. doi:10.1016/j.tig.2023.07.001
Kanaya, S., Kudo, Y., Nakamura, Y., and Ikemura, T. (1996). Detection of genes in Escherichia coli sequences determined by genome projects and prediction of protein production levels, based on multivariate diversity in codon usage. Bioinformatics 12, 213–225. doi:10.1093/bioinformatics/12.3.213
Kawabe, A., and Miyashita, N. T. (2003). Patterns of codon usage bias in three dicot and four monocot plant species. Genes and Genet. Syst. 78 (5), 343–352. doi:10.1266/ggs.78.343
Kayum, M. A., Jung, H. J., Park, J. I., Ahmed, N. U., Saha, G., Yang, T. J., et al. (2015). Identification and expression analysis of WRKY family genes under biotic and abiotic stresses in Brassica rapa. Mol. Genet. Genomics 290, 79–95. doi:10.1007/s00438-014-0898-1
Li, C. Y., Deng, G. M., Yang, J., Viljoen, A., Jin, Y., Kuang, R. B., et al. (2012). Transcriptome profiling of resistant and susceptible Cavendish banana roots following inoculation with Fusarium oxysporum f. spcubensetropical race 4. BMC Genom 13, 374. doi:10.1186/1471-2164-13-374
Li, G. Y., Wang, Z., Zhang, Z. Y., Fang, H. D., and Tan, X. L. (2013). The base composition and codon use of the WRKY gene family of the Brassica napus. J. Biol. 30, 42–45.
Li, W., Zhu, Z., Chern, M., Yin, J., Yang, C., Wang, J., et al. (2017). A natural allele of a transcription factor in rice confers broad-spectrum blast resistance. Cell. 170 (1), 114–126.e1. doi:10.1016/j.cell.2017.06.008
Liu, H., He, R., Zhang, H., Huang, Y., Tian, M., and Zhang, J. (2010). Analysis of synonymous codon usage in Zea mays. Mol. Biol. Rep. 37, 677–684. doi:10.1007/s11033-009-9521-7
Liu, H., Lu, Y., Lan, B., and Xu, J. (2020). Codon usage by chloroplast gene is bias inHemipteleadavidii. J. Genet. 99, 8. doi:10.1007/s12041-019-1167-1
Liu, J. N., Fang, H. C., Liang, Q., Dong, Y. H., Wang, C. X., Yan, L. P., et al. (2023). Genomic analyses provide insights into the evolution and salinity adaptation of halophyte Tamarix chinensis. GigaScience 12, giad053–17. doi:10.1093/gigascience/giad053
Lu, H., Zhao, W.-M., Zheng, Y., Hong, W., Mei, Q., and Yu, X.-P. (2005). Analysis of synonymous codon usage bias in Chlamydia. Acta Biochim. Biophys. Sin. (Shanghai) 37 (1), 1–10. doi:10.1093/abbs/37.1.1
Ma, Q., Li, C., Wang, J., Wang, Y., and Ding, Z. (2015). Analysis of synonymous codon usage in FAD7 genes from different plant species. Genet. Mol. Res. 14, 1414–1422.
Morton, B. R. (1998). Selection on the codon bias of chloroplast and cyanelle genes in different plant and algal lineages. J. Mol. Evol. 46 (4), 449–459. doi:10.1007/pl00006325
Murray, E. E., Lotzer, J., and Eberle, M. (1989). Codon usage in plant genes. Nucleic Acids Res. 17, 477–498. doi:10.1093/nar/17.2.477
Muse, S. V., and Gaut, B. S. (1994). A likelihood approach for comparing synonymous and nonsynonymous nucleotide substitution rates, with application to the chloroplast genome. Molecular Biology and Evolution, 11 (5), 715–724. doi:10.1093/nar/17.2.477
Patel, P., Yadav, K., Srivastava, A. K., Suprasanna, P., and Ganapathi, T. R. (2019). Overexpression of native Musa-miR397 enhances plant biomass without compromising abiotic stress tolerance in banana. Sci. Rep. 9, 16434–15. doi:10.1038/s41598-019-52858-3
Pegg, K. G., Coates, L. M., O’Neill, W. T., and Turner, D. W. (2019). The Epidemiology of Fusarium wilt of banana. Front. Plant Sci. 10, 1395. doi:10.3389/fpls.2019.01395
Ploetz, R. C., and Randy, C. (2015). Fusarium wilt of banana. Phytopathology 105 (12), 1512–1521. doi:10.1094/PHYTO-04-15-0101-RVW
Plotkin, J., and Kudla, G. (2011). Synonymous but not the same: the causes and consequences of codon bias. Nat. Rev. Genet. 12, 32–42. doi:10.1038/nrg2899
Roberts, J. M., Carvalhais, L. C., O'Dwyer, C., Rincón-Flórez, V. A., and Drenth, A. (2024). Diagnostics of Fusarium wilt in banana: current status and challenges. Plant Pathol. 73 (4), 760–776. doi:10.1111/ppa.13863
Rushton, P. J., Somssich, I. E., Ringler, P., and Shen, Q. J. (2010). WRKY transcription factors. Trends Plant Sci, 15 (5), 247–258. doi:10.1016/j.tplants.2010.02.006
Sharp, P. M., and Li, W. H. (1986). Codon usage in regulatory genes in Escherichia coli does not reflect selection for ‘rare’codons. Nucleic acids Res. 14, 7737–7749. doi:10.1093/nar/14.19.7737
Sharp, P. M., and Li, W. H. (1987). The codon adaptation index-a measure of directional synonymous codon usage bias, and its potential applications. Nucleic Acids Res. 15, 1281–1295. doi:10.1093/nar/15.3.1281
Siamak, S. B., and Zheng, S. (2018). Banana Fusarium wilt (Fusarium oxysporum f. sp. cubense) control and resistance, in the context of developing wilt-resistant bananas within sustainable production systems. Horti Plant J. 4, 208–218. doi:10.1016/j.hpj.2018.08.001
Sueoka, N. (1988). Directional mutation pressure and neutral molecular evolution. PANS 85, 2653–2657. doi:10.1073/pnas.85.8.2653
Sueoka, N. (1988). On the genetic basis of variation and heterogeneity of DNA base composition. Proc. Natl. Acad. Sci. USA. 48, 582–592. doi:10.1073/pnas.85.8.2653
Sun, J., Zhang, J., Fang, H., Peng, L., Wei, S., Li, C., et al. (2019). Comparative transcriptome analysis reveals resistance-related genes and pathways in Musa acuminata banana 'Guijiao 9' in response to Fusarium wilt. Plant Physiol. Bioch 141, 83–94. doi:10.1016/j.plaphy.2019.05.022
Swarupa, V., Ravishankar, K. V., and Rekha, A. (2014). Plant defense response against Fusarium oxysporum and strategies to develop tolerant genotypes in banana. Planta 239, 735–751. doi:10.1007/s00425-013-2024-8
Tian, D., Traw, M. B., Chen, J. Q., Traw, M. B., Kreitman, M., and Bergelson, J. (2003). Fitness costs of R-gene-mediated resistance in Arabidopsis thaliana. Nature 423, 74–77.
Uddin, A., Mazumder, T. H., Barbhuiya, P. A., and Chakraborty, S. (2020). Similarities and dissimilarities of codon usage in mitochondrial ATP genes among fishes, aves, and mammals. IUBMB Life 72, 899–914. doi:10.1002/iub.2231
Wang, S. F., Su, M. W., Tseng, S. P., Li, M. C., Tsao, C. H., Huang, S. W., et al. (2016). Analysis of codon usage preference in hemagglutinin genes of the swine-origin influenza A (H1N1) virus. J. MicrobioImmuno. 49, 477–486. doi:10.1016/j.jmii.2014.08.011
Wani, S. H., Anand, S., Singh, B., Bohra, A., and Joshi, R. (2021). WRKY transcription factors and plant defense responses: latest discoveries and future prospects. Plant Cell Rep. 40 (7), 1071–1085. doi:10.1007/s00299-021-02691-8
Wright, F. (1990). The effective number of codons used in a gene. Gene 87, 23–29. doi:10.1016/0378-1119(90)90491-9
Wu, Y., Zhao, D., and Tao, J. (2015). Analysis of codon usage patterns in herbaceous Peony (Paeonia lactiflora Pall.) based on transcriptome data. Genes 6, 1125–1139. doi:10.3390/genes6041125
Xin, W., Liu, Y., Yang, Y., Sun, T., Niu, L., and Ge, J. (2020). Detection, genetic, and codon usage bias analyses of the VP2 gene of mink bocavirus. Virus Genes 56, 306–315. doi:10.1007/s11262-020-01738-4
Zhang, X., Cai, Y., Zhai, X., Liu, J., Zhao, W., Ji, S., et al. (2018). Comprehensive analysis of codon usage on rabies virus and other lyssaviruses. Int. J. Mol. Sci. 19, 2397. doi:10.3390/ijms19082397
Keywords: Musa acuminata, ‘Guijiao 9′, WRKY transcription factors, codon usage bias, natural selection, mutation pressure, Fusarium wilt of banana
Citation: Sun J, Zhang J, Zhang J, Ferguson BJ and Chen A (2025) Codon usage bias analysis of the WRKY gene family in Musa acuminata. Front. Genet. 16:1647037. doi: 10.3389/fgene.2025.1647037
Received: 14 June 2025; Accepted: 12 August 2025;
Published: 29 August 2025.
Edited by:
Ertugrul Filiz, Duzce University, TürkiyeReviewed by:
Peng He, Shaanxi Normal University, ChinaShamsun Nisa, Indian Institute of Integrative Medicine (CSIR), India
Copyright © 2025 Sun, Zhang, Zhang, Ferguson and Chen. This is an open-access article distributed under the terms of the Creative Commons Attribution License (CC BY). The use, distribution or reproduction in other forums is permitted, provided the original author(s) and the copyright owner(s) are credited and that the original publication in this journal is cited, in accordance with accepted academic practice. No use, distribution or reproduction is permitted which does not comply with these terms.
*Correspondence: Andrew Chen, YS5jaGVuMkB1cS5lZHUuYXU=
†These authors have contributed equally to this work