 Xue Meng1†
 Lichao Cao2†Yantao Liu1Sihan Wang2Weixian Liu1Guangping Zhang1Siqi Guo1Fangyu Qi1Tingting Wang1Yuhe Xia1Ying Ba2
 Hezi Zhang2*†Lijun Fang1*†
- 1Department of Oral and Maxillofacial Surgery, Shengjing Hospital of China Medical University, Shenyang, China
- 2Department of Research and Development, Shenzhen Nucleus Gene Technology Co., Ltd., Shenzhen, China
Objectives: Oral squamous cell carcinoma (OSCC) has a highly incidence rate and mortality rate all over the world. Hitherto, there are limited studies on survival significance between disulfidptosis-related lncRNAs (DRLs) and OSCC. Therefore, this study was conducted to investigate the potential role of these DRLs and provide some theoretical support in the clinical treatment of OSCC.
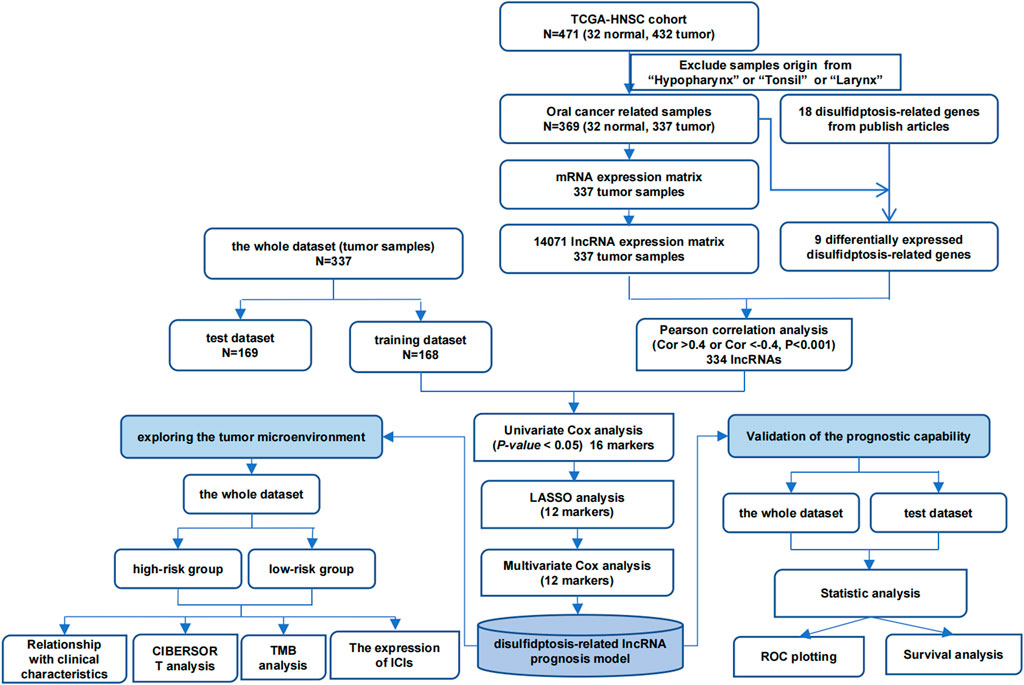
Methods: OSCC-related lncRNAs and disulfidptosis-related genes (DRGs) were retrieved from public databases. Using Pearson correlation, machine learning, and expression profiling, we identified differentially expressed DRLs (DE-DRLs), developed a DE-DRLs-based risk model and independent prognostic nomogram, performed immunological and tumor microenvironment analyses to explore DE-DRLs regulatory mechanisms, predicted potential drugs for OSCC, and validated bioinformatics findings.
Results: In this study, 9 DE-DRLs were identified that correlated with OSCC. The risk model and nomogram showed good clinical utility for assessing the likelihood of OSCC occurrence. Patients exhibiting elevated levels of eosinophils, activated natural killer (NK) cells, or naïve CD4+ T cells experienced significantly poorer overall survival (OS), and patients with high tumor mutational burden (TMB) had worse prognosis. 12 drugs were identified for OSCC treatment, such as BMS-754807_2171 and Foretinib_2040.
Conclusion: Our study identified 9 DE-DRLs correlated with OSCC, which will be a personalized prediction tool for prognosis and immune responses in OSCC patients.
GRAPHICAL ABSTRACT |
1 Introduction
Oral squamous cell carcinoma (OSCC) is a common heterogeneous oral malignancy (Wang. et al., 2021a). Smoking, excessive alcohol consumption, betel quid chewing, and human papilloma virus are risk factors for OSCC (Nokovitch et al., 2023). Approximately 600,000 patients are deeply troubled by OSCC each year, representing about 4% of all tumors (Pekarek et al., 2023). Oral cavity provides convenience for clinical examination, however the diagnosis of OSCC is in advanced stages due to misdiagnosis by the doctor or ignorance by patients (Jagadeesan et al., 2024). Meantime, the prognosis is unsatisfactory for patients with OSCC, the 5-year survival rate is as low as 40%–50% (Chai et al., 2020). Currently, the primary treatment modalities for OSCC include surgery, chemotherapy, and novel cellular therapies. While these are the mainstay of clinical management, their therapeutic efficacy remains suboptimal due to strong side effects, high costs of novel cellular therapies, and the propensity of OSCC cells (Jagadeesan et al., 2024). Therefore, there is a pressing need to increase survival rates and quality of life of OSCC patients by developing new and reliable prognostic evaluation method.
Disulfidptosis is a novel type of regulated cell death, which is associated with metabolic changes and has a strong effect on anti-tumor immune response (Liu et al., 2023). In addition, the metabolism of disulfides in cancer cells is connected with immune evasion, metastasis, and resistance of tumor cells (Shrihari et al., 2022; Wang et al., 2021b; Zhang et al., 2022a). As the source of programmed cell death, disulfidptosis is expected to provide a new approach to cancer therapy. So far, the role of disulfidptosis in OSCC is still quite lacking. Meanwhile, long non-coding RNAs (lncRNAs) are critical to the tumorigenesis and progression, and can be considered key factor to promotion and suppression of tumor due to their dysregulation in cancer (Ahmad et al., 2023; Kitajima et al., 2023). Currently, studies on the cell death patterns of OSCC have found that ferroptosis-related lncRNAs (Qiu et al., 2022), cuproptosis-related lncRNAs (Gong et al., 2024), and pyroptosis-related lncRNAs (Xin et al., 2022) are crucial prognostic biomarkers and therapeutic targets for OSCC. However, there is a lack of research on the role of disulfidptosis-related lncRNAs (DE-DRLs) in OSCC.
Here, we systematically structured a dependable DE-DRLs for predicting prognosis of OSCC, and explored the relationship between the prognostic model and clinicopathological information and the tumor immune landscape, and investigate the role of key DE-DRLs in OSCC. The implications of our findings are expected to generate guidance for tailoring personalized treatment strategies, and provide a foundation for further research on the mechanism of disulfidptosis in OSCC.
2 Acquisition of data
The lncRNAs sequencing information, which exclude samples origin from “hypopharynx”, “tonsil” or “larynx” of the TCGA-HNSC were acquired from the Cancer Genome Atlas (TCGA) database (https://portal.gdc.cancer.gov/), in which 14,071 lncRNAs were identified for the further analysis. The TCGA-HNSC comprised 337 tumor samples along with 32 control samples, samples that were not representative of the oropharyngeal region and that did not affect the prognosis of HPV were excluded, the clinical pathological information was shown in Supplementary Table S1. Additionally, 18 DRGs were obtained from the literature (Dong et al., 2023).
3 Statistical methods
3.1 Identification of DE-DRLs
Firstly, the DE-DRGs were analyzed utilizing Wilcoxon test between tumor and control group in TCGA-HNSC (P < 0.05). Among the 337 tumor samples in TCGA-HNSC, a Pearson correlation was constructed to illustrate the obtain DE-DRLs between the DE-DRGs and 14,071 lncRNAs (|correlation coefficient (cor)|>0.4, P < 0.05). Following this, 337 tumor samples were divided into 168 training dataset and 169 test dataset (1 : 1), the univariate Cox regression analysis of signature genes 1 was performed utilizing the survival (v 3.5.3) package (Therneau and Lumley, 2015) (P < 0.05). Moreover, the LASSO analysis with penalty parameters (lambda), β coefficient ≠ 0 and the 10-fold cross-validation was performed on signature genes 1 by glmnet (v 4.1.4) package (Friedman et al., 2021) to further screen signature genes 2. Lastly, multivariate Cox regression analysis and Wilcoxon test were utilized to obtain DE-DRLs (P < 0.05).
3.2 Prognostic modeling and assessment
Furthermore, independent prognostic factors and their coefficients were denoted through multivariate Cox regression assessment before calculating individual case risk scoring, using:
Where
3.3 Construction of nomogram
Among the 337 tumor samples, the Wilcoxon test (P < 0.05) and multifactor Cox regression analysis (survival (v 3.5.3) package) (HR ≠ 1 and P < 0.05) were conducted to obtain the independent prognostic factors of OSCC patients based on the risk score and 3 clinical characteristics (age, gender, and stage) (P < 0.05). After that, a nomogram was constructed based on the independent prognostic factors to predict mortality in patients with OSCC by rms (v 6.5.0) package (Harrell Jr et al., 2017). Additionally, the calibration curves by PredictABEL (v 1.2.4) package (Kundu et al., 2020) were also plotted to evaluate the accuracy of the predicted probabilities of the nomogram.
3.4 Immune microenvironment analysis
Normalized gene expression matrices, in conjunction with the CIBERSORT algorithm, were utilized to estimate the proportions of all 22 immune cell types between high - risk and low - risk group (Newman et al., 2015). Kaplan-Meier curves were then generated to assess the association of each significantly differentially abundant immune cell type (P < 0.05) with OS. Correlation analysis was utilized to demonstrate the correlation between DE-DRLs and different immune cells. The estimate (v 1.0.13) package (Yoshihara et al., 2016) was utilized to analysis the difference between high - risk and low - risk group in ESTIMATEScore, ImmuneScore, and StromalScore. The mutation profiles of the two groups were visualized using the maftools package in R on the entire dataset, and differences in TMB were evaluated via unpaired t - tests.
3.5 Analysis of chemotherapeutic drug sensitivity and immune checkpoints
The oncoPredict (v 0.1) package was employed to predict the half maximal inhibitory concentration (IC50) values for cancer drug response associated with OSCC treatment in each sample (IC50 < 5). Subsequently, the constructed prognostic risk score model was utilized to comparatively analyze the differences in the response to these selected drugs between the high - risk and low - risk groups. Moreover, the Wilcoxon test allowed transcriptomic expression profiles for immune checkpoints together with linked ligands across high-together with low-risk group for comparative analyses (P < 0.05). Lastly, correlation analysis was utilized to demonstrate the correlation between DE-DRLs and immune checkpoints.
3.6 Expression analysis of DE-DRLs
Further analysis was conducted to verify the expression of biomarkers through RT-qPCR. The OSCC tumor samples were gained from the 10 patients in Shengjing Hospital of China Medical University. And the adjacent tumor sample obtained from 4 healthy individuals were utilized as control samples. This study was approved by Ethics Committee of Shengjing Hospital of China Medical University (No. 2024PS802K). All individuals had signed an informed consent form. Total RNA of each sample was separately extracted using TRIzol (TIANGEN, Beijing, CHINA) according to the manufacturer’s guidance. Reverse transcription of total RNA to cDNA was carried out by using Hifair® Ⅲ 1st Strand cDNA Synthesis SuperMix for qPCR (gDNA digester plus) (Yisheng, Shanghai, China) based on the manufacturer’s instructions. RT-qPCR was performed utilizing the Hieff® qPCR SYBR Green Master Mix (Yisheng, Shanghai, China). The primer sequences for PCR were shown in Supplementary Table S2. GAPDH was an internal reference gene. The 2−ΔΔCT method (Livak and Schmittgen, 2001) was utilized to calculate the expression of biomarkers.
4 Results
4.1 Construction of a prognostic DE-DRLs in OSCC
Firstly, the Wilcoxon test demonstrated 9 DE-DRGs significant difference between tumor and control group (Figure 1). A total of 334 DE-DRLs were identified based on Pearson correlation analysis with |coefficient |> 0.4 and P < 0.001 (Dong et al., 2023). Subsequently, we utilized univariate Cox analysis to screen out 16 signature genes 1 with prognostic significance in TCGA-HNSC (Table 1). Furthermore, 9 DE-DRLs with the optimal prognosis were ultimately identified through LASSO analysis, the multivariate Cox analysis, and Wilcoxon test (Figures 2A–C, P > 0.05), which included AC009226.1, AP001107.9, AC108463.3, SAP30L_AS1, AC007406.3, PTPRN2_AS1, AP003559.1, JMJD1C_AS1, and AC079160.1. Notably, they were all high expressed in OSCC samples (P < 0.05). The assigned a risk score to each sample by the given equation: Risk Score = AC009226.1 * 0.16323 + AP001107.9 * (−0.17272) + AC108463.3 * (−0.11501) + SAP30L_AS1 * −0.31715 + AC007406.3 * (−0.03145) + PTPRN2_AS1 * (−0.05957) + AP003559.1 * (−0.28549) + JMJD1C_AS1 * (−0.12380) + AC079160.1 * 0.07491. Pearson correlation analysis revealed that positive correlations existed among the majority of DE-DRLs. Specifically, KLF7_IT1 and AL139035.1 exhibited relatively large positive coefficients, which implies their positive correlation with the outcome within the model. In contrast, TSPOAP1_AS1 and SAP30L_AS1 showed negative or near-zero coefficients, indicating a negative or weak association with the outcome (Figure 2C). ROC curve analysis showed the DE-DRLs had a promising predictive value in the in TCGA-HNSC (1-year AUC = 0.696, 3-year AUC = 0.658, 5-year AUC = 0.671, Figure 2D). In addition, Kaplan-Meier analysis demonstrated a significantly worse prognosis in the high-risk group in contrast to the low-risk (cut-point = −3.273, P < 0.0001, Figure 2D). Consistent with these findings, the DE-DRLs were validated in training and test dataset (Figures 2E,F).
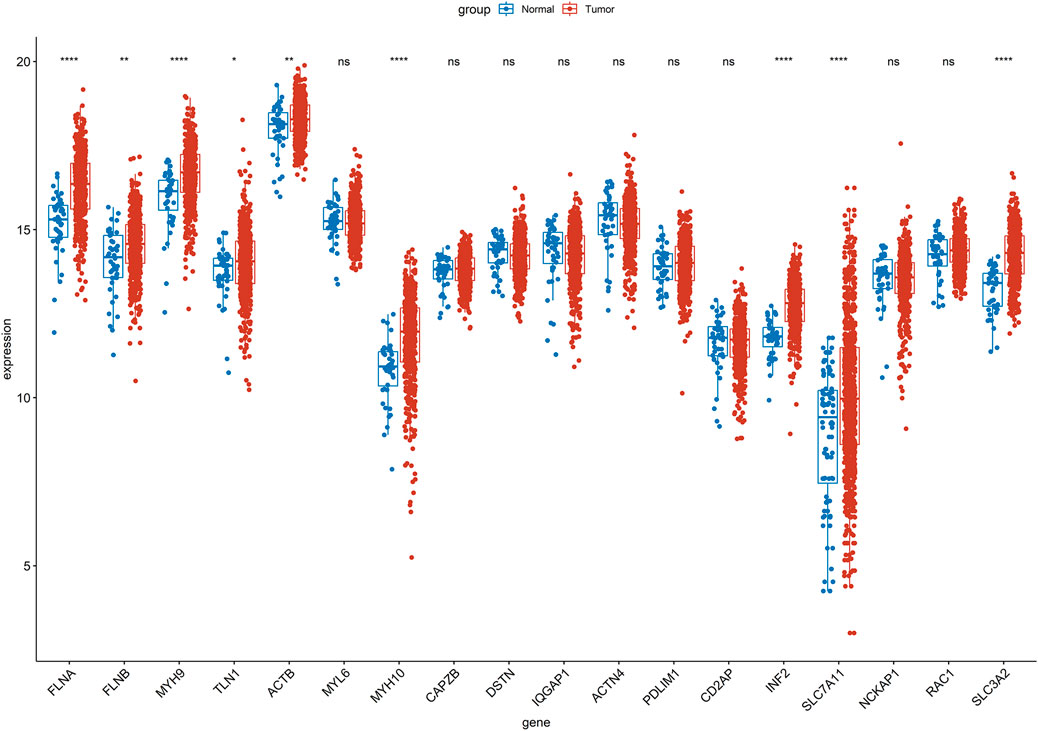
Figure 1. Wilcoxon test of 18 disulfidptosis-related genes (DRGs) between tumor and control group in TCGA-HNSC. “ns” indicates p > 0.05; “*” indicates p < 0.05; “**” indicates p < 0.01; “***” indicates p < 0.001; and “****” indicates p < 0.0001.
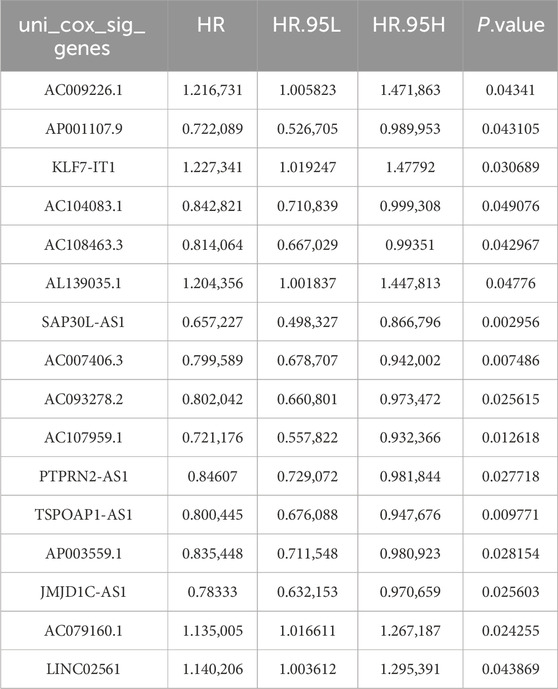
Table 1. Univariate Cox analysis showing the 16 prognostic DRlncRNAs.
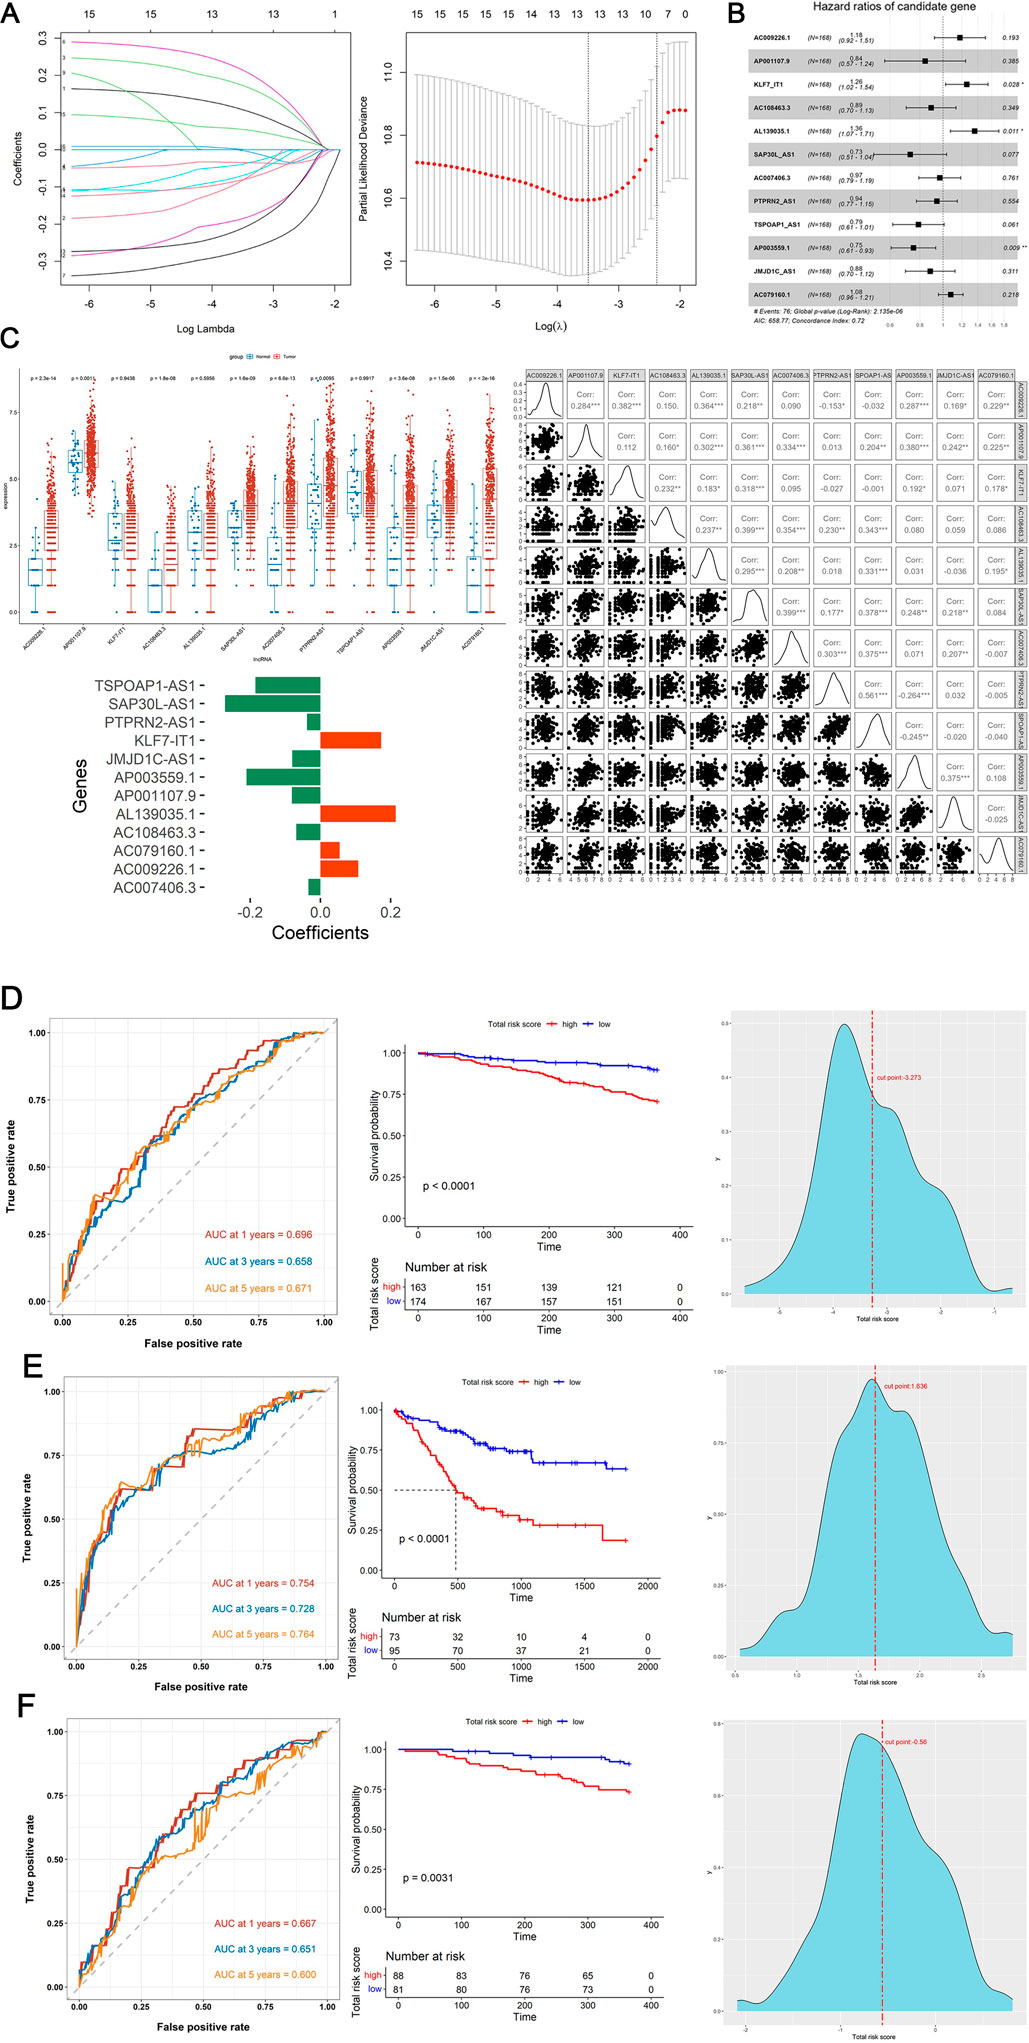
Figure 2. Construction and validation of prognostic model. (A) The variation characteristics of the coefficient of variables and the selection process of the optimum value of the parameter λ in the Lasso regression model by cross-validation method. (B) Multivariate Cox regression analysis of DE-DRLs. (C) Wilcoxon test and Pearson correlation analysis of 12 DE-DRLs (P < 0.05). (D–F) Receiver operating characteristic (ROC) curves and Kaplan-Meier (K–M) survival analysis, cut-point value in TCGA-HNSC, training and test dataset.
4.2 Assessment of the relationship between DE-DRLs and clinicopathological features in OSCC
In TCGA-HNSC tumor samples, the association of DE-DRLs with clinicopathological features were further analyzed. DE-DRLs was significantly related to T stage of OSCC (P = 0.014, Figure 3B), but not with the pathological stage (P = 0.052, Figure 3A) and N stage (P = 0.89, Figure 3C). Moreover, the multivariate Cox analysis demonstrated the risk score (HR = 2.67, 95% CI 1.80–3.80) was an independent prognostic factor for OS in OSCC patients (Figure 3D). Combination with risk scores and other clinicopathological parameters, a new nomogram were developed to make a more comprehensive prediction of patient survival at 1, 3, and 5 years (Figure 3E). Calibration curves exhibited a good degree of concordance between the actual outcomes and predicted survival probabilities for 1-, 3-, and 5-year survival rates (Figure 3F).
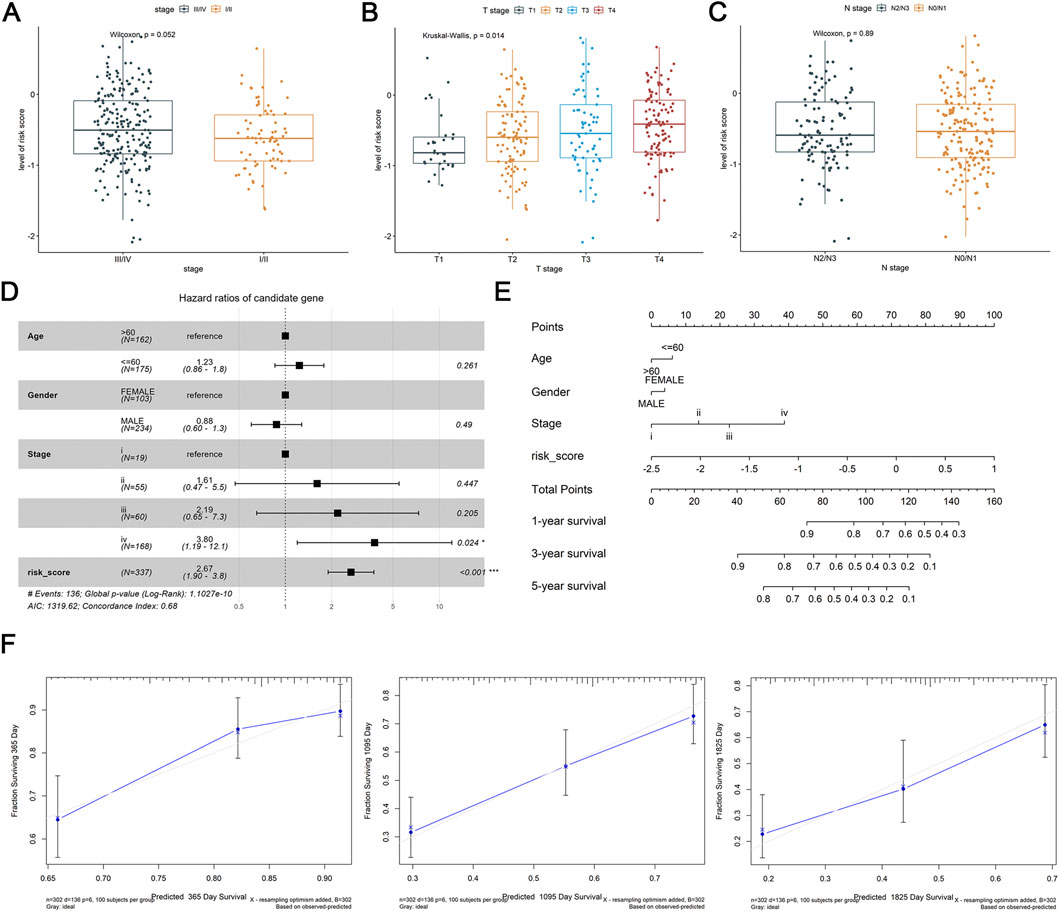
Figure 3. Differential expression analysis of clinicopathological features and construction and validation of nomogram. (A–C) Association of risk score with stage, T stage, N stage. (D) Multivariate Cox analysis of independent prognostic factors. (E) Nomogram of risk score and independent prognostic factors. (F) Calibration curves of nomogram at 1, 3 and 5 years.
4.3 Analysis of the association between immune infiltration and DE-DRLs
After that, we further investigated the relationship between tumor microenvironment and DE-DRLs in OSCC patients of TCGA-HNSC. Significant discrepancies between the two groups were observed in the proportion of immune cells including naïve B cells, mast cells, regulatory T cells (Tregs), activated dendritic cells and resting mast cells (Figure 4A). Kaplan-Meier analysis revealed patients with high levels of eosinophils (P = 0.015), activated NK cells (P = 0.021) or naïve CD4 T cells (P = 0.020) had significantly worse OS (Figures 4B–D), whereas patients with a low level of Tregs (P = 0.017) had poor OS (Figure 4E). Overall, the DE-DRLs could reflect the immune microenvironment of OSCC patients, furthermore, DE-DRLs were generally negatively correlated with the majority of the differentiating immune cells (Supplementary Table S3). The box plot results show that significant difference were observed between high - risk and low - risk group in ESTIMATEScore, ImmuneScore, and StromalScore, which all highly expressed in low - risk group (P < 0.0001, Figure 4F).
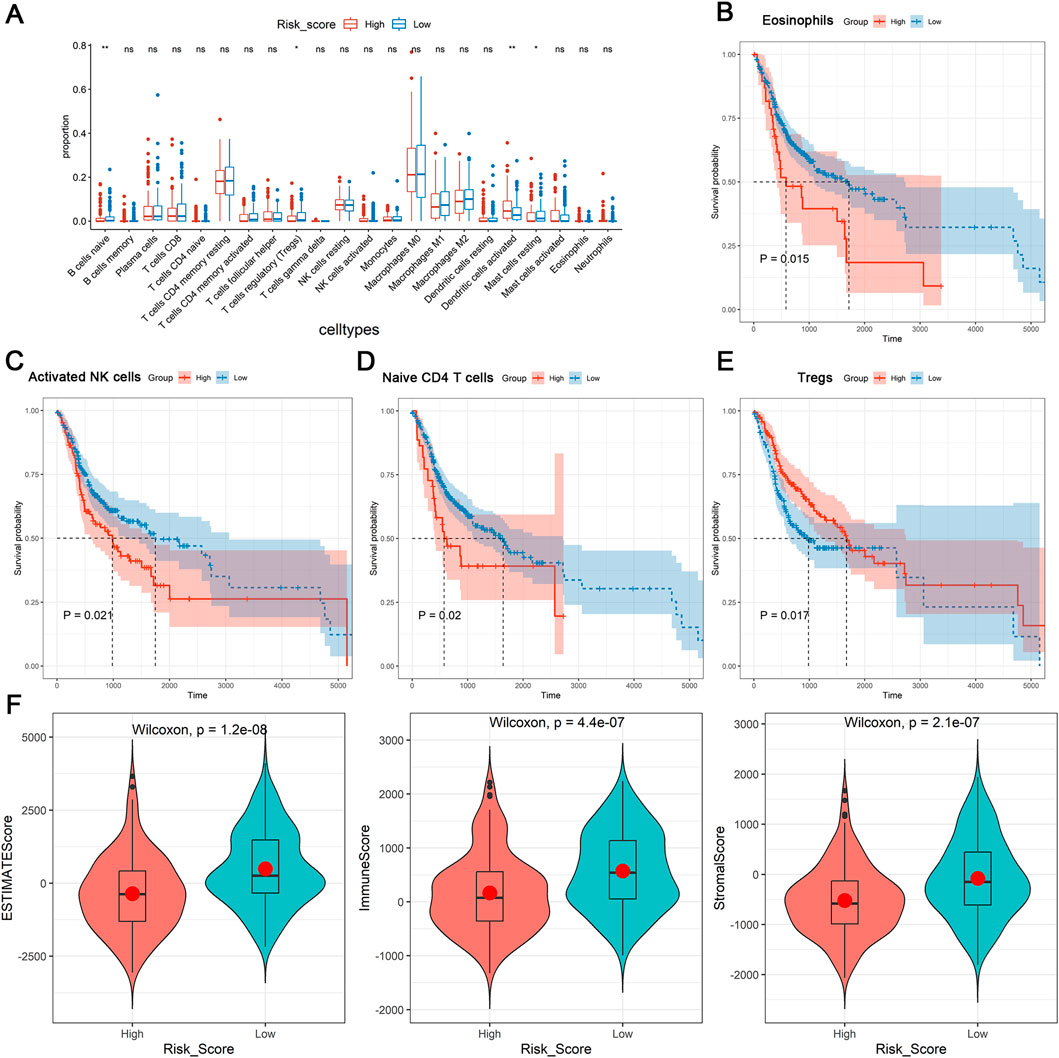
Figure 4. Immune microenvironment analysis. (A) Differences expression in infiltration levels. (B–E) K-M survival analysis in eosinophils, activated NK cells, naïve CD4 T cells, and Tregs between high- and low-risk groups. (F) Differences expression in ESTIMATEScore, ImmuneScore, and StromalScore. “ns” indicates p > 0.05; “*” indicates p < 0.05; “**” indicates p < 0.01; “***” indicates p < 0.001; and “****” indicates p < 0.0001.
4.4 Evaluation of the relationship between mutation profiles and DE-DRLs
TMB can be utilized to predict patient’s sensitivity to tumor immunotherapy. In this study, the TP53 gene mutation was highest in the TCGA-HNSC tumor samples (69%) and in the high-risk group (72%) and low-risk group (67%) (Figures 5A,B). Subsequently, as showed in Figure 5C, MDN1 (OR = 0.187) had a high mutation rate in the low-risk group, while high-risk group had high mutation rates of MYCBP2 (OR = 3.723), TGFBR2 (OR = 3.723), PLEC (OR = 2.449), and NSB1 (OR = 2.811). Moreover, the TMB of each patients (Median: 1.76/MB, Figure 5D) were calculated. There was significant difference of TMB value between the high-and low-risk group (P = 7.7e-05, Figure 5E). Meantime, patients with high TMB had worse prognosis than those with low TMB (P = 0.015, Figure 5F).
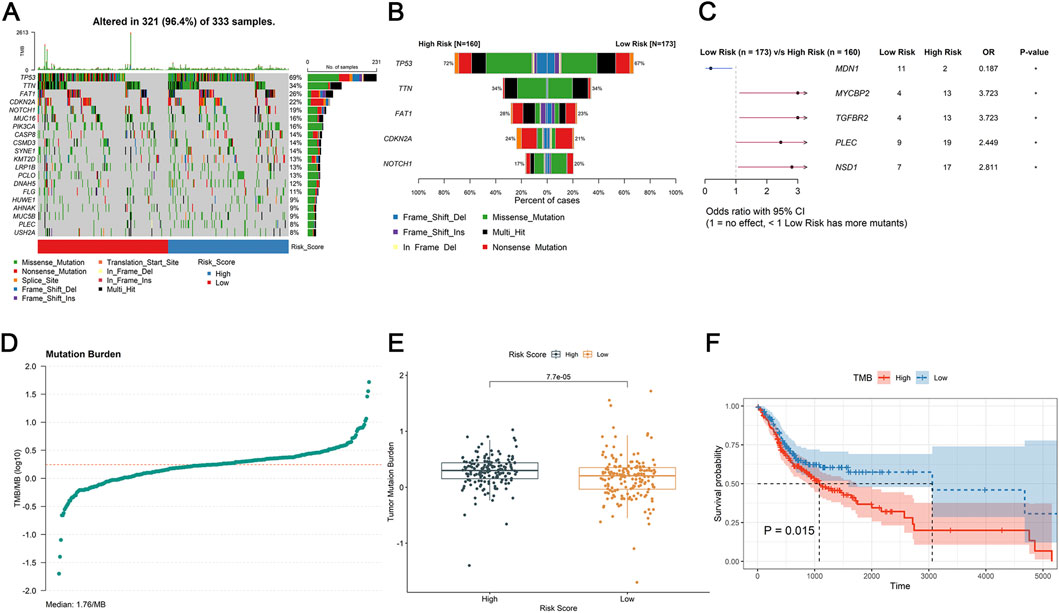
Figure 5. Tumor microenvironment analysis. (A,B) The mutational status of TMB samples. (C) The odds ratio of mutated genes between the high- and low-risk group in forest plot. (D) Mutation burder curve of OSCC tumor samples. (E) Differences expression in mutation burder between high- and low-risk groups. (F) K-M survival analysis of TMB between the high- and low-risk group.
4.5 Prediction of drug sensitivity and chemotherapy response
As showed in the violin plots, a sum of 12 drugs showed significant difference between different risk groups, of which 5 upregulated and 7 downregulated in high-risk group (P < 0.05, Figure 6A). Lastly, PD-L1, PD-1, CTLA-4, HAVCR2, LAG3, and TIGIT demonstrated significant difference between different risk groups, notably, they were all high expression in low-risk group (P < 0.05, Figure 6B). Meanwhile, DE-DRLs were generally positively correlated with the majority of the immune checkpoints (Supplementary Table S4).
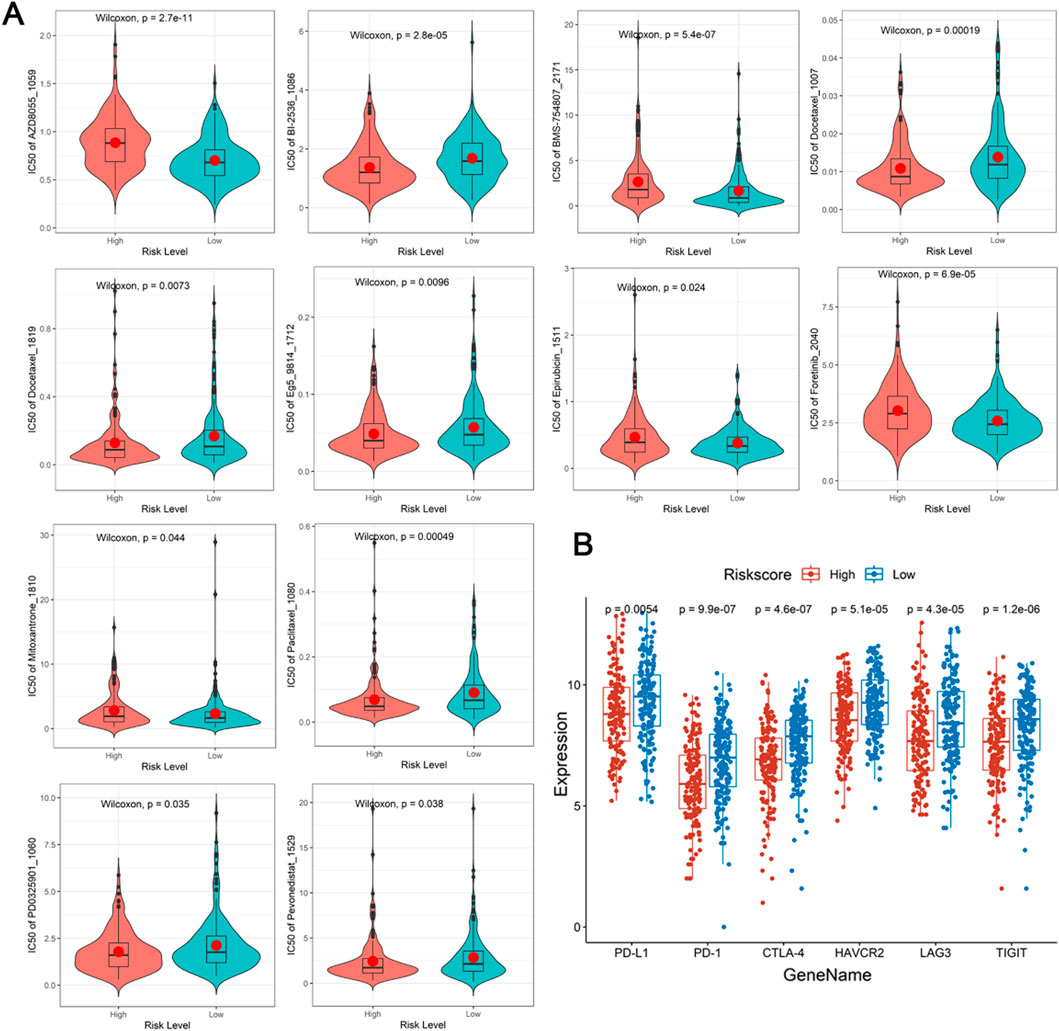
Figure 6. Drugs prediction and immune checkpoints analysis. (A) The half-maximal inhibitory concentration (IC50) of drugs and small molecule inhibitors between the high- and low-risk group. (B) Differences expression in immune checkpoints.
4.6 Verification of DE-DRLs expression
Previous studies revealed that 9 DE-DRLs were significantly upregulated in OSCC samples across TCGA-HNSC (P < 0.05) (Figure 2C). These findings prompted further validation of DE-DRLs expression using RT-qPCR. Consistent with the initial results, RT-qPCR demonstrated that AC009226.1, AC108463.3, SAP30L_AS1, AC007406.3, ΑP003559.1, JMJD1C_AS1, JMJD1C_AS1, and AC079160.1 expression were significantly higher (P < 0.05) in OSCC tumor samples compared to control samples (Figure 7). These results further underscored their reliability as biomarkers and highlighted their potential utility in OSCC prognostic diagnosis and therapeutic development.
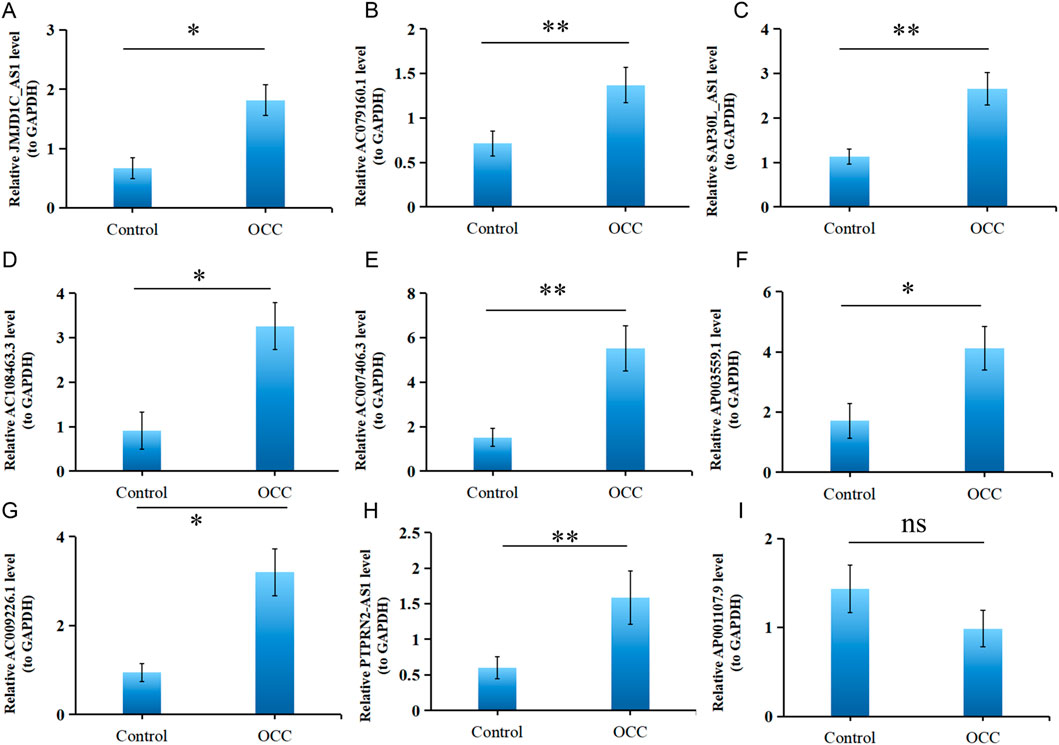
Figure 7. Validation of 9 DE-DRLs. RT-qPCR expression levels of JMJD1C_AS1 (A), AC079160.1 (B), SAP30L_AS1 (C), AC108463.3 (D), AC007406.3 (E), AP003559.1 (F), AC009226.1 (G), PTPRN2_AS1 (H), and AP001107.9 (I). n = 3, “ns” indicates p > 0.05; “*” indicates p < 0.05; “**” indicates p < 0.01; “***” indicates p < 0.001; and “****” indicates p < 0.0001.
5 Discussion
The OSCC patients face a poor prognosis, regulating disulfidptosis in cancer is a promising therapeutic approach (Yang et al., 2024). In this study, 9 DE-DRLs (AC009226.1, AP001107.9, AC108463.3, SAP30L_AS1, AC007406.3, PTPRN2_AS1, AP003559.1, JMJD1C_AS1, and AC079160.1) associated with OSCC were accurately identified. A prognostic model showed high-risk patients had lower survival. A nomogram integrating risk score and clinical features had excellent predictive ability for patient outcomes. DE-DRLs were linked to the OSCC immune microenvironment, where high levels of certain immune cells predicted poor survival. Additionally, 12 drugs differed in efficacy between risk groups, and immune checkpoints were more highly expressed in the low-risk group, pointing to potential therapeutic targets.
To prevent overfitting, we used LASSO regression to reduce the dimensionality of the data. We identified 9 DE-DRLs that were closely associated with the OS of OSCC patients and all highly expressed in tumor group of TCGA-HNSC. Several of the identified DE-DRLs have been previously characterized and are strongly associated with tumorigenesis and cancer progression. Specifically, AC009226.1 has been established as a prognostic biomarker for lung adenocarcinoma (LUAD), while AC007406.3 has been validated as a prognostic target in clear cell renal cell carcinoma (ccRCC). Both lncRNAs exhibit elevated expression levels in tumor tissues compared to normal counterparts, as reported in previous studies (Sun et al., 2023; Zhang et al., 2023b). In addition, JMJD1C_AS1 and AC079160.1 have been identified as potential prognostic biomarkers for gastric cancer (GC) (Ahmadpour Youshanlui et al., 2024; Guo et al., 2021). Notably, high expression of AC079160.1 has been correlated with favorable survival outcomes in GC patients, suggesting its role in predicting prognosis and potentially informing treatment strategies. These findings underscore the clinical relevance of these DE-DRLs across diverse cancer types and highlight their potential utility in precision oncology (Guo et al., 2021; Yang et al., 2022). Moreover, emerging evidence demonstrates that SAP30L-AS1 exhibits elevated expression levels in both prostate cancer (PCa) tissues and cell lines. Functionally, SAP30L-AS1 suppresses the upregulation of SAP30L in PCa, thereby exerting a tumorigenic effect. These findings, as previously reported (Qin et al., 2019), further highlighting its broad clinical relevance. PTPRN2_AS1 displayed consistent result with Xiong et al. (2023). Notably, this study represents the first report identifying AC108463.3 and AP003559.1 as prognostic markers for cancer, thereby addressing a critical void in the existing cancer prognosis literature. This groundbreaking discovery significantly expands the current knowledge base regarding potential cancer biomarkers. RT-qPCR analysis revealed elevated expression levels of AP001107.9 in the control group, diverging from the findings of prior investigations by Shen et al. (2025). This discrepancy may stem from two main factors: limited sample size causing heterogeneity and study-specific epigenetic/post-transcriptional regulation of AP001107.9. Uncharacterized regulatory mechanisms in prior research may explain expression variability and result divergence. Exploring DE-DRLs-prognosis correlations could offer new molecular targets for OSCC.
Systematically analyzing the biological pathways that lncRNAs may be involved in regulating will help us deepen our understanding of the pathological process of OSCC from multiple dimensions, from molecular mechanisms to clinical applications, providing dual support for target selection and efficacy prediction in the precise treatment of OSCC. Previous studies have shown that, the downregulation of SAP30L by SAP30L_AS1 impairs the assembly and enzymatic activity of the HDAC complex. This leads to dysregulated histone deacetylation, subsequent transcriptional repression of tumor-suppressor genes, and promotion of cancer cell proliferation (Qin et al., 2019). PTPRN2_AS1 can adsorb miR-145-5p through the ceRNA mechanism (Huang et al., 2021), thereby relieving its inhibition on PTPRN2 and enhancing the activity of the insulin signaling pathway, promoting tumor cell glycolysis (Meng et al., 2019), which also crucial in the energy metabolism reprogramming of OSCC. However, although no direct studies have confirmed the involvement of AC009226.1, AP001107.9, AC108463.3, AC007406.3, AP003559.1, JMJD1C_AS1, and AC079160.1 in the physiological processes of OSCC, evidence from the literature and the present study indicates that these lncRNAs may participate in biological pathways related to tumor proliferation (Cutilli et al., 2016), invasion (Wu et al., 2022), immune regulation (Huang et al., 2024), and epigenetics (Tang et al., 2021). DNA methylation is one of the most important epigenetic mechanisms to regulate gene expression, aberrant DNA methylation patterns are strongly associated with cancer, such as lncRNAs can recruit or repel DNA modifiers to specific gene targets and regulate the expression of DNA modifiers per se at multiple levels (Huang et al., 2022; Shen et al., 2017). This not only provides novel insights into the multi-dimensional regulatory mechanisms underlying OSCC progression but also lays a foundation for identifying potential prognostic biomarkers and therapeutic targets for OSCC.
While the OSCC pathogenesis also involves complex host-microenvironment interactions, and clinical challenges of advanced OSCC further highlight the need to expand lncRNA-related mechanism exploration to broader pathological and clinical contexts. Furthermore, previous studies have shown that the ecological imbalance of the oral microbiome caused by risk factors such as tobacco use, alcohol consumption, betel nut chewing, and HPV infections can lead to abnormal expression of lncRNAs in the oral cavity, which are associated with inflammatory mechanisms facilitating OSCC progression (Crispino et al., 2024; Mishra et al., 2025). More importantly, since OSCC patients were usually diagnosed at an advanced stage and are at risk of bone metastasis, which indicate a poor outcome (Wang et al., 2024). Nevertheless, there has been limited information on bone metastasis in OSCC (Wang et al., 2024). According to previous research results, inhibition of disulfidptosis can prevent osteoclast overactivation and, consequently, reduce the risk of bone metastasis in patients (Clézardin et al., 2021). This indicates that targeting disulfidptosis-related lncRNAs is expected to regulate the balance of intracellular disulfidptosis bond metabolism and the activity of osteoclasts at the molecular level, thereby blocking the colonization and invasion of tumor cells into bone tissue. This reminds us that by targeting the disulfidptosis-related lncRNAs screened in this study, we can not only inhibit the progression of the primary lesion of OSCC but also reduce the risk of bone metastasis, providing a new therapeutic target for improving the quality of life of patients with advanced OSCC.
At present, incorporating prognostic models into routine clinical practice can facilitate the estimation and quantification of patient prognosis (Hoesseini et al., 2022). The AUCs of prognostic genes for the OSCC by Li et al. at 1-year was 0.683 (Li et al., 2024) and Tang et al. was 0.752 (Tang et al., 2023), while our study result was 0.754. The nomogram represents a key medical advancement, addressing personalized healthcare needs by enabling clinicians to evaluate individual risk factors and prognosis for informed, tailored decisions (Balachandran et al., 2015), the slope of the calibration curve in this study was approximately equal to 1. This study validates the prognostic model and nomogram for accurately predicting OSCC outcomes. With high precision, these tools enhance risk stratification and evidence-based treatment decisions, improving patient management and personalized care.
Accumulating evidence from prior investigations has firmly established the indispensable role of immune cell infiltration in shaping the therapeutic response and clinical outcomes of patients with OSCC. In the present study, mast cells, activated NK cells, and Tregs emerged as key immune cell populations with significant implications for OSCC immunobiology and prognosis. This observation aligns with established literature demonstrating that tumor-infiltrating mast cells can modulate Treg activity to facilitate tumor progression, thereby undermining the host’s antitumor immune response (Lv et al., 2024). Consistently, elevated densities of activated NK cells and Tregs within the tumor microenvironment have been repeatedly associated with adverse clinical outcomes in OSCC patients (Lv et al., 2024; Wu et al., 2020). Our findings also corroborate previous reports indicating that a high TMB in OSCC patients portends a poorer prognosis and serves as a valuable biomarker for guiding treatment decisions in recurrent and metastatic disease (Lv et al., 2024). Notably, differential expression analysis revealed significantly higher levels of MYCBP2, TGFBR2, PLEC, and NSB1 in the high-risk cohort, suggesting potential roles for these genes in tumorigenesis and disease progression. In thyroid cancer (TC), MYC binding protein 2 (MYCBP2) has been linked to inflammatory cell infiltration and patient survival (Wang et al., 2022). TGFBR2, a central transducer of TGF-β - mediated growth inhibitory signals, has been implicated in the pathogenesis of multiple malignancies (Huang et al., 2014). PLEC has been identified as a promising biomarker and therapeutic target in pancreatic adenocarcinoma (PAAD) (Ge et al., 2024), while amplification of NSB1 has been shown to drive the pathobiology of uveal melanoma (UM) (Banimohammad et al., 2025). Collectively, these findings prompt the hypothesis that disulfidptosis may represent a critical mechanism underlying immune resistance and tumor immune escape in OSCC, offering novel insights into the complex interplay between cell death pathways and tumor immunobiology.
In recent years, cancer bioinformatics has emerged as a transformative force, driving advancements in anticancer drug development and personalized therapeutics while substantially enhancing the accuracy of cancer therapeutic prediction (Lu et al., 2017). Treatment resistance, a common occurrence in OSCC, substantially diminishes patient survival rates and profoundly impacts clinical treatment decisions (Cheng et al., 2021). Consequently, a comprehensive assessment of drug sensitivity in OSCC patients is imperative. In the present study, five drugs, including BMS-754807_2171, AZD8055_1059, Epirubicin_1511, Mitoxantrone_1810, and Foretinib_2040, were identified as upregulated in the high-risk group. These findings may help elucidate the mechanisms underlying the poor prognosis observed in this subgroup. Previous research has shown that BMS-754807 potentiates the efficacy of chemotherapeutic agents in lung cancer cells by inducing autophagy, cell cycle arrest, and growth inhibition, ultimately leading to synergistic cytotoxicity (Zhang and Zhou, 2025). Similarly, Yin et al. (2024) reported consistent IC50 expression of BMS-754807 in gastric adenocarcinoma (STAD) in their study on lactylation-related gene sets and mitochondrial functions in STAD (Yin et al., 2024). AZD8055 is a potent, selective, and orally bioavailable ATP-competitive mammalian target of rapamycin kinase inhibitor with in vitro and in vivo antitumor activity (Chresta et al., 2010), AZD8055_1059 had been verified as a drug treatment target in non-small cell lung cancer (Shi et al., 2025). While, the Epirubicin was already used in clinical research for non-small cell lung cancer as early as 1997 by Colucci et al. (1997). Furthermore, Foretinib, a multikinase inhibitor, has been clinically employed in the treatment of breast carcinoma (BC) (Anitha et al., 2023) and Mitoxantrone_1810 had also been proven to have a higher expression level in the high-risk group of HNSCC (Zhu et al., 2022). Collectively, the results of this study provide a theoretical foundation for the development of personalized treatment strategies for OSCC patients.
6 Conclusion
In the current investigation, transcriptomic data integrated with advanced bioinformatics methodologies were utilized to systematically identify 9DE-DRGs, namely, AC009226.1, AP001107.9, AC108463.3, SAP30L_AS1, AC007406.3, PTPRN2_AS1, AP003559.1, JMJD1C_AS1, and AC079160.1, as differentially expressed in OSCC. A prognostic model and nomogram showed strong predictive value for patient outcomes, aiding clinical risk stratification. Immune microenvironment analysis revealed interactions between cell death pathways and tumor immunobiology. Drug prediction identified BMS-754807_2171 and Foretinib_2040 as potential therapies. Limitations include data quality, algorithm assumptions, and reliance on RT-qPCR validation, necessitating independent clinical validation across cohorts to confirm biomarkers utility in OSCC management.
Data availability statement
All datasets used in this study are publicly available on the UCSC Xena platform in cohort: GDC TCGA Head and Neck Cancer (HNSC), available at: https://xenabrowser.net/datapages/.
Ethics statement
The studies involving humans were approved by Shengjing Hospital of China Medical University. The studies were conducted in accordance with the local legislation and institutional requirements. The participants provided their written informed consent to participate in this study. The manuscript presents research on animals that do not require ethical approval for their study.
Author contributions
XM: Data curation, Writing – original draft. LC: Conceptualization, Writing – original draft. YL: Software, Writing – original draft. SW: Writing – original draft, Methodology. WL: Validation, Writing – original draft. GZ: Writing – original draft, Formal Analysis. SG: Writing – original draft, Project administration. FQ: Writing – original draft, Software. TW: Resources, Writing – original draft. YX: Visualization, Writing – original draft. YB: Writing – original draft, Visualization. HZ: Writing – review and editing, Investigation, Project administration. LF: Writing – review and editing, Formal Analysis, Funding acquisition.
Funding
The author(s) declare that financial support was received for the research and/or publication of this article. This work was supported by the Postdoctoral Research Start-up Fund (Grant number is 360421).
Acknowledgments
AcknowledgementsWe would like to express our sincere gratitude to all individuals and organizations who supported and assisted us throughout this research.
Conflict of interest
Authors LC, SW, YB, and HZ were employed by Department of Research and Development, Shenzhen Nucleus Gene Technology Co., Ltd.
The remaining authors declare that the research was conducted in the absence of any commercial or financial relationships that could be construed as a potential conflict of interest.
Generative AI statement
The author(s) declare that no Generative AI was used in the creation of this manuscript.
Any alternative text (alt text) provided alongside figures in this article has been generated by Frontiers with the support of artificial intelligence and reasonable efforts have been made to ensure accuracy, including review by the authors wherever possible. If you identify any issues, please contact us.
Publisher’s note
All claims expressed in this article are solely those of the authors and do not necessarily represent those of their affiliated organizations, or those of the publisher, the editors and the reviewers. Any product that may be evaluated in this article, or claim that may be made by its manufacturer, is not guaranteed or endorsed by the publisher.
Supplementary material
The Supplementary Material for this article can be found online at: https://www.frontiersin.org/articles/10.3389/fgene.2025.1650544/full#supplementary-material
Abbreviations
OSCC, Oral squamous cell carcinoma; lncRNAs, long non-coding RNAs; DRLs, disulfidptosis-related lncRNAs; DRGs, disulfidptosis-related genes; DE-DRLs, differentially expressed DRLs; RT-qPCR, reverse transcription-quantitative polymerase chain reaction; CI, confidence intervals; NK, natural killer; OS, overall survival; TMB, tumor mutational burden; TCGA, the Cancer Genome Atlas; ROC, receiver operating characteristic; AUC, area under curve; IC50, half maximal inhibitory concentration; LUAD, lung adenocarcinoma; ccRCC, clear cell renal cell carcinoma; GC, gastric cancer; PCa, prostate cancer; HNSCC, head and neck squamous cell carcinoma; TC, thyroid cancer; MYCBP2, MYC binding protein 2; PAAD, pancreatic adenocarcinoma; UM, uveal melanoma; STAD, gastric adenocarcinoma; BC, breast carcinoma.
References
Ahmad, M., Weiswald, L. B., Poulain, L., Denoyelle, C., and Meryet-Figuiere, M. (2023). Involvement of lncRNAs in cancer cells migration, invasion and metastasis: Cytoskeleton and ECM crosstalk. J. Exp. Clin. Cancer Res. 42, 173. doi:10.1186/s13046-023-02741-x
Ahmadpour Youshanlui, M., Yari, A., Bahojb Mahdavi, S. Z., Amini, M., Baradaran, B., Ahangar, R., et al. (2024). BRD4 expression and its regulatory interaction with miR-26a-3p, DLG5-AS1, and JMJD1C-AS1 lncRNAs in gastric cancer progression. Discov. Oncol. 15, 356. doi:10.1007/s12672-024-01230-7
Anitha, K., Dua, K., Chellappan, D. K., Gupta, G., Singh, S. K., Lakshmi, S. M., et al. (2023). HGF/c-MET: a potential target for the treatment of various cancers. Curr. Enzyme Inhib. 19, 71–80. doi:10.2174/1573408019666230227101036
Balachandran, V. P., Gonen, M., Smith, J. J., and DeMatteo, R. P. (2015). Nomograms in oncology: more than meets the eye. Lancet Oncol. 16, e173–e180. doi:10.1016/s1470-2045(14)71116-7
Banimohammad, M., Khalafi, P., Gholamin, D., Bangaleh, Z., Akhtar, N., Solomon, A. D., et al. (2025). Exploring recent advances in signaling pathways and hallmarks of uveal melanoma: a comprehensive review. Explor Target Antitumor Ther. 6, 1002306. doi:10.37349/etat.2025.1002306
Chai, A. W. Y., Lim, K. P., and Cheong, S. C. (2020). Translational genomics and recent advances in oral squamous cell carcinoma. Semin. Cancer Biol. 61, 71–83. doi:10.1016/j.semcancer.2019.09.011
Cheng, Y., Li, S., Gao, L., Zhi, K., and Ren, W. (2021). The molecular basis and therapeutic aspects of Cisplatin resistance in oral squamous cell carcinoma. Front. Oncol. 11, 761379. doi:10.3389/fonc.2021.761379
Chresta, C. M., Davies, B. R., Hickson, I., Harding, T., Cosulich, S., Critchlow, S. E., et al. (2010). AZD8055 is a potent, selective, and orally bioavailable ATP-competitive mammalian target of rapamycin kinase inhibitor with in vitro and in vivo antitumor activity. Cancer Res. 70, 288–298. doi:10.1158/0008-5472.Can-09-1751
Clézardin, P., Coleman, R., Puppo, M., Ottewell, P., Bonnelye, E., Paycha, F., et al. (2021). Bone metastasis: mechanisms, therapies, and biomarkers. Physiol. Rev. 101, 797–855. doi:10.1152/physrev.00012.2019
Colucci, G., Gebbia, V., Galetta, D., Riccardi, F., Cariello, S., and Gebbia, N. (1997). Cisplatin and vinorelbine followed by ifosfamide plus epirubicin vs the opposite sequence in advanced unresectable stage III and metastatic stage IV non-small-cell lung cancer: a prospective randomized study of the Southern Italy oncology Group (GOIM). Br. J. cancer 76, 1509–1517. doi:10.1038/bjc.1997.586
Crispino, A., Varricchio, S., Esposito, A., Marfella, A., Cerbone, D., Perna, A., et al. (2024). The oral microbiome and its role in oral squamous cell carcinoma: a systematic review of microbial alterations and potential biomarkers. Pathologica 116, 338–357. doi:10.32074/1591-951x-n867
Cutilli, T., Leocata, P., Dolo, V., and Altobelli, E. (2016). p53 as a prognostic marker associated with the risk of mortality for oral squamous cell carcinoma. Oncol. Lett. 12, 1046–1050. doi:10.3892/ol.2016.4742
Dong, X., Liao, P., Liu, X., Yang, Z., Wang, Y., Zhong, W., et al. (2023). Construction and validation of a reliable disulfidptosis-related LncRNAs signature of the subtype, prognostic, and immune landscape in Colon cancer. Int. J. Mol. Sci. 24, 12915. doi:10.3390/ijms241612915
Friedman, J., Hastie, T., Tibshirani, R., Narasimhan, B., Tay, K., Simon, N., et al. (2021). Package ‘glmnet’, 595. New York, NY: Springer Nature respectively.
Ge, J., Ge, J., Tang, G., Xiong, D., Zhu, D., Ding, X., et al. (2024). Machine learning-based identification of biomarkers and drugs in immunologically cold and hot pancreatic adenocarcinomas. J. Transl. Med. 22, 775. doi:10.1186/s12967-024-05590-0
Gong, H., Liu, Z., Yuan, C., Luo, Y., Chen, Y., Zhang, J., et al. (2024). Identification of cuproptosis-related lncRNAs with the significance in prognosis and immunotherapy of oral squamous cell carcinoma. Comput. Biol. Med. 171, 108198. doi:10.1016/j.compbiomed.2024.108198
Guo, Z., Liang, E., Zhang, T., Xu, M., Jiang, X., and Zhi, F. (2021). Identification and validation of a potent Multi-lncRNA molecular model for predicting gastric cancer prognosis. Front. Genet. 12, 607748. doi:10.3389/fgene.2021.607748
Harrell, Jr F. E., Harrell, Jr M. F. E., and Hmisc, D. (2017). Package ‘rms’, 229. Vienna, Austria: R Foundation for Statistical Computing, 7.
Hoesseini, A., van Leeuwen, N., Sewnaik, A., Steyerberg, E. W., Baatenburg de Jong, R. J., Lingsma, H. F., et al. (2022). Key aspects of prognostic model development and interpretation from a clinical perspective. JAMA Otolaryngol. Head. Neck Surg. 148, 180–186. doi:10.1001/jamaoto.2021.3505
Huang, Y. S., Zhong, Y., Yu, L., and Wang, L. (2014). Association between the TGFBR2 G-875A polymorphism and cancer risk: evidence from a meta-analysis. Asian Pac J. Cancer Prev. 15, 8705–8708. doi:10.7314/apjcp.2014.15.20.8705
Huang, K., Shi, Y., and Chen, G. (2021). Identification of a lncRNA-Related competing endogenous RNA network in recurrent implantation failure.
Huang, W., Li, H., Yu, Q., Xiao, W., and Wang, D. O. (2022). LncRNA-mediated DNA methylation: an emerging mechanism in cancer and beyond. J. Exp. & Clin. Cancer Res. 41, 100. doi:10.1186/s13046-022-02319-z
Huang, W., Jiang, M., Lin, Y., Qi, Y., and Li, B. (2024). Crosstalk between cancer cells and macrophages promotes OSCC cell migration and invasion through a CXCL1/EGF positive feedback loop. Discov. Oncol. 15, 145. doi:10.1007/s12672-024-00972-8
Jagadeesan, D., Sathasivam, K. V., Fuloria, N. K., Balakrishnan, V., Khor, G. H., Ravichandran, M., et al. (2024). Comprehensive insights into oral squamous cell carcinoma: diagnosis, pathogenesis, and therapeutic advances. Pathology - Res. Pract. 261, 155489. doi:10.1016/j.prp.2024.155489
Kitajima, H., Maruyama, R., Niinuma, T., Yamamoto, E., Takasawa, A., Takasawa, K., et al. (2023). TM4SF1-AS1 inhibits apoptosis by promoting stress granule formation in cancer cells. Cell Death & Dis. 14, 424. doi:10.1038/s41419-023-05953-3
Kundu, S., Aulchenko, Y. S., Janssens, A. C. J., Kundu, M. S., and GenABEL, S. (2020). Package ‘PredictABEL’.
Li, J., Li, C., Li, X., Chen, Y., Li, Z., Lin, Y., et al. (2024). Establishment and assessment of an oral squamous cell carcinoma N7-methylguanosine methyltransferase associated microRNA prognostic model. J. Cancer 15, 6022–6037. doi:10.7150/jca.98350
Liu, X., Nie, L., Zhang, Y., Yan, Y., Wang, C., Colic, M., et al. (2023). Actin cytoskeleton vulnerability to disulfide stress mediates disulfidptosis. Nat. Cell Biol. 25, 404–414. doi:10.1038/s41556-023-01091-2
Livak, K. J., and Schmittgen, T. D. (2001). Analysis of relative gene expression data using real-time quantitative PCR and the 2(-Delta Delta C(T)) method. Methods 25, 402–408. doi:10.1006/meth.2001.1262
Lu, D. Y., Qu, R. X., Lu, T. R., and Wu, H. Y. (2017). Cancer bioinformatics for updating anticancer drug developments and personalized therapeutics. Rev. Recent Clin. Trials 12, 101–110. doi:10.2174/1574887112666170209161444
Lv, Y., Tian, W., Teng, Y., Wang, P., Zhao, Y., Li, Z., et al. (2024). Tumor-infiltrating mast cells stimulate ICOS(+) regulatory T cells through an IL-33 and IL-2 axis to promote gastric cancer progression. J. Adv. Res. 57, 149–162. doi:10.1016/j.jare.2023.04.013
Mallardo, D., Fordellone, M., White, A., Vowinckel, J., Bailey, M., Sparano, F., et al. (2024). A combined proteomic and transcriptomic signature is predictive of response to Anti-PD-1 treatment: a retrospective study in metastatic melanoma patients. Int. J. Mol. Sci. 25, 9345. doi:10.3390/ijms25179345
Meng, Y., Cui, Y., Zhang, W., Fu, S., Huang, L., Dong, H., et al. (2019). Integrative analysis of genome and expression profile data reveals the genetic mechanism of the diabetic pathogenesis in goto kakizaki (GK) rats. Front. Genet. 9, 724. doi:10.3389/fgene.2018.00724
Mishra, M. K., Gupta, S., Rani, P., Javeed, I., Jasrotia, S., and Sehgal, S. (2025). Construing the role of risk factor-induced oral microbiome dysbiosis in manipulation of lncRNA involved in oral cancer. Indian J. Otolaryngology Head & Neck Surg. 77, 3884–3896. doi:10.1007/s12070-025-05780-2
Newman, A. M., Liu, C. L., Green, M. R., Gentles, A. J., Feng, W., Xu, Y., et al. (2015). Robust enumeration of cell subsets from tissue expression profiles. Nat. Methods 12, 453–457. doi:10.1038/nmeth.3337
Nokovitch, L., Maquet, C., Crampon, F., Taihi, I., Roussel, L.-M., Obongo, R., et al. (2023). Oral cavity squamous cell carcinoma risk factors: state of the art. J. Clin. Med. 12, 3264. doi:10.3390/jcm12093264
Pekarek, L., Garrido-Gil, M. J., Sánchez-Cendra, A., Cassinello, J., Pekarek, T., Fraile-Martinez, O., et al. (2023). Emerging histological and serological biomarkers in oral squamous cell carcinoma: applications in diagnosis, prognosis evaluation and personalized therapeutics. Oncol. Rep. 50, 213. doi:10.3892/or.2023.8650
Qin, X., Zhu, W., Lu, A., Wang, G., Ye, X., and Weng, G. (2019). Long non-coding RNA SAP30L-AS1 promotes prostate cancer growth through repressing SAP30L. Gene 690, 120–128. doi:10.1016/j.gene.2018.12.047
Qiu, L., Tao, A., Liu, F., Ge, X., and Li, C. (2022). Potential prognostic value of a eight ferroptosis-related lncRNAs model and the correlative immune activity in oral squamous cell carcinoma. BMC Genom Data 23, 80. doi:10.1186/s12863-022-01097-z
Shen, S., Wang, G., Shi, Q., Zhang, R., Zhao, Y., Wei, Y., et al. (2017). Seven-CpG-based prognostic signature coupled with gene expression predicts survival of oral squamous cell carcinoma. Clin. Epigenetics 9, 88. doi:10.1186/s13148-017-0392-9
Shen, X., Liu, Y., Zhang, J., Zhou, T., Zhang, Q., Dong, K., et al. (2025). Predictive significance of glycosyltransferase-related lncRNAs in endometrial cancer: a comprehensive analysis and experimental validation. ACS omega 10, 8023–8041. doi:10.1021/acsomega.4c09071
Shi, L., Qiu, F., Shi, C., Zhang, G., and Yu, F. (2025). Integrative bulk RNA analysis unveils immune evasion mechanisms and predictive biomarkers of osimertinib resistance in non-small cell lung cancer. Discov. Oncol. 16, 1541. doi:10.1007/s12672-025-02529-9
Shrihari, S., May, H. C., Yu, J.-J., Papp, S. B., Chambers, J. P., Guentzel, M. N., et al. (2022). Thioredoxin-mediated alteration of protein content and cytotoxicity of Acinetobacter baumannii outer membrane vesicles. Exp. Biol. Med. 247, 282–288. doi:10.1177/15353702211052952
Sun, X., Song, J., Lu, C., Sun, X., Yue, H., Bao, H., et al. (2023). Characterization of cuproptosis-related lncRNA landscape for predicting the prognosis and aiding immunotherapy in lung adenocarcinoma patients. Am. J. Cancer Res. 13, 778–801.
Tang, J., Fang, X., Chen, J., Zhang, H., and Tang, Z. (2021). Long non-coding RNA (lncRNA) in oral squamous cell carcinoma: biological function and clinical application. Cancers 13, 5944. doi:10.3390/cancers13235944
Tang, J., Wu, X., Cheng, B., and Lu, Y. (2023). Identification of a polyamine-related signature and six novel prognostic biomarkers in oral squamous cell carcinoma. Front. Mol. Biosci. 10, 1073770. doi:10.3389/fmolb.2023.1073770
Wang, W., Adeoye, J., Thomson, P., and Choi, S. W. (2021a). Statistical profiling of oral cancer and the prediction of outcome. J. Oral Pathol. Med. 50, 39–46. doi:10.1111/jop.13110
Wang, Y., Jiang, Y., Wei, D., Singh, P., Yu, Y., Lee, T., et al. (2021b). Nanoparticle-mediated convection-enhanced delivery of a DNA intercalator to gliomas circumvents temozolomide resistance. Nat. Biomed. Eng. 5, 1048–1058. doi:10.1038/s41551-021-00728-7
Wang, G., Miao, C., Mo, L., Kahlert, U. D., Wu, J., Ou, M., et al. (2022). MYCBP2 expression correlated with inflammatory cell infiltration and prognosis immunotherapy in thyroid cancer patients. Front. Immunol. 13, 1048503. doi:10.3389/fimmu.2022.1048503
Wang, J. Q., Zhong, X. Q., Deng, R. X., Zhang, Y. Q., and Lu, M. M. (2024). Bone metastases in oral squamous cell carcinoma: a real-world retrospective study based on the SEER database. J. Stomatol. Oral Maxillofac. Surg. 125, 101851. doi:10.1016/j.jormas.2024.101851
Wu, Z., Chen, H., Luo, W., Zhang, H., Li, G., Zeng, F., et al. (2020). The landscape of immune cells infiltrating in prostate cancer. Front. Oncol. 10, 517637. doi:10.3389/fonc.2020.517637
Wu, T., Jiao, Z., Li, Y., Su, X., Yao, F., Peng, J., et al. (2022). HPRT1 promotes chemoresistance in oral squamous cell carcinoma via activating MMP1/PI3K/Akt signaling pathway. Cancers 14, 855. doi:10.3390/cancers14040855
Xin, Y., Zhang, J., Jiang, Q., and Qiu, J. (2022). Construction of prognostic signature of patients with oral squamous cell carcinoma based on pyroptosis-related long non-coding RNAs. Front. Surg. 9, 935765. doi:10.3389/fsurg.2022.935765
Xiong, Y., Kong, X., Fang, K., Sun, G., Tu, S., Wei, Y., et al. (2023). Establishment of a novel signature to predict prognosis and immune characteristics of pancreatic cancer based on necroptosis-related long non-coding RNA. Mol. Biol. Rep. 50, 7405–7419. doi:10.1007/s11033-023-08663-3
Yang, L., Yu, J., Tao, L., Huang, H., Gao, Y., Yao, J., et al. (2022). Cuproptosis-related lncRNAs are biomarkers of prognosis and immune microenvironment in head and neck squamous cell carcinoma. Front. Genet. 13, 947551. doi:10.3389/fgene.2022.947551
Yang, F., Niu, X., Zhou, M., and Li, W. (2024). Development and validation of a novel disulfidptosis-related lncRNAs signature in patients with HPV-negative oral squamous cell carcinoma. Sci. Rep. 14, 14436. doi:10.1038/s41598-024-65194-y
Yin, X., Xing, W., Yi, N., Zhou, Y., Chen, Y., Jiang, Z., et al. (2024). Comprehensive analysis of lactylation-related gene sets and mitochondrial functions in gastric adenocarcinoma: implications for prognosis and therapeutic strategies. Front. Immunol. 15, 1451725. doi:10.3389/fimmu.2024.1451725
Yoshihara, K., Kim, H., and Verhaak, R. (2016). Estimate: estimate of stromal and immune cells in malignant tumor tissues from expression data. R. package version 1.0. 13/r21.
Zhang, T., and Zhou, H. (2025). Machine learning and weighted gene coexpression network-based identification of biomarkers predicting immune profiling and drug resistance in lung adenocarcinoma. Int. J. Genomics 2025, 9923294. doi:10.1155/ijog/9923294
Zhang, J., Li, X., Zhao, Z., Cai, W., and Fang, J. (2023a). Thioredoxin signaling pathways in cancer. Antioxid. Redox Signal 38, 403–424. doi:10.1089/ars.2022.0074
Zhang, L., Li, Y., Cai, B., Chen, J., Zhao, K., Li, M., et al. (2023b). A notch signaling-related lncRNA signature for predicting prognosis and therapeutic response in clear cell renal cell carcinoma. Sci. Rep. 13, 21141. doi:10.1038/s41598-023-48596-2
Keywords: oral squamous cell carcinoma, disulfidptosis, machine learning, drug, lncRNA, immune
Citation: Meng X, Cao L, Liu Y, Wang S, Liu W, Zhang G, Guo S, Qi F, Wang T, Xia Y, Ba Y, Zhang H and Fang L (2025) Unveiling disulfidptosis-linked lncRNA signatures: insights into the immune microenvironment and drug responsiveness in oral squamous cell carcinoma. Front. Genet. 16:1650544. doi: 10.3389/fgene.2025.1650544
Received: 20 June 2025; Accepted: 27 October 2025;
Published: 10 November 2025.
Edited by:
Domenico Mallardo, G. Pascale National Cancer Institute Foundation (IRCCS), ItalyReviewed by:
Mario Fordellone, Università degli Studi della Campania Luigi Vanvitelli, ItalyMaria Ingenito, G. Pascale National Cancer Institute Foundation (IRCCS), Italy
Copyright © 2025 Meng, Cao, Liu, Wang, Liu, Zhang, Guo, Qi, Wang, Xia, Ba, Zhang and Fang. This is an open-access article distributed under the terms of the Creative Commons Attribution License (CC BY). The use, distribution or reproduction in other forums is permitted, provided the original author(s) and the copyright owner(s) are credited and that the original publication in this journal is cited, in accordance with accepted academic practice. No use, distribution or reproduction is permitted which does not comply with these terms.
*Correspondence: Lijun Fang, ZmFuZ2xqQHNqLWhvc3BpdGFsLm9yZw==; Hezi Zhang, aGV6aXpoYW5nMjAyMEAxNjMuY29t
†These authors have contributed equally to this work