 Meng Ma1
 Chao Deng
 Yan Zhang
- 1College of Information Engineering, Hunan Open University, Changsha, China
- 2School of Computer Science and Engineering, Central South University, Changsha, China
- 3School of Computer Science and Engineering, Hunan University of Information Technology, Changsha, China
Identifying the complex genetic architecture of Alzheimer’s disease (AD) is critical for understanding its pathophysiology. While network-based computational methods assist in this task, they primarily model simple pairwise gene interactions and fail to capture the higher-order associations of genes that drive complex diseases. To address this limitation, we introduce HyperAD, a novel hypergraph neural network framework designed to predict AD risk genes by explicitly modeling these higher-order associations of genes. HyperAD constructs a hypergraph in which functional gene sets from databases such as MSigDB form hyperedges, and uses a two-stage hypergraph message passing neural network to extract high-order association information from the hypergraph. Comprehensive evaluations demonstrate that HyperAD significantly outperforms state-of-the-art methods. We validate the prediction results of HyperAD through multiple lines of evidence. HyperAD-predicted genes are enriched in AD-related biological processes and have significant associations with known related genes in terms of sequence similarity, protein interaction, and miRNA. In addition, their protein expression levels are significantly altered in the brains of AD patients, and they contain both known risk sites and new, high-confidence candidate genes. HyperAD provides a more accurate and biologically insightful tool for prioritizing genes and unraveling the complex genetic landscape of AD.
1 Introduction
Alzheimer’s disease (AD) is a progressive and devastating neurodegenerative disorder that represents the most common cause of dementia worldwide. As global populations age, the societal and economic burden of AD is escalating, making the search for effective therapeutic strategies a global health priority. The disease has a strong genetic component, with heritability estimates ranging from 60% to 80% (Bellenguez et al., 2022). While the discovery of rare, highly penetrant mutations in genes such as APP, PSEN1, and PSEN2 confirmed the role of genetics in early-onset familial AD, the genetic architecture of the more common late-onset AD (LOAD) is far more complex and remains incompletely understood (Spina et al., 2021). Therefore, the systematic identification and prioritization of novel AD risk genes are fundamental to unraveling the intricate pathophysiology of the disease, identifying new biological pathways for investigation, and ultimately developing targeted therapies.
Genome-wide association studies (GWAS) have been the primary engine for discovering common genetic variants associated with AD (Bellenguez et al., 2022; Dalmasso et al., 2024). To date, these efforts have successfully identified dozens of risk loci. For instance, a landmark GWAS meta-analysis by (Jansen et al., 2019) identified 29 risk loci, implicating potential pathogenic genes such as ADAMTS4 and KAT8. These findings highlighted the enrichment of risk genes in immune-related cell types, particularly microglia, and their involvement in pathways such as lipid processing and amyloid-beta precursor protein degradation. More recently, a large two-stage GWAS by (Bellenguez et al., 2022) further expanded the genetic map of AD, identifying 75 risk loci, 42 of which were novel, including those near SORT1 and ANK3. Despite these successes, GWAS have inherent limitations. The stringent p-value thresholds required to correct for multiple testing can lead to high false-negative rates, while the analysis often identifies large genomic loci containing numerous genes, making it challenging to pinpoint the true causal gene (McCarthy et al., 2008; Lee et al., 2011). Furthermore, these studies demand massive, well-phenotyped patient cohorts, which are expensive and time-consuming to assemble. Consequently, computational approaches are essential to complement GWAS findings, helping to prioritize the most promising candidates from thousands of potential genes for functional validation.
In recent years, a variety of computational methods have been developed to predict disease risk genes. The majority of these methods operate on the “guilt-by-association” principle, which posits that genes involved in the same disease are likely to be functionally related and thus exhibit proximity or strong connections within biological networks (Cowen et al., 2017; Yao et al., 2018; Valdeolivas et al., 2019; Ata et al., 2021). Methods based on protein-protein interaction (PPI) networks or functional gene networks have been applied to this problem. In the study of disease gene identification, network-based machine learning approaches have proven effective. For instance (Yao et al., 2018), developed a Bayesian framework to construct tissue-specific functional gene networks by integrating multiple types of gene association data. These networks were then used as features to train machine learning models for identifying disease-associated genes. Similarly (Krishnan et al., 2016), proposed a machine learning approach that leverages a brain-specific FGN to prioritize candidate genes for autism spectrum disorder. In another approach (Tran et al., 2020), introduced DiGI, a node kernel-based method that generates gene features by integrating information from multiple heterogeneous networks, which are subsequently used by a Support Vector Machine (SVM) for prediction. More recently (Mancuso et al., 2022), developed GenePlexus, a framework that utilizes biological networks and a semi-supervised learning approach to identify novel disease-gene associations. These models typically leverage pairwise, or binary, associations between genes to propagate risk information across the network, identifying novel candidates based on their connectivity to known disease genes.
However, a significant limitation of these biological network-based approaches is their reliance on pairwise interactions. The pathophysiology of a complex polygenic disease like AD is not driven by a series of independent gene-gene interactions, but rather by the intricate and collective interplay of multiple genes within complex biological pathways and functional modules (Sims et al., 2020). By modeling only binary relationships, existing methods may fail to capture the higher-order associative patterns that characterize these multi-gene functional units (Li et al., 2022; Deng et al., 2024). This oversight means that crucial information embedded within functionally cohesive gene sets—where the coordinated action of several genes is necessary for a biological outcome—is largely ignored.
To address this critical gap, we introduce HyperAD, a novel hypergraph neural network framework for predicting AD risk genes by explicitly modeling higher-order gene relationships. We leverage the comprehensive gene set collections from the Molecular Signatures Database (MSigDB) (Liberzon et al., 2015), which curates functionally related gene groups based on diverse biological evidence, including chromosomal position, Gene Ontology (GO) annotations (Consortium, 2004), KEGG pathways (Kanehisa and Goto, 2000), and Human Phenotype Ontology (HPO) associations (Köhler et al., 2021). We structure this information using a hypergraph, a powerful data structure where a single hyperedge can connect any number of nodes (Agarwal et al., 2006; Zhou et al., 2006). This representation provides a natural and superior way to model the complex, many-to-many relationships inherent in biological systems compared to traditional graphs. To exploit this rich representation, we designed a two-stage message-passing hypergraph neural network that effectively learns and aggregates features from these complex, higher-order structures. By capturing the collective context of gene function, HyperAD is designed to more accurately prioritize novel AD risk genes and provide deeper insights into the multi-gene mechanisms underlying the disease.
To assess the effectiveness and robustness of our proposed framework, we conduct a series of comprehensive experiments. HyperAD is compared with a series of state-of-the-art AD risk gene prediction methods, and the results demonstrate its superior predictive performance. In addition to these comparative analyses, we also conducted several validation studies to confirm the biological relevance and accuracy of the HyperAD-predicted AD risk gene. Functional enrichment analyses revealed that the HyperAD-predicted AD risk genes are significantly enriched in AD-associated biological processes and share a substantial number of network connections with known AD genes, underscoring their strong functional relevance to the disease. Furthermore, we integrate proteomic expression data into our validation pipeline, which shows that the HyperAD-predicted AD risk genes correspond to proteins that are significantly differentially expressed in AD brain tissues.
2 Materials and methods
2.1 Datasets
To construct the hypergraph, we obtain gene sets from the Molecular Signatures Database (v7.4), one of the most comprehensive and widely used collections of annotated gene sets (Liberzon et al., 2015). MSigDB aggregates data from numerous sources to cover diverse biological contexts, including chromosomal location, biological function, metabolic pathways, and regulatory targets (Subramanian et al., 2005; Liberzon et al., 2011). The database organizes gene sets into nine major collections (H and C1-C8) according to their origin and type. For this study, we use several of these key collections. These included Hallmark gene sets (H), which represent well-defined biological processes, and positional gene sets (C1), which group genes by chromosomal location. We also incorporate curated gene sets (C2) from pathway databases and the literature, alongside regulatory target gene sets (C3) that comprise genes sharing predicted targets for microRNAs or transcription factors. Additional information is derived from ontology gene sets (C5), which group genes based on GO and HPO terms, and computational gene sets (C4) derived from mining cancer-oriented microarray data. Finally, we include several signature-based collections: oncogenic gene sets (C6) from cancer gene perturbation studies, immunologic gene sets (C7) from immune system perturbations, and cell type gene sets (C8) derived from cluster markers in single-cell sequencing studies. The number and description of gene sets in each category are in Table 1.
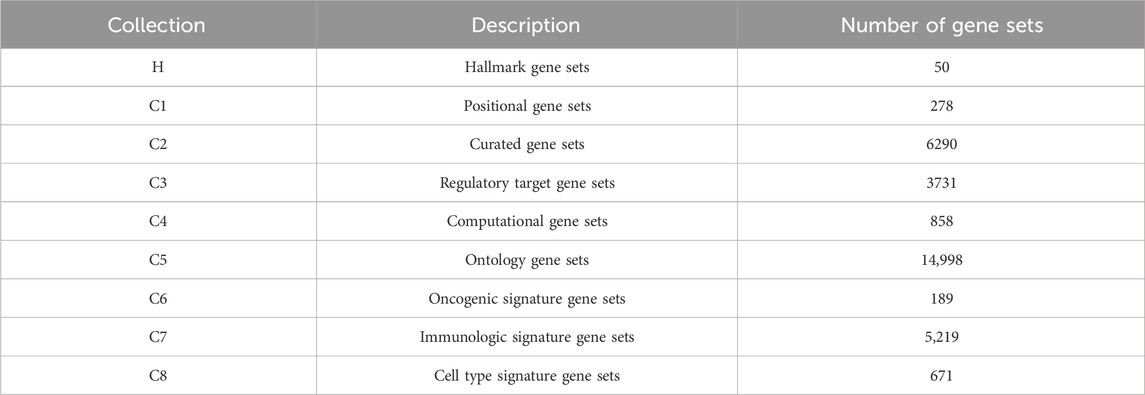
Table 1. Brief introduction of nine major collections in MSigDB.
To train our model and evaluate its performance, we establish a ground-truth dataset of genes associated with AD. The positive set is composed of 147 high-confidence AD risk genes, manually curated from several authoritative databases such as OMIM (Amberger et al., 2019), GWAS Catalog (Sollis et al., 2023), DisGeNet (Piñero et al., 2020), and AlzGene (Bertram et al., 2007). Constructing a reliable negative set—genes with no association to AD is inherently challenging. To address this, we adopt a stringent filtering strategy. First, we compile a comprehensive list of potential AD-associated genes from the databases mentioned above. We then create a negative (non-AD) gene pool by removing all these potential AD genes from the complete human genome. To mitigate class imbalance during model training, we randomly sampled 1,000 genes from this pool to form our final negative set.
2.2 Method
2.2.1 Brief introduction of hypergraph
A weighted hypergraph is defined as
For a node
For an hyperedge
And, we can define the
Kipf et al. (Kipf and Welling, 2017) propose the graph convolution network (GCN) through the local first-order approximation of the spectral graph convolution. A GCN layer is define as:
where
The Laplace matrix is crucial in the spectral method of graphs. For an graph, the Laplace matrix is defined as
Feng et al. (2019) bring the hypergraph Laplacian matrix
where
2.2.2 Framework of HyperAD
HyperAD is a novel, end-to-end deep learning framework designed to identify genes associated with AD by modeling higher-order assocation among genes (Figure 1). It uniquely frames gene prioritization as a learning task on a hypergraph, where genes are represented as nodes and diverse gene sets from the MSigDB database as hyperedges. The core of HyperAD is a novel two-stage hypergraph message-passing module that learns gene representations by explicitly modeling the flow of information from genes to pathways and back. Moreover, we propose an AD-specific weighting mechanism that dynamically focuses the model on the most relevant biological contexts during learning, leading to highly specific and robust gene embeddings for AD-associated gene prediction. Finally, the learned gene representations are used for AD gene prioritization.
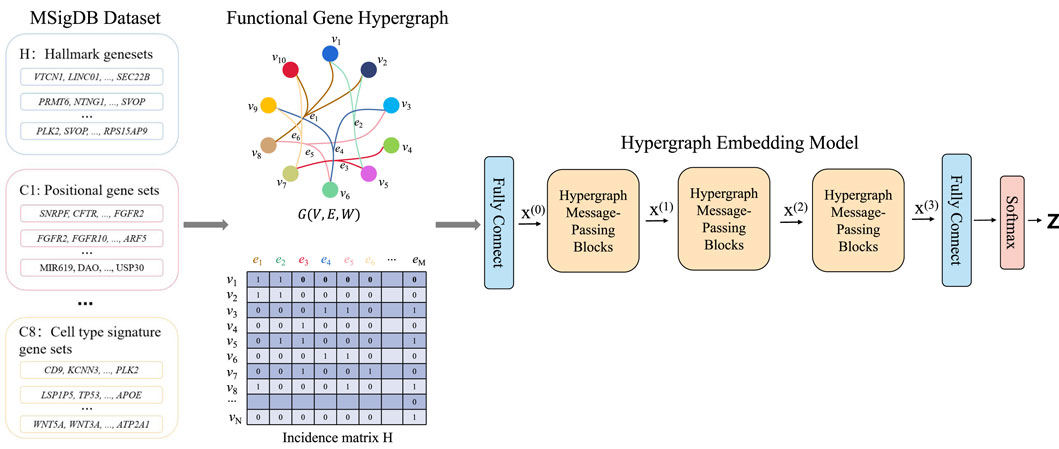
Figure 1. The HyperAD framework for AD gene prioritization. The framework begins by constructing a hypergraph from diverse gene sets collected from the MSigDB, where each gene set forms a hyperedge connecting its member genes. This hypergraph is then fed into a deep learning model composed of multiple hypergraph message-passing modules. These modules iteratively aggregate information across the hyperedges, allowing the model to learn complex associative patterns that are often missed by traditional pairwise network models. Finally, the model predicts a genome-wide AD risk score for each gene, enabling the prioritization of novel candidates.
First, we use a hypergraph to structurally represent the gene sets from the MSigDB database. This database contains gene sets from various sources, including GO terms, KEGG pathways, and HPO. Each gene set consists of genes that are associated in some way. For example, a KEGG pathway indicates that multiple genes are involved in a common signaling pathway. In bioinformatics and computational biology, graphs or network structures are commonly used to describe the relationships between proteins, genes, or other biological entities. However, for annotated gene sets, standard graph structures are not suitable because they cannot represent the higher-order relationships among multiple genes within a single gene set. To accurately describe the complex associations of genes in these sets and to fully utilize their higher-order relationships, our method, HyperAD, uses a hypergraph structure to represent and integrate different types of gene sets. We define the hypergraph constructed using gene sets as
Next, we detail the architecture of our model, HyperAD. The model first projects the initial one-hot encoded gene features
where
The resulting gene embeddings are then processed by a series of our core two-stage hypergraph message-passing blocks. Within each block, a node-centric perspective reveals how higher-order associations are learned by explicitly modeling the information flow from genes to gene sets and back. The update rules for a single node
Node-to-Hyperedge Aggregation. In this stage, each hyperedge
Where
Hyperedge-to-Node Aggregation. Subsequently, each node
where
Where
Finally, HyperAD inputs the gene feature matrix
where
3 Results
3.1 Benchmarking of HyperAD
To demonstrate the superiority of HyperAD, we conduct a comprehensive benchmark against six state-of-the-art methods for disease gene prediction: FGN, RWRM, DiGI, GCN-GENE, GSI, and GenePlexus. FGN (Yao et al., 2018) first constructs a tissue-specific functional gene network by integrating various evidence sources, such as coexpression and protein-protein interactions, within a Bayesian framework; this network is then used to train an SVM classifier. c DiGI, a node kernel-based approach, generates powerful gene features by applying a graph kernel to multiple heterogeneous networks and then integrates these features to train an SVM for prediction (Tran et al., 2020). GCN-GENE (Zhang et al., 2022) represents a deep learning approach, utilizing a Graph Convolutional Network to learn node embeddings by convolving over a biological network structure while using gene expression data as initial node features. GSI (Li et al., 2022) first constructs a gene signal matrix where each row is a gene and each column represents a biological signal derived from gene-set membership, which is then fed into a machine learning model; for our experiments, we use its high-performing Random Forest-based implementation. Lastly, GenePlexus (Mancuso et al., 2022) employs a semi-supervised learning strategy on a large-scale human gene interaction network, propagating labels from known disease genes to predict novel associations. For a fair and robust evaluation, all methods are trained and tested on identical positive and negative gene sets under a rigorous ten-repetition, five-fold cross-validation scheme. We evaluate performance using the Area Under the Receiver Operating Characteristic Curve (AUROC) and the Area Under the Precision-Recall Curve (AUPRC), reporting the mean and standard deviation across all 50 folds to ensure a reliable comparison.
As illustrated in Figure 2, HyperAD demonstrates superior performance, significantly outperforming all state-of-the-art methods for AD-associated gene prediction. Compared to approaches that rely on traditional pairwise biological networks such as FGN, DiGI, RWRM, GCN-GENE, and GenePlexus, HyperAD achieves substantial performance gains, with an increase of 7.9%–21.7% in AUROC and a remarkable 23.2%–44.7% in AUPRC. This result strongly suggests that higher-order associations captured within annotated gene sets provide a more accurate and informative representation of complex gene functions than pairwise interactions in conventional networks. Furthermore, HyperAD also significantly outperforms GSI, the most comparable baseline, improving AUROC by 2.3% and AUPRC by 9.0%. This comparison is particularly insightful because while both methods use the same raw gene-set membership information, their modeling strategies differ fundamentally. GSI treats the gene-set membership (the incidence matrix H) as a static feature matrix for a standard classifier, whereas HyperAD employs its two-stage message-passing architecture to model the hypergraph structure. This allows HyperAD to deeply explore higher-order neighborhood information and the local topology around each gene while simultaneously integrating disease-specific functional relevance through its weighted aggregation mechanism. The superior performance of HyperAD over GSI unequivocally demonstrates the power of this dynamic modeling approach. It underscores the critical importance of explicitly learning from the neighborhood context within the hypergraph. We also analyze the hyperparameter sensitivity of HyperAD (Supplementary Figure). Collectively, these results establish HyperAD as a highly effective framework and suggest that leveraging hypergraph neural networks to model higher-order biological relationships is a promising new direction for disease gene prediction.
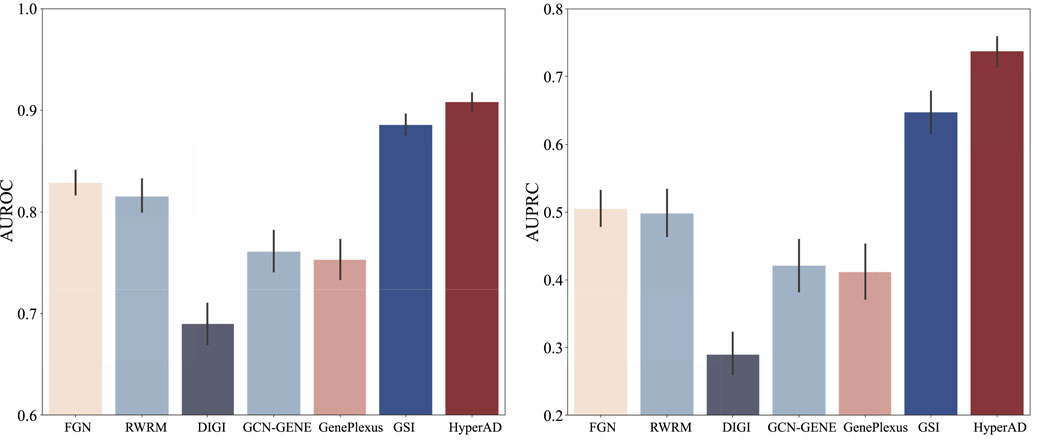
Figure 2. Benchmarking experimental results of HyperAD and six advanced AD gene prediction methods.
3.2 Ablation studies of HyperAD
To understand the relative contribution of different types of biological information to HyperAD’s predictive performance, we conduct a comprehensive ablation study. In this analysis, we train and evaluate our model separately on each of the nine individual MSigDB collections (H and C1-C8) and compare their performance against the final integrated model that utilizes all collections simultaneously. As shown in Figure 3, the results demonstrate that the integrated model achieves the highest predictive accuracy, significantly outperforming any model trained on a single data source. This finding suggests that our model’s superior performance stems from its ability to synthesize diverse and complementary biological knowledge, from curated pathways to cell-type-specific signatures.
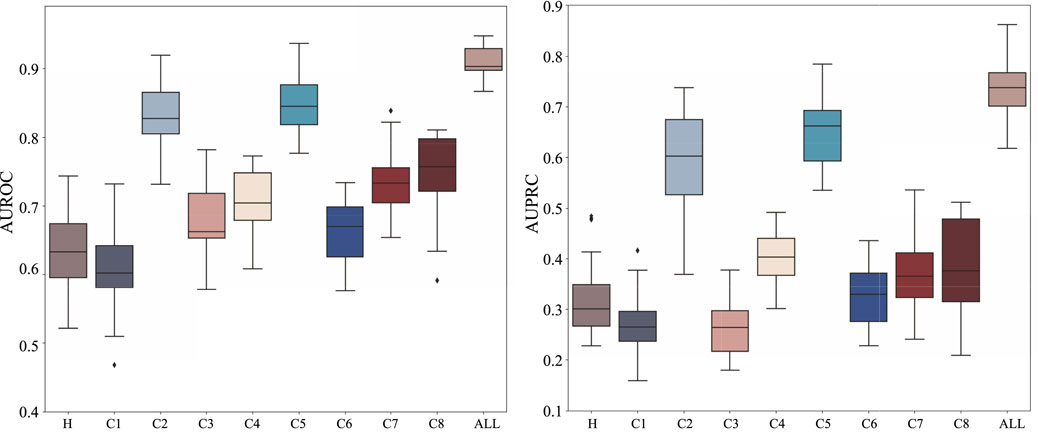
Figure 3. Ablation analysis results on the MSigDB database. We analyze and show the performance of HyperAD on different types of gene sets in the MSigDB database.
Upon closer checking of the models trained on individual collections, we find that the prediction performance is relatively better for curated (C2) and ontology (C5) gene sets. This indicates that the higher-order functional relationships derived from canonical pathway databases (C2) and formal biological ontologies like GO and HPO (C5) form the primary informational backbone for HyperAD’s ability to identify AD-associated genes. While other collections perform more modestly in isolation, their inclusion is not redundant. Instead, they act as a crucial source of Supplementary Material. For example, gene sets like positional (C1) and regulatory target (C3) likely provide essential context on genomic proximity and co-regulation that refines the core functional predictions. Therefore, we conclude that HyperAD’s strength lies in its hierarchical use of information: it leverages the rich, explicit functional knowledge in C2 and C5 as its foundation, while integrating contextual cues from the other collections to enhance its final predictions.
Furthermore, we conduct a second ablation study to specifically evaluate the contribution of our core AD-specific weighting module. In this experiment, we remove this module from the architecture, thereby treating all biological information with equal importance without disease-specific prioritization. As detailed in Table 2, the full HyperAD model demonstrates a significant performance gain compared to the ablated version, with an increase of 3.3% in AUROC and 12.3% in AUPRC. This result strongly highlights the critical role of the AD-specific weighting module in focusing the model on the most disease-relevant biological contexts, which substantially enhances its predictive accuracy.
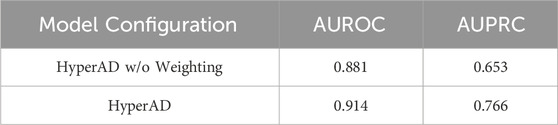
Table 2. Ablation study result of AD-specific weighting module.
3.3 HyperAD-predicted genes significantly enriched in AD-associated biological process
A key criterion for a successful disease gene prioritization model is its ability to rank genes involved in the core biological processes of the disease highly (Krishnan et al., 2016). To evaluate our model against this standard, we conduct a functional enrichment analysis. We use a set of 41 highly relevant GO biological processes (Di Paolo and Kim, 2011), which represent key AD pathways derived from enrichment analysis of known AD genes and filtered by AD risk factors and phenotypes. We then employ a decile enrichment test to systematically assess whether our ranked list of genes (after excluding known positives) is enriched for these AD-associated functions at its top tier.
The results from this analysis provide compelling evidence for our model’s biological validity. As shown in Figure 4A and detailed in Supplementary Table, we observed an overwhelming enrichment of these 41 core AD biological processes specifically within the first decile of our ranked list (i.e., the top 10% of scored genes). The significance of this finding lies not only in its statistical power but also in the nature of the enriched functions. We note that processes directly corresponding to hallmark AD pathologies were among the most significant, with exceptionally low FDR values indicating high confidence. These can be broadly categorized into two groups: those reflecting neuronal dysfunction, such as “cognition” (GO:0050890, FDR
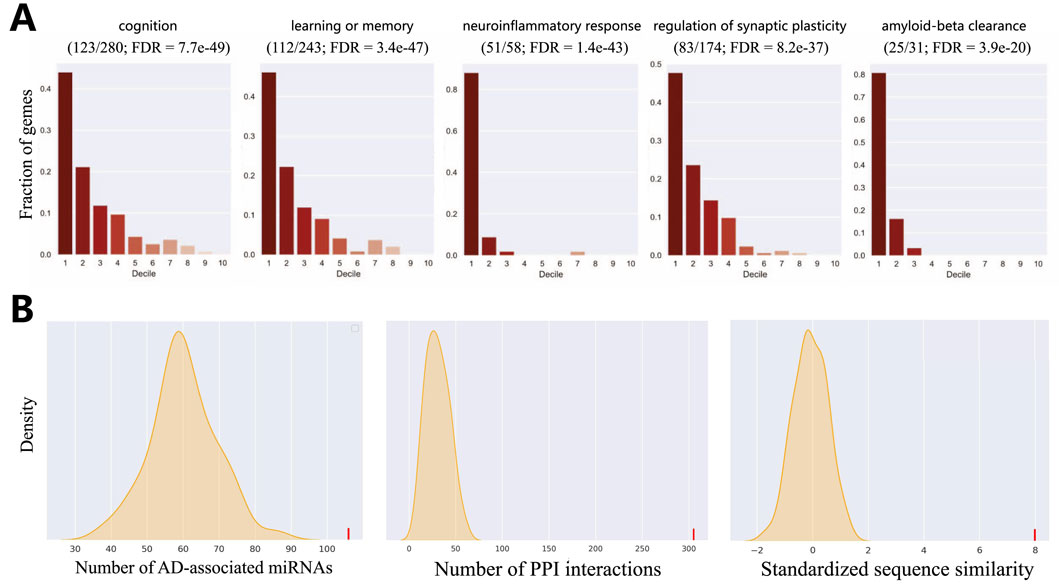
Figure 4. Evaluation of HyperAD prediction. (A) Evaluation of the overlap of AD-associated biological processes within the first decile of our predictions. Fractions of genes (y-axis) indicate the distribution of genes in the gene set in each decile of the predictions. (B) Statistical validation of our predictions using multiple biological networks.
3.4 HyperAD-predicted genes are significantly linked to known AD-associated genes
We further assess the AD-relevance of our top-ranked candidate genes using a network biology approach. We select the top 50 novel genes (after excluding known positive genes) and test whether they are significantly associated with the set of established AD genes in three distinct biological networks. These networks represent different biological dimensions: a protein sequence similarity network, the protein-protein interaction (PPI) network from the STRING database (Szklarczyk et al., 2015), and the miRNA-target interaction network from mirTarBase (Hsu et al., 2011). As shown in Figure 4B, the statistical analysis yields a highly significant result, indicating that the top 50 genes are strongly associated with known AD genes in all three networks (P-value
This highly consistent result carries significant biological implications. It suggests that our identified candidate genes have multiple functional links to known AD genes: they not only exhibit high sequence similarity, implying potential functional homology, but their protein products also tend to participate in common cellular interaction networks and pathways. Furthermore, they are likely subject to shared miRNA co-regulation at the post-transcriptional level. Therefore, this convergent evidence from diverse molecular layers strongly supports the conclusion that our predicted genes are functionally coupled with the pathobiology of AD, marking them as promising targets for future investigation.
3.5 Protein expression of HyperAD-predicted genes is associated with cognitive function
To bridge our computational predictions with real-world clinical pathology, we conduct a critical validation to assess whether the protein expression levels of our top-ranked candidate genes are directly associated with the progression of cognitive decline in AD. For this purpose, we leverage longitudinal proteomics data from the Religious Orders Study and Memory and Aging Project (ROSMAP) (Canchi et al., 2019), a deeply phenotyped and highly valuable cohort study (Synapse accession doi:10.7303/syn3219045). Based on the clinical diagnosis variable ‘dcfdx_lv’, we stratified the samples into three distinct cognitive groups: No Cognitive Impairment (NCI, n = 174), Mild Cognitive Impairment (MCI, n = 100), and AD (n = 104). Our central hypothesis is that if a gene is a key driver of AD, its encoded protein expression should exhibit a monotonic increase or decrease across the disease progression continuum from NCI to MCI to AD. To test the significance of such trends, we employ the Kendall’s Tau-b test, a non-parametric statistical method ideally suited for assessing monotonic relationships between ordinal variables.
Among our top 200 candidate genes (after excluding known positives), protein expression data are available for 67 in the ROSMAP dataset. The results are highly encouraging: of these 67 genes, we identify that a substantial proportion—27 genes (40.3%)—exhibit protein expression levels that are significantly and monotonically correlated with the severity of cognitive decline (Kendall’s Tau-b test, FDR
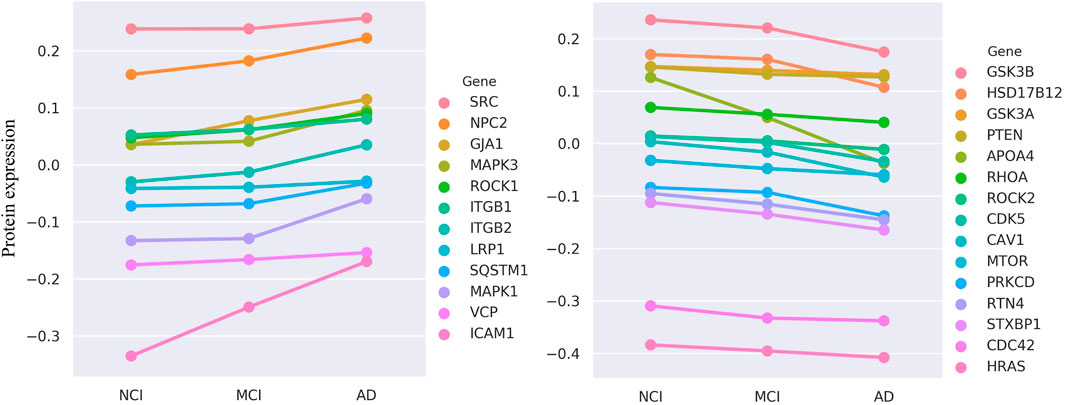
Figure 5. The evaluation results of ROSMAP data. Protein expression of 27 genes is monotonically increasing (n
Deeper case studies further illuminate the biological significance of our model’s predictions. For instance, we find that the protein expression of CDK5 and GSK3B, two kinases known to play pivotal roles in AD, is significantly and negatively correlated with cognitive function. This aligns perfectly with their established biological roles, as the aberrant activation of these kinases is a central event driving the hyperphosphorylation of the microtubule-associated protein Tau (MAPT), leading to neurofibrillary tangles (Jayapalan and Natarajan, 2013). The ability of our model to independently identify these key regulators and confirm that their expression trend matches disease progression significantly bolsters its credibility. Furthermore, a particularly compelling finding involves APOA4. We not only find its expression to be negatively correlated with cognitive function but also note its colocalization on chromosome 11 with APOA1 and APOC3, which also appeared in our top-200 list. The decreased expression of this APOA1-APOC3-APOA4 gene cluster is known to be associated with AD risk (Lin et al., 2015). This result powerfully suggests that our HyperAD model can effectively utilize higher-order association information among multiple genes to identify functionally synergistic modules, a feat that is often beyond the reach of traditional single-gene or pairwise association methods.
4 Discussion
In this study, we introduced HyperAD, a hypergraph neural network framework designed to overcome a key limitation of existing methods for AD gene prioritization: their reliance on simple pairwise gene interactions. By explicitly modeling higher-order relationships derived from functional gene sets, HyperAD more accurately reflects the complex, multi-gene nature of AD pathophysiology. Our results demonstrate that this approach not only significantly outperforms state-of-the-art models but also derives its strength from synergistically integrating diverse biological information, with curated pathways (C2) and ontology gene sets (C5) forming its predictive core.
The biological relevance of HyperAD’s predictions is strongly supported by multiple, independent lines of validation. Our top-ranked candidate genes are significantly enriched in hallmark AD biological processes, such as synaptic regulation and amyloid-beta clearance, and are densely connected to known AD genes in biological networks. Most compellingly, by leveraging proteomics data from the ROSMAP cohort, we show a direct link between the expression levels of our predicted genes and the clinical progression of cognitive decline. This convergence of computational and clinical evidence provides high confidence in our prioritized candidates as genuine players in AD.
While HyperAD marks a significant advance, we acknowledge its limitations. The model’s performance is dependent on the quality of existing gene set databases, and like all computational models, it predicts association, not causation. Therefore, the most critical next step is the experimental validation of our novel high-confidence candidates to confirm their functional roles. Furthermore, the HyperAD framework is inherently flexible and can be readily applied to other complex diseases, offering a powerful new tool for computational genomics.
In conclusion, HyperAD provides a more powerful and biologically intuitive approach to disease gene discovery. By shifting the paradigm from pairwise relationships to higher-order functional contexts, it delivers a robust and validated list of novel AD risk genes. These findings offer promising new avenues for research, with the potential to accelerate the development of future diagnostics and targeted therapies for Alzheimer’s disease.
Data availability statement
The original contributions presented in the study are included in the article/Supplementary Material, further inquiries can be directed to the corresponding author.
Ethics statement
The manuscript presents research on animals that do not require ethical approval for their study.
Author contributions
MM: Methodology, Writing – original draft. CD: Conceptualization, Methodology, Writing – original draft, Writing – review and editing. YL: Writing – review and editing. QC: Writing – review and editing. FL: Writing – review and editing. YZ: Conceptualization, Supervision, Writing – original draft, Writing – review and editing.
Funding
The author(s) declare that no financial support was received for the research and/or publication of this article.
Conflict of interest
The authors declare that the research was conducted in the absence of any commercial or financial relationships that could be construed as a potential conflict of interest.
Generative AI statement
The author(s) declare that no Generative AI was used in the creation of this manuscript.
Any alternative text (alt text) provided alongside figures in this article has been generated by Frontiers with the support of artificial intelligence and reasonable efforts have been made to ensure accuracy, including review by the authors wherever possible. If you identify any issues, please contact us.
Publisher’s note
All claims expressed in this article are solely those of the authors and do not necessarily represent those of their affiliated organizations, or those of the publisher, the editors and the reviewers. Any product that may be evaluated in this article, or claim that may be made by its manufacturer, is not guaranteed or endorsed by the publisher.
Supplementary material
The Supplementary Material for this article can be found online at: https://www.frontiersin.org/articles/10.3389/fgene.2025.1668200/full#supplementary-material
References
Agarwal, S., Branson, K., and Belongie, S. (2006). “Higher order learning with graphs,” in Proceedings of the 23rd international conference on machine learning, 17–24.
Amberger, J. S., Bocchini, C. A., Scott, A. F., and Hamosh, A. (2019). Omim. Org: leveraging knowledge across phenotype–gene relationships. Nucleic Acids Res. 47, D1038-D1043–D1043. doi:10.1093/nar/gky1151
Ata, S. K., Wu, M., Fang, Y., Ou-Yang, L., Kwoh, C. K., and Li, X.-L. (2021). Recent advances in network-based methods for disease gene prediction. Briefings Bioinforma. 22, bbaa303. doi:10.1093/bib/bbaa303
Bellenguez, C., Küçükali, F., Jansen, I. E., Kleineidam, L., Moreno-Grau, S., Amin, N., et al. (2022). New insights into the genetic etiology of alzheimer’s disease and related dementias. Nat. Genet. 54, 412–436. doi:10.1038/s41588-022-01024-z
Bertram, L., McQueen, M. B., Mullin, K., Blacker, D., and Tanzi, R. E. (2007). Systematic meta-analyses of alzheimer disease genetic association studies: the alzgene database. Nat. Genet. 39, 17–23. doi:10.1038/ng1934
Canchi, S., Raao, B., Masliah, D., Rosenthal, S. B., Sasik, R., Fisch, K. M., et al. (2019). Integrating gene and protein expression reveals perturbed functional networks in alzheimer’s disease. Cell Rep. 28, 1103–1116. doi:10.1016/j.celrep.2019.06.073
Consortium, G. O., Clark, J., Ireland, A., Lomax, J., Ashburner, M., Foulger, R., et al. (2004). The gene ontology (go) database and informatics resource. Nucleic Acids Res. 32, D258–D261. doi:10.1093/nar/gkh036
Cowen, L., Ideker, T., Raphael, B. J., and Sharan, R. (2017). Network propagation: a universal amplifier of genetic associations. Nat. Rev. Genet. 18, 551–562. doi:10.1038/nrg.2017.38
Dalmasso, M. C., De Rojas, I., Olivar, N., Muchnik, C., Angel, B., Gloger, S., et al. (2024). The first genome-wide association study in the Argentinian and Chilean populations identifies shared genetics with Europeans in alzheimer’s disease. Alzheimer’s and Dementia 20, 1298–1308. doi:10.1002/alz.13522
Deng, C., Li, H.-D., Zhang, L.-S., Liu, Y., Li, Y., and Wang, J. (2024). Identifying new cancer genes based on the integration of annotated gene sets via hypergraph neural networks. Bioinformatics 40, i511–i520. doi:10.1093/bioinformatics/btae257
Di Paolo, G., and Kim, T.-W. (2011). Linking lipids to alzheimer’s disease: cholesterol and beyond. Nat. Rev. Neurosci. 12, 284–296. doi:10.1038/nrn3012
Feng, Y., You, H., Zhang, Z., Ji, R., and Gao, Y. (2019). Hypergraph neural networks. Proc. AAAI Conf. Artif. Intell. 33, 3558–3565. doi:10.1609/aaai.v33i01.33013558
He, K., Zhang, X., Ren, S., and Sun, J. (2016). “Deep residual learning for image recognition,” in Proceedings of the IEEE conference on computer vision and pattern recognition, 770–778.
Hsu, S.-D., Lin, F.-M., Wu, W.-Y., Liang, C., Huang, W.-C., Chan, W.-L., et al. (2011). Mirtarbase: a database curates experimentally validated microrna–target interactions. Nucleic Acids Res. 39, D163–D169. doi:10.1093/nar/gkq1107
Jansen, I. E., Savage, J. E., Watanabe, K., Bryois, J., Williams, D. M., Steinberg, S., et al. (2019). Genome-wide meta-analysis identifies new loci and functional pathways influencing alzheimer’s disease risk. Nat. Genet. 51, 404–413. doi:10.1038/s41588-018-0311-9
Jayapalan, S., and Natarajan, J. (2013). The role of cdk5 and gsk3b kinases in hyperphosphorylation of microtubule associated protein tau (mapt) in alzheimer’s disease. Bioinformation 9, 1023–1030. doi:10.6026/97320630091023
Kanehisa, M., and Goto, S. (2000). Kegg: kyoto encyclopedia of genes and genomes. Nucleic Acids Res. 28, 27–30. doi:10.1093/nar/28.1.27
Kipf, T. N., and Welling, M. (2017). “Semi-supervised classification with graph convolutional networks,” in International conference on learning representations.
Köhler, S., Gargano, M., Matentzoglu, N., Carmody, L. C., Lewis-Smith, D., Vasilevsky, N. A., et al. (2021). The human phenotype ontology in 2021. Nucleic Acids Res. 49, D1207–D1217. doi:10.1093/nar/gkaa1043
Krishnan, A., Zhang, R., Yao, V., Theesfeld, C. L., Wong, A. K., Tadych, A., et al. (2016). Genome-wide prediction and functional characterization of the genetic basis of autism spectrum disorder. Nat. Neurosci. 19, 1454–1462. doi:10.1038/nn.4353
Lee, I., Blom, U. M., Wang, P. I., Shim, J. E., and Marcotte, E. M. (2011). Prioritizing candidate disease genes by network-based boosting of genome-wide association data. Genome Res. 21, 1109–1121. doi:10.1101/gr.118992.110
Li, H.-D., Deng, C., Zhang, X.-Q., and Lin, C.-X. (2022). A gene set-integrated approach for predicting disease-associated genes. IEEE/ACM Trans. Comput. Biol. Bioinforma. 20, 3440–3450. doi:10.1109/TCBB.2022.3214517
Liberzon, A., Subramanian, A., Pinchback, R., Thorvaldsdóttir, H., Tamayo, P., and Mesirov, J. P. (2011). Molecular signatures database (Msigdb) 3.0. Bioinformatics 27, 1739–1740. doi:10.1093/bioinformatics/btr260
Liberzon, A., Birger, C., Thorvaldsdóttir, H., Ghandi, M., Mesirov, J. P., and Tamayo, P. (2015). The molecular signatures database (MSigDB) hallmark gene set collection. Cell Syst. 1, 417–425. doi:10.1016/j.cels.2015.12.004
Lin, Q., Cao, Y., and Gao, J. (2015). Decreased expression of the apoa1–apoc3–apoa4 gene cluster is associated with risk of alzheimer’s disease. Drug Des. Dev. Ther. 9, 5421–5431. doi:10.2147/DDDT.S89279
Mancuso, C. A., Bills, P. S., Krum, D., Newsted, J., Liu, R., and Krishnan, A. (2022). Geneplexus: a web-server for gene discovery using network-based machine learning. Nucleic Acids Res. 50, W358–W366. doi:10.1093/nar/gkac335
McCarthy, M. I., Abecasis, G. R., Cardon, L. R., Goldstein, D. B., Little, J., Ioannidis, J. P., et al. (2008). Genome-wide association studies for complex traits: consensus, uncertainty and challenges. Nat. Rev. Genet. 9, 356–369. doi:10.1038/nrg2344
Piñero, J., Ramírez-Anguita, J. M., Saüch-Pitarch, J., Ronzano, F., Centeno, E., Sanz, F., et al. (2020). The disgenet knowledge platform for disease genomics: 2019 update. Nucleic Acids Res. 48, D845–D855. doi:10.1093/nar/gkz1021
Sims, R., Hill, M., and Williams, J. (2020). The multiplex model of the genetics of alzheimer’s disease. Nat. Neurosci. 23, 311–322. doi:10.1038/s41593-020-0599-5
Sollis, E., Mosaku, A., Abid, A., Buniello, A., Cerezo, M., Gil, L., et al. (2023). The nhgri-ebi gwas catalog: knowledgebase and deposition resource. Nucleic Acids Res. 51, D977–D985. doi:10.1093/nar/gkac1010
Spina, S., La Joie, R., Petersen, C., Nolan, A. L., Cuevas, D., Cosme, C., et al. (2021). Comorbid neuropathological diagnoses in early versus late-onset alzheimer’s disease. Brain 144, 2186–2198. doi:10.1093/brain/awab099
Subramanian, A., Tamayo, P., Mootha, V. K., Mukherjee, S., Ebert, B. L., Gillette, M. A., et al. (2005). “Gene set enrichment analysis: a knowledge-based approach for interpreting genome-wide expression profiles,”, 102. Washington, DC: Proceedings of the National Academy of Sciences, 15545–15550. doi:10.1073/pnas.0506580102
Szklarczyk, D., Franceschini, A., Wyder, S., Forslund, K., Heller, D., Huerta-Cepas, J., et al. (2015). String v10: Protein–Protein interaction networks, integrated over the tree of life. Nucleic Acids Res. 43, D447–D452. doi:10.1093/nar/gku1003
Tran, V. D., Sperduti, A., Backofen, R., and Costa, F. (2020). Heterogeneous networks integration for disease–gene prioritization with node kernels. Bioinformatics 36, 2649–2656. doi:10.1093/bioinformatics/btaa008
Valdeolivas, A., Tichit, L., Navarro, C., Perrin, S., Odelin, G., Levy, N., et al. (2019). Random walk with restart on multiplex and heterogeneous biological networks. Bioinformatics 35, 497–505. doi:10.1093/bioinformatics/bty637
Yao, V., Kaletsky, R., Keyes, W., Mor, D. E., Wong, A. K., Sohrabi, S., et al. (2018). An integrative tissue-network approach to identify and test human disease genes. Nat. Biotechnol. 36, 1091–1099. doi:10.1038/nbt.4246
Zhang, T., Lin, Y., He, W., Yuan, F., Zeng, Y., and Zhang, S. (2022). Gcn-gene: a novel method for prediction of coronary heart disease-related genes. Comput. Biol. Med. 150, 105918. doi:10.1016/j.compbiomed.2022.105918
Keywords: Alzheimer’s disease, higher-order associations, hypergraph neural network, hypergraph, disease gene
Citation: Ma M, Deng C, Liu Y, Cao Q, Liu F and Zhang Y (2025) A hypergraph neural network for prioritizing Alzheimer’s disease risk genes. Front. Genet. 16:1668200. doi: 10.3389/fgene.2025.1668200
Received: 18 July 2025; Accepted: 08 September 2025;
Published: 19 September 2025.
Edited by:
Chunhou Zheng, Anhui University, ChinaReviewed by:
Libing Bai, Qinghai Normal University, ChinaMassimo Orazio Spata, University of Catania, Italy
Copyright © 2025 Ma, Deng, Liu, Cao, Liu and Zhang. This is an open-access article distributed under the terms of the Creative Commons Attribution License (CC BY). The use, distribution or reproduction in other forums is permitted, provided the original author(s) and the copyright owner(s) are credited and that the original publication in this journal is cited, in accordance with accepted academic practice. No use, distribution or reproduction is permitted which does not comply with these terms.
*Correspondence: Yan Zhang, emhhbmd5YW5sam1AY3N1LmVkdS5jbg==