 Yang Liu
 Jason Huse1,3
 Kasthuri Kannan
- 1Department of Translational Molecular Pathology, University of Texas MD Anderson Cancer Center, Houston, TX, United States
- 2Department of Biostatistics and Data Science, University of Texas Health Science Center at Houston, Houston, TX, United States
- 3Department of Pathology, University of Texas MD Anderson Cancer Center, Houston, TX, United States
Background: Isocitrate dehydrogenase wild-type (IDH wild-type) gliomas represents the most aggressive subtype of diffuse gliomas, characterized by therapeutic resistance and dismal prognosis. Despite advances in molecular classification, reliable prognostic biomarkers for these tumors remain limited, particularly for recurrent disease. This study aims to identify gene expression signatures associated with survival outcomes in recurrent IDH wild-type gliomas, with the goal of improving patient stratification and potential therapeutic targeting.
Methods: We analyzed gene expression data from 180 recurrent IDH wild-type glioma samples from the Glioma Longitudinal AnalySiS (GLASS) Consortium. Using multiple computational approaches including a novel network-based method (netSurvival) and various survival analysis techniques, we identified genes associated with patient survival outcomes.
Results: Our comprehensive analysis identify several gene expression markers that are associated with survival outcomes in recurrent IDH wild-type gliomas. Pathway enrichment analysis identified three significant pathways: FGFR3 signaling, nanoparticle-mediated receptor signaling, and MYCN transcriptional activation, highlighting receptor tyrosine kinase signaling and transcriptional dysregulation as key mechanisms. The AFT log normal model revealed that FN1, HIF3A, and EIF4B are associated with poorer survival (hazard ratios of 1.40, 1.49, and 1.54, respectively; p < 0.05), while PTK2, CCND2, RAD51L3-RFFL, and MAX demonstrated protective effects (hazard ratios of 0.76, 0.78, 0.79, and 0.79, respectively; p < 0.05). Five genes (KIF5C, LINC00632, B4GALNT3, HIF3A, and RAD51L3-RFFL) show significant differential expression between primary and recurrent tumors, with four having established functional roles in glioma pathobiology.
Conclusion: This study identifies a panel of gene expression markers with significant prognostic value in recurrent IDH wild-type gliomas. The differential impacts of these genes on survival outcomes provide insights into the biological heterogeneity underlying clinical behavior in these aggressive tumors. Particularly significant are the biomarkers associated with both survival outcomes and recurrence patterns, which may represent key drivers of disease progression. These findings represent an important step toward improved prognostic stratification and therapeutic targeting in IDH wild-type gliomas, addressing a critical unmet need in neuro-oncology.
1 Introduction
IDH wild-type gliomas constitute a distinct molecular entity characterized by aggressive clinical behavior and poor prognosis. Representing over 90% of glioblastomas (GBM), the most common and malignant primary brain tumor in adults, these tumors present a formidable challenge in neuro-oncology. Despite advances in multimodal treatment approaches combining surgical resection, radiotherapy, and chemotherapy, the prognosis for patients with IDH wild-type gliomas remains dismal, with a median survival of merely 12–15 months (Stupp et al., 2017). This poor survival rate highlights the urgent clinical need for improved stratification methods and novel therapeutic approaches for this devastating disease.
The molecular landscape of gliomas has been substantially refined in recent years, leading to the 2016 World Health Organization (WHO) classification integration of molecular parameters into the diagnostic algorithm. The identification of IDH mutation status as a fundamental molecular classifier has divided diffuse gliomas into distinct biological and clinical entities. While IDH-mutant gliomas generally exhibit more favorable outcomes, IDH wild-type gliomas demonstrate aggressive behavior and therapeutic resistance (Louis et al., 2016; Weller et al., 2021).
The molecular heterogeneity of IDH wild-type gliomas presents both a challenge and an opportunity for biomarker discovery. Comprehensive genomic analyses have revealed several key molecular alterations that characterize these tumors. EGFR amplification occurs in 35%–45% of IDH wild-type GBM, while CDKN2A/B homozygous deletion is observed in approximately 50%–60% of cases (Ceccarelli et al., 2016). TERT promoter mutations are present in over 80% of IDH wild-type GBM, serving as a key diagnostic marker that distinguishes them from lower-grade gliomas (Eckel-Passow et al., 2015). Currently, MGMT promoter methylation status remains the most clinically relevant predictive biomarker, with approximately 40% of IDH wild-type GBM exhibiting methylation that correlates with improved response to temozolomide treatment (Hegi et al., 2005; Molinaro et al., 2019).
Beyond genomic alterations, transcriptomic studies have provided valuable insights into the tumor microenvironment and cellular heterogeneity of IDH wild-type gliomas. Neftel et al. identified distinct cellular states and plasticity in glioblastoma that influence tumor progression and therapeutic resistance (Neftel et al., 2019). Ran et al. characterized the patterns of immune cell infiltration and their association with survival, highlighting potential immunotherapeutic targets (Ran et al., 2024). However, these established biomarkers provide insufficient granularity for accurate prognostication and personalized treatment planning, underscoring a critical gap in our ability to identify targeted therapeutic approaches.
Despite these advances, current approaches to biomarker identification have often focused on isolated genetic alterations or protein expression levels without integrating comprehensive transcriptomic signatures with robust survival analyses. Advanced genomic and transcriptomic profiling has generated vast amounts of molecular data. However, a methodological gap exists in effectively translating this information into clinically actionable biomarkers that reliably correlate with survival outcomes.
In this study, we integrate gene expression profiles from recurrent IDH wild-type gliomas with patient survival data to identify potential prognostic biomarkers. This focus on recurrent tumors is particularly significant, as these represent the most challenging clinical scenario with even more limited treatment options and worse outcomes compared to newly diagnosed cases (Park et al., 2010; Vredenburgh et al., 2007). Recurrent IDH wild-type gliomas often demonstrate heightened therapeutic resistance and altered molecular profiles compared to primary tumors, potentially revealing distinct survival-associated biomarkers (Wang et al., 2017; Kim et al., 2015). By employing network-based survival (netSurvival) approach and regularized Cox models, we aim to discover gene expression signatures that are critical for patient survival. Furthermore, we validate these findings through prognostic abilities and survival differences of the stratified groups via prognostic indexes (PIs).
The identification of reliable prognostic biomarkers for IDH wild-type gliomas holds significant promise for advancing precision medicine in neuro-oncology. Such biomarkers enable more accurate patient stratification for clinical trials, guide treatment decisions, reveal underlying biological mechanisms of tumor progression, and potentially uncover novel therapeutic targets. Ultimately, this research seeks to address the fundamental clinical challenge of improving outcomes for patients with one of the most aggressive and treatment-resistant malignancies in oncology.
2 Methods
2.1 Dataset and preprocessing
This study uses glioma data from the GLASS consortium. After preprocessing, gene expression TPM values and corresponding clinical outcomes are obtained for 180 IDH wild-type recurrent samples from 158 patients. Approximately 11.1% of the samples are right-censored.
Genes with more than 80% zero expression values and samples with missing data are removed. A five-fold cross-validation is performed to identify markers associated with survival. For each fold, the training and testing sets are normalized separately using
2.2 Network construction and random walk for feature selection
As previously described (Liu et al., 2025), we apply one-dimensional hierarchical clustering to group samples for each gene based on their normalized expression values, identifying clusters of patients with the top 10% highest absolute
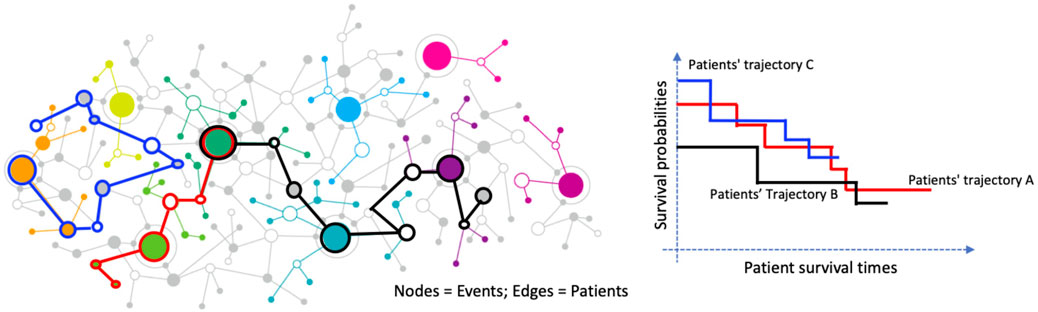
Figure 1. Graph-based representation of patient trajectories and their association with survival outcomes. Left: A network where nodes represent clinical or molecular events and edges represent patients connecting these events. Colored paths illustrate distinct patient trajectories. Right: Kaplan–Meier survival curves for three patient trajectory groups (A, B, and C), demonstrating differing survival probabilities over time.
2.3 Regularized cox models
Due to the censored properties of time-to-event outcomes, such as overall median survival time, conventional methods like ANOVA are not appropriate for analyzing survival data in IDH wild-type gliomas. To address this, we employ three regularized Cox proportional hazards (PH) models, specifically Ridge Cox, Lasso Cox, and Elastic Net Cox, for feature selection to identify prognostic biomarkers in IDH wild-type gliomas. These models are well-suited for handling high-dimensional genomic data and account for censoring by modeling the hazard function over time.
The Ridge Cox model applies L2 regularization, which shrinks regression coefficients toward zero to reduce overfitting while retaining all features, making it effective for correlated predictors (Hoerl and Kennard, 1970; Tibshirani, 1997). The objective function for Ridge Cox regression given by Equation 1:
where
In contrast, the Lasso Cox model uses L1 regularization to perform both shrinkage and feature selection by setting some coefficients to exactly zero, thus identifying a sparse set of predictors (Hoerl and Kennard, 1970; Tibshirani, 1996). The Lasso Cox objective function is as Equation 2:
The Elastic Net Cox model combines L1 and L2 regularization, balancing the strengths of Ridge and Lasso to handle correlated features while selecting a subset of relevant biomarkers (Zou and Hastie, 2005; Simon et al., 2011). The Elastic Net Cox objective function is as Equation 3:
where
2.4 Pathway enrichment analysis
Pathway enrichment analysis was conducted using ToppGene Suite (https://toppgene.cchmc.org/prioritization.jsp), a web-based tool for identifying biological pathways enriched in gene lists (Chen et al., 2009). The analysis integrates multiple pathway databases including Reactome, KEGG, and WikiPathways, and uses hypergeometric testing with Benjamini-Hochberg correction to determine statistically significant enrichments. Pathways with FDR-corrected p-values <0.05 were considered significant.
2.5 Machine learning models for survival outcomes
To evaluate the selected prognostic biomarkers for IDH wild-type gliomas, we employ several specialized survival analysis methods tailored to handle right-censored survival data.
The Cox PH model assumes a linear relationship between predictors and the logarithm of the hazard function, providing a robust framework for assessing the impact of selected biomarkers on survival outcomes (Cox, 1972). The hazard function is modeled as Equation 4:
Where
Random Survival Forests (RSF), an extension of traditional random forests, construct an ensemble of survival trees using bootstrap samples, effectively capturing complex, non-linear relationships between predictors and survival outcomes while accommodating censoring (Ishwaran and Kogalur, 2010; Ishwaran et al., 2008). RSF predicts the cumulative hazard function based on ensemble averaging of Nelson-Aalen estimators from individual trees.
Additionally, Support Vector Machines (SVM) adapted for survival data extend the standard SVM framework by integrating censoring information into the optimization process, modeling the relationship between high-dimensional predictors and time-to-event outcomes (Belle et al., 2011; Pölsterl et al., 2015). The survival SVM formulation focuses on maintaining the correct ranking of survival times among pairs of patients.
To assess model performance, we used two primary metrics:
Concordance Index (C-index): The C-index measures the model’s discriminative ability by calculating the proportion of all possible pairs of patients where the patient with the higher predicted risk experiences the event before the patient with the lower predicted risk (Harrell et al., 1996). Values range from 0.5 (random prediction) to 1.0 (perfect discrimination), with higher values indicating better model performance. The C-index is calculated as Equation 5:
Where
Integrated Brier Score (IBS): The IBS assesses both discrimination and calibration by measuring the average squared difference between observed outcomes and predicted probabilities over a range of time points (Graf et al., 1999; Gerds and Schumacher, 2006). Lower IBS values indicate better model performance. The IBS is defined as Equation 6:
where
Mean C-index and IBS values over 10 replicated runs were used to measure predictive accuracy and calibration, providing a robust assessment of model performance.
2.6 Stratification of PIs
PIs were calculated for each patient based on the coefficients of the selected features to quantify individual risk levels. For each survival model, PIs were computed as follows:
Cox PH and Elastic Net Cox: The PI is calculated as the linear predictor from the Cox model as Equation 7,
where
Random Survival Forest: The PI is derived from the ensemble mortality score in Equation 8,
where
Survival SVM: The PI is based on the decision function value as Equation 9,
where
Risk stratification was performed by dividing patients into risk groups based on PI scores using two different approaches:
Two-group stratification: Patients were divided into equal-sized low-risk and high-risk groups (0.5, 0.5) based on the median PI value.
Three-group stratification: Patients were divided into low-risk (bottom 1/3), intermediate-risk (middle 1/3), and high-risk (top 1/3) groups based on PI tertiles.
For each stratification approach, Kaplan-Meier survival curves were generated for each risk group, and log-rank tests were performed to evaluate the statistical significance of survival differences between groups (Bland and Altman, 2004). Mean log-rank p-values were computed across the 10-fold cross-validation to summarize model effectiveness in stratifying patients based on survival risk. Additionally, HRs with 95% confidence intervals were calculated to quantify the relative risk between groups (Therneau and Grambsch, 2000).
2.7 AFT model
To evaluate the prognostic impact of selected gene expression markers, we employed an AFT model with a log-normal distribution, following the framework described by Kalbfleisch and Prentice (Kalbfleisch and Prentice, 2002). Unlike the Cox PH model, which focuses on the hazard function, the AFT model directly models the survival time and assumes that covariates act multiplicatively on survival time, effectively accelerating or decelerating the time to event (Klein and Moeschberger, 2003). Specifically, the model expresses the log of survival time
Here,
where
This transformation allows us to interpret each marker’s effect on survival time in terms of relative risk (Wei, 1992; Carroll, 2003). Specifically, a HR
The log-normal distribution was selected over other parametric options (such as Weibull or log-logistic) based on Akaike Information Criterion (AIC) (Akaike, 1974). We estimated the model parameters using maximum likelihood estimation, with confidence intervals for HRs derived via the delta method (Hosmer et al., 2008).
3 Results
3.1 Performance of markers
To ensure reliability, we selected markers that appeared in at least three out of five cross-validation folds using our random-walk-based netSurvival approach, yielding 29 genes. For fair comparison, we also selected the top 29 genes from each regularized feature selection method (Elastic Net, Lasso, and Ridge) based on the sum of ranks across all folds. As shown in the Venn diagram (Supplementary Figure S1), these four methods collectively identified 67 unique genes.
Notably, netSurvival identified 22 unique genes not detected by the regularized methods, indicating that the network-based approach provides a distinct marker profile. This difference likely arises because netSurvival explicitly considers interactions between genes through network topology, whereas regularized Cox models (Elastic Net, Lasso, and Ridge) treat genes as independent features. This fundamental difference in methodology allows netSurvival to uncover biologically relevant markers that may be missed by independence-based approaches.
As shown in Figure 2, netSurvival achieves performance comparable to other methods in both patient risk stratification (measured by integrated Brier score, IBS) and prediction accuracy (measured by C-index). While netSurvival does not demonstrate superior predictive performance, its value lies in (1) identifying unique biologically relevant markers through gene interaction networks, (2) providing enhanced stability with more consistent performance across all five cross-validation folds (indicated by smaller error bars), and (3) offering complementary insights when integrated with traditional regularized methods for comprehensive biomarker discovery.
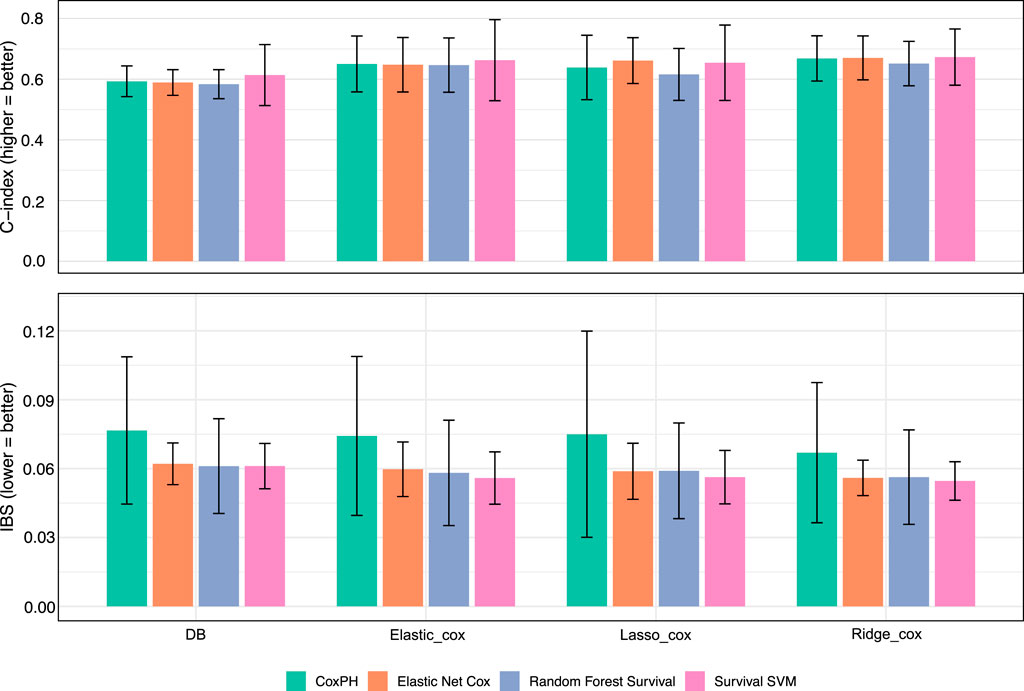
Figure 2. Model performance with different features. Bar plots showing the performance of four survival models: Cox PH, Elastic Net Cox, Random Forest Survival, and Survival Support Vector Machine, across four feature sets derived from different selection methods: Databased-based netSurvival, Elastic_Cox, Lasso_Cox, and Ridge_Cox. The top panel presents the C-index, where higher values indicate better discriminatory power, while the bottom panel displays the IBS, where lower values represent improved overall accuracy. Error bars denote the standard deviation across cross-validation folds.
The Table 1 below presents p-values for group comparisons stratified by PIs. While our method’s p-values are not the lowest across all models compared to other approaches, the selected markers remain promising. Although these markers may not be the optimal predictors of patient risk, their competitive performance warrants further exploration.

Table 1. Mean and standard deviation of two-group and three-group
3.2 Pathway enrichment
We performed the pathway enrichment analysis using all 67 genes. Three significant pathways were identified–FGFR3 signaling in chondrocyte proliferation and terminal differentiation, nanoparticle-mediated activation of receptor signaling, and MYCN to transcriptional activation–each of which shows mechanistic or therapeutic relevance to IDH-wildtype gliomas. The FGFR3 signaling pathway, involving genes such as FGFR3, MAPK1/3, and SOX9, is particularly notable because FGFR3–TACC3 fusions are recurrent oncogenic events in IDH-wildtype glioblastomas, driving proliferative and mitogenic signaling through constitutive FGFR3 activation and MAPK/ERK cascades (Broggi et al., 2022; Gao et al., 2020). The nanoparticle-mediated receptor signaling pathway corresponds to the growing role of receptor-targeted nanocarrier systems–including EGFR-, LRP1-, and TfR-mediated transport–in glioma therapy, enabling blood–brain barrier penetration and tumor-specific drug delivery via receptor interactions (García et al., 2025). Finally, the MYCN transcriptional activation pathway reflects MYCN-driven oncogenic transcriptional programs, which define an aggressive subset of IDH-wildtype gliomas characterized by high proliferation, metabolic reprogramming, and poor prognosis (Borgenvik et al., 2021; Zhou et al., 2023). Together, these pathways underscore the intersection between receptor tyrosine kinase signaling, transcriptional dysregulation, and advanced therapeutic modalities as key axes in IDH-wildtype glioma biology.
3.3 Few-shot prompting
We here check the union set of genes from four different feature selection approaches. The features obtained from all methods can be obtained from Supplementary Table S1. To find out markers with reference support, we implement a few-shot prompting through Grok 3 model. All references and findings obtained from the prompting process were rigorously verified through manual literature review to ensure their validity and relevance. The roles of 15 gene candidates with strong or moderate evidence are listed below.
3.4 AFT model evaluation
The AFT lognormal model was employed to assess the association between gene expression levels and survival outcomes, with results presented as maximum likelihood parameter estimates. The model identified several genes with statistically significant effects on survival time (p
3.5 Correlations with recurrence
Since recurrence is a key contributor to poor prognosis, we examined whether these 67 markers are also associated with tumor recurrence. As shown in Figure 3, the expression levels of five genes, KIF5C, LICNC00632, B4GALNT3, HIF3A, and RAD51L3-RFFL, differ significantly between primary and recurrent groups in both paired and unpaired Wilcoxon tests. Notably, four of these five genes have strong or moderate evidence supporting their functional roles in glioma, as summarized in Table 2, and two (HIF3A, RAD51L3-RFFL) show significant HRs in the Cox PH model (Table 3).
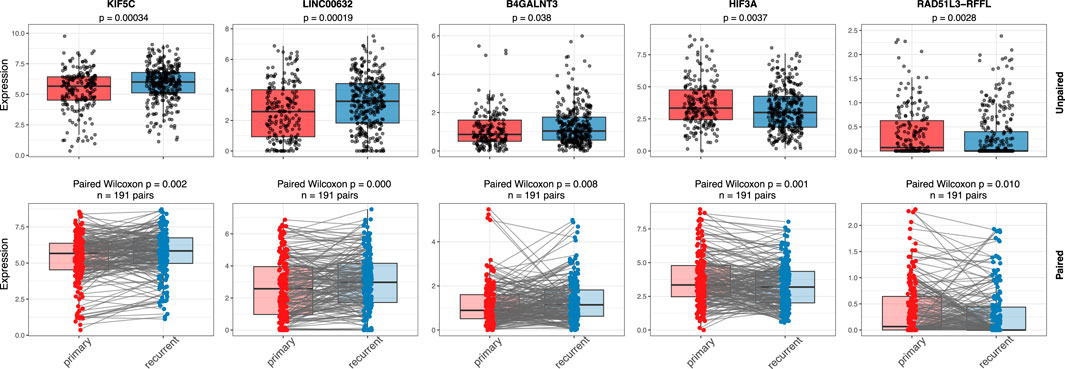
Figure 3. Gene expressions in primary and recurrent samples. Figure shows the expression comparison of five genes (KIF5C, LINC00632, B4GALNT3, HIF3A, and RAD51L3-RFFL) between primary and recurrent IDH wild-type glioma samples using unpaired (top row) and paired (bottom row) statistical tests. Boxplots display gene expression levels with individual sample points overlaid. In the unpaired analysis, a Wilcoxon rank-sum test was used, while the paired analysis applied a Wilcoxon signed-rank test across matched primary–recurrent sample pairs. Significant p-values in both analyses suggest consistent changes in gene expression between primary and recurrent tumors, supporting their potential roles in glioma recurrence.
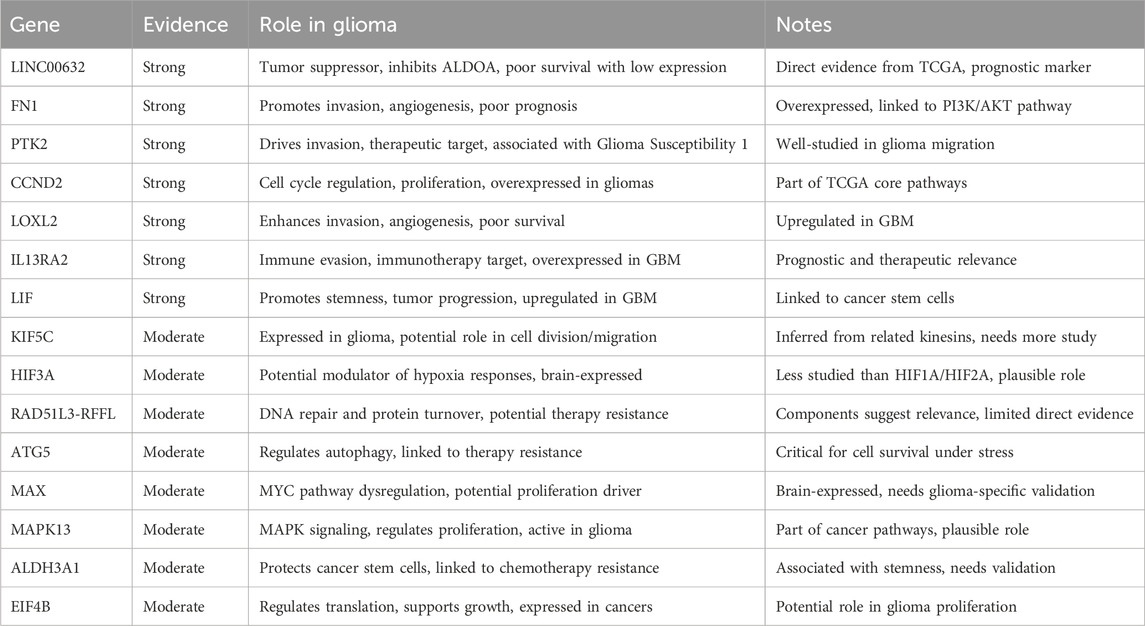
Table 2. Summary of genes and their plausible roles in glioma.

Table 3. Analysis of maximum likelihood parameter estimates.
4 Discussion
Our comprehensive analysis of gene expression profiles in recurrent IDH wild-type gliomas identified several potential prognostic biomarkers with significant associations with patient survival. By integrating netSurvival with established survival analysis methods, we have uncovered a panel of genes that may contribute to both prognostic stratification and improved biological understanding of IDH wild-type glioma progression.
4.1 Interpretation of key findings
Pathway enrichment analysis using ToppGene identified three significant pathways providing biological context for these markers: FGFR3 signaling, which drives proliferation through FGFR3–TACC3 fusions and MAPK/ERK activation; nanoparticle-mediated receptor signaling, relevant to emerging therapeutic strategies for blood–brain barrier penetration; and MYCN transcriptional activation, defining an aggressive molecular subtype with poor prognosis.
Our AFT lognormal model revealed that FN1, HIF3A, and EIF4B are significantly associated with poorer survival outcomes, with HRs suggesting substantial increases in risk (40.34%, 49.07%, and 54.32%, respectively). In contrast, PTK2, CCND2, RAD51L3-RFFL, and MAX demonstrated protective effects, with higher expression correlating with improved survival outcomes. These findings align with emerging literature on the biological functions of these genes in glioma pathology.
FN1 (Fibronectin 1) promotes glioma cell invasion and migration by interacting with integrin receptors, particularly
Conversely, the protective associations observed with PTK2, CCND2, RAD51L3-RFFL, and MAX suggest potential compensatory or tumor-suppressive functions in glioma. PTK2 (Protein Tyrosine Kinase 2) has traditionally been considered pro-oncogenic in many cancers, but recent evidence suggests context-dependent functions that may explain its association with improved survival in our cohort (Sulzmaier et al., 2014). CCND2 (Cyclin D2) may reflect a more differentiated cellular state in glioma, consistent with its favorable prognostic association (Koyama-Nasu et al., 2013).
4.2 Recurrence-associated biomarkers
The identification of five genes (KIF5C, LINC00632, B4GALNT3, HIF3A, and RAD51L3-RFFL) with differential expression between primary and recurrent tumors provides critical insight into the molecular mechanisms driving recurrence, the key challenge in the management of IDH wild-type glioma. Notably, four of these genes have strong or moderate evidence supporting their functional roles in glioma progression. The dual significance of HIF3A and RAD51L3-RFFL, in both survival outcomes and recurrence patterns, underscores their potential as both prognostic biomarkers and therapeutic targets.
KIF5C promotes glioma progression by enhancing cell proliferation, migration, and invasion through the AKT signaling pathway and cytoskeletal organization (Joyce and Lindsay, 2024). In contrast, B4GALNT3 (Beta-1,4-N-Acetyl-Galactosaminyltransferase 3) may influence invasive properties by glycosylating cell surface proteins (Che et al., 2014). The long non-coding RNA LINC00632 represents an emerging class of regulatory molecules with potential roles in gene expression modulation in glioma (Wang et al., 2015). These recurrence-associated biomarkers may provide valuable insights for developing targeted approaches to prevent or delay tumor recurrence, the principal driver of mortality in glioma patients.
4.3 Methodological strengths and limitations
Our study benefits from several methodological strengths. First, the focus on recurrent IDH wild-type gliomas addresses a critical clinical challenge, as recurrent tumors represent the most therapeutically resistant phase of disease. Second, the integration of multiple feature selection approaches, including netSurvival, provides robust identification of candidate biomarkers. Third, the application of several survival analysis models enhances the reliability of our findings through methodological triangulation.
However, several limitations must be acknowledged. Despite the GLASS consortium providing one of the largest collections of longitudinal glioma data, our sample size remains modest given the molecular heterogeneity of these tumors. Further validation in independent cohorts is essential. Additionally, while gene expression data provides valuable insights, integration with other molecular data types (e.g., methylation profiles, proteomic data) could yield more comprehensive biomarker signatures. Finally, our study does not address potential treatment-induced alterations in gene expression patterns, which may confound the interpretation of recurrence-associated biomarkers.
4.4 Clinical implications and future directions
The identified biomarkers hold considerable potential for improving clinical management of IDH wild-type gliomas. In the near term, these markers could enhance prognostic stratification, allowing more precise risk assessment and treatment planning. For example, patients with elevated expression of high-risk markers (FN1, HIF3A, EIF4B) might benefit from more aggressive treatment approaches or closer surveillance. In contrast, while those with favorable expression patterns might be candidates for treatment de-escalation strategies to minimize toxicity.
Beyond prognostication, our findings may inform the development of therapeutic interventions. The negative prognostic association of HIF3A suggests that targeting hypoxia adaptation pathways may be particularly valuable in high-risk patients. Similarly, the protective association of PTK2 raises intriguing questions about its context-dependent functions in glioma that warrant further investigation for potential therapeutic exploitation.
Future research should focus on several key areas: (1) functional validation of these biomarkers through in vitro and in vivo models to establish causal relationships with disease progression; (2) integration with spatial transcriptomic approaches to understand the tumor microenvironmental context of these markers; (3) development of clinically applicable assays for biomarker assessment in routine pathology; and (4) investigation of pharmacological approaches targeting the pathways involving these biomarkers.
5 Conclusion
This study identifies a panel of gene expression markers with significant prognostic value in recurrent IDH wild-type gliomas. The differential impacts of these genes on survival outcomes provide insights into the biological heterogeneity underlying clinical behavior in these aggressive tumors. Particularly significant are the biomarkers associated with both survival outcomes and recurrence patterns, which may represent key drivers of disease progression. While further validation is necessary, these findings represent a meaningful step toward improved prognostic stratification and therapeutic targeting in IDH wild-type gliomas, addressing a critical unmet need in neuro-oncology.
Data availability statement
The gene expression datasets used in this study are publicly available from the GLASS Consortium: https://www.synapse.org/Synapse:syn17038081/wiki/585622. All the code can be found through GitHub repository https://github.com/yliu38/netSurvival.
Ethics statement
Ethical approval was not required for the study involving humans in accordance with the local legislation and institutional requirements. Written informed consent to participate in this study was not required from the participants or the participants’ legal guardians/next of kin in accordance with the national legislation and the institutional requirements.
Author contributions
YL: Writing – review and editing, Writing – original draft. JH: Writing – original draft, Writing – review and editing. KK: Writing – review and editing, Writing – original draft.
Funding
The author(s) declare that financial support was received for the research and/or publication of this article. This work was supported by the MD Anderson Moonshot Program.
Conflict of interest
The authors declare that the research was conducted in the absence of any commercial or financial relationships that could be construed as a potential conflict of interest.
Generative AI statement
The author(s) declare that no Generative AI was used in the creation of this manuscript.
Any alternative text (alt text) provided alongside figures in this article has been generated by Frontiers with the support of artificial intelligence and reasonable efforts have been made to ensure accuracy, including review by the authors wherever possible. If you identify any issues, please contact us.
Publisher’s note
All claims expressed in this article are solely those of the authors and do not necessarily represent those of their affiliated organizations, or those of the publisher, the editors and the reviewers. Any product that may be evaluated in this article, or claim that may be made by its manufacturer, is not guaranteed or endorsed by the publisher.
Supplementary material
The Supplementary Material for this article can be found online at: https://www.frontiersin.org/articles/10.3389/fgene.2025.1672015/full#supplementary-material
SUPPLEMENTARY FIGURE S1 | Venn diagram illustrating the overlap and unique genes among the four feature selection methods.
References
Akaike, H. (1974). A new look at the statistical model identification. IEEE Trans. Automatic Control 19, 716–723. doi:10.1109/TAC.1974.1100705
Belle, V. V., Pelckmans, K., Huffel, S. V., and Suykens, J. A. K. (2011). Support vector methods for survival analysis: a comparison between ranking and regression approaches. Artif. Intell. Med. 53, 107–118. doi:10.1016/j.artmed.2011.06.006
Bland, J. M., and Altman, D. G. (2004). The logrank test. BMJ 328, 1073. doi:10.1136/bmj.328.7447.1073
Borgenvik, A., Cancer, M., Hutter, S., and Swartling, F. J. (2021). Targeting mycn in molecularly defined malignant brain tumors. Front. Oncol. 10, 626751. doi:10.3389/fonc.2020.626751
Broggi, G., Piombino, E., Altieri, R., Romano, G., Certo, F., Vigneri, P., et al. (2022). Glioblastoma, idh-wild type with fgfr3-tacc3 fusion: when morphology may reliably predict the molecular profile of a tumor. Front. Neurology 12, 823015. doi:10.3389/fneur.2022.823015
Carroll, K. J. (2003). On the use and utility of the weibull model in the analysis of survival data. Control. Clin. Trials 24, 682–701. doi:10.1016/S0197-2456(03)00072-2
Ceccarelli, M., Barthel, F. P., Malta, T. M., Sabedot, T. S., Salama, S. R., Murray, B. A., et al. (2016). Molecular profiling reveals biologically discrete subsets and pathways of progression in diffuse glioma. Cell 164, 550–563. doi:10.1016/j.cell.2015.12.028
Che, M. I., Huang, J., Hung, J. S., Lin, Y. C., Huang, M. J., Lai, H. S., et al. (2014). β1,4-n-acetyl-galactosaminyltransferase iii modulates cancer stemness through egfr signaling pathway in colon cancer cells. Oncotarget 5, 3673–3684. doi:10.18632/oncotarget.1981
Chen, J., Bardes, E. E., Aronow, B. J., and Jegga, A. G. (2009). Toppgene suite for gene list enrichment analysis and candidate gene prioritization. Nucleic Acids Res. 37, W305–W311. doi:10.1093/nar/gkp427
Collett, D. (2015). Modelling survival data in medical research. 3rd edn. New York: Chapman and Hall/CRC.
Cox, D. R. (1972). Regression models and life-tables. J. R. Stat. Soc. Ser. B Methodol. 34, 187–202. doi:10.1111/j.2517-6161.1972.tb00899.x
Eckel-Passow, J. E., Lachance, D. H., Molinaro, A. M., Walsh, K. M., Decker, P. A., Sicotte, H., et al. (2015). Glioma groups based on 1p/19q, idh, and tert promoter mutations in tumors. N. Engl. J. Med. 372, 2499–2508. doi:10.1056/NEJMoa1407279
Gao, Q., Mata, D., Benhamida, J., Lin, A., Yang, S., Jonsson, P., et al. (2020). Genetic and epigenetic landscape of idh-wildtype glioblastomas with fgfr3–tacc3 fusions. Acta Neuropathol. Commun. 8, 192. doi:10.1186/s40478-020-01058-6
García, A., Zuchegna, C., and Bruzzi, M. (2025). Chemotherapeutic nanoparticles for glioblastoma. Front. Oncol. 15, 1641752. doi:10.3389/fonc.2025.1641752
Gerds, T. A., and Schumacher, M. (2006). Consistent estimation of the expected brier score in general survival models with right-censored event times. Biometrical J. 48, 1029–1040. doi:10.1002/bimj.200610301
Graf, E., Schmoor, C., Sauerbrei, W., and Schumacher, M. (1999). Assessment and comparison of prognostic classification schemes for survival data. Statistics Med. 18, 2529–2545. doi:10.1002/(sici)1097-0258(19990915/30)18:17/182529::aid-sim2743.0.co;2-5
Harrell, F. E., Lee, K. L., and Mark, D. B. (1996). Multivariable prognostic models: issues in developing models, evaluating assumptions and adequacy, and measuring and reducing errors. Statistics Med. 15, 361–387. doi:10.1002/(SICI)1097-0258(19960229)15:4⟨361::AID-SIM168⟩3.0.CO;2-4
Hegi, M. E., Diserens, A.-C., Gorlia, T., Hamou, M.-F., de Tribolet, N., Weller, M., et al. (2005). Mgmt gene silencing and benefit from temozolomide in glioblastoma. N. Engl. J. Med. 352, 997–1003. doi:10.1056/NEJMoa043331
Hoerl, A. E., and Kennard, R. W. (1970). Ridge regression: biased estimation for nonorthogonal problems. Technometrics 12, 55–67. doi:10.1080/00401706.1970.10488634
Hosmer, D. W., Lemeshow, S., and May, S. (2008). Applied survival analysis: regression modeling of time-to-event data. 2nd edn. John Wiley & Sons.
Ishwaran, H., and Kogalur, U. B. (2010). Consistency of random survival forests. Statistics & Probab. Lett. 80, 1056–1064. doi:10.1016/j.spl.2010.02.020
Ishwaran, H., Kogalur, U. B., Blackstone, E. H., and Lauer, M. S. (2008). Random survival forests. Ann. Appl. Statistics 2, 841–860. doi:10.1214/08-AOAS169
Joyce, L. J., and Lindsay, A. J. (2024). A systematic computational analysis of the endosomal recycling pathway in glioblastoma. Biochem. Biophysics Rep. 38, 101700. doi:10.1016/j.bbrep.2024.101700
Kalbfleisch, J. D., and Prentice, R. L. (2002). The statistical analysis of failure time data. 2nd edn. John Wiley & Sons.
Kim, H., Zheng, S., Amini, S. S., Virk, S. M., Mikkelsen, T., Brat, D. J., et al. (2015). Whole-genome and multisector exome sequencing of primary and post-treatment glioblastoma reveals patterns of tumor evolution. Genome Res. 25, 316–327. doi:10.1101/gr.180612.114
Klein, J. P., and Moeschberger, M. L. (2003). Survival analysis: techniques for censored and truncated data. 2nd edn. Springer.
Koyama-Nasu, R., Nasu-Nishimura, Y., Todo, T., Ino, Y., Saito, N., Aburatani, H., et al. (2013). The critical role of cyclin d2 in cell cycle progression and tumorigenicity of glioblastoma stem cells. Oncogene 32, 3840–3845. doi:10.1038/onc.2012.399
Liu, Y., Huse, J., and Kannan, K. (2025). Expression graph network framework for biomarker discovery. Brief. Bioinform. 26(5), bbaf559. doi:10.1093/bib/bbaf559
Louis, D. N., Perry, A., Reifenberger, G., von Deimling, A., Figarella-Branger, D., Cavenee, W. K., et al. (2016). The 2016 world health organization classification of tumors of the central nervous system: a summary. Acta Neuropathol. 131, 803–820. doi:10.1007/s00401-016-1545-1
Molinaro, A. M., Taylor, J. W., Wiencke, J. K., and Wrensch, M. R. (2019). Genetic and molecular epidemiology of adult diffuse glioma. Nat. Rev. Neurol. 15, 405–417. doi:10.1038/s41582-019-0220-2
Monteiro, A. R., Hill, R., Pilkington, G. J., and Madureira, P. A. (2017). The role of hypoxia in glioblastoma invasion. Cells 6, 45. doi:10.3390/cells6040045
Neftel, C., Laffy, J., Filbin, M. G., Hara, T., Shore, M. E., Rahme, G. J., et al. (2019). An integrative model of cellular states, plasticity, and genetics for glioblastoma. Cell 178, 835–849. doi:10.1016/j.cell.2019.06.024
Park, J. K., Hodges, T., Arko, L., Shen, M., Iacono, D. D., McNabb, A., et al. (2010). Scale to predict survival after surgery for recurrent glioblastoma multiforme. J. Clin. Oncol. 28, 3838–3843. doi:10.1200/JCO.2010.30.0582
Pölsterl, S., Navab, N., and Katouzian, A. (2015). “Fast training of support vector machines for survival analysis,” in Machine learning and knowledge discovery in databases. Editors A. Appice, P. P. Rodrigues, V. S. Costa, J. Gama, A. Jorge, and C. Soares (Springer), 243–259. doi:10.1007/978-3-319-23525-7_15
Ran, X., Zheng, J., Chen, L., Xia, Z., Wang, Y., Sun, C., et al. (2024). Single–cell transcriptomics reveals the heterogeneity of the immune landscape of idh–wild–type high–grade gliomas. Cancer Immunol. Res. 12, 232–246. doi:10.1158/2326-6066.CIR-23-0211
Royston, P., and Altman, D. G. (2013). External validation of a cox prognostic model: principles and methods. BMC Med. Res. Methodol. 13, 33. doi:10.1186/1471-2288-13-33
Serres, E., Debarbieux, F., Stanchi, F., Maggiorella, L., Grall, D., Turchi, L., et al. (2014). Fibronectin expression in glioblastomas promotes cell cohesion, collective invasion of basement membrane in vitro and orthotopic tumor growth in mice. Oncogene 33, 3451–3462. doi:10.1038/onc.2013.305
Simon, N., Friedman, J., Hastie, T., and Tibshirani, R. (2011). Regularization paths for cox’s proportional hazards model via coordinate descent. J. Stat. Softw. 39, 1–13. doi:10.18637/jss.v039.i05
Stupp, R., Taillibert, S., Kanner, A., Read, W., Steinberg, D. M., Lhermitte, B., et al. (2017). Effect of tumor-treating fields plus maintenance temozolomide vs maintenance temozolomide alone on survival in patients with glioblastoma: a randomized clinical trial. JAMA 318, 2306–2316. doi:10.1001/jama.2017.18718
Sulzmaier, F. J., Jean, C., and Schlaepfer, D. D. (2014). Fak in cancer: mechanistic findings and clinical applications. Nat. Rev. Cancer 14, 598–610. doi:10.1038/nrc3792
Therneau, T. M., and Grambsch, P. M. (2000). Modeling survival data: extending the cox model. Springer.
Tibshirani, R. (1996). Regression shrinkage and selection via the lasso. J. R. Stat. Soc. Ser. B Methodol. 58, 267–288. doi:10.1111/j.2517-6161.1996.tb02080.x
Tibshirani, R. (1997). The lasso method for variable selection in the cox model. Statistics Med. 16, 385–395. doi:10.1002/(SICI)1097-0258(19970228)16:4385::AID-SIM3803.0.CO;2-3
Vredenburgh, J. J., Desjardins, A., Herndon, J. E., Marcello, J., Reardon, D. A., Quinn, J. A., et al. (2007). Bevacizumab plus irinotecan in recurrent glioblastoma multiforme. J. Clin. Oncol. 25, 4722–4729. doi:10.1200/JCO.2007.12.2440
Wang, Y., Wang, Y., Li, J., Zhang, Y., Yin, H., and Han, B. (2015). Crnde, a long noncoding rna, promotes glioma cell growth and invasion through mtor signaling. Cancer Lett. 367, 122–128. doi:10.1016/j.canlet.2015.03.027
Wang, Q., Hu, B., Hu, X., Kim, H., Squatrito, M., Scarpace, L., et al. (2017). Tumor evolution of glioma-intrinsic gene expression subtypes associates with immunological changes in the microenvironment. Cancer Cell 32, 42–56. doi:10.1016/j.ccell.2017.06.003
Wei, L. J. (1992). The accelerated failure time model: a useful alternative to the cox regression model in survival analysis. Statistics Med. 11, 1871–1879. doi:10.1002/sim.4780111409
Weller, M., van den Bent, M., Preusser, M., Rhun, E. L., Tonn, J. C., Minniti, G., et al. (2021). Eano guidelines on the diagnosis and treatment of diffuse gliomas of adulthood. Nat. Rev. Clin. Oncol. 18, 170–186. doi:10.1038/s41571-020-00447-z
Zhou, Y., Schoof, M., Godbole, S., Albert, T., Walter, C., Qin, N., et al. (2023). Mouse models of pediatric high-grade gliomas with mycn amplification define an aggressive idh-wildtype-like phenotype. Nat. Commun. 14, 43564. doi:10.1038/s41467-023-43564-w
Keywords: IDH wild-type glioma, gene expression, biomarkers, tumor recurrence, survival analysis, network
Citation: Liu Y, Huse J and Kannan K (2025) A network-based discovery of prognostic markers in recurrent IDH wild-type gliomas. Front. Genet. 16:1672015. doi: 10.3389/fgene.2025.1672015
Received: 23 July 2025; Accepted: 27 October 2025;
Published: 20 November 2025.
Edited by:
Hiep Thi Nguyen, International University, VietnamReviewed by:
Huong T. T. Ha, Vietnam National University, VietnamLua Ngo, International University, Vietnam
Copyright © 2025 Liu, Huse and Kannan. This is an open-access article distributed under the terms of the Creative Commons Attribution License (CC BY). The use, distribution or reproduction in other forums is permitted, provided the original author(s) and the copyright owner(s) are credited and that the original publication in this journal is cited, in accordance with accepted academic practice. No use, distribution or reproduction is permitted which does not comply with these terms.
*Correspondence: Kasthuri Kannan, a2FzdGh1cmlAZ21haWwuY29t