 Yongfu Zou
 Yusong Lu
 Shanghui Lu1
 Shuilin Liao
 Rui Miao
- 1School of Mathematics and Physics, Hechi University, Hechi, China
- 2Department of Neurosurgery, The Second Nanning People’s Hospital, Nanning, China
- 3Basic Teaching Department, Zhuhai Campus of Zunyi Medical University, Zhuhai, China
- 4Faculty of Innovation Enginee, Macau University of Science and Technology, Taipa, China
- 5School of Tourism and Culture, Nanning Normal University, Nanning, China
Introduction: Recent biomedical studies have highlighted the pivotal role of non-coding RNAs (ncRNAs) in gene regulatory networks, where they influence gene expression, cellular function, and the onset and progression of various diseases. Among these, small nucleolar RNAs (snoRNAs), a prominent class of small ncRNAs, have attracted considerable research attention over the past two decades. Initially recognized for their involvement in rRNA processing and modification, snoRNAs are now understood to contribute to broader biological processes, including the regulation of disease mechanisms, maintenance of cellular homeostasis, and development of targeted therapeutic strategies. With ongoing advancements, snoRNAs are increasingly regarded as promising candidates for novel therapeutic agents in cancer, neurodegenerative disorders, endocrine conditions, and cardiovascular diseases. Consequently, there is a growing demand for efficient, cost-effective, and environment-independent approaches to study snoRNAs, which has driven the adoption of computational methodologies in this domain.
Methods: In this work, we propose a novel predictive framework, CGSDA, which integrates a ChebNetII convolutional network with a gated graph sequence neural network to identify potential snoRNA–disease associations. The model begins by constructing a snoRNA–disease association network, embedding residual mechanisms into both modules to effectively capture the representations of snoRNAs and diseases. These representations are then fused and dimensionally reduced, after which the refined embeddings are fed into a predictor to generate association predictions.
Results: Experimental evaluation demonstrates that CGSDA consistently outperforms baseline models in predictive accuracy. Ablation experiments were conducted to assess the contribution of each module, confirming that all components substantially enhance overall performance and validating the robustness of the proposed method. Furthermore, case studies on lung cancer and breast cancer showed that 10 out of the top 15 and 12 out of the top 15 predicted snoRNA-disease associations were validated by existing literature, respectively, confirming the model’s effectiveness in identifying potential novel snoRNA-disease associations.
Discussion: The implementation of CGSDA, along with relevant datasets, is publicly available at: https://github.com/cuntjx/CGSDA. This public release enables the research community to further validate and apply the framework, supporting advancements in computational identification of snoRNA–disease associations and facilitating progress in snoRNA-based therapeutic development, and ultimately benefiting human health.
1 Introduction
SnoRNAs are a class of ncRNAs predominantly located in the nucleolus of eukaryotic cells, where they play critical roles in RNA modification. They are generally categorized into two major groups: H/ACA box snoRNAs and C/D box snoRNAs. H/ACA box snoRNAs are primarily responsible for guiding pseudouridylation, whereas C/D box snoRNAs direct site-specific methylation. Accumulating evidence indicates that methylation and pseudouridylation, both mediated by snoRNAs, are essential processing steps in the maturation of precursor rRNA into functional rRNA. Notably, a single snoRNA molecule typically serves as a guide for no more than two individual RNA modification sites. Beyond these canonical functions, some snoRNAs also exhibit non-traditional roles; for example (Ender et al., 2008; Babiarz et al., 2008; Taft et al., 2009), and HBII-180C (Ono et al., 2010) can function as microRNAs (miRNAs).
1.1 SnoRNA involmente in disease
Emerging evidence demonstrates that snoRNAs are differentially expressed and participate in key biological processes such as apoptosis, proliferation, and differentiation. Owing to their multidimensional regulatory functions, elucidating the molecular mechanisms through which snoRNAs influence disease development has become a major frontier in biomedical research over the past 2 decades. For instance, Tang et al. (2019) investigated the role of snoRNAs in non-small cell lung cancer (NSCLC) using both in vitro and in vivo loss-of-function analyses. Their study revealed that SNORA71A functions as an oncogene in NSCLC and contributes to disease progression. Similarly, Liu et al. (2022) examined the role of SNORD1C in colorectal cancer through multiple experimental approaches, demonstrating that this snoRNA is involved in several tumor-related processes and plays a critical role in cancer progression. Xu et al. (2014) employed quantitative RT-PCR to assess snoRNA expression in tissue samples from over one hundred hepatocellular carcinoma (HCC) patients, further validating their findings using cell-based experiments and a xenograft nude mouse model. Their results showed that upregulation of SNORD113-1 inhibited HCC growth, suggesting its potential utility as both a diagnostic biomarker and therapeutic target. Beyond these individual studies, a growing body of evidence underscores the involvement of snoRNAs in diverse human diseases. In 2022, Huang et al. (2022) published a systematic review summarizing the biological functions and mechanistic roles of snoRNAs in tumor pathophysiology. Subsequently, Chabronova et al. (2024) provided a comprehensive review focusing on snoRNAs in cardiovascular development, physiology, and heart-related disorders. Their work not only consolidated current findings but also highlighted the potential clinical applications of snoRNAs in cardiovascular medicine. In the same year, Shen et al. (2024) conducted another systematic review that emphasized the diagnostic and therapeutic significance of snoRNAs across multiple disease contexts.
In addition to studies on human diseases, several investigations have explored the association between snoRNAs and animal pathologies (Omonijo et al., 2023; Regårdh et al., 2022; Anderson et al., 2022). Such cross-species comparative studies not only confirm the broad involvement of snoRNAs in disease processes across species but also help elucidate the conserved functional mechanisms of snoRNAs in disease development. Therefore, exploring the association between snoRNAs and diseases can help reveal the complex mechanisms of disease occurrence and development and, ultimately, benefit clinical applications.
1.2 Computational approaches for snoRNA–disease association prediction
As a methodological system characterized by high efficiency in processing large-scale data, strong scalability, and cross-domain adaptability, computational approaches have become deeply embedded in multidisciplinary and interdisciplinary research fields such as bioinformatics, drug discovery, and systems biology. These methods, supported by the rapid improvement in the cost–performance ratio of computational resources and the iterative advancement of deep learning architectures, now represent a central paradigm for the integration and analysis of multimodal data. In the context of snoRNA–disease association prediction, computational methods have been extensively applied, offering advantages of low cost, high timeliness, and broad generalizability when used as guidance tools. To the best of our knowledge, the first computational framework developed for this purpose was the iSnoDi-LSGT model, proposed by Zhang and Liu (2022). This model integrates dual constraints with topological node embeddings to predict potential snoRNA–disease associations. Building upon this foundation, several computational frameworks have since emerged. For example, Sun et al. (2022) introduced the PSnoD model, which draws inspiration from matrix completion techniques. Their framework constructs three networks and incorporates bounded nuclear norm regularization into a matrix completion strategy to enhance prediction Acc. Momanyi et al. (2024) proposed SAGESDA, a graph neural network–based approach that fuses multiple networks to build snoRNA–disease heterogeneous networks. They then applied the GraphSAGE algorithm to learn node representations, followed by a dot product classifier for association inference.
Zhang et al. further advanced the field by developing GCLSDA, a method based on a lightweight graph convolutional network (GCN). This approach first extracts node representations of snoRNAs and diseases via a light GCN (LightGCN), and then applies a contrastive learning mechanism to mitigate the challenges of sparse correlation matrices and node embedding over-smoothing, thereby improving model performance (Zhang et al., 2023). Similar GCN-based or variant methods include GCNSDA (Liu et al., 2021), GCASDA (Liu et al., 2024) and IGCNSDA (Hu et al., 2024). Beyond GCNs, Muna et al. (2025) proposed GBDTSVM, a hybrid framework combining two classical machine learning algorithms: gradient-boosted decision trees (GBDT) and support vector machines (SVM). In this method, GBDT is used to extract node features, which are subsequently passed to the SVM classifier for snoRNA–disease prediction. More recently, La Rosa et al. proposed GL4SDA, a novel framework that integrates multiple modalities. This model derives snoRNA representations from their secondary structures, leverages large language models (LLMs) to generate disease features, and finally employs a graph neural network with an attention mechanism to predict snoRNA–disease associations. As shown in Table 1, we have provided a brief summary of the state-of-the-art methods.

Table 1. The brief summary of the state-of-the-art methods.
Although the past 2 decades have yielded substantial evidence supporting snoRNA–disease associations, the systematic collection of relevant data has lagged behind. This limitation has hindered the effective application of computational methods in this field, as these approaches typically require large-scale datasets to achieve optimal performance. Consequently, the relatively limited availability of high-quality data has been one of the key factors restricting broader computational applications in snoRNA–disease association prediction. Furthermore, there are relatively few high-performance models in the field of snoRNA-disease association prediction, and most of them adopt a single graph neural network for feature extraction or association prediction, which may bring the following adverse impacts on model performance. First, the over-smoothing of graph neural networks can degrade model performance. Second, relying solely on one type of neural network for feature extraction may exert an adverse impact on model performance due to the learning bias of the neural network. To address this gap and to further advance the development and optimization of predictive models, we propose a novel framework, CGSDA, designed to identify potential snoRNA–disease associations. CGSDA integrates two GNN modules: the ChebNetII convolutional network (ChebNetII) and gated graph convolutional network (Gated). The framework operates in three main stages. First, a snoRNA–disease association network is constructed, with a residual mechanism embedded into both modules to alleviate over-smoothing during representation learning. Next, the node embeddings learned by the two graph neural network modules are fused and subjected to dimensionality reduction, aiming to mitigate the adverse impact of the learning bias of a single neural network on model performance. Finally, the reduced-dimensional representations are passed into an inner product decoder to generate predictions of potential snoRNA–disease associations. Comparative experiments demonstrate that CGSDA consistently outperforms baseline models in prediction Acc. Furthermore, ablation studies reveal that each component of the framework contributes significantly to overall performance, thereby confirming the effectiveness and robustness of the proposed model.
2 Materials and methods
2.1 Dataset
In this study, two datasets (i.e., dataset SDAD and dataset MNDR) were employed. Specifically, Dataset SDAD was curated by La Rosa et al. (2025) and served as a subset of the RNADisease v4.0 database. SDAD encompasses 60 diseases, 384 snoRNAs, and 911 experimentally validated snoRNA-disease associations. Dataset MNDR, by contrast, was collected by Sun et al. (2022), and it contains 27 diseases, 220 snoRNAs, and 459 experimentally validated snoRNA-disease associations. Detailed information about the SDAD dataset is available at https://github.com/BCB4PM/GL4SDA. Dataset MNDR can be downloaded from https://github.com/linDing-groups/PSnoD or https://github.com/mariamuna04/gbdtsvm. We place the basic information of the two datasets in Table 2. In this work, we represent the snoRNA–disease association network as a graph, where snoRNAs and diseases serve as the nodes. We use
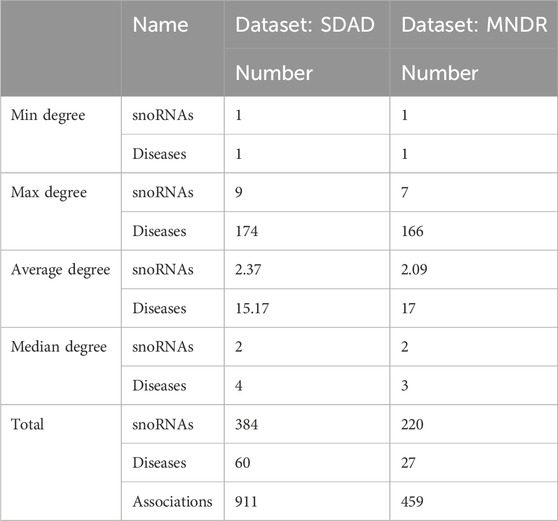
Table 2. The basic information about SDAD and MNDR dataset.
During the training phase, all experimentally validated snoRNA–disease associations are treated as positive samples, while the remaining unobserved pairs are regarded as negative samples. To construct the training set, a subset of the positive samples is randomly removed from the original snoRNA–disease association matrix
2.2 Initial features of snoRNA
There are numerous methods for extracting features from RNA molecules, and the choice of method can significantly influence downstream tasks. Among them, the k-mer algorithm is one of the most widely used approaches due to its efficiency and broad applicability. It is implemented in several feature extraction tools such as Jellyfish, KMC, and Kraken. The k-mer algorithm has two key capabilities: (1) it counts k-mer occurrence frequencies to capture sequence composition patterns, repetitive regions, and mutation hotspots; and (2) it can be adapted to different applications by varying the value of k. For instance, setting
One such method is nRC, a tool specifically developed by Fiannaca et al. (2017) for non-coding RNA (ncRNA) feature extraction, differs from other methods that overlook ncRNA structural features in that it can integrate the secondary structure information of ncRNAs into feature representation, thereby improving feature quality. Previous studies (e.g., La Rosa et al. (2025)) have verified that nRC outperforms baseline methods in ncRNA-related prediction tasks, confirming its suitability for snoRNA feature extraction. Therefore, we directly used the features extracted by nRC as the initial features of snoRNAs in the CGSDA model.
2.3 Initial features of disease
There are multiple approaches to representing disease features. One of the earliest methods was one-hot encoding based on disease categories. However, while effective for simple classification, this representation has shown limited performance in more complex tasks. Another widely adopted approach is disease semantic similarity, introduced by Xuan et al. (2013), Schriml et al. (2012), which leverages the MeSH database (https://www.ncbi.nlm.nih.gov/) to compute ontology-based similarity between diseases (Lu et al., 2022; Ouyang et al., 2024). This method has since been applied extensively across several studies. Importantly, many diseases are described in detail through textual resources, including clinical manifestations, pathogenic mechanisms, diagnostic criteria, classification schemes, and progression patterns. These textual descriptions capture rich and evolving knowledge about diseases, yet traditional feature extraction methods often overlook this valuable source of information.
Large Language Models (LLMs) can effectively understand the contextual information of text and generate corresponding numerical features as needed. The bge-icl-en tool, developed by Li et al. (2024) from the Beijing Academy of Artificial Intelligence (BAAI), is capable of converting English textual information into word embeddings. This tool adopts an open-source model and can be downloaded and deployed by users via https://github.com/FlagOpen/FlagEmbedding. We chose to generate the initial features of diseases by inputting the textual summaries of diseases from the MalaCards database (Rappaport et al., 2013) into the bge-icl-en tool, based on the two key considerations.
First, the MalaCards database (https://www.malacards.org/) integrates dozens of data sources and provides detailed textual descriptions for more than 16,000 human diseases. The textual information about the disease in MalaCards, including the status and classification of the disease, pathogenesis, characteristics and impacts of the disease, etiology and risk factors, preventive interventions, disease management and prognosis, contains rich semantic details, which are crucial for distinguishing disease characteristics. Unlike traditional methods (e.g., one-hot encoding, ontology-based semantic similarity), LLMs (such as bge-icl-en) can capture contextualized semantic information, avoiding the limitations of disease feature representation.
Second, the bge-icl-en tool has demonstrated excellent performance in multiple text embedding benchmark tests (Li et al., 2024) and supports open-source deployment, which not only ensures the accuracy of disease feature extraction but also guarantees the reproducibility of experimental results.
Specifically, we used the “Summary” field in the disease entries of MalaCards as the input to bge-icl-en, and the generated embedding vectors were used as the initial features of diseases.
2.4 CGSDA
Spectral convolutional networks represent an important class of graph neural networks with broad applications across diverse tasks. Among the most representative models are ChebNet (Defferrard et al., 2016) and GCN (Kipf and Welling, 2016), both of which perform spectral graph convolutions using Chebyshev polynomials. Notably, GCN can be viewed as a simplified variant of ChebNet, as it relies only on the first two Chebyshev polynomials. Despite this simplification, GCN often outperforms ChebNet in practice. To address this limitation, the ChebNetII model was introduced, which enhances Chebyshev polynomial approximation through Chebyshev interpolation, thereby mitigating the Runge phenomenon and improving model performance. Given its demonstrated superiority over baseline models, we adopted ChebNetII in this study to extract feature representations of snoRNAs and diseases.
Li et al. (2015) integrated gated loop units, optimization techniques, and graph neural networks to propose GGNNs, which are more effective than traditional sequence models in extracting node embeddings from graphs. As is well known, deep learning models exhibit “preference learning” toward certain samples. To enhance both performance and robustness, we combine the ChebNetII model with the Gated model, introducing the CGSDA framework for predicting potential snoRNA–disease associations. The overall structure of the CGSDA model is illustrated in Figures 1, 3. At a high level, the core process of the model can be divided into three main steps.
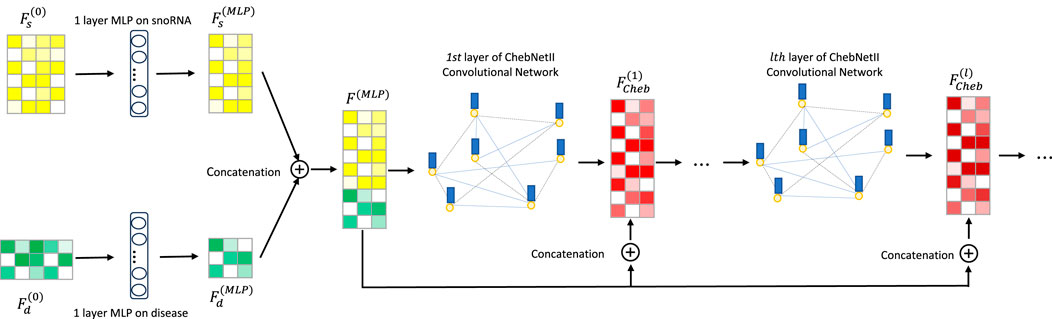
Figure 1. The overview of CGSDA framework. Embedding extracted by ChebNetII.
Step 1. The initial features of snoRNAs and diseases are first passed through a single-layer multilayer perceptron (MLP) for dimensionality reduction. The resulting downscaled features are then concatenated and input into the multilayer ChebNetII network. To mitigate the negative effects of the “oversmoothing” problem commonly observed in graph neural networks, we introduce a residual mechanism that concatenates the downscaled representations with the inputs of each ChebNetII layer. Finally, the output of the terminal ChebNetII layer is fed into another single-layer MLP for further refinement and dimensionality reduction of the node embeddings, yielding the final output
Step 2. In this step, the ChebNetII module is replaced with the Gated module, while following a similar process to extract snoRNA and disease features. Specifically, the initial features of snoRNAs and diseases are first reduced in dimension using a single-layer MLP. To address the oversmoothing issue in GNNs and its adverse effect on model performance, the reduced features are then concatenated into the multilayer GGNN, enhanced with a residual mechanism. After processing, the Gated module produces the final output

Figure 2. The overview of CGSDA framework. Embedding extracted by gated graph sequence neural networks.
Step 3. In the final step, the embeddings
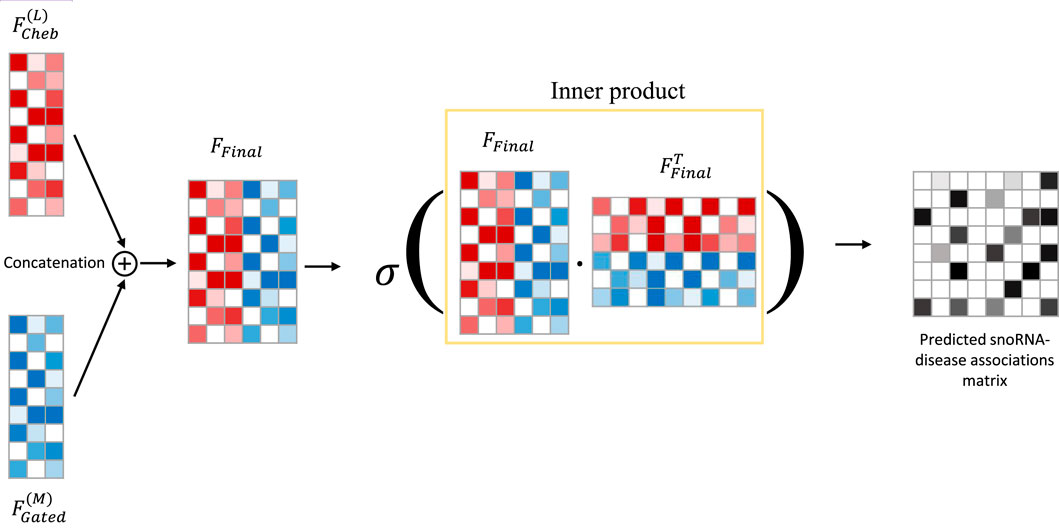
Figure 3. The overview of CGSDA framework. Embedding fusions and predicting potential snoRNA-disease associations.
2.4.1 Embedding extracted by ChebNetII
To accommodate both the ChebNetII and Gated modules, we define the association matrix and the initial feature representations using Equations 2, 3. Specifically,
For the ChebNetII module, the process of learning node embeddings can be formally expressed as Equations 4:
In this equation,
2.4.2 Embedding extracted by GatedGCN
Similar to the ChebNetII module, the GatedGCN module begins by feeding the initial features of snoRNAs and diseases into a single-layer MLP for learning and dimensionality reduction. The resulting feature representations are then concatenated and reintroduced into the GatedGCN network to generate node embeddings. The learning process of node representations within the convolutional layers of the GatedGCN network can be formally described by Equations 5–7:
Where
Where
2.4.3 Residual mechanism and feature fusion
To mitigate the negative impact of “oversmoothing” on GNN performance, we incorporate a residual mechanism into the CGSDA model. As illustrated in Figure 1, the output features of the single-layer MLP are directly connected to the inputs of each layer in both the ChebNetII and GatedGCN modules. This operation can be formally expressed by Equations 12, 13.
Deep learning models often exhibit a “preferential learning” bias toward certain samples, which can negatively affect overall performance. To address this issue and enhance both the performance and robustness of the model, we fuse the embeddings obtained from the ChebNetII and GatedGCN modules, as defined in Equation 14.
Where
2.4.4 Inner product decoder
After obtaining the final fused embeddings via Equation 14, we employed an inner product decoder to compute the predicted score for potential snoRNA-disease associations–this score quantifies the likelihood of a functional association between a given snoRNA and disease, serving as the core output of the CGSDA model for both training and inference. The calculation of the predicted score can be formalized in Equation 15:
where
During model optimization, we used the predicted scores
2.5 Evaluation measures
Given that our work involves binary prediction in the field of snoRNA-disease association prediction and considers evaluating model performance across multiple dimensions, we employed seven widely used performance metrics. These are AUC, AUPR, F1 score (F1), Acc., Recall (Rec.), Specificity (Spe.), and Precision (Pre.). These values range between [0,1], with values closer to one indicating superior model performance. Among them, AUC quantifies a model’s ability to distinguish positive samples from negative samples; a value closer to one signifies better discrimination capability. AUPR serves as a complementary metric to AUC, typically reflecting the model’s balance between “prediction reliability” and “association capture completeness”. A value closer to one indicates superior overall performance in both aspects. The F1 score is the harmonic mean of precision and recall, aiming to balance these two metrics. A high F1 score indicates the model avoids both excessive false positives and false negatives. Precision is the proportion of correctly classified samples out of all samples, reflecting the overall prediction accuracy of the model. Recall measures the model’s ability to capture all true positive associations; high recall ensures the model does not overlook potential snoRNA-disease associations. Specificity quantifies the model’s ability to correctly identify non-associations. Complementary to recall, it ensures the model does not mislabel unconfirmed pairs as associations, thereby reducing unnecessary experimental validation burdens. Precision measures the proportion of predicted positive associations that are actually true. High precision indicates that the model’s top-ranked predictions possess high reliability.
3 Results
3.1 Parameters tuning and performance evaluation
CGSDA was implemented using PyTorch and PyG, and all experiments were conducted on an NVIDIA GeForce GTX 4060 GPU. To evaluate its predictive performance, we applied 10-fold cross-validation (10CV). Consistent with other deep learning–based association prediction methods, all experimentally verified associations were treated as positive samples, while unverified associations were regarded as negative samples during training. To mitigate the adverse effects of sample imbalance on model performance, we ensured that the number of positive and negative samples remained equal throughout the training phase.
The results of the 10-fold Cross-Validations (10CV) are detailed in Table 3. As presented in Table 3, the proposed computational method achieved an average AUC of 98.22
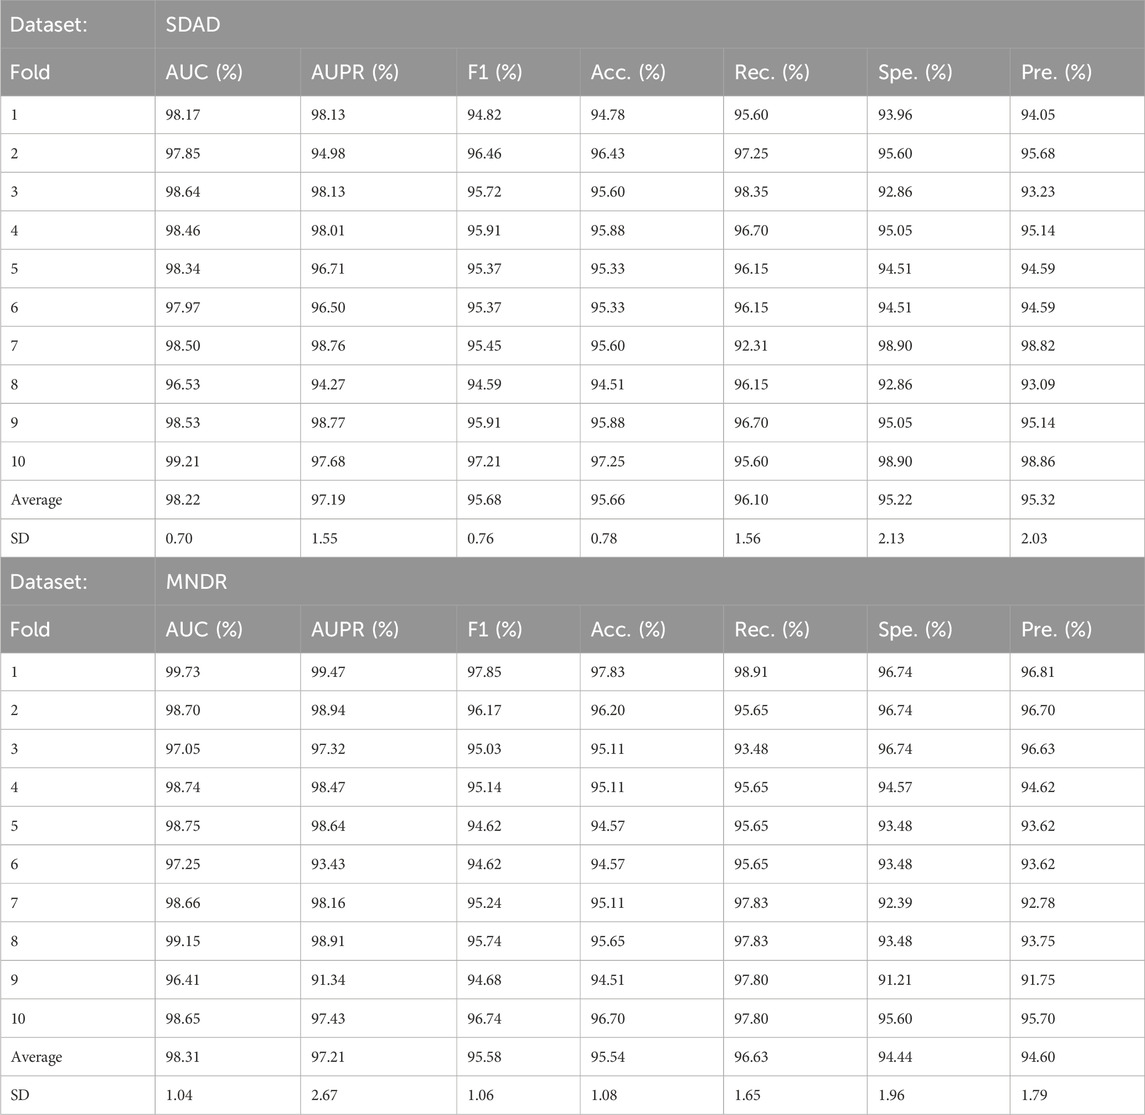
Table 3. Ten-fold cross-validation results performed by CGSDA based on SDAD and MNDR.
3.2 Comparative performance with other latest methods based on 10CV
To further evaluate the performance of CGSDA, we conducted comparative experiments. In these experiments, we selected comparative models based on three criteria: (1) methodological diversity (covering matrix processing methods, GNNs, traditional machine learning, and large language model-integrated approaches) to validate the advantages of CGSDA across different paradigms; (2) recency (all published between 2021 and 2025) to ensure alignment with current research progress; and (3) relevance (explicitly designed for snoRNA-disease association prediction rather than general non-coding RNA-disease tasks). Based on these criteria, we identified nine baseline models, with a brief description of these models provided in Table 1. This comparison was conducted using 10-fold cross-validation on both the SDAD and MNDR datasets. The performance metrics for each model are presented in Table 4. It can be observed that our CGSDA model achieved the highest performance metrics on both datasets. Specifically, on the SDAD dataset, the AUC and AUPR values reached 98.22
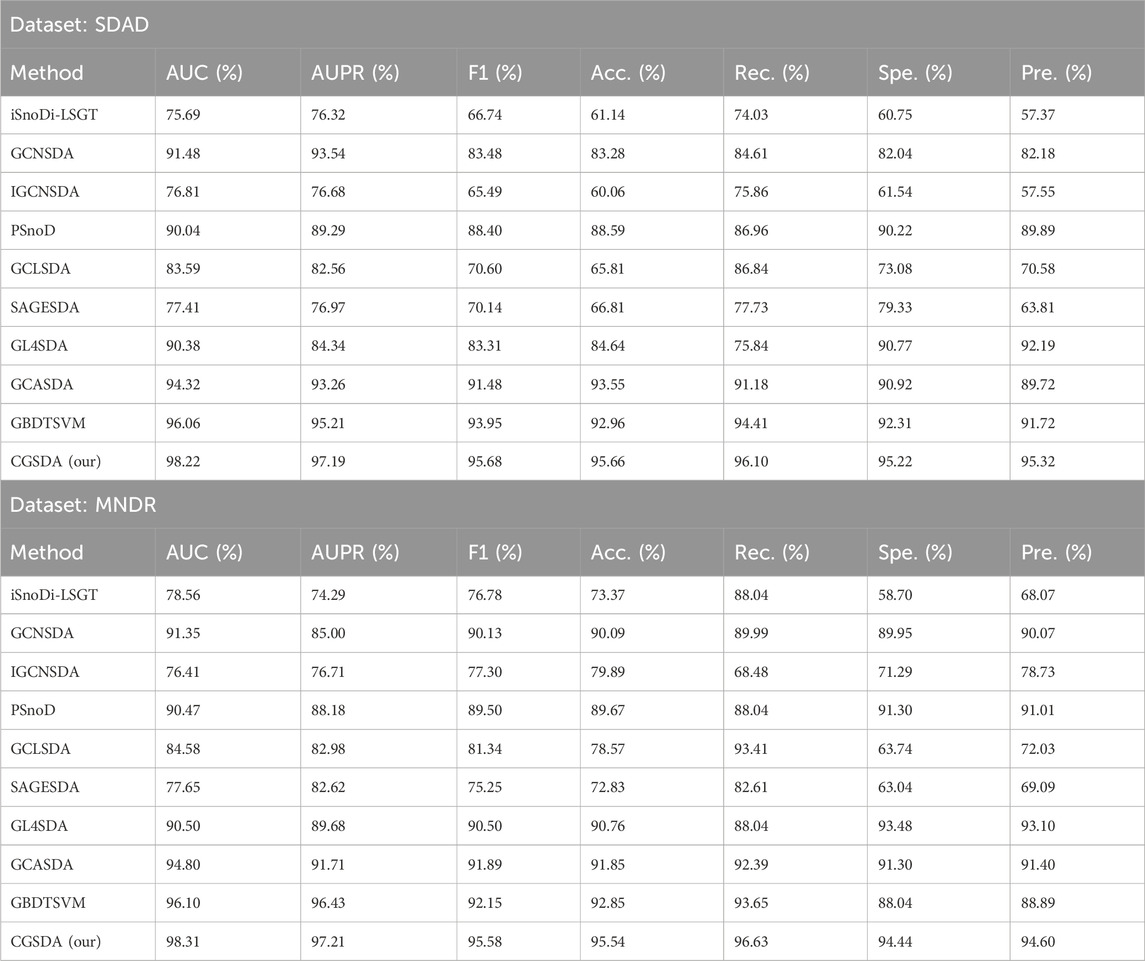
Table 4. The comparison results of CGSDA model and other state-of-the-art models based on ten-fold cross-validation.
3.3 Parameters tuning
The parameters of our model can be categorized into four groups: (1) ChebNetII module parameters, including the number of network layers and the order of Chebyshev polynomials. (2) GatedGCN module parameters, such as the number of network layers and the sequence length of GatedGraphConv. (3) Output dimensionality of the network layers. (4) Training parameters, including learning rate, weight decay, dropout rate, and the number of training epochs. In this section, we will conduct systematic parameter tuning based on the SDAD dataset to examine the impact of the aforementioned four parameter categories on model performance and determine the optimal parameter settings for our framework.
3.3.1 Optimizable parameters in the ChebNetII module
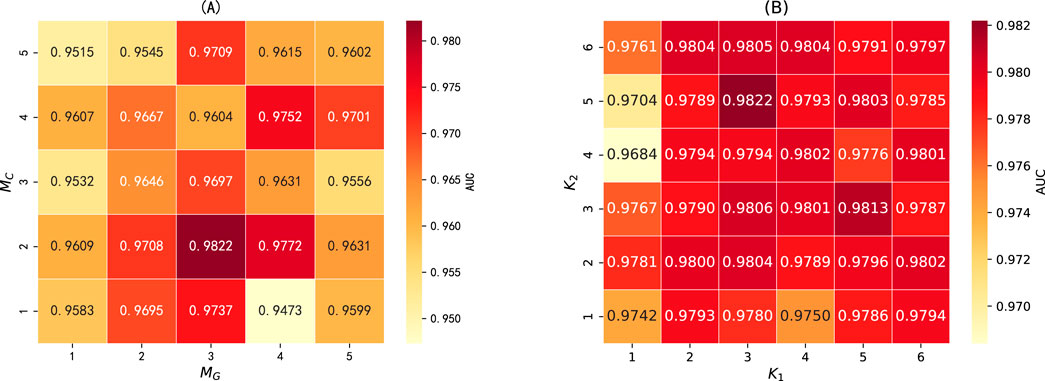
Figure 4. (A) The number of network layers in the ChebNetII and GatedGCN modules, where M_C and M_G represent the number of network layers in the ChebNetII module and GatedGCN module, respectively. (B) The order of Chebyshev polynomials, where K_1 and K_2 represent the order of the 1st layer and 2nd layer of the ChebNetII network, respectively.
3.3.2 Optimizable parameters in the GatedGCN module
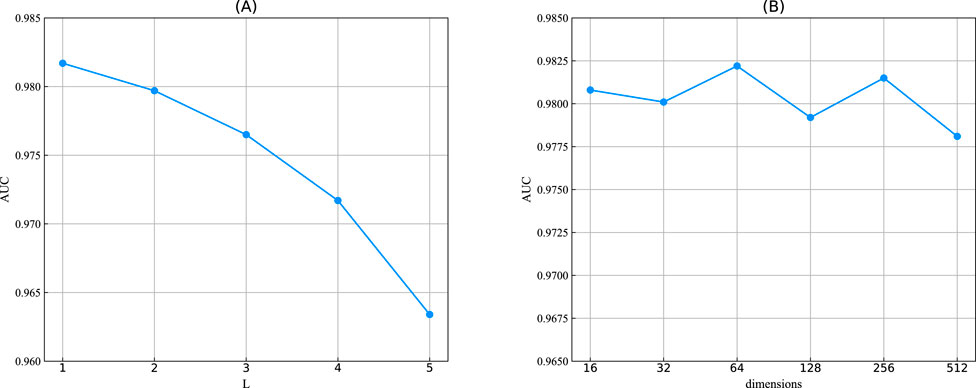
Figure 5. (A) The sequence length of the convolutional layer in the GatedGCN module, denoted by L. (B) The output dimensions of two modules.
3.3.3 Optimization of network output dimensions and model training parameters
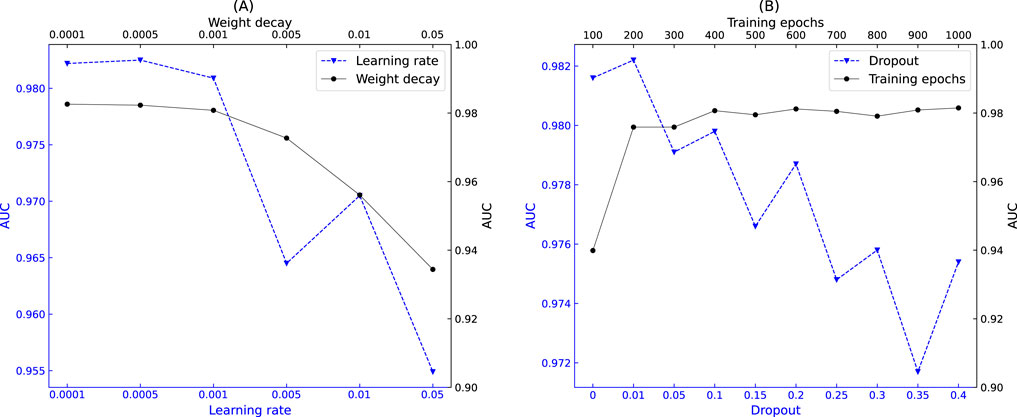
Figure 6. Impact of hyperparameters on model performance. (A) Relationship between learning rate, weight decay, and AUC. (B) Relationship between training epochs, dropout rate, and AUC.
3.4 Ablation tests
As noted earlier, our model primarily consists of two modules, ChebNetII and GatedGCN, with the residual mechanism incorporated into both. To evaluate the contribution of each component to overall performance, we designed three sets of ablation experiments based on the SDAD dataset. In the first group, CGSDA-C, the ChebNetII module was removed; in the second group, CGSDA-G, the GatedGCN module was removed; and in the third group, CGSDA-RES, the residual mechanism was removed.
We conducted ablation experiments using 10CV, and the results are summarized in Table 5. The findings show that removing individual components of the CGSDA model leads to a decline in overall performance. Specifically: (1) In comparison with CGSDA-C and CGSDA-G, the complete CGSDA model demonstrates that combining the two GNN modules effectively alleviates the negative impact of “preferential learning” on sample performance in deep learning models. (2) The inclusion of the residual mechanism significantly mitigates the oversmoothing problem in both modules, thereby enhancing overall model performance.
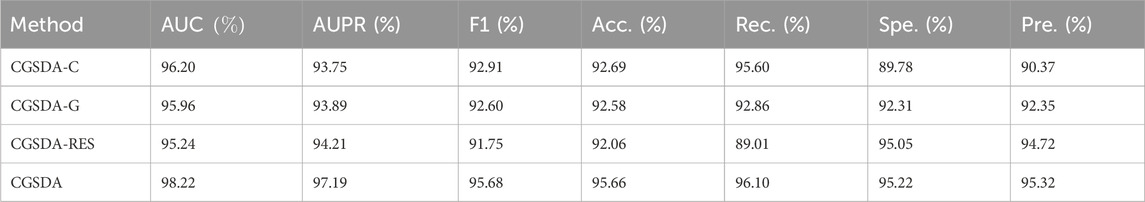
Table 5. Ablation tests.
4 Case study
To validate the predictive ability of our computational framework for novel snoRNA–disease associations in real-world applications and to assess its validity and reliability, we designed two case studies. The first evaluates the model’s predictive power for previously unseen diseases, while the second examines its ability to predict novel snoRNA–disease associations. The second case study follows a similar design to GL4SDA (La Rosa et al., 2025), GBDTSVM (Muna et al., 2025), and GCASDA (Liu et al., 2024), which predict new associations while retaining all existing snoRNA–disease pairs. In this work, we selected “lung cancer (DOID:1324)” and “breast cancer (DOID:1612)” for the first and second case studies, respectively. In the first case study, all snoRNAs associated with the target disease were removed before training, forcing the model to treat the disease as a new entity and predict its associations with all snoRNAs. In the second case study, only the unknown snoRNA–disease associations were treated as the test set. For both case studies, we ranked the prediction scores generated by the CGSDA model and selected the top 15 associations with the highest scores. These candidate associations were then validated through a literature search in the PubMed Biology database using the corresponding snoRNA–disease pairs as keywords. If an association was confirmed, it was annotated with the PMID of the supporting publication; otherwise, it was labeled as Unconfirmed. It should be noted that associations confirmed in the literature can only be used as evidence if they have been validated by experiments.
Lung cancer is a highly malignant disease characterized by poor treatment outcomes and high mortality worldwide. The prognosis depends heavily on the stage at diagnosis: patients with early-stage lung cancer have relatively high 5-year survival rates, whereas those diagnosed at advanced stages face a 5-year survival rate close to
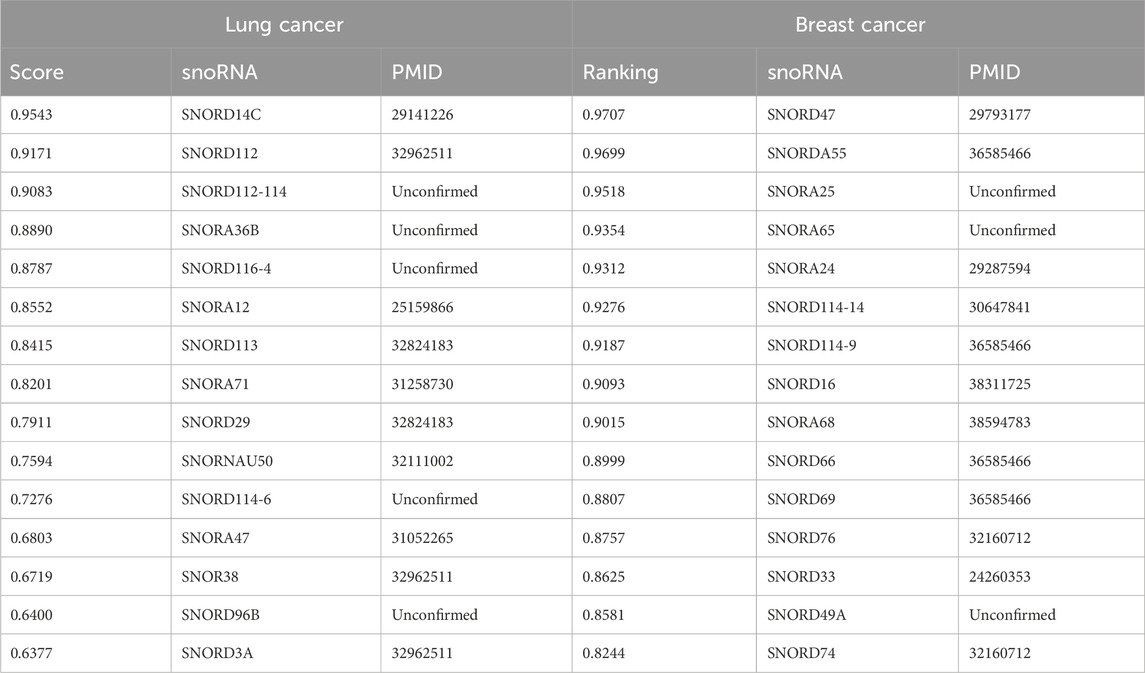
Table 6. The top 15 predicted snoRNAs associated with lung cancer and breast cancer.
Breast cancer is a common malignant tumor among women, though it also affects approximately 1
5 Discussion and conclusion
snoRNAs, an important class of small ncRNAs, have attracted significant research attention over the past 2 decades. Studies of their functions have expanded from their initial roles in rRNA processing and modification to broader areas including disease mechanism regulation, cellular homeostasis, and targeted therapies. With ongoing research, snoRNAs are increasingly recognized as potential sources of novel therapeutic agents for cancer, neurodegenerative disorders, endocrine diseases, and cardiovascular conditions. Accordingly, there is an urgent need for efficient, cost-effective, and environmentally independent methods to study snoRNAs, which has driven the widespread adoption of computational approaches in this field. In this study, we developed CGSDA, a model that integrates the ChebNetII Convolutional Network (ChebII) module with the Gated GCN (Gated) module. The model first constructs a snoRNA–disease association network and incorporates a residual mechanism within both modules to learn the representations of snoRNAs and diseases. These node embeddings are subsequently fused and downscaled before being input into a predictor to infer potential snoRNA–disease associations. Experimental results demonstrate that CGSDA achieves superior predictive performance compared to baseline models. Furthermore, ablation experiments reveal that each component of the model makes a significant contribution to its overall performance, fully validating the effectiveness of the proposed framework.
In the comparative experiments, the CGSDA model exhibited excellent performance across multiple metrics with small standard deviations, demonstrating significant advantages over baseline models and confirming the good robustness of CGSDA. In the two types of case studies conducted, 10 and 12 out of the top 15 associations predicted by our model were validated by existing literature, respectively. This showcases the effectiveness of CGSDA in identifying biologically meaningful snoRNA-disease associations, indicating its great potential for guiding downstream experimental research.
Although CGSDA exhibits outstanding performance and practicality, it also has the following limitations: (1) The model is suitable for binary association prediction, and its predictive performance for multi-type associations requires further evaluation. (2) Although the nRC tool can integrate the secondary structure information of snoRNAs, it does not cover other key biological features of snoRNAs (such as expression levels, subcellular localization, and interactions with other RNAs), which may lead to the omission of important clues affecting association prediction. (3) Additional wet experiments are required to validate the predicted results. Based on this, in future work, we will expand the application of the CGSDA model in the field of multi-type association prediction and collaborate with medical schools to conduct wet experimental validation of the predicted results.
We attribute the superior performance of CGSDA to three main factors. First, by integrating the ChebNetII and GatedGCN modules, the model effectively mitigates the negative impact of “preference learning” inherent in deep learning models, as confirmed by our ablation experiments. Second, the incorporation of a residual mechanism helps reduce the “oversmoothing” phenomenon, further enhancing model performance. Third, adjusting the
Data availability statement
All the data and corresponding codes are available at https://github.com/cuntjx/CGSDA.
Author contributions
YZ: Data curation, Formal Analysis, Investigation, Methodology, Validation, Visualization, Writing – original draft, Writing – review and editing. YL: Data curation, Formal Analysis, Funding acquisition, Investigation, Methodology, Writing – original draft, Writing – review and editing. SL: Data curation, Methodology, Visualization, Writing – original draft, Writing – review and editing. ZW: Visualization, Writing – review and editing. LL: Writing – review and editing. SL: Writing – review and editing. TZ: Writing – review and editing. YZ: Writing – review and editing. RM: Writing – review and editing.
Funding
The author(s) declare that financial support was received for the research and/or publication of this article. This work was supported by the National Social Science Fund Project (17XJY004) and the Hechi College Research Project (2023XJPT007).
Conflict of interest
The authors declare that the research was conducted in the absence of any commercial or financial relationships that could be construed as a potential conflict of interest.
Generative AI statement
The author(s) declare that no Generative AI was used in the creation of this manuscript.
Any alternative text (alt text) provided alongside figures in this article has been generated by Frontiers with the support of artificial intelligence and reasonable efforts have been made to ensure accuracy, including review by the authors wherever possible. If you identify any issues, please contact us.
Publisher’s note
All claims expressed in this article are solely those of the authors and do not necessarily represent those of their affiliated organizations, or those of the publisher, the editors and the reviewers. Any product that may be evaluated in this article, or claim that may be made by its manufacturer, is not guaranteed or endorsed by the publisher.
References
Anderson, J. R., Jacobsen, S., Walters, M., Bundgaard, L., Diendorfer, A., Hackl, M., et al. (2022). Small non-coding rna landscape of extracellular vesicles from a post-traumatic model of equine osteoarthritis. Front. Veterinary Sci. 9, 901269. doi:10.3389/fvets.2022.901269
Babiarz, J. E., Ruby, J. G., Wang, Y., Bartel, D. P., and Blelloch, R. (2008). Mouse es cells express endogenous shrnas, sirnas, and other microprocessor-independent, dicer-dependent small rnas. Genes and Dev. 22, 2773–2785. doi:10.1101/gad.1705308
Chabronova, A., Holmes, T. L., Hoang, D. M., Denning, C., James, V., Smith, J. G., et al. (2024). Snornas in cardiovascular development, function, and disease. Trends Mol. Med. 30, 562–578. doi:10.1016/j.molmed.2024.03.004
Chor, B., Horn, D., Goldman, N., Levy, Y., and Massingham, T. (2009). Genomic dna k-mer spectra: models and modalities. Genome Biol. 10, R108–R110. doi:10.1186/gb-2009-10-10-r108
Defferrard, M., Bresson, X., and Vandergheynst, P. (2016). Convolutional neural networks on graphs with fast localized spectral filtering. Adv. neural Inf. Process. Syst. 29.
Ender, C., Krek, A., Friedländer, M. R., Beitzinger, M., Weinmann, L., Chen, W., et al. (2008). A human snorna with microrna-like functions. Mol. Cell 32, 519–528. doi:10.1016/j.molcel.2008.10.017
Fiannaca, A., La Rosa, M., La Paglia, L., Rizzo, R., and Urso, A. (2017). Nrc: non-coding rna classifier based on structural features. BioData Min. 10, 27–18. doi:10.1186/s13040-017-0148-2
Ganot, P., Bortolin, M.-L., and Kiss, T. (1997). Site-specific pseudouridine formation in preribosomal rna is guided by small nucleolar rnas. Cell 89, 799–809. doi:10.1016/s0092-8674(00)80263-9
Hu, X., Zhang, P., Liu, D., Zhang, J., Zhang, Y., Dong, Y., et al. (2024). Igcnsda: unraveling disease-associated snornas with an interpretable graph convolutional network. Briefings Bioinforma. 25, bbae179. doi:10.1093/bib/bbae179
Huang, Z.-h., Du, Y.-p., Wen, J.-t., Lu, B.-f., and Zhao, Y. (2022). Snornas: functions and mechanisms in biological processes, and roles in tumor pathophysiology. Cell Death Discov. 8, 259. doi:10.1038/s41420-022-01056-8
Jameson, J. L., Fauci, A. S., Kasper, D. L., Hauser, S. L., Longo, D. L., and Loscalzo, J. (2020). Medicina Interna de Harrison-2 Volumes-20. Brasil: McGraw Hill.
Kipf, T. N., and Welling, M. (2016). Semi-supervised classification with graph convolutional networks. arXiv preprint arXiv:1609.02907.
Kiss-László, Z., Henry, Y., Bachellerie, J.-P., Caizergues-Ferrer, M., and Kiss, T. (1996). Site-specific ribose methylation of preribosomal rna: a novel function for small nucleolar rnas. Cell 85, 1077–1088. doi:10.1016/s0092-8674(00)81308-2
La Rosa, M., Fiannaca, A., Mendolia, I., La Paglia, L., and Urso, A. (2025). Gl4sda: predicting snorna-disease associations using gnns and llm embeddings. Comput. Struct. Biotechnol. J. 27, 1023–1033. doi:10.1016/j.csbj.2025.03.014
Li, Y., Tarlow, D., Brockschmidt, M., and Zemel, R. (2015). Gated graph sequence neural networks. arXiv preprint arXiv:1511.05493.
Li, C., Qin, M., Xiao, S., Chen, J., Luo, K., Shao, Y., et al. (2024). Making text embedders few-shot learners. arXiv preprint arXiv:2409.15700.
Liu, D., Luo, Y., Zheng, J., Xu, H., Zhang, J., and Deng, L. (2021). “Gcnsda: predicting snorna-disease associations via graph convolutional network,” in 2021 IEEE international conference on bioinformatics and biomedicine (BIBM) (IEEE), 183–188.
Liu, Y., Zhao, C., Wang, G., Chen, J., Ju, S., Huang, J., et al. (2022). Snord1c maintains stemness and 5-fu resistance by activation of wnt signaling pathway in colorectal cancer. Cell Death Discov. 8, 200. doi:10.1038/s41420-022-00996-5
Liu, S., Zhu, W., Wang, P., Yu, S., and Wu, F. (2024). Identifying associations between small nucleolar rnas and diseases via graph convolutional network and attention mechanism. IEEE J. Biomed. Health Inf. 28, 7647–7658. doi:10.1109/JBHI.2024.3424848
Lu, S., Liang, Y., Li, L., Liao, S., and Ouyang, D. (2022). Inferring human mirna–disease associations via multiple kernel fusion on gcnii. Front. Genet. 13, 980497. doi:10.3389/fgene.2022.980497
Momanyi, B. M., Zhou, Y.-W., Grace-Mercure, B. K., Temesgen, S. A., Basharat, A., Ning, L., et al. (2024). Sagesda: multi-Graphsage networks for predicting snorna-disease associations. Curr. Res. Struct. Biol. 7, 100122. doi:10.1016/j.crstbi.2023.100122
Muna, U. M., Hafiz, F., Biswas, S., and Azim, R. (2025). Gbdtsvm: combined support vector machine and gradient boosting decision tree framework for efficient snorna-disease association prediction. Comput. Biol. Med. 192, 110219. doi:10.1016/j.compbiomed.2025.110219
Omonijo, F. A., Gagné, D., Laterrière, M., Ster, C., Zhao, X., and Ibeagha-Awemu, E. M. (2023). Psvi-7 snorna dysregulated expression and potential roles in bovine sub-clinical mastitis due to Staphylococcus chromogenes. J. Animal Sci. 101, 409–410. doi:10.1093/jas/skad281.486
Ono, M., Yamada, K., Avolio, F., Scott, M. S., van Koningsbruggen, S., Barton, G. J., et al. (2010). Analysis of human small nucleolar rnas (Snorna) and the development of snorna modulator of gene expression vectors. Mol. Biol. Cell 21, 1569–1584. doi:10.1091/mbc.e10-01-0078
Ouyang, D., Liang, Y., Wang, J., Li, L., Ai, N., Feng, J., et al. (2024). Hgclamir: hypergraph contrastive learning with attention mechanism and integrated multi-view representation for predicting mirna-disease associations. PLOS Comput. Biol. 20, e1011927. doi:10.1371/journal.pcbi.1011927
Rappaport, N., Nativ, N., Stelzer, G., Twik, M., Guan-Golan, Y., Iny Stein, T., et al. (2013). Malacards: an integrated compendium for diseases and their annotation. Database 2013, bat018. doi:10.1093/database/bat018
Regårdh, S., Jacobsen, S., Bundgaard, L., Walters, M., Anderson, J., Castanheira, C., et al. (2022). Synovial fluid snornas metanalysis in equine osteoarthritis. Osteoarthr. Cartil. 30, S351. doi:10.1016/j.joca.2022.02.471
Sancho-Garnier, H., and Colonna, M. (2019). Breast cancer epidemiology. Presse Medicale 48, 1076–1084. doi:10.1016/j.lpm.2019.09.022
Schriml, L. M., Arze, C., Nadendla, S., Chang, Y.-W. W., Mazaitis, M., Felix, V., et al. (2012). Disease ontology: a backbone for disease semantic integration. Nucleic Acids Res. 40, D940–D946. doi:10.1093/nar/gkr972
Shen, L.-P., Zhang, W.-C., Deng, J.-R., Qi, Z.-H., Lin, Z.-W., and Wang, Z.-D. (2024). Advances in the mechanism of small nucleolar rna and its role in dna damage response. Mil. Med. Res. 11, 53. doi:10.1186/s40779-024-00553-4
Sun, Z., Huang, Q., Yang, Y., Li, S., Lv, H., Zhang, Y., et al. (2022). Psnod: identifying potential snorna-disease associations based on bounded nuclear norm regularization. Briefings Bioinforma. 23, bbac240. doi:10.1093/bib/bbac240
Taft, R. J., Glazov, E. A., Lassmann, T., Hayashizaki, Y., Carninci, P., and Mattick, J. S. (2009). Small rnas derived from snornas. Rna 15, 1233–1240. doi:10.1261/rna.1528909
Tahara, S., Tsuchiya, T., Matsumoto, H., and Ozaki, H. (2023). Transcription factor-binding k-mer analysis clarifies the cell type dependency of binding specificities and cis-regulatory snps in humans. BMC Genomics 24, 597. doi:10.1186/s12864-023-09692-9
Tang, G., Zeng, Z., Sun, W., Li, S., You, C., Tang, F., et al. (2019). Small nucleolar rna 71a promotes lung cancer cell proliferation, migration and invasion via mapk/erk pathway. J. Cancer 10, 2261–2275. doi:10.7150/jca.31077
Vinje, H., Liland, K. H., Almøy, T., and Snipen, L. (2015). Comparing k-mer based methods for improved classification of 16s sequences. BMC Bioinforma. 16, 205–213. doi:10.1186/s12859-015-0647-4
Xu, G., Yang, F., Ding, C.-L., Zhao, L.-J., Ren, H., Zhao, P., et al. (2014). Small nucleolar rna 113–1 suppresses tumorigenesis in hepatocellular carcinoma. Mol. Cancer 13, 216–14. doi:10.1186/1476-4598-13-216
Xuan, P., Han, K., Guo, M., Guo, Y., Li, J., Ding, J., et al. (2013). Prediction of micrornas associated with human diseases based on weighted k Most similar neighbors. PloS one 8, e70204. doi:10.1371/journal.pone.0070204
Zhang, W., and Liu, B. (2022). isnodi-lsgt: identifying snorna-disease associations based on local similarity constraints and global topological constraints. Rna 28, 1558–1567. doi:10.1261/rna.079325.122
Zhang, L., Chen, M., Hu, X., and Deng, L. (2023). Graph convolutional network and contrastive learning small nucleolar rna (Snorna) disease associations (gclsda): predicting snorna–disease associations via graph convolutional network and contrastive learning. Int. J. Mol. Sci. 24, 14429. doi:10.3390/ijms241914429
Keywords: disease-snoRNA association, GNNS, ChebNetII convolutional network, gated graph convolutional network, multiplefeatures fusion, residual mechanism
Citation: Zou Y, Lu Y, Lu S, Wei Z, Li L, Liao S, Zeng T, Zhang Y and Miao R (2025) CGSDA: inferring snoRNA-disease associations via ChebNetII and GatedGCN. Front. Genet. 16:1684484. doi: 10.3389/fgene.2025.1684484
Received: 13 August 2025; Accepted: 06 October 2025;
Published: 16 October 2025.
Edited by:
Massimo La Rosa, National Research Council (CNR), ItalyReviewed by:
Antonino Fiannaca, National Research Council (CNR), ItalyIlaria Cosentini, Consiglio Nazionale delle Ricerche (CNR), Italy
Copyright © 2025 Zou, Lu, Lu, Wei, Li, Liao, Zeng, Zhang and Miao. This is an open-access article distributed under the terms of the Creative Commons Attribution License (CC BY). The use, distribution or reproduction in other forums is permitted, provided the original author(s) and the copyright owner(s) are credited and that the original publication in this journal is cited, in accordance with accepted academic practice. No use, distribution or reproduction is permitted which does not comply with these terms.
*Correspondence: Yusong Lu, bHV5dXNvbmdreUAxNjMuY29t