 Emil M. Pedersen1,2*
 Jette Steinbach1
 Carsten B. Pedersen1Andrew J. Schork2Morten D. Krebs2
 Bjarni J. Vilhjálmsson1,3,4,5Florian Privé1
- 1National Centre for Register-Based Research, Aarhus University, Aarhus, Denmark
- 2Institute of Biological Psychiatry, Mental Health Center - Sct Hans, Copenhagen University Hospital, Copenhagen, Denmark
- 3Lundbeck Foundation Initiative for Integrative Psychiatric Research, iPSYCH, Aarhus, Denmark
- 4Bioinformatics Research Centre, Aarhus University, Aarhus, Denmark
- 5Novo Nordisk Foundation Center for Genomic Mechanisms of Disease, The Broad Institute of MIT and Harvard, Cambridge, MA, United States
Summary: Family-based genetic studies often require the identification of relatives up to a specified degree, but existing tools are either restricted to second-degree relatives, return entire connected pedigrees, or require multiple pre- or post-processing steps. We implemented five new functions, namely, prepare_graph, get_kinship, graph_to_trio, get_relations, and Relation_per_proband_plot, in the R package LTFHPlus to address these limitations. prepare_graph constructs a directed graph from population-level trio data using the igraph package and supports attaching additional attributes to individuals. From this graph, relatives of arbitrary degree can be identified efficiently. get_kinship calculates a kinship matrix for all individuals in a (sub)graph, and graph_to_trio reconstructs trio information from identified families, enabling downstream use with other pedigree tools. In addition, familial relations can be labelled from the graph using the function get_relations, and the total and average of each relation per proband can be plotted using Relation_per_proband_plot. Using the publicly available minnbreast dataset, we constructed a graph containing 28,081 individuals and 30,720 familial edges. Across 1,000 repetitions, the median run-time for identifying all relatives up to the third degree for 500 randomly selected individuals was 0.03 s, and kinship matrix calculation had a median run-time of 1.57 s (single-threaded execution). These functions provide a reproducible, scalable, and interoperable solution for integrating family information into genetic analyses.
Introduction
All fields interested in genetics have roots in studying resemblance among relatives, making efficient handling of large-scale pedigree data critical (Sham, 1996; Polubriaginof et al., 2018). Manually constructing family trees for individuals in large biobanks, population registers, or other study populations is tedious and error-prone. Flexible, well-documented computational tools for constructing, managing, and querying genealogical data that are integrated within analytical packages are needed to connect classical pedigree methods with modern molecular genetics. Only limited resources have recently been dedicated to the analysis of family data and pedigrees in combination with currently popular genotype data.
Existing tools have important limitations. Functions for constructing proband-specific family trees from trio data (proband, mother, and father identifiers) are typically embedded within specialised packages, restricting interoperability. For example, the FamAgg (Rainer et al., 2016) package offers connectedSubgraph, which identifies the smallest possible subgraph connecting two individuals, but ignores any relatives not directly needed for connectivity (see Figure 1). The Pedixplorer (Le Nézet et al., 2025) package supersedes Kinship2 (Sinnwell et al., 2014) and includes functions such as makefamid to generate a family identifier (see Figure 1). However, it returns the largest possible family tree and is not intended to find proband-specific subtrees. The closest method is the function useful_inds from Pedixplorer, but the package focuses on the visualisation of pedigrees and lacks analysis functionality. Similarly, GENLIB (Gauvin et al., 2015) provides utilities for identifying relatives and filtering by degree, but its proband definition (no children) and lack of descendant identification require ad hoc censoring of the data. Pedtools (Vigeland, 2021) can identify relatives up to second degree, but each role relative to the proband has its own function. Other tools, such as PERSEUS (Pradas et al., 2024), are online platforms, which makes them incompatible with analysis of human data in a secure compute environment. Although these tools could identify relatives up to the second degree, they require integrating some preprocessing or chaining of functions.

Figure 1. Comparison of family members identified by different R functions. The desired output is all relatives up to the second degree of the highlighted proband. The function makefamid from kinship2 returns all connected individuals, regardless of the degree of relatedness. The function connectedSubgraph from FamAgg returns only the individuals on the shortest path connecting two specified individuals (here, the proband and the maternal grandmother), thereby omitting other relatives not required to connect them. This example is equivalent to the maternal lineage identified by the function gen.lineages from GENLIB.
A single function for extracting nth-degree relatives from recorded trio data remains important, especially if it can interoperate with family scoring algorithms for GWAS applications or prediction. In this study, we implemented the five new functions, namely, prepare_graph, get_kinship, graph_to_trio, get_relations, and Relation_per_proband_plot, in the existing R package LTFHPlus (GitHub - EmilMiP/LTFHPlus, 2025) that uses efficient path counting algorithms developed by the package igraph (igraph, 2023) to automatically identify family members and label them in typical familial relations. The first function, prepare_graph, constructs a (directed) graph from population-level trio input and can attach additional information to each individual. Using functions from the R package igraph (igraph, 2023), manipulations can then be performed on this graph to create neighbourhood graphs, i.e., to identify all family members of degree n and closer efficiently. Identification of n-degree relatives is implemented in the wrapper function get_family_graphs. The second function, get_kinship, constructs a kinship matrix from a (sub)graph. The third function, graph_to_trio, recovers the trio information used to generate a graph, which makes it possible to utilise properties of existing packages on the identified families, such as pedigree plotting with Pedixplorer. Finally, a function called get_relations has been added to label relatives into typical relationships, such as full and half relations, parents, great-great-grandparents, nieces/nephews, cousins, second cousins twice removed, and more. A full list of identifiable relations can be found in the documentation. The average or total of each relation per proband can be visualised using the function Relation_per_proband_plot, which allows for a summary visualisation of the identified families.
Methods
All functions are implemented in R using the igraph (igraph, 2023) package, which allows for a very efficient construction and manipulation of graphs with millions of nodes and edges. We implement the function prepare_graph that constructs a directed graph from three variables: the personal ID for the target individual along with the personal IDs for the mother and father. The directed graph is obtained through the following steps:
1. Data formatting and quality control, i.e.,
○ Ensuring IDs are strings
○ Substituting missing values with NAs
○ Converting to the data format used by igraph
2. Identifying parental links
3. Adding edges between full siblings
4. Identifying and adding individuals with no relatives (i.e., isolated nodes)
5. Adding additional individual information (i.e., attaching attributes to nodes)
Once the full population graph is constructed, the function make_neighbourhood_graph (alias make_ego_graph) from the igraph package can be used to identify all family members of degree n. Given the proband ID (name of a node) or a list of proband IDs, a single n-degree neighbourhood graph is created for each proband. Each neighbourhood graph is centred around the proband, and a proband can also be included as an n-degree relative in the neighbourhood graph for a different proband. A wrapper function that formats the resulting neighbourhood graphs is provided in get_family_graphs. Once the desired sub-graph(s) have been obtained, additional manipulations can be performed in order to add, extract, or modify attributes for each identified node in the neighbourhood graph (which corresponds to identifying family members) or to add or remove nodes and edges (which corresponds to adding or removing family members or their relations from the (sub) graph).
In addition, we introduce a second new function in LTFHPlus, get_kinship, which calculates the kinship matrix for all individuals present in a (neighbourhood) graph. The kinship matrix is based on the distance between nodes (individuals) in the graph, and it is calculated as
Next, we also introduce a function called graph_to_trio, which takes a graph and reconstructs the trio information used to create it. This step requires sex as an attribute in the graph; however, it allows for the identification of families of arbitrary degrees and for converting the identified families back into a format that is usable by existing pedigree packages. In the trio format, the identified families can be used by existing pedigree packages, such as pedigree plotting with Pedixplorer.
Finally, we introduce a function called get_relations, which calculates the number of generations up and down between every member of a family graph and labels them with commonly used family labels. Combined with the Relation_per_proband_plot, an overview of the identified family relations can be visualised. See Figure 2 for an example of the 426 probands from the minnbreast data. For Figure 2, we identified all relatives up to the 10th degree, labelled all identified relatives, and plotted the total number and average number of identified relations. The labelling favours horizontal family members identifiable from the great-great-great-great-grandparents of a proband and down the family tree, which means that the relations labelled are not exhaustive past the fifth degree and include no relations past the ninth degree.

Figure 2. Visualisation of the total and average number of family relations per proband in the minnbreast data. The labels in a square represent the relative’s label, e.g., Ch for child and 1C2R for first cousin twice removed, followed by the total number observed and, finally, the average number per proband in parentheses. As an example, “Pib” is short for “pibling,” i.e., parent’s sibling (aunts/uncles), 22 are identified, which is an average of 0.052 per proband.
Results
In the publicly available minnbreast trio data (Sellers et al., 1995) distributed using the Kinship2 package (Sinnwell et al., 2014), we constructed a graph with all available data using prepare_graph, resulting in 28,081 nodes (individuals) and 30,720 edges (familial relations). We then randomly selected 500 individuals, extracted all family members up to the third degree, and applied get_kinship to each identified family. We repeated this process 1,000 times and recorded the run-times with system.time (1/100th second precision). The median run-time of identification of relatives up to the third degree was 0.03 s, and the median run-time of get_kinship was 1.57 s. First and third quartiles are provided in Table 1. If it is necessary to perform these calculations on millions of probands, the calculations can be carried out in parallel using a split-apply-combine strategy, with chunk sizes chosen such that each chunk will fit within the available resources.
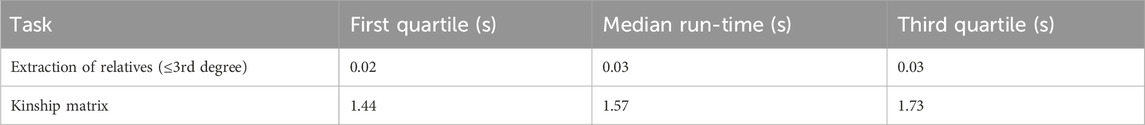
Table 1. Median run-times (seconds) for the extraction of relatives up to the third degree and kinship matrix calculation (1,000 repetitions).
Pedixplorer offers comparable functionality using the useful_inds function. We measured the run-time, cumulative RAM allocation, and peak RAM usage for the identification of all third-degree relatives of the proband in the first family (famid of 4) in the minnbreast data using the useful_inds function. The run-time of a single family using useful_inds was 68.2 s (compared to a median run-time of just 0.03 s with igraph-based extraction of 500 families of the same size). Using the R package peakRAM (GitHub - tpq/peakRAM, 2025), the reported peak RAM usage for the identification of all family members up to the third degree for a single individual was 36,097.4 MiB with useful_inds, and the system reported a peak memory allocation of 99%. Notably, R does not measure currently allocated memory, which means methods that measure RAM usage in R instead track each allocation request or the cumulative requested memory. peakRAM falls into the latter category, indicating that it can exceed the RAM available to the system.
peakRAM showed peak RAM allocation of 1.5 MiB on a chunk of 500 families using the igraph-based approach employed by LTFHPlus.
All analyses were conducted on a Lenovo ThinkPad laptop with an AMD Ryzen 7 PRO 7840U processor (1 core used, no parallelisation), 32 GB of available system RAM, running Windows 11 with R version 4.4.2, LTFHPlus v2.2.0, and igraph v2.1.4.
The minnbreast data record the proband of each family. Using get_family_graphs, we identify all family members up to the 10th degree for each proband. Then, we label all identified family members with a relationship label using get_relations and finally plot the total and average number of each identified relationship label for all probands in the minnbreast data. This summary information is visualised using the function Relation_per_proband_plot and is provided in Figure 2.
Discussion
The automatic identification of family members presented in this study has three benefits: it removes the potential for errors when identifying family members, preserves individual-level family member information, and enables the efficient construction of kinship matrices. The function prepare_graph can store information for each individual, which is preserved during the construction of family trees of a suitable degree. Preserving information is helpful when the family trees are used to obtain family-based variables, such as binary family history indicators or family liabilities (Krebs et al., 2023; Pedersen et al., 2022). It also allows for the storage of other parameters on an individual family member level.
The second advantage of the approach is the efficient construction of kinship matrices for all identified families. Kinship matrices are applied in many settings; for example, they can be used to account for degrees of relatedness in mixed models (Rabe-Hesketh et al., 2008) and construct covariance matrices for liability threshold models conditional on family history (Pedersen et al., 2022). Hence, get_kinship can increase efficiency in a broad spectrum of applications by removing the need to convert to other input formats.
A third contribution of the work is the ability to label relatives into standard familial relationships using the get_relations function and visualise a summary of the relations using Relation_per_proband_plot. These additions assist in better understanding the identified families and facilitate a clear visual summary of them. Such visual summaries are useful when analysing population-level registers or large biobanks, where family structures may be complex and vary substantially across participants or where different categories of participants are being compared.
A comparison with Pedixplorer, which offers a similar functionality in useful_inds, showed the advantage of the igraph-based implementation utilised by LTFHPlus. In terms of run-time and RAM footprint, the graph-based approach performed better and demonstrated population-level scalability.
A particularly important application is the estimation of family (genetic) liabilities, which is the main purpose of the LTFHPlus package (Pedersen et al., 2022; Pedersen et al., 2023). Until now, the identification and construction of family trees and kinship matrices were major hurdles. With the automatic identification of family members and the preservation of individual family member information, we have now removed this barrier, minimised the potential for errors, and reduced computation time.
The kinship calculation has some limitations. First, the zygosity of twins is not considered (i.e., monozygotic twins are identified as simple siblings). Second, the shortest path through the most recent common ancestor is not inbreed-aware (as for consanguineous families); however, the shortest path estimate is comparable to inbreeding-aware estimates in small families. Alternatively, it is possible to convert the identified family members up to degree n back into trio data and use a different kinship calculator.
Together, the presented functions enable the automatic, accurate, and efficient extraction of relatives of arbitrary degree; the construction of kinship matrices; the labelling and visualisation of summaries of the identified family members; and the integration of family information into downstream analyses. We expect these tools to greatly facilitate the adoption of family-based approaches in large-scale genetic studies.
Data availability statement
The original contributions presented in the study are included in the article/supplementary material; further inquiries can be directed to the corresponding author.
Author contributions
EP: Methodology, Conceptualization, Writing – review and editing, Software, Writing – original draft. JS: Writing – original draft, Software, Visualization, Writing – review and editing. CP: Writing – review and editing, Writing – original draft. AS: Writing – original draft, Supervision, Writing – review and editing. MK: Software, Writing – original draft, Writing – review and editing. BV: Writing – review and editing, Writing – original draft. FP: Writing – original draft, Supervision, Writing – review and editing.
Funding
The authors declare that financial support was received for the research and/or publication of this article. This work was supported by the Danish Data Science Academy, which is funded by the Novo Nordisk Foundation (NNF21SA0069429). AS acknowledges funding from Lundbeckfonden (R335-2019-2318) and the National Institute of Mental Health (R01MH130581 and R01MH139865). MK acknowledges funding from Lundbeckfonden (R450-2023-1447). The authors thank the Novo Nordisk Foundation for funding for the generation of the Danish Multi Generation Register (grant NNF20SA0066568).
Conflict of interest
The authors declare that the research was conducted in the absence of any commercial or financial relationships that could be construed as a potential conflict of interest.
Generative AI statement
The authors declare that no Generative AI was used in the creation of this manuscript.
Any alternative text (alt text) provided alongside figures in this article has been generated by Frontiers with the support of artificial intelligence and reasonable efforts have been made to ensure accuracy, including review by the authors wherever possible. If you identify any issues, please contact us.
Publisher’s note
All claims expressed in this article are solely those of the authors and do not necessarily represent those of their affiliated organizations, or those of the publisher, the editors and the reviewers. Any product that may be evaluated in this article, or claim that may be made by its manufacturer, is not guaranteed or endorsed by the publisher.
References
Gauvin, H., Lefebvre, J. F., Moreau, C., Lavoie, E. M., Labuda, D., Vézina, H., et al. (2015). GENLIB: an R package for the analysis of genealogical data. BMC Bioinformatics. 16, 1–10. doi:10.1186/s12859-015-0581-5
GitHub - EmilMiP/LTFHPlus (2025). Implementation of LTFH++. Available online at: https://github.com/EmilMiP/LTFHPlus.
GitHub - tpq/peakRAM (2025). EXPERIMENTAL an R package to monitor the peak RAM used by R expressions and functions. GitHub. doi:10.32614/CRAN.package.peakRAM
Krebs, M. D., Hellberg, K. L. G., Lundberg, M., Appadurai, V., Ohlsson, H., Pedersen, E., et al. (2023). PA-FGRS is a novel estimator of pedigree-based genetic liability that complements genotype-based inferences into the genetic architecture of major depressive disorder. medRxiv 20.23291611. doi:10.1101/2023.06.23.23291611
Le Nézet, L., Sinnwell, J., Letko, A., André, C., and Quignon, P. (2025). Pedixplorer: a bioconductor package to streamline pedigree design and visualization. App. Micro. Biotech. 41. doi:10.1093/bioinformatics/btaf329
Pedersen, E., Agerbo, E., Plana-Ripoll, O., Grove, J., Dreier, J. W., Musliner, K. L., et al. (2022). Accounting for age of onset and family history improves power in genome-wide association studies. Am. J. Hum. Genet. 109, 417–432. doi:10.1016/j.ajhg.2022.01.009
Pedersen, E. M., Agerbo, E., Plana-Ripoll, O., Steinbach, J., Krebs, M. D., Hougaard, D. M., et al. (2023). ADuLT: an efficient and robust time-to-event GWAS. Nat. Commun. 14, 1–12. doi:10.1038/s41467-023-41210-z
Polubriaginof, F. C. G., Vanguri, R., Quinnies, K., Belbin, G. M., Yahi, A., Salmasian, H., et al. (2018). Disease heritability inferred from familial relationships reported in medical records. Cell 173, 1692–1704.e11. doi:10.1016/j.cell.2018.04.032
Pradas, N., Jurado-Ruiz, F., Onielfa, C., Arús, P., and Aranzana, M. J. (2024). PERSEUS: an interactive and intuitive web-based tool for pedigree visualization. Bioinformatics 40, btae060. doi:10.1093/bioinformatics/btae060
Rabe-Hesketh, S., Skrondal, A., and Gjessing, H. K. (2008). Biometrical modeling of twin and family data using standard mixed model software. Biometrics 64, 280–288. doi:10.1111/j.1541-0420.2007.00803.x
Rainer, J., Taliun, D., D'Elia, Y., Pattaro, C., Domingues, F. S., and Weichenberger, C. X. (2016). FamAgg: an R package to evaluate familial aggregation of traits in large pedigrees. Bioinformatics 32, 1583–1585. doi:10.1093/bioinformatics/btw019
Sellers, T. A., Anderson, V. E., Potter, J. D., Bartow, S. A., Chen, P. L., Everson, L., et al. (1995). Epidemiologic and genetic follow-up study of 544 Minnesota breast cancer families: design and methods. Genet. Epidemiology 12, 417–429. doi:10.1002/gepi.1370120409
Sham, P. (1996). Genetic epidemiology. Br. Med. Bull. 52, 408–433. doi:10.1093/oxfordjournals.bmb.a011557
Sinnwell, J. P., Therneau, T. M., and Schaid, D. J. (2014). The kinship2 R package for pedigree data. Hum. Hered. 78, 91–93. doi:10.1159/000363105
Keywords: pedigree analysis, kinship matrix, graph theory, trio data, family-based studies, genetic epidemiology, R package
Citation: Pedersen EM, Steinbach J, Pedersen CB, Schork AJ, Krebs MD, Vilhjálmsson BJ and Privé F (2025) Automatic detection of n-degree family members. Front. Genet. 16:1708315. doi: 10.3389/fgene.2025.1708315
Received: 18 September 2025; Accepted: 24 November 2025;
Published: 12 December 2025.
Edited by:
Alexandre Bureau, Laval University, CanadaReviewed by:
Rodrigo R. Amadeu, Bayer Crop Science, United StatesZhe Zhang, Zhejiang University, China
Copyright © 2025 Pedersen, Steinbach, Pedersen, Schork, Krebs, Vilhjálmsson and Privé. This is an open-access article distributed under the terms of the Creative Commons Attribution License (CC BY). The use, distribution or reproduction in other forums is permitted, provided the original author(s) and the copyright owner(s) are credited and that the original publication in this journal is cited, in accordance with accepted academic practice. No use, distribution or reproduction is permitted which does not comply with these terms.
*Correspondence: Emil M. Pedersen, ZW1wQGF1LmRr