 Thomas S. Daniya
 Stephen A. Bowden
- 1Department of Geology and Geophysics, University of Aberdeen, Aberdeen, United Kingdom
- 2Department of Earth Sciences, Federal University of Petroleum Resources Effurun, Effurun, Delta State, Nigeria
Air quality and the concentration of polycyclic aromatic hydrocarbons (PAHs) in urban environments are increasingly becoming a concern. Measuring air quality and PAHs, and linking these to specific activities, requires deploying and recovering sampling devices to capture and measure any changes. From May 2020 to June 2021, during the “lockdown” period of the COVID-19 pandemic, acrocarpous and pleurocarpous mosses were collected from five types of site in Aberdeen, United Kingdom, and the concentration of PAHs measured to track changes in PAHs as travel-related activities changed. The predominant types of PAHs found on mosses were of the four- and five-ring varieties, with the four-ring variety of PAH (medium molecular weight) becoming more dominant as the lockdown was lifted. However, for most sites, the concentration of PAHs was evidently perturbed by the transient lifting, reimposing, and then lifting of lockdown conditions, which either directly limited travel or changed people’s motivations to travel by car. Molecular diagnostic ratios or molecular marker parameters used to infer the source of PAHs varied little and were nearly always consistent with PAHs deriving from combustion in vehicle engines. Thus, even when travel was limited, PAHs were still derived from vehicle usage, although the overall concentrations on mosses were much lower. On average, the lowest PAH concentrations were found on mosses collected from a recreational park located the furthest from traffic. The highest PAH concentrations were observed on mosses collected from residential car parks during periods when the lockdown had been lifted. However, mosses from the same residential car parks had very low PAH concentrations during periods of travel restrictions, strongly suggesting that, for mosses, local factors and patterns of vehicle usage strongly determine their exposure to PAHs. Therefore, mosses within urban environments can be used for monthly monitoring of PAHs as they are able to detect changes induced by human behaviour.
1 Introduction
Polycyclic aromatic hydrocarbons (PAHs) are a priority pollutant for monitoring due to their volatility and carcinogenic and mutagenic effects (Straif et al., 2013). PAHs can harm humans and other organisms; hence, limiting their concentration in the environment requires monitoring, policies, and regulation—this is particularly the case for urban environments such as cities (Boonyatumanond et al., 2006; Jiang et al., 2009). The continuous monitoring of PAHs is needed to detect rising concentrations and identify potential problems so that action can be taken to protect vulnerable people from air pollution and to devise mitigation methods (Defra, 2021).
In urban environments, mosses grow freely on stones, roadside kerbs, tree trunks, walls, soil, and lawns as clusters or epiphytes, forming dense tufts or cushions (Atherton, et al., 2010). Mosses, like PAHs, are ubiquitous in urban environments, and the two interact where PAH-laden vapour, street dust, soils, and water are deposited on mosses from the atmosphere. Because mosses can persist in places affected by oil spills and because they can grow on petroliferous substrates such as oil-bearing shales and sediment affected by leachate and pollutants (Ötvös et al., 2004; Jiang et al., 2009), mosses appear highly resilient and capable of colonizing polluted urban environments. Consequently, they are candidates for passive and active environmental monitoring of airborne pollutants (Martinez-Swatson et al., 2020). Mosses that have accumulated PAHs and metals can potentially be collected and analysed as part of monitoring programs. Indeed, studies of mosses grown in controlled environments and exposed to polluted atmospheres, but lacking other natural ecological factors, have shown good sorption of PAHs and adsorption of particulates (Gallego-Cartagena et al., 2021; Giráldez et al., 2021; Świsłowski et al., 2022). This can be explained by the mosses lacking cuticles and root systems, thereby predisposing their surfaces to preferential interaction with atmospheric pollutants (Cuming and Goffinet, 2008).
To allow easier consideration of the varying physical and chemical properties that affect PAH disposition, PAHs are grouped into low, medium, and high molecular weight categories. Low-molecular-weight (LMW) PAHs have two or three fused rings (128–178 Da) and are commonly transported in gaseous form. PAHs with four rings (202–228 Da) are termed medium molecular weight (MMW) and can be transported in vapour or particulate form, while PAHs with more than four rings (252–300 Da) are termed high molecular weight (HMW) and are transported in particulate form (Siudek, 2022). Mosses regulate water and gas exchange with the atmosphere via their stomata, and this can enhance uptake of LMW PAHs (Kerstiens, 1996; Duckett and Pressel, 2018; Sulistiyorini, et al., 2022). HMW PAHs in particulate form can also adsorb onto mosses by adhering to leaves and can become incorporated within mosses via diffusion or osmosis (Thomas, 1986; Ötvös et al., 2004). Thus, although there are variations in disposition, all types of PAHs can be transported through the atmosphere and all types of PAHs might accumulate on mosses.
In addition to considering PAHs by their molecular weight, the proportions of specific PAHs can vary depending on their source and processes that affect them while in transit. All PAHs photodegrade, especially PAHs with linearly arranged rings, like anthracene, or PAHs with only two rings like naphthalene and/or whose rings are “clustered”, like benzo[a]pyrene. Angular-PAH-like phenanthrene and dibenzo[a,h]anthracene appear to resist photodegradation better (Stogiannidis and Laane, 2015; Marquès et al., 2016). PAHs may also travel far from their source of emission (long-range PAHs) or be deposited close to emission sources (short-range PAHs) (Martinez-Swatson et al., 2020). Such considerations underscore the importance of understanding the unique properties of different PAHs, how this knowledge might be used to predict their behaviour under various environmental conditions or deduce their origin, and the implications that this has for different sampling methods (Abdel-Shafy and Mansour, 2016).
PAHs are sometimes attributed to a specific source using molecular diagnostic ratios (MDRs) (Yunker et al., 2002; Tobiszewski and Namieśnik, 2012)—ratios of compounds that often have similar molecular weights but structures that impart different characteristics diagnostic of their origin. However, the uniqueness of the “signal” measured by MDRs can be lost as PAHs disperse and mix with PAHs from other sources (Yunker et al., 2002; Tobiszewski and Namieśnik, 2012). If mosses are to be used to monitor PAHs in urban environments, it is necessary to be confident that characteristics of PAH distributions in the form of MDRs are sufficiently conserved to evaluate factors such as level of degradation and distance from sources.
This study presents measurements of PAHs on mosses in Aberdeen, Scotland, from June 2020 to May 2021, during which time PAH-generating anthropogenic activities were perturbed by restrictions imposed to inhibit the spread of COVID-19. These restrictions did not explicitly target the use of vehicles as in, for example, “clean air zones,” but instead did so by limiting the need to travel via laws and regulations that stopped free association and travel or via the use of social marketing or government advice that encouraged people to “work from home where possible.” The objectives of this study were to demonstrate that mosses can be used as passive sampling devices that are already in place near potential PAH sources, and to demonstrate that they can record perturbations in PAH concentrations produced by sudden changes in human activities, thereby yielding meaningful observations of PAHs in urban environments.
2 Sites, methods, and materials
2.1 Site characterization
Moss samples were collected from Aberdeen between June 2020 and May 2021. Aberdeen is located at 57.1498 N and −2.0927 E in northeastern Great Britain; it is Scotland’s third largest city, with over 200,000 people (Meteoprog, 2020). Aberdeen is temperate, with winter, spring, summer, and autumn seasons of near-equal length and average temperatures of 3°C, 7°C, 10°C, and 13°C, respectively. Although Aberdeen is well known as an industrial centre for oil and gas activity, it is not heavily industrialized. Oil is not refined or taken ashore at Aberdeen (data.gov.scot, 2022); instead, the impact of oil production on Aberdeen has been rapid economic growth and consequent increases in traffic and environmental pollution (Tiesdell and Allmendinger, 2004).
The study sites comprised duplicates of traffic lights at major high-street intersections, workplace car parks, residential car parks, high streets, and recreational park areas located more than 400 m from passing traffic. A total of 120 samples were thus collected over 12 months, from ten localities representing five types of site. The locations of these sites are shown in Figure 1, and further details are provided in Table 1. Concentration data are reported as an average of the duplicate sites—: for example, data points from both traffic light locations were averaged and are presented as a single value.
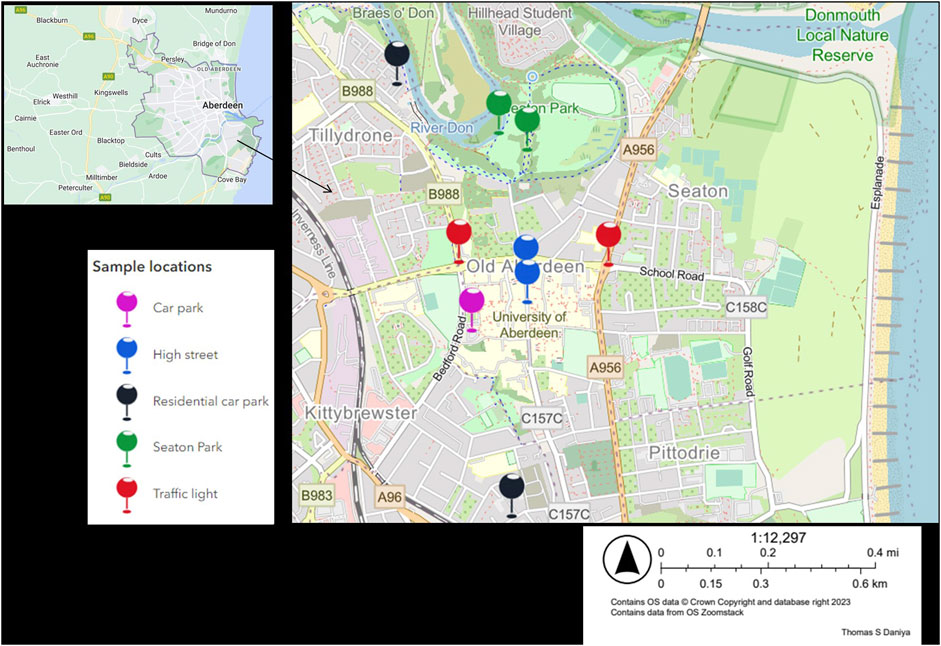
FIGURE 1. Location of sample stations for mosses around the Old Aberdeen area of Aberdeen, Scotland, United Kingdom (map produced using ArcGIS 2022 powered by ESRI).
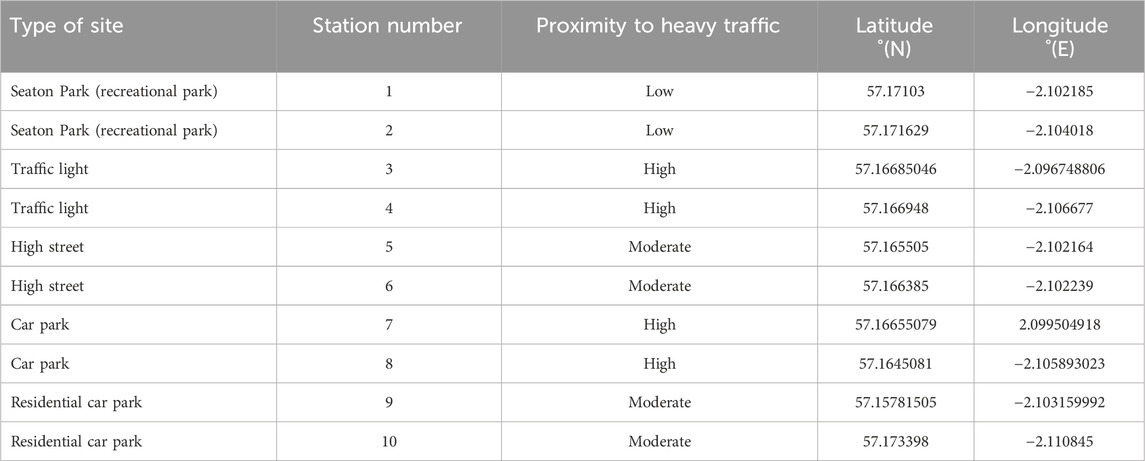
TABLE 1. Annual sample locations.
2.2 Perturbation due to restrictions during the COVID-19 pandemic
The first samples were collected at the beginning of “Phase 2” of the COVID-19 lockdown restrictions in Scotland during June 2020, when outdoor meetings between two households were again permitted and travel for leisure and recreation was allowed within a five-mile distance. Local restrictions and a “stay-at-home” order were temporarily reintroduced in Aberdeen in August 2020, but restrictions had generally been eased during the summer and early autumn of 2020. “Phase 3” of the COVID-19 lockdown in Scotland began in late autumn 2020, with travel declining, particularly intercity travel, as other cities had limits imposed on travel. During winter 2020–2021, regional and national restrictions were again implemented, and mainland Scotland reimposed a lockdown (strict limits on activities and meetings between households). From February 2021, children returned to in-person attendance at schools and other more typical travel activities resumed (data.gov.scot, 2022). Periods in which restrictions that impacted travel were in effect are shown in Figures 2A, B as orange boxes.
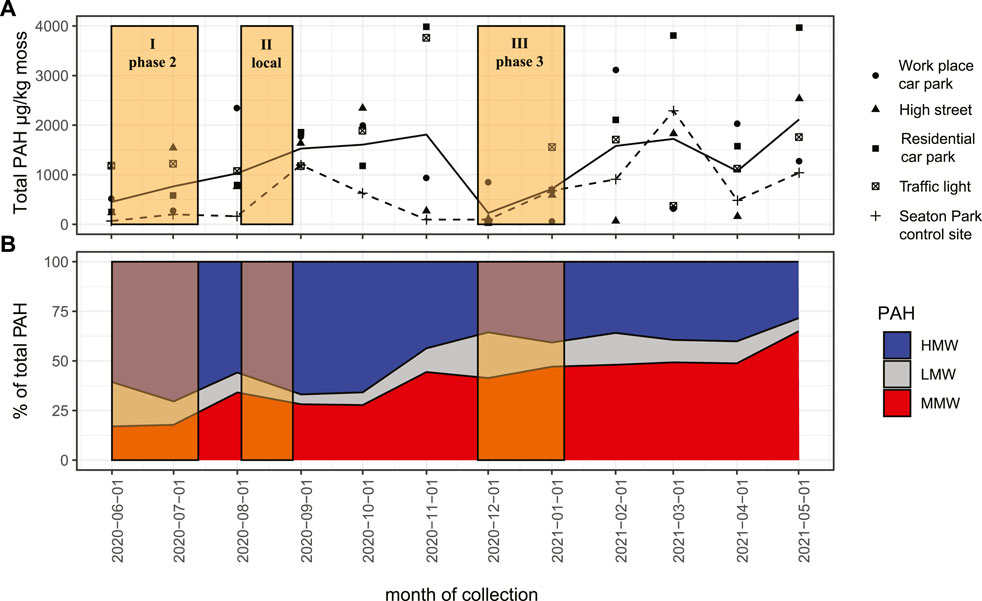
FIGURE 2. (A) Temporal variation in total PAH concentrations on mosses from June 2021 to May 2022. The solid line indicates monthly mean for all types of site; the dashed line connects points corresponding to the recreational park (Seaton Park), taken as a control site located furthest from traffic. (B) Stacked bar chart of % total PAHs on mosses by type of PAH. Orange boxes are months with restricted travel. I = easing of first lockdown or Phase 2, including June and July 2020; II = temporary lockdown localized to Aberdeen for 2 weeks during August 2020; III = lockdown and restrictions in December 2020 and January 2021.
2.3 Extraction and analysis
Samples of moss (0.2–1.1 g) had extraneous materials removed before they were freeze-dried for 48 h. Once dry, samples of moss were weighed to obtain a dry weight. Samples were kept at <5°C until ready for extraction. To recover adsorbed PAHs, whole mosses were subjected to extraction in two stages: dried mosses were sonicated in 1:1 v/v dichloromethane:acetone for 15 min, after which the extract was removed and the extraction procedure repeated. Extracts from both stages were combined and reduced to residual dryness. To clear extracts prior to analysis, residues were separated by silica gel column chromatography into a saturated fraction (eluted with hexane) and an aromatic fraction containing PAHs (eluted with 1:1 v/v dichloromethane: acetone). Note that mosses were not milled, crushed, or masticated, as the aim of the study was to measure adsorbed components only.
Prior to GC-MS analysis, deuterated-PAH standards (see Supplementary Table S1) were added to each fraction. Analysis was performed using an Agilent 6890 GC connected to a 5975 MS. The capillary column was a GC-5 phase column, 30 m in length, with 0.25 µm film thickness and 250 µm i.d. The oven temperature was initially 60 °C for 2 min, increasing to 120 °C at 20 °C/min, then increasing at 4 °C/min to 290 °C and holding.
Calibration was conducted across a five-dilution range according to US EPA 8270 to obtain R2 values, standard deviations, and limits of detection and quantification for 25 PAHs (data are shown in Table 2). Limits of detection varied by compound from 0.001 to 0.221 μg/g (Table 2). Representative sample ion chromatograms are shown in Supplementary Figure S1. Relative response factors (Yang et al., 2014) are listed in Supplementary Table S1 and were calculated using PAHs and their deuterated counterparts. Analyte concentrations are reported as micrograms per kilogram (µg/kg) dry moss weight. Instrumental blanks comprising blank solvent were analysed at approximately 1 per 8 or 1 per 16 samples. Procedural blanks were performed for extraction and chromatography stages, and none had PAHs above the LoQ (Table 2). Differences described in the text were evaluated by t-tests and were significant for an alpha of 0.1 or better (see data in Supplementary Information S1).
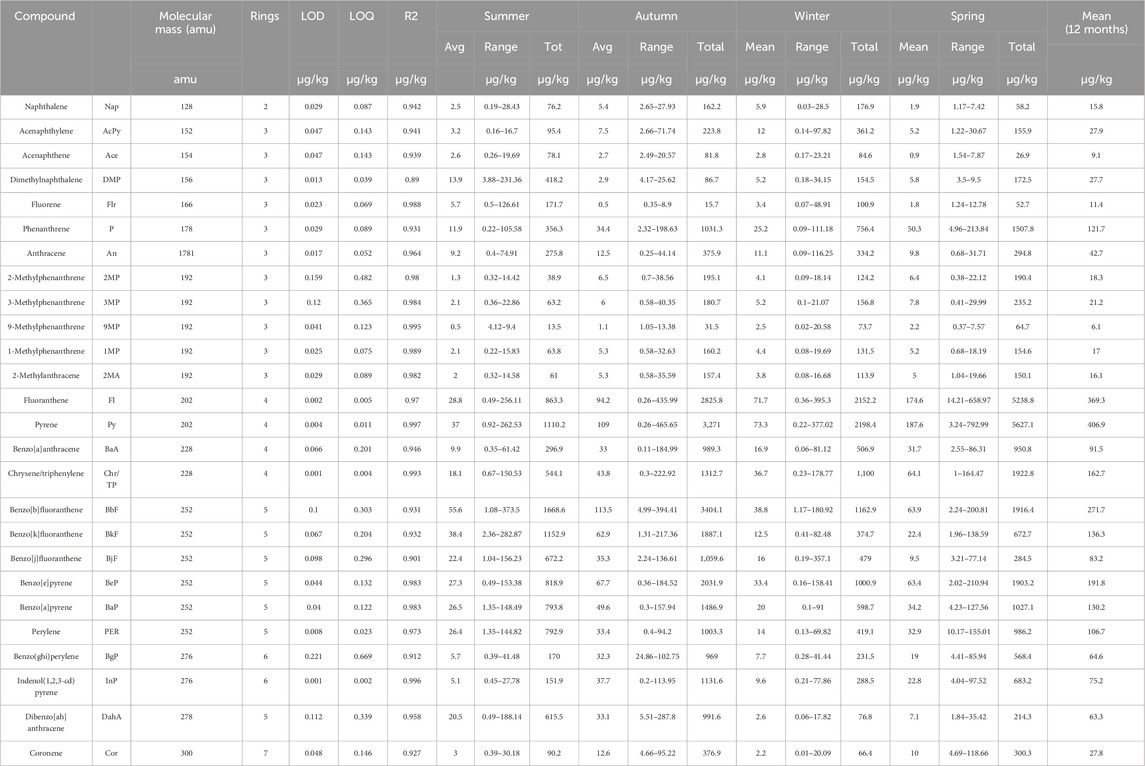
TABLE 2. Seasonal trend in PAH concentrations as measured via LOQ and LOD.
Both acrocarpous and pleurocarpous mosses were collected, with the type of moss noted. It was later found that both types of moss had similar concentrations of PAHs. This aspect is discussed later, but the type of moss collected is noted in Supplementary Table S2.
3 Results
3.1 Temporal variation in PAHs over the COVID-19 lockdown timeline
Concentrations of PAHs on mosses were lowest in June and July 2020 and in December 2020 and January 2021 (Figure 2A), periods of time corresponding to restrictions that limited daily travel. During these times, most mosses had PAH concentrations less than 1,500 μg/kg moss, and the control site (a recreational park) had concentrations less than 250 μg/kg. High PAH concentrations on mosses were observed in November 2020 and February, March, and May 2021, when concentrations greater than 3,500 μg/kg moss were observed for high street and residential car park locations (Figure 2B). Most of these high values were observed toward the end of the observation period, when the most severe restrictions on travel were lifted in 2021; the exception to this (high PAH concentrations in November 2020) was a period when more typical travel habits were permitted. Therefore, a strong case can be made that the accumulation of PAHs on mosses in Aberdeen is a direct and relatively immediate consequence of travel: when travel was limited, lower PAH concentrations were found on mosses, but at other times, PAH concentrations were orders of magnitudes higher. Typically, concentrations of total PAHs in many European cities are observed to be higher during winter, which is linked to increased vehicle and industrial emissions, as well as increased use of fuels to heat residences (Schifman and Boving, 2015; Martinez-Swatson et al., 2020; Tsiodra et al., 2021). For Aberdeen, United Kingdom, a counter-seasonal trend was thus observed during 2020–2021 due to the travel restrictions during the COVID pandemic, in which lower PAH levels were present in winter.
Both the proportion and concentration of LMW PAHs on moss in Aberdeen were relatively consistent from June 2020 to May 2021 (always less than 100 μg/kg moss), but increased proportions were observed during periods when travel was limited (Figure 2A). The apparent increase in the proportion of LMW PAHs corresponded to lower amounts of HMW and MMW PAHs on mosses (Figure 2B), although the absolute concentrations of LMW PAHs were slightly higher in late autumn 2020 and February and March 2021. Thus, increases in the proportion of LMW were mostly a relative enrichment caused by a reduction in the absolute amount of larger HMW and MMW PAHs, although increased volatility during hotter summer months may also have reduced absolute concentrations of LMW PAHs (an effect reported in previous work—Oishi, 2018; Halsall et al., 1994; Fabure et al., 2010) and thus decreased relative proportions.
HMW PAHs made up more than 50% of PAHs present from June to October 2020, even though lower total concentrations of HMW and other PAHs were measured on mosses in this time (Figure 2B). Except during December 2020 and January 2021, MMW PAHs became proportionally more abundant from June 2020 to May 2021, and MMW PAHs replaced HMW PAHs from January 2021 as the most abundant type of PAH. The period from December 2020 to January 2021 coincided with travel restrictions but was also a period of high rainfall, which can remove PAHs (Abdel-Shafy and Mansour, 2016); this could have particularly affected ground-growing pleurocarpous mosses (although all types of moss had lower concentrations during this time, suggesting that such an effect was less significant). Thus, several factors may have acted to reduce MMW PAH concentrations on mosses during winter. Therefore, when typical travel habits prevailed, MMW PAHs were the most abundant group found on mosses in Aberdeen.
Fluoranthene and pyrene comprised a significant proportion of MMW and total PAHs, with the highest concentrations found on mosses during May 2021; for fluoranthene and pyrene, concentrations were 937 and 1,174 μg/kg moss. The next highest concentrations were detected in November 2020 and were of a similar order of magnitude (Figure 2; Supplementary Table S2). Prior to May 2021 and during summer 2020, concentrations were much lower and were typically less than 400 μg/kg moss for both PAHs. Mosses in Aberdeen had low concentrations of fluoranthene and pyrene; lower than, for example, soils from Glasgow, with concentrations of 1,729 and 1,763 μg/kg respectively (Morillo et al., 2007; Vane et al., 2007).
A commonly used PAH-based molecular diagnostic ratio (MDR) for assessment of the possible sources of PAHs is the ratio of fluoranthene to pyrene (calculated as Fl/(Fl + Py)), in which the relative abundance of fluoranthene (which contains the less stable five-membered ring, which is often formed during pyrolysis or partial combustion) is compared to that of pyrene, with a greater relative abundance of fluoranthene reported in soils and plants in urban environments (Wild and Jones, 1995). From June 2020 to May 2021, most mosses in Aberdeen had values of the Fl/(Fl + Py) MDR in the range 0.3–0.6 (Figure 3), consistent with the UK’s atmospheric emission inventory (Katsoyiannis et al., 2011). Another good comparison for PAHs on mosses in Aberdeen is soil data from urban locales around the Clyde Estuary (Morillo et al., 2007; Vane, et al., 2007), where the ratio of fluoranthene to pyrene commonly exceeds 1 (equivalent to Fl/(Fl + Py) < 0.5); data for Aberdeen are also within this range.
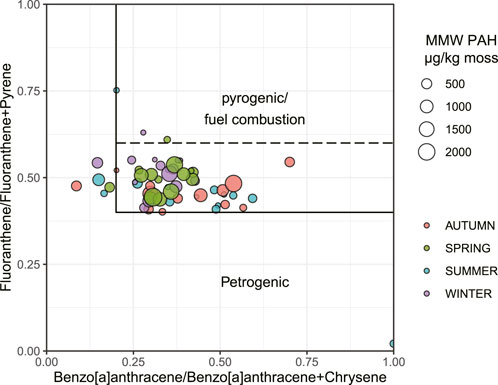
FIGURE 3. Cross plot of Fl–Pyr and BaA–Chr MDR with fields shown from Stogiannidis and Laane (2015) and Tobiszewski and Namieśnik, (2012) that are indicative of origin of PAHs.
The values of Fl/(Fl + Py) seen on Aberdeen mosses are most characteristics of vehicle emissions (Yunker et al., 2002; Tobiszewski and Namieśnik, 2012). In this instance, the consistent range for Fl/(Fl + Py), even when other evidence indicates that the supply of total PAHs to mosses had reduced, suggests that, even when the total concentration of PAHs accumulating on mosses varied, the source of most PAHs did not change and was fuel-burning vehicles (Tobiszewski and Namieśnik, 2012).
While the range of Fl/(Fl + Py) values indicates a consistent source, there was some slight seasonality to the Fl/(Fl + Py) MDR, and the highest values were seen in winter, when the number of sunlight hours per month is low and photodegradation is lessened (Figure 4). Other parameters and MDRs (Çabuk et al., 2014; Capozzi, et al., 2021; Świsłowski et al., 2022) that might be expected to indicate photodegradation were considered but did not show significant seasonal variation indicative of weathering.
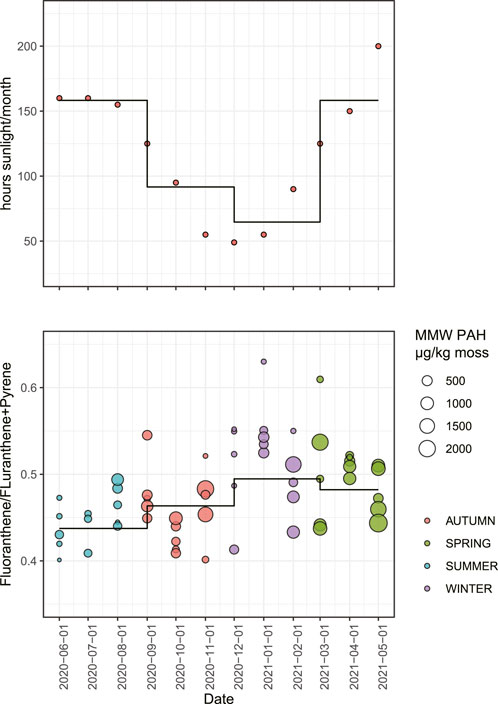
FIGURE 4. Time series plots of Fl–Py MDR and monthly sunlight hours for Aberdeen. Orange boxes indicate months with restricted travel. I = easing of first lockdown or Phase 2, including June and July 2020; II = temporary lockdown localized to Aberdeen for 2 weeks during August 2020; III = lockdown and restrictions in December 2020 and January 2021.
Differences in absolute concentrations of photodegradable PAHs were observed at other times during the study period; for example, concentrations of benzo[a]phenanthrene and benzo[e]phenanthrene were 793 and 818 μg/kg moss in summer, and 1,027 and 1903 μg/kg in the subsequent spring (Table 3). However, these observations are from periods where vehicle usage differed due to COVID-19 restrictions. Thus, except in the case of fluoranthene, there is little evidence that the concentrations of PAHs on mosses in Aberdeen from June 2020 to May 2021 varied due to varying levels of photodegradation or weathering. However, even if this was not a strongly seasonal effect, weathering and photodegradation are still likely to be quantitatively important for overall concentrations of fluoranthene, because MMW PAHs such as fluoranthene comprise such a significant proportion of PAHs on mosses and presumably played a role in reducing the total concentrations of PAHs prior to the onset of the study period.
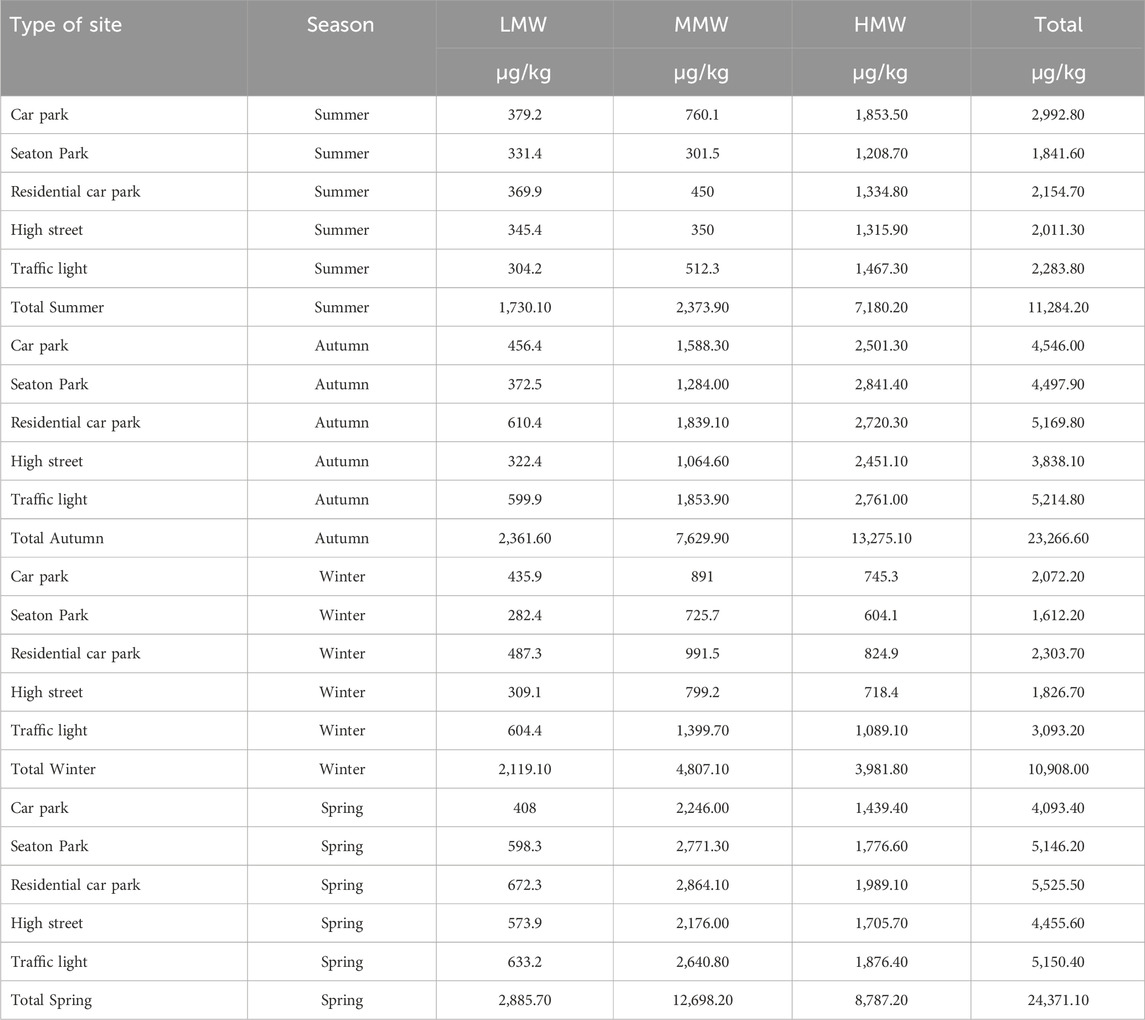
TABLE 3. Type of PAHs by location and season (µg/kg moss).
3.2 Variation by type of moss
In Aberdeen, acrocarpous mosses typically had higher total concentrations of PAHs (682 μg/kg) than pleurocarpous mosses (552 μg/kg); however, these concentrations were lower than those observed for pleurocarpous mosses in other studies (Figure 4; Martinez-Swatson, et al., 2020; Chovanec et al., 1994). Conversely, the concentrations of PAHs on acrocarpous mosses were only a little higher on average than those previously observed in comparator European cities (Martinez-Swatson, et al., 2020), and were otherwise comparable.
Various factors may explain the higher concentrations of PAHs typically reported for pleurocarpous mosses. Because these mosses often grow prostrate and colonize laterally, they may grow to cover large surface areas and thus can have a high surface-to-volume ratio. Additionally, pleurocarpous mosses have a preference for shade; hence, PAHs on their surfaces are protected from direct solar radiation and experience reduced photodegradation (Glime, 2007). A selection bias may also exist in terms of the studies undertaken: because studies of PAHs are conducted in places where high PAH concentrations are a concern (Holoubek et al., 2000; Oishi, 2018; Świsłowski et al., 2022), workers may reasonably but also preferentially have selected pleurocarpous mosses over acrocarpous mosses, as they have a higher surface area, thus reporting data only for more heavily polluted pleurocarpous mosses (Holoubek et al., 2000; Gałuszka, A. (2007); Çabuk et al., 2014; Capozzi, et al., 2017; Świsłowski et al., 2021).
In contrast with previous work, the pleurocarpous mosses sampled in this study may not have been exposed to such high concentrations of PAHs. In addition, during the timeframe of the study, wet–dry cycles were experienced in which ground-covering mosses wilted in dry periods and then had their surfaces “washed” by rainfall in a process known to remove PAHs (Halsall et al., 1994). Thus, data from this study include PAH concentrations for pleurocarpous mosses from relatively less polluted environments, collected at times when concentrations could have been at their lowest.
By comparison, acrocarpous mosses on vertical surfaces (including urban analogues such as lamp posts or walls) are not exposed to pooling surface water or horizontal surface run off and do not have PAHs removed from their surfaces in this way. Thus, while pleurocarpous and acrocarpous mosses in this study were comparable in terms of PAH concentrations on their surfaces, consideration should be given in other contexts to using vertically disposed acrocarpous mosses if atypical weather patterns might affect PAH retention. However, if high PAH concentrations are expected, then pleurocarpous mosses might better retain high quantities of PAHs due to their greater surface area.
3.3 Variation between localities
The concentrations of PAHs in mosses from different types of locality are plotted in Figure 6. Mosses collected from Seaton Park (a recreational park used as a control because it was furthest from traffic) had the lowest concentration of total PAHs (<500 μg/kg), whereas mosses from residential car parks had the highest (exceeding 3,000 μg/kg in spring 2021) subsequent to normal travel patterns resuming in spring 2021. It should also be noted that the residential car parks had a total PAH concentration of less than 1,000 μg/kg during seasons most heavily impacted by travel restrictions; thus, residential car parks experienced the greatest variation in PAH concentration. Mosses from other localities close to static traffic (traffic lights and car parks) had PAH concentrations greater than 1,000 μg/kg moss, whereas mosses from high street locations collected when travel was limited during summer 2020 and winter 2021, had concentrations less than 1,000 μg/kg moss. Thus, travel restrictions minimally impacted PAHs on mosses at traffic lights and workplace car parks, but mosses collected from residential car parks, high streets, and the control locality were more affected.
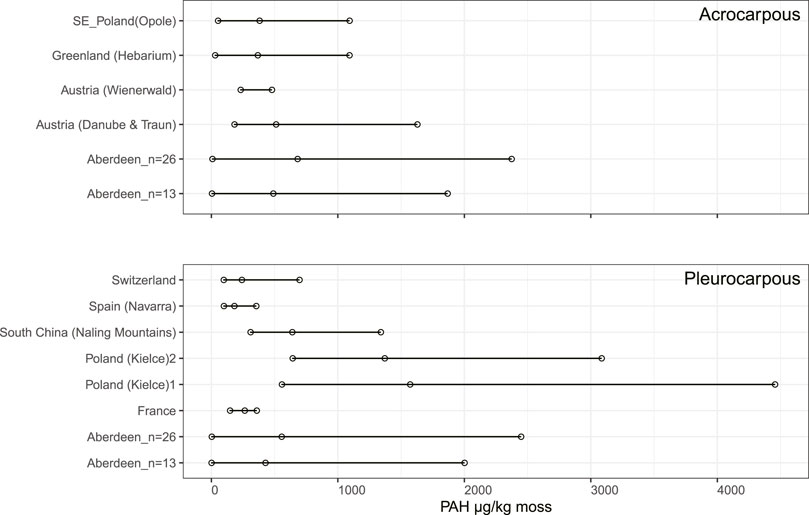
FIGURE 5. Comparison of PAH concentrations on acrocarpous and pleurocarpous mosses. Sources of data are listed in Supplementary Table S3. Note that two total concentrations are presented for Aberdeen: one based on the sum of 26 PAHs and the other based on the sum of a lesser number of PAHs (13 in total) more comparable to other studies.
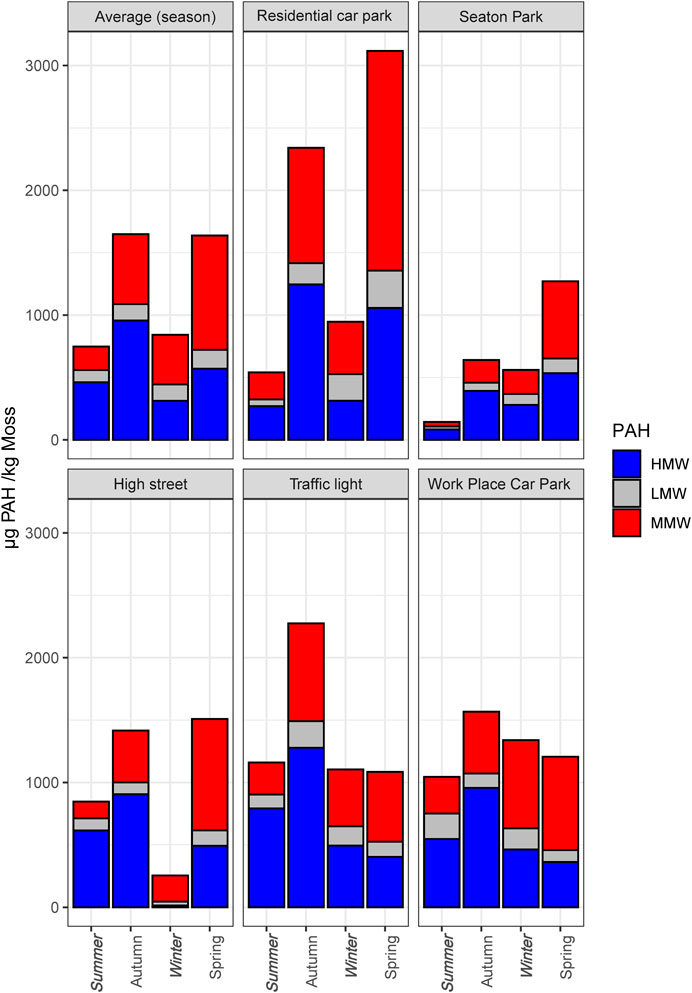
FIGURE 6. Stacked bar charts of seasonally averaged concentrations of HMW, MMW, and LMW PAHs on mosses in Aberdeen. Data are shown for the different types of site, and seasons in which restrictions on travel were in effect are italicized and in bold.
Most noticeable perhaps is that, although mosses from the recreational park (considered a control locality as it was furthest from traffic) had the lowest PAH concentration, mosses from the residential car parks—which were also some distance from passing traffic on main roads and might have been expected to be less exposed to passing traffic—had the highest PAH concentrations during periods without travel restrictions. However, when travel was restricted, mosses from residential car parks had much lower PAH concentrations, similar to those collected from the recreational park. Therefore, localized circumstances concerning travel had the potential to greatly affect PAH concentration on mosses.
Relative to total PAHs, HMW PAHs varied little by locality; except in the residential car park, HMW PAHs mostly ranged from 250 to less than 1,000 μg/kg moss. Mosses from traffic lights and workplace car parks had least variation in PAHs by season; travel restrictions thus had a minimal impact on the concentration of HMW PAHs at these localities. Mosses collected from high streets and the control locality had low concentrations of HMW PAHs in summer and winter 2020, but otherwise the concentration of HMW PAHs mostly varied within the range of 250 to <1,000 μg/kg, as in other localities.
Unlike the HMW PAHs, the concentrations and relative proportions of LMW and MMW PAHs on mosses varied more between different localities. Notably, mosses from both types of car park (residential and workplace) and traffic lights had the highest proportions of LMW PAHs (<120 μg/kg moss). Mosses from the control locality and high street samples had low concentrations of LMW PAHs. The concentrations of MMW PAHs often varied the most and, except in the case of the traffic light location, the concentration of MMW PAHs increased at all locations from June 2020 to May 2021, strongly indicating the link between the concentration of MMW PAHs on mosses and human travel.
4 Discussion
Concentrations of PAHs on mosses in Aberdeen increased from June 2020 to May 2021 as travel restrictions were lifted, similar to trends observed in other measures of air quality from across the UK at that time (Llaguno-Munitxa and Bou-Zeid, 2023), thus indicating that mosses within urban environments can be sampled as part of a monitoring program. It is also noticeable that mosses from different locations within Aberdeen had different PAH concentrations consistent with their proximity to traffic, the main source of PAHs; for example, the recreational park had the lowest values and the high street had the most. Thus, as observed by Fernández et al. (2015), mosses may be used as passive monitors of PAHs; they reflect localized conditions, as do many sampling stations or monitoring localities. However, localized sampling of mosses to measure PAHs may help to “unblend” the blending of different PAH sources that is more frequently observed in the UK (Katsoyiannis et al., 2011).
The main source of the PAHs found on mosses in Aberdeen is traffic, as evidenced both by the predominance of MDRs indicative of traffic (Stogiannidis and Laane, 2015) and particularly by the perturbation of PAH concentrations as restrictions to travel were lifted, reimposed, and subsequently lifted again in 2021. Only workplace car parks did not evidence significant perturbation. The increase in PAH concentrations on mosses from June 2020 to May 2021 corresponded to an increase in the proportion of MMW PAHs compared to LMW and HMW PAHs. Thus, the main source of PAHs on mosses in Aberdeen is traffic, and most of the PAHs are MMW.
Localities in Aberdeen where PAH concentrations on mosses were most perturbed were residential car parks, recreational parks, and high streets. This grouping includes localities with the lowest and highest concentration of PAHs on mosses. Of these, it is noticeable that mosses from recreational parks saw perhaps the most noticeable change: in June 2020, the concentration of PAHs was very low and was dominated by HMW PAHs; however, the concentrations and proportions of PAHs in May 2021 were typical of those from other locations. This observation is consistent with the idea of a blended pool of atmospheric PAHs within the UK that undergoes rapid blending as it is transported from its source (Stogiannidis and Laane, 2015), and with the notion that this pool was briefly depleted in June 2020. It is also noticeable that the concentration of PAHs on mosses in residential car parks, i.e., the localities closest to homes and most impacted by individual human actions, were the most perturbed from June 2020 to May 2021 by COVID-19 travel restrictions, undergoing the greatest increase in concentrations when restrictions were lifted. Therefore, highly localized changes in vehicle use and travel have the potential to significantly change the concentration of PAHs found on moss.
5 Conclusion
Mosses can be used to monitor perturbations in PAHs by acting as passive sampling stations that are already in place in many urban environments, with the total concentrations they record being similar to those found in soils. While the total PAH concentrations on mosses will vary by location, changes within the environment will still be evident in PAHs on mosses. Additionally, MDRs and molecular marker parameters employed to deduce the sources of PAHs can be measured. In this study, lower PAH concentrations were present on mosses when travel was restricted due to COVID-19, but concentrations increased rapidly when restrictions were lifted. Therefore, PAHs on the surfaces of mosses have a high turnover rate and short residence time; PAHs on mosses thus reflect local conditions at the site from which they are collected and also reflect conditions prevalent at the time the moss is sampled. Finally, it can be concluded that restrictions imposed on travel and association during the COVID-19 pandemic in Aberdeen, Scotland, from June 2020 to May 2021 caused up to 50% less PAHs to accumulate on mosses, except in locations close to traffic. The greatest reductions were seen in residential car parks and localities far from passing traffic, such as recreational parks.
Data availability statement
The original contributions presented in the study are included in the article/Supplementary Material; further inquiries can be directed to the corresponding author.
Author contributions
TD: conceptualization, formal analysis, investigation, methodology, visualization, writing–original draft, and writing–review and editing. SB: conceptualization, investigation, methodology, supervision, visualization, writing–original draft, and writing–review and editing.
Funding
The authors declare that financial support was received for the research, authorship, and/or publication of this article. TD was awarded a Tertiary Education Trust Fund (TETFund) Nigeria; FUPRE/TO/AST&D/2018.
Acknowledgments
TD would like to thank Dr. Elizabeth Kungu and Dr. David Long of the Royal Botanic Garden, Edinburgh for the invaluable training they provided on identifying moss species. We acknowledge the technical support of Colin Taylor, Geochemistry Laboratory, University of Aberdeen.
Conflict of interest
The authors declare that the research was conducted in the absence of any commercial or financial relationships that could be construed as a potential conflict of interest.
The authors declared that they were an editorial board member of Frontiers at the time of submission. This had no impact on the peer review process and the final decision.
Publisher’s note
All claims expressed in this article are solely those of the authors and do not necessarily represent those of their affiliated organizations, or those of the publisher, the editors, and the reviewers. Any product that may be evaluated in this article, or claim that may be made by its manufacturer, is not guaranteed or endorsed by the publisher.
Supplementary material
The Supplementary Material for this article can be found online at: https://www.frontiersin.org/articles/10.3389/fgeoc.2023.1320096/full#supplementary-material
References
Abdel-Shafy, H. I., and Mansour, M. S. M. (2016). A review on polycyclic aromatic hydrocarbons: source, Environmental impact, effect on human health and remediation. Egypt. J. Petroleum 25, 107–123. doi:10.1016/j.ejpe.2015.03.011
Atherton, I., Bosanquet, S. D., and Lawley, M. (2010). Mosses and liverworts of Britain and Ireland: a field guide British. United Kingdom: Bryological Society Plymouth. Latimer Trend & Co. Ltd, Plymouth.
Boonyatumanond, R., Wattayakorn, G., Togo, A., and Takada, H. (2006). Distribution and origins of polycyclic aromatic hydrocarbons (PAHs) in riverine, estuarine, and marine sediments in Thailand. Mar. Pollut. Bull. 52 (8), 942–956. doi:10.1016/j.marpolbul.2005.12.015
Çabuk, H., Kılıç, M. S., and Ören, M. (2014). Biomonitoring of polycyclic aromatic hydrocarbons in urban and industrial environments of the Western Black Sea Region, Turkey. Environ. Monit. Assess. 186 (3), 1515–1524. doi:10.1007/s10661-013-3470-2
Capozzi, F., Adamo, P., Spagnuolo, V., and Giordano, S. (2021). Field comparison between moss and lichen PAHs uptake abilities based on deposition fluxes and diagnostic ratios. Ecol. Indic. 120, 106954. doi:10.1016/j.ecolind.2020.106954
Capozzi, F., Di Palma, A., Adamo, P., Spagnuolo, V., and Giordano, S. (2017). Monitoring chronic and acute PAH atmospheric pollution using transplants of the moss Hypnum cupressiforme and Robinia pseudacacia leaves. Atmos. Environ. 150, 45–54. doi:10.1016/j.atmosenv.2016.11.046
Chovanec, A., Vogel, W. R., Lorbeer, G., Hanus-Illnar, A., and Seif, P. (1994). Chlorinated organic compounds, PAHs, and heavy metals in sediments and aquatic mosses of two upper Austrian rivers. Chemosphere 29 (9), 2117–2133. doi:10.1016/0045-6535(94)90379-4
Cuming, A. C., and Goffinet, B. (2008). “Mosses as model organisms for developmental, cellular, and molecular biology,” in Bryophyte biology. Editor A. J. Shaw 2nd edn. (Cambridge: Cambridge University Press), 199–236. data.gov.scot (2022) COVID-19 in Scotland. Available at: https://data.gov.scot/coronavirus-covid-19/ (Accessed August, 2021).
Defra (2021) Air pollutant inventories for england, Scotland, wales, and northern Ireland: 2005-2019. Available at: https://uk-air.defra.gov.uk/assets/documents/reports/cat09/2109270949_DA_Air_Pollutant_Inventories_2005-2019_Issue1.1.pdf (Accessed: 06/June/ 2022).
Duckett, J. G., and Pressel, S. (2018). The evolution of the stomatal apparatus: intercellular spaces and sporophyte water relations in bryophytes—two ignored dimensions. Philosophical Trans. R. Soc. B Biol. Sci. 373 (1739), 20160498. doi:10.1098/rstb.2016.0498
Fabure, J., Meyer, C., Denayer, F., Gaudry, A., Gilbert, D., and Bernard, N. (2010). Accumulation capacities of particulate matter in an acrocarpous and a pleurocarpous moss exposed at three differently polluted sites (industrial, urban and rural). Water, Air, & Soil Pollut. 212 (1), 205–217. doi:10.1007/s11270-010-0333-0
Fernández, J. A., Boquete, M. T., Carballeira, A., and Aboal, J. R. (2015). A critical review of protocols for moss biomonitoring of atmospheric deposition: sampling and sample preparation. Sci. Total Environ. 517, 132–150. doi:10.1016/j.scitotenv.2015.02.050
Gallego-Cartagena, E., Morillas, H., Carrero, J. A., Madariaga, J. M., and Maguregui, M. (2021). Naturally growing grimmiaceae family mosses as passive biomonitors of heavy metals pollution in urban-industrial atmospheres from the Bilbao Metropolitan area. Chemosphere 263, 128190. doi:10.1016/j.chemosphere.2020.128190
Gałuszka, A. (2007). Distribution patterns of PAHs and trace elements in mosses Hylocomium splendens (Hedw.) B.S.G. and Pleurozium schreberi (Brid.) Mitt. from different forest communities: a case study, south-central Poland. Chemosphere 67 (7), 1415–1422. doi:10.1016/j.chemosphere.2006.10.010
Giráldez, P., Varela, Z., Aboal, J. R., and Fernández, J. Á. (2021). Testing different methods of estimating edaphic inputs in moss biomonitoring. Sci. Total Environ. 778, 146332. doi:10.1016/j.scitotenv.2021.146332
Glime, J. M. (2007). “Economic and ethnic uses of bryophytes,” in Flora of north America: north of Mexico, bryophytes: mosses: vol 27. Bryophyta, part 1. Editor E. C. FLORA OF NORTH AMERICA edn. (Exeter, United Kingdom: Oxford Univ Pr), 14–18. Published by.
Halsall, C. J., Coleman, P. J., Davis, B. J., Burnett, V., Waterhouse, K. S., Harding-Jones, P., et al. (1994). Polycyclic aromatic hydrocarbons in U.K. Urban air. Environ. Sci. Technol. 28 (13), 2380–2386. doi:10.1021/es00062a024
Holoubek, I., Kořınek, P., Šeda, Z., Schneiderová, E., Holoubková, I., Pacl, A., et al. (2000). The use of mosses and pine needles to detect persistent organic pollutants at local and regional scales. Environ. Pollut. 109 (2), 283–292. doi:10.1016/S0269-7491(99)00260-2
Jiang, J., Lee, C., Fang, M., and Liu, J. T. (2009). Polycyclic aromatic hydrocarbons in coastal sediments of southwest Taiwan: an appraisal of diagnostic ratios in source recognition. Mar. Pollut. Bull. 58 (5), 752–760. doi:10.1016/j.marpolbul.2008.12.017
Katsoyiannis, A., Sweetman, A. J., and Jones, K. C. (2011). PAH molecular diagnostic ratios applied to atmospheric sources: a critical evaluation using two decades of source inventory and air concentration data from the UK. Environ. Sci. Technol. 45 (20), 8897–8906. doi:10.1021/es202277u
Kerstiens, G. (1996). Cuticular water permeability and its physiological significance. J. Exp. Bot. 47 (12), 1813–1832. doi:10.1093/jxb/47.12.1813
Llaguno-Munitxa, M., and Bou-Zeid, E. (2023). Role of vehicular emissions in urban air quality: the COVID-19 lockdown experiment. Transp. Res. Part D Transp. Environ. 115, 103580. doi:10.1016/j.trd.2022.103580
Marquès, M., Mari, M., Audí-Miró, C., Sierra, J., Soler, A., Nadal, M., et al. (2016). Photodegradation of polycyclic aromatic hydrocarbons in soils under a climate change base scenario. Chemosphere 148, 495–503. doi:10.1016/j.chemosphere.2016.01.069
Martinez-Swatson, K., Mihály, E., Lange, C., Ernst, M., Dela Cruz, M., Price, M. J., et al. (2020). Biomonitoring of polycyclic aromatic hydrocarbon deposition in Greenland using historical moss herbarium specimens shows a decrease in pollution during the 20(th) century. Front. Plant Sci. 11, 1085. doi:10.3389/fpls.2020.01085
Meteoprog, c.u. (2020). Weather/weather in United Kingdom/Scotland. Available at: https://www.meteoprog.co.uk/en/ (Accessed June 25, 2021).
Morillo, E., Romero, A., Maqueda, C., Madrid, L., Ajmone-Marsan, F., Grcman, H., et al. (2007). Soil pollution by PAHs in urban soils: a comparison of three European cities. J. Environ. Monit. 9 (9), 1001. doi:10.1039/B705955H
Oishi, Y. (2018). Comparison of moss and pine needles as bioindicators of transboundary polycyclic aromatic hydrocarbon pollution in central Japan. Environ. Pollut. 234, 330–338. doi:10.1016/j.envpol.2017.11.035
Ötvös, E., Kozák, I. O., Fekete, J., Sharma, V. K., and Tuba, Z. (2004). Atmospheric deposition of polycyclic aromatic hydrocarbons (PAHs) in mosses (Hypnum cupressiforme) in Hungary. Sci. Total Environ. 330 (1), 89–99. doi:10.1016/j.scitotenv.2004.02.019
Schifman, L. A., and Boving, T. B. (2015). Spatial and seasonal atmospheric PAH deposition patterns and sources in Rhode Island. Atmos. Environ. 120, 253–261. doi:10.1016/j.atmosenv.2015.08.056
Siudek, P. (2022). Atmospheric deposition of polycyclic aromatic hydrocarbons (PAHs) in the coastal urban environment of Poland: sources and transport patterns. Int. J. Environ. Res. Public Health 19 (21), 14183. doi:10.3390/ijerph192114183
Stogiannidis, E., and Laane, R. (2015). “Source characterization of polycyclic aromatic hydrocarbons by using their molecular indices: an overview of possibilities,” in Reviews of environmental contamination and toxicology. Editor D. M. Whitacre (Cham: Springer International Publishing), 49–133.
K. Straif, A. Cohen, and J. Samet (2013). Air pollution and cancer, Lyon Cedex 08, France: WHO Press, World Health Organization, 161. Series number, PUBLICATION NO.
Sulistiyorini, D., Walgraeve, C., and Van Langenhove, H. (2022). Biomonitoring of polycyclic aromatic Hydrocarbons in the ambient air using plants: a review, 21. Singapore: Springer Nature Singapore, 457.
Świsłowski, P., Nowak, A., and Rajfur, M. (2021). The influence of environmental conditions on the lifespan of mosses under long-term active biomonitoring. Atmos. Pollut. Res. 12 (10), 101203. doi:10.1016/j.apr.2021.101203
Świsłowski, P., Vergel, K., Zinicovscaia, I., Rajfur, M., and Wacławek, M. (2022). Mosses as a biomonitor to identify elements released into the air as a result of car workshop activities. Ecol. Indic. 138, 108849. doi:10.1016/j.ecolind.2022.108849
Thomas, W. (1986). Representativity of mosses as biomonitor organisms for the accumulation of environmental chemicals in plants and soils. Ecotoxicol. Environ. Saf. 11 (3), 339–346. doi:10.1016/0147-6513(86)90106-5
Tiesdell, S., and Allmendinger, P. (2004). City profile aberdeen. Cities 21 (2), 167–179. doi:10.1016/j.cities.2003.12.001
Tobiszewski, M., and Namieśnik, J. (2012). PAH diagnostic ratios for the identification of pollution emission sources. Environ. Pollut. 162, 110–119. doi:10.1016/j.envpol.2011.10.025
Tsiodra, I., Grivas, G., Tavernaraki, K., Bougiatioti, A., Apostolaki, M., Paraskevopoulou, D., et al. (2021). Annual exposure to polycyclic aromatic hydrocarbons in urban environments linked to wintertime wood-burning episodes. Atmos. Chem. Phys. 21 (23), 17865–17883. doi:10.5194/acp-21-17865-2021
Vane, C. H., Harrison, I., and Kim, A. W. (2007). Assessment of polyaromatic hydrocarbons (PAHs) and polychlorinated biphenyls (PCBs) in surface sediments of the Inner Clyde Estuary, UK. Mar. Pollut. Bull. 54 (8), 1301–1306. doi:10.1016/j.marpolbul.2007.04.005
Wild, S. R., and Jones, K. C. (1995). Polynuclear aromatic hydrocarbons in the United Kingdom environment: a preliminary source inventory and budget. Environ. Pollut. 88 (1), 91–108. doi:10.1016/0269-7491(95)91052-M
Yang, C., Zhang, G., Wang, Z., Yang, Z., Hollebone, B., Landriault, M., et al. (2014). Development of a methodology for accurate quantitation of alkylated polycyclic aromatic hydrocarbons in petroleum and oil contaminated environmental samples. Anal. Methods 6 (19), 7760–7771. doi:10.1039/C4AY01393J
Keywords: polycyclic aromatic hydrocarbons (PAH), moss, COVID-19 lockdown, pollution, environmental monitoring, clean air, urban
Citation: Daniya TS and Bowden SA (2024) The perturbation of PAHs on mosses in Aberdeen, Scotland, as a consequence of social restrictions imposed during the COVID-19 pandemic. Front. Geochem. 1:1320096. doi: 10.3389/fgeoc.2023.1320096
Received: 11 October 2023; Accepted: 15 December 2023;
Published: 18 January 2024.
Edited by:
Timothy Knowles, University of Bristol, United KingdomReviewed by:
Małgorzata Rajfur, Opole University, PolandElena Marrocchino, University of Ferrara, Italy
Katalin Hubai, University of Pannonia, Hungary
Copyright © 2024 Daniya and Bowden. This is an open-access article distributed under the terms of the Creative Commons Attribution License (CC BY). The use, distribution or reproduction in other forums is permitted, provided the original author(s) and the copyright owner(s) are credited and that the original publication in this journal is cited, in accordance with accepted academic practice. No use, distribution or reproduction is permitted which does not comply with these terms.
*Correspondence: Thomas S. Daniya, dC5kYW5peWEuMThAYWJkbi5hYy51aw==, ZGFuaXlhLnRob21hc0BmdXByZS5lZHUubmc=