 Kenneth W. W. Sims1*
 Lisa B. Kant1
 Gregory J. Stark1
 Mark K. Reagan2Jeff J. Standish3
 Charles H. Langmuir4
- 1Wyoming High Precision Isotope Laboratory, Department of Geology and Geophysics, University of Wyoming, Laramie, WY, United States
- 2Department of Earth and Environmental Sciences, University of Iowa, Iowa City, IA, United States
- 3Minnesota Drive Environment, University of Minnesota, St Paul, MN, United States
- 4Department of Earth and Planetary Sciences, Harvard University, Cambridge, MA, United States
Here we report (210Pb/226Ra), (226Ra/230Th), (230Th/238U) and (234U/238U) disequilibria for eleven lavas from the ABE vent site in the Lau Basin. Most ABE lavas have (210Pb/226Ra) > 1 and (226Ra/230Th) > 3. These results indicate that most of these lavas erupted within the past 100 years. Model ages calculated assuming initial (210Pb/226Pb) = 1.8–2.0 further constrain the timing of eruption, suggesting that more than half of the lavas erupted within the past 60 years. When combined with complementary data (side-scan sonar, lava flow morphology, tectonic mapping), this high-resolution record provides fundamental time constraints for interdisciplinary studies examining oceanic crustal construction and development of the hydrothermal system in the ABE vent field. Notably the youngest samples cluster around the active vent sites indicating that the ABE vent site’s location is a direct consequence of this concentrated young volcanism. This study is the first high resolution U-series study of a seafloor vent site and demonstrates the potential of using (210Pb/226Ra) for the determination of lava ages for young submarine lavas in spreading environments with active hydrothermal venting. As such these (210Pb/226Ra) measurements hold the promise for addressing in far greater detail the connections between spreading ridge eruptive and hydrothermal activity on the decadal to century time scales.
1 Introduction
Time constraints are essential for understanding geological processes at oceanic spreading ridges. Without time constraints, many central questions about how oceanic spreading centers work and how the various aspects of the ridges’ volcanic and hydrothermal systems relate to one another are unanswerable. For example, without lava ages it is not possible to relate volcanic activity to tectonics processes, establish temporal changes in lava compositions, and link hydrothermal and biological activities to fluctuations in volcanism. Thus, age constraints are not a detail, they are necessary. Without them, our understanding of ridge systems will be forever limited.
Dating young submarine lavas has proven to be notoriously difficult (e.g., Batiza et al., 1987). Long-lived radiogenic isotope systems like Rb-Sr, Sm-Nd, and U-Th-Pb have half-lives that are too long and lack the temporal resolution for precise ages. Cosmogenic age dating on the ocean floor is not possible. Potassium-Argon dating techniques (e.g., Abdel-Karim and Azzaz, 1995), which have provided crystallization ages in very young sub-aerial lavas, suffer from a myriad of problems when applied to young mid-ocean ridge basalts (MORB), for example: 1) low concentrations of K in MORB yield low Ar (e.g., typically K2O in MORB is ∼0.1 wt% and so over 103–106 years this yields 10−13–10−9 moles/g rock of ingrown 40Ar); 2) open system behavior of Ar. Although stepwise heating can correct for atmospheric argon, this procedure cannot account for inherited magmatic Ar in MORB glass, the most commonly available sample material. Furthermore, contamination of lavas by seawater K also affects the accuracy of results (Batiza et al., 1987; Duncan and Hogan, 1994; Guillou et al., 2017). Other techniques for dating MORB have had even less success. For instance, fission track dating of MORB glasses is complicated by low U concentrations and consequently low track densities, as well as rapid track annealing (Batiza et al., 1987). Finally, although sediment accumulation has been used to estimate the relative age of seafloor terrain, this method is unreliable for absolute age determinations, as sedimentation rates are known to vary widely over short spatial scales. Thus, the visual appearance of lavas provides only a subjective, semi-quantitative estimate of age (Klein et al., 2013).
Fortunately, 238U-series disequilibria can provide robust eruption ages for young oceanic basalts (e.g., Rubin and Macdougall, 1990; Goldstein et al., 1991; Volpe and Goldstein, 1993; Rubin et al., 1994; Lundstrom et al., 1995; Sims et al., 1995; Sturm et al., 2000; Sims et al., 2002; Cooper et al., 2003; Sims et al., 2003; Sims et al., 2008a; Standish and Sims, 2010; Waters et al., 2011; Waters et al., 2013a; Waters et al., 2013b; Haase et al., 2016; Scott et al., 2019; Sims et al., 2021). The 238U-decay series nuclides have a range of half-lives that are appropriate for dating a wide age range of young basalts, and the application of U-series disequilibria to the dating of young submarine basalts has been well established. While there have been several studies using 238U-230Th-226Ra disequilibria to date oceanic basalts in the range of hundreds of years to hundreds of thousands of years (the half-life of 230Th is 75 kyr, and 226Ra is 1.6 kyr), there have been no studies using 226Ra-210Pb to provide high resolution ages on basalts less than 100 years old.
Here we report (230Th/238U), (226Ra/230Th), (210Pb/226Ra) and (234U/238U) disequilibria for eleven lavas from the ABE vent site in the Lau Basin. Because the half-life of 210Pb is 22 years, the (210Pb/226Ra) measurements provide a temporal record of eruption ages on the order of tens of years. While (210Pb/226Ra) have previously been used to establish age limits for lavas (i.e., less than or older than 100 years, e.g., see Sims et al., 2008a), these results are the first published (210Pb/226Ra) model ages. When combined with complementary data (side-scan sonar, lava flow morphology, tectonic mapping), this high-resolution record provides fundamental time constraints for interdisciplinary studies examining oceanic crustal construction and development of the hydrothermal system in the ABE vent field.
2 Background
2.1 Geological background
2.1.1 Lau Spreading Center
Subduction of the Pacific plate at the Tonga trench has led to the formation of the NE-SW trending Tonga volcanic arc and the associated Lau Basin (Figure 1). Opening of the Lau Basin began at ∼6 Ma in response to rapid subduction of the Pacific plate along the Tonga, or Tofua, arc (Hergt and Farley, 1994; Hergt and Hawkesworth, 1994). Spreading south of 18°S is accommodated along the Central, Intermediate, and Eastern Lau Spreading Centers (ELSC). The ELSC runs from 19–22°S and can be further divided into five northwest stepping subsegments. From south to north these segments are the Valu Fa Ridge (VFR), ELSC IV, ELSC III, ELSC II, and ELSC I (Figure 1). Along the ELSC, the spreading rate increases northward from <60 mm/yr at 22°S to 90 mm/yr at 19°S (Zellmer and Taylor, 2001). Based on comparison with open ocean ridges, the ELSC’s morphology might be expected to vary from rift valley in the south to crustal plateau in the north. Instead, the slower spreading VFR is at a shallow water depth, has thicker crust, limited faulting, a prominent axial high, and a bright axial magma chamber reflector (AMCR). As spreading rates increase northward, the ridge deepens from 1,700 to 3,300 m, a well-developed rift valley forms, the crust thins, and the AMCR disappears. These changes occur as distance from the arc front increases from 35 km at 22°S to 100 km at 19°S (Martinez et al., 2006; Jacobs et al., 2007; Ferrini et al., 2008). The progressive change in distance from the volcanic front suggests that increased influence of the subduction component in the south leads to enhanced magmatic productivity, and that proximity to the arc trumps spreading rate in its influence on ridge morphology (Martinez et al., 2006). Distance from the arc also influences magma composition, as enrichment in mobile trace elements is greater in the southern segments of the ELSC (Escrig et al., 2009).
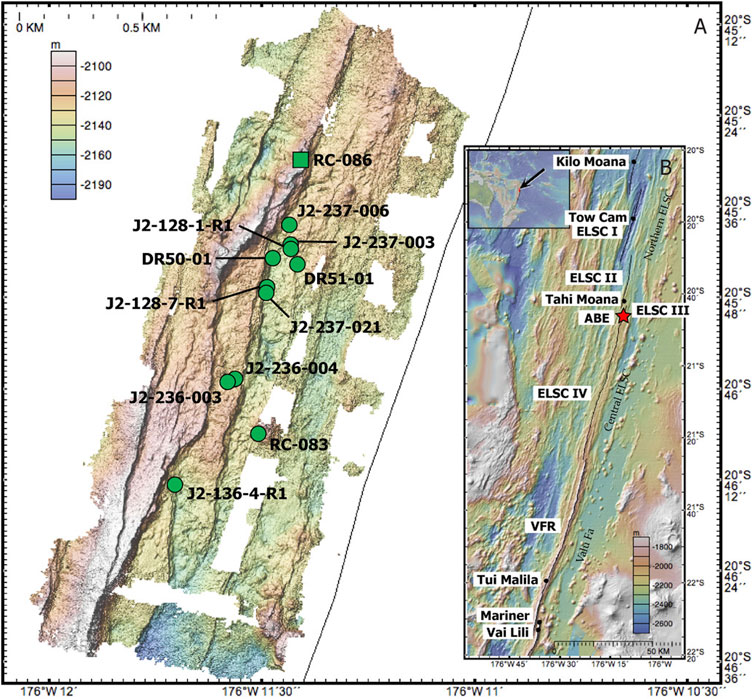
Figure 1. (A) Bathymetric map of the ABE vent field showing sample locations. (B) The large-scale map shows the segments of the Lau Spreading Center (Valu Fa, and the center and northern ELSC) and the various hydrothermal vents listed from south to north: Vai Lili, Mariner, Tui Malila, ABE (denoted with a red star), Tahi Moana, Tow Cam and Kilo Moana. The small inset shows the global context of the Lau Spreading Center. See Ferrini et al. (2008) for more details on imaging and location.
To take advantage of this unique tectonic setting, the Ridge 2000 program designated the Lau Basin one of three global integrated study sites (ISS). Initial bathymetry and side-scan sonar surveys were conducted in 2004 aboard the R/V Kilo Moana (KM0410; F. Martinez, Chief Scientist). Miniature Autonomous Plume Recorders (MAPRs) were also deployed to search for signs of hydrothermal activity (Baker et al., 2005; 2006; Martinez et al., 2006). A second cruise built upon this data by deploying the autonomous underwater vehicle (AUV) ABE and the Woods Hole Oceanographic Institute (WHOI) Towed Camera System (Tow Cam) to generate 1–2 m grid resolution bathymetry of areas where hydrothermal activity was suspected and to collect photos of the seafloor to ground truth previous observations. These data were used to constrain the location of three vent fields: ABE, Tow Cam, and Kilo Moana (Figure 1), with the ABE vent field being selected as the “bullseye” for the Lau ISS Ridge 2000 program. Because of the hydrothermal venting and the apparent young ages of the lavas our study focuses on the lavas of the ABE vent site (Figure 1).
2.1.2 ABE vent site
The ABE vent field (20°45.8′S, 176°11.5′W), is located 5 km south of the northern terminus of ELSC IV, ∼600 m west of the ridge axis, and at a water depth of 2,140 m. The transition from axial plateau to axial valley, as well as the disappearance of the ACMR, occurs just north of the ABE vent field. Within the ABE vent field, hydrothermal activity is localized at five sites, with an additional area of diffuse flow. The area is cut by three NE-SW striking normal faults, with throws of 10–20 m. Three flow fronts were also identified. Lava flows have a pillow/lobate texture, with columnar basalts visible in fault scarps (Martinez et al., 2006; Jacobs et al., 2007; Ferrini et al., 2008).
The ABE vent site, which is the focus of this study, is located on the central segment of the ELSC in the Lau back-arc basin (Figure 1). This portion of the ridge is broad (4.2 km) and tall (200 m) and a NE-SW fault area dominates the field. Several lava different flows with distinct surface morphologies are apparent throughout the ABE survey area. Additionally, remote operated vehicle (ROV) Jason 2 identified three areas of hydrothermal activity along 600 m of the NE–SW trending fault. For a highly detailed description of the ABE vent area the reader is referred to Ferrini et al. (2008).
2.2 Methodological background: Application of U-series dating of ocean ridge samples
Currently, U-series dating provides the best age constraints for young mid-ocean ridge lavas. The application of U-series disequilibria to the dating of young submarine basalts is well established (e.g., Rubin and Macdougall, 1990; Goldstein et al., 1991; Volpe and Goldstein, 1993; Rubin et al., 1994; Lundstrom et al., 1995; Sturm et al., 2000; Sims et al., 2002; Cooper et al., 2003; Sims et al., 2003; Sims et al., 2008a; Standish and Sims, 2010; Waters et al., 2011; Waters et al., 2013a; Waters et al., 2013b; Haase et al., 2016; Scott et al., 2019; Sims et al., 2021). See Sims et al. (2021) for a detailed overview of U and Th decay series dating methods.
Because the timescale of mantle circulation is on the order of hundreds of millions to billions of years it can be reasonably assumed that the mantle source starts out with U-series nuclides in a state of radioactive equilibrium. During petrogenetic processes, most significantly during partial melting, U-series disequilibrium is created by fractionation of parent-daughter nuclide pairs. In the absence of secondary processes (e.g., post-eruptive alteration), any disequilibria generated by magmatic processes are “locked in” once the lava has erupted and has solidified. The activity ratio then acts as a “stop-watch,” with parent and daughter returning to secular equilibrium after about five half-lives of the daughter isotope. Thus, the presence of disequilibria between a parent-daughter pair provides a maximum eruption age. Since 238U-230Th-226Ra-210Pb have half-lives ranging from ∼20 years to 75 kyr, these techniques are appropriate for dating MORB erupted 0.1–375 kyr.
Quantitative estimates of ages by other U-series methods are also possible. Internal isochrons, for example, make use of the differential retention of some radionuclides by different minerals (e.g., Ra is preferentially incorporated into feldspar). However, this technique requires phenocryst-rich samples and is therefore not suitable for MORB glasses. Even when samples contain abundant phenocrysts, the resolution of this method is limited by uncertainties in the phenocryst ages (i.e., have the phenocrysts resided in crustal storage for a significant period of time relative to the half-life of the daughter nuclide).
If the initial extent of disequilibrium at the time of eruption is known, then the difference between the initial activity ratio and the measured activity ratio can be used to determine the lava’s eruption age. These “model ages” improve the resolution of the U-series ages by roughly an order of magnitude for each parent-daughter pair; tens of thousands of years resolution for 230Th model ages and hundreds to thousands of years resolution for 226Ra model ages. It is important to note that model ages assume a constant source (spatially and temporally) and are the sum of a sample’s crustal residence time (i.e., magma storage time) and their eruption age. When determining U-series model ages for a related group of samples, several assumptions must be accounted for (Sims et al., 2003):
1. The lavas reflect melting of source material which has spatially and temporally constant U/Th.
2. The initial extent of disequilibria of the lavas is known. This requires similar degrees of melting and melting depths, as well as similar ascent rates (e.g., McKenzie, 1985; Williams and Gill, 1989; Spiegelman and Elliott, 1993; Lundstrom et al., 1995; Sims et al., 1995; 1999; 2002).
3. The U-series disequilibria result from primary magmatic processes, and the lavas remained a closed system with respect to U, Th, Ra, and Pb after eruption.
4. The timescales of magma storage and eruption after the processes generating U-series disequilibria ceases must be short relative to the half-lives of 230Th, 226Ra, and 210Pb.
When these conditions are met, U-series model ages can provide constraints for the timing of eruption. This is demonstrated in studies of the East Pacific Rise, where large data sets and the necessary isotopic and geochemical data are available to develop meaningful model ages. In this setting, model ages indicate that mid-ocean ridge magmatism occurs over a wide area and is not limited to the axial trough (Sims et al., 2003; Waters et al., 2013a; Waters et al., 2013b).
3 Sample collection
Samples were collected during three cruises: KM0417 in 2004 (R/V Kilo Moana; C. Langmuir, Chief Scientist), TUIM05MV in 2005 (R/V Melville; M.K. Tivey, Chief Scientist), and MGLN07MV in 2006 (R/V Melville; C. Fisher, Chief Scientist). Although the samples collected during KM0417 consist of two dredge samples and two rock cores, the remaining seven samples collected during TUIM05MV and MGLN07MV were collected using ROV Jason 2, and thus their locations and geological context are well-known (Table 1; Figure 1).
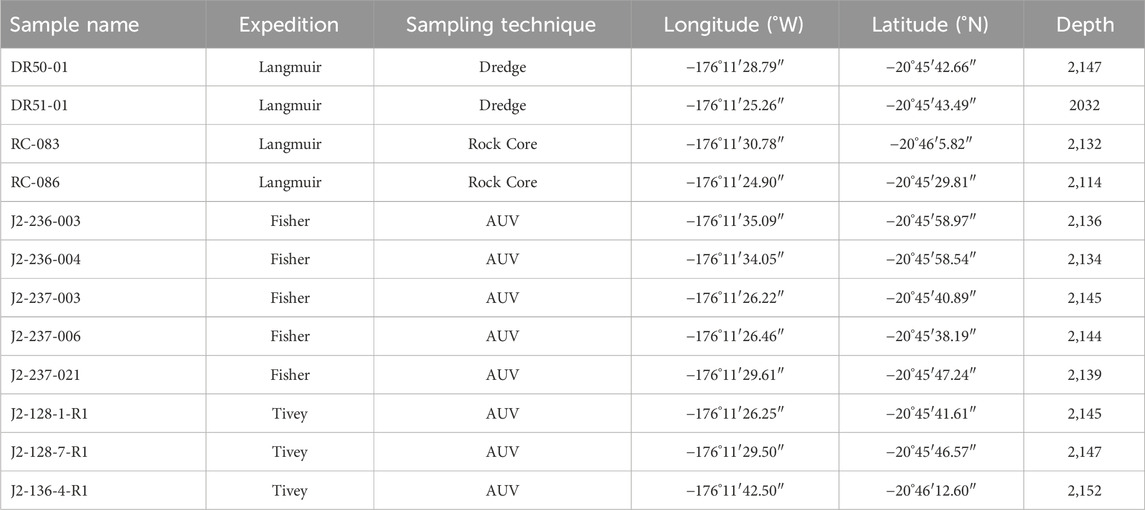
Table 1. ABE hydrothermal vent site sample description.
4 Analytical methods
Major elements (Table 2) were measured on glass chips using a Cameca SX-100 electron microprobe (EMP) at Rensselaer Polytechnic Institute (RPI) and a Cameca SX-50 at the University of Massachusetts, Amherst (See Bezós et al., 2009 for analytical details). Trace elements (Table 3) were measured by solution nebulized ICP-MS and laser ablation ICP-MS (SN-ICP-MS and LA-ICP-MS) at Harvard University (See Bezós et al., 2009 for analytical details). Pb, Sr, and Nd isotope ratios were measured on dissolved solutions at the Lamont-Doherty Earth Observatory (LDEO; see Escrig et al., 2009 for analytical details).
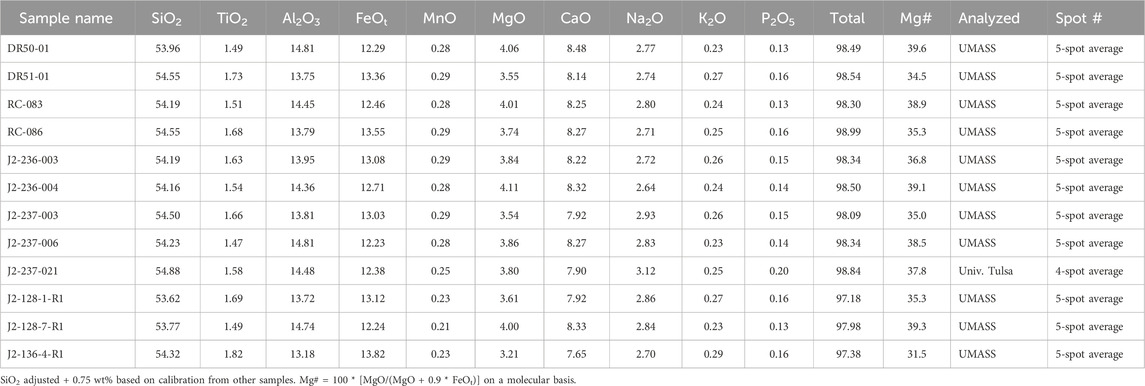
Table 2. ABE hydrothermal vent major element abundances.
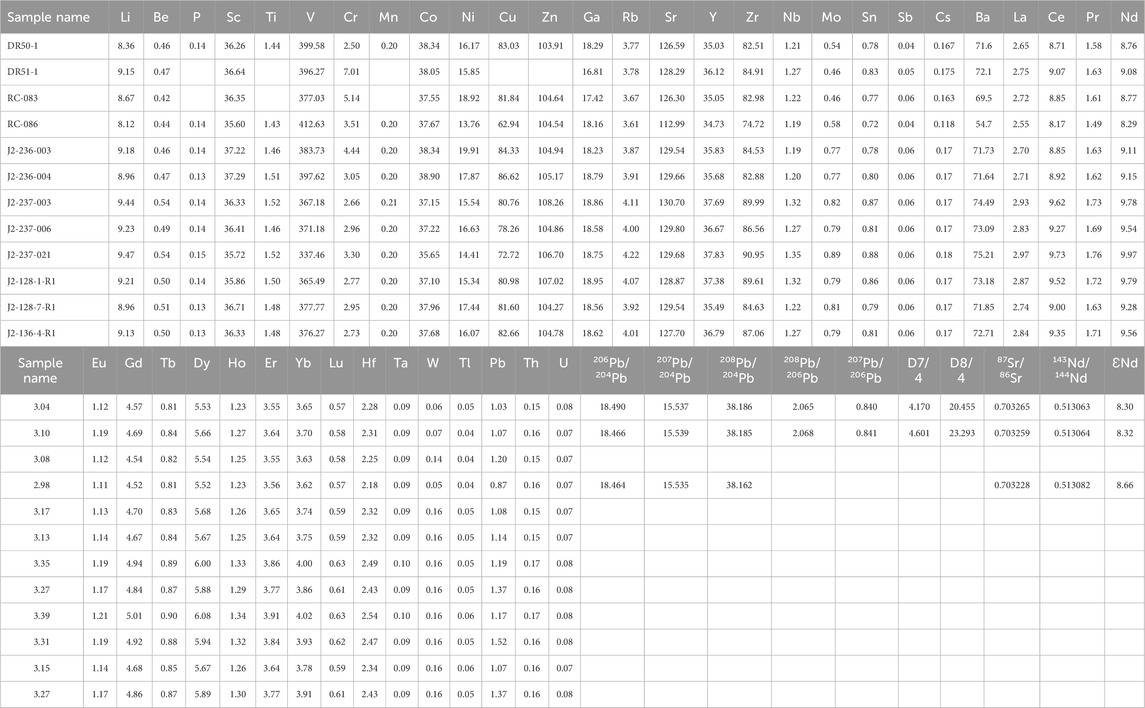
Table 3. ABE hydrothermal vent trace element abundances and isotopic compositions.
Briefly, the 238U, 234U, 232Th, 230Th and 226Ra concentrations and isotopic compositions (Table 4) were measured on dissolved and spiked solutions on the WHOI ThermoFisher NEPTUNE following procedures described by Sims et al., 2008a; Sims et al., 2008b), Ball et al. (2008) and Scott et al. (2019). The activities of 210Pb were measured by analyzing samples for its descendent 210Po and assuming (210Pb/210Po) = 1 before Pb-Po chemical separation. Analytical details for 210Po are discussed in Reagan et al. (2005) and Waters et al. (2013). Because the U-decay series measurements are the focus of this paper, the full analytical details for these methods are discussed in full in Supplementary Appendix SA. U-Series abundances and activities for two quality assurance standards, USGS Reference Material Columbia River Basalt (BCR-2) and the U-series community reference material Table Mountain Latite (TML) are also reported in Table 4.
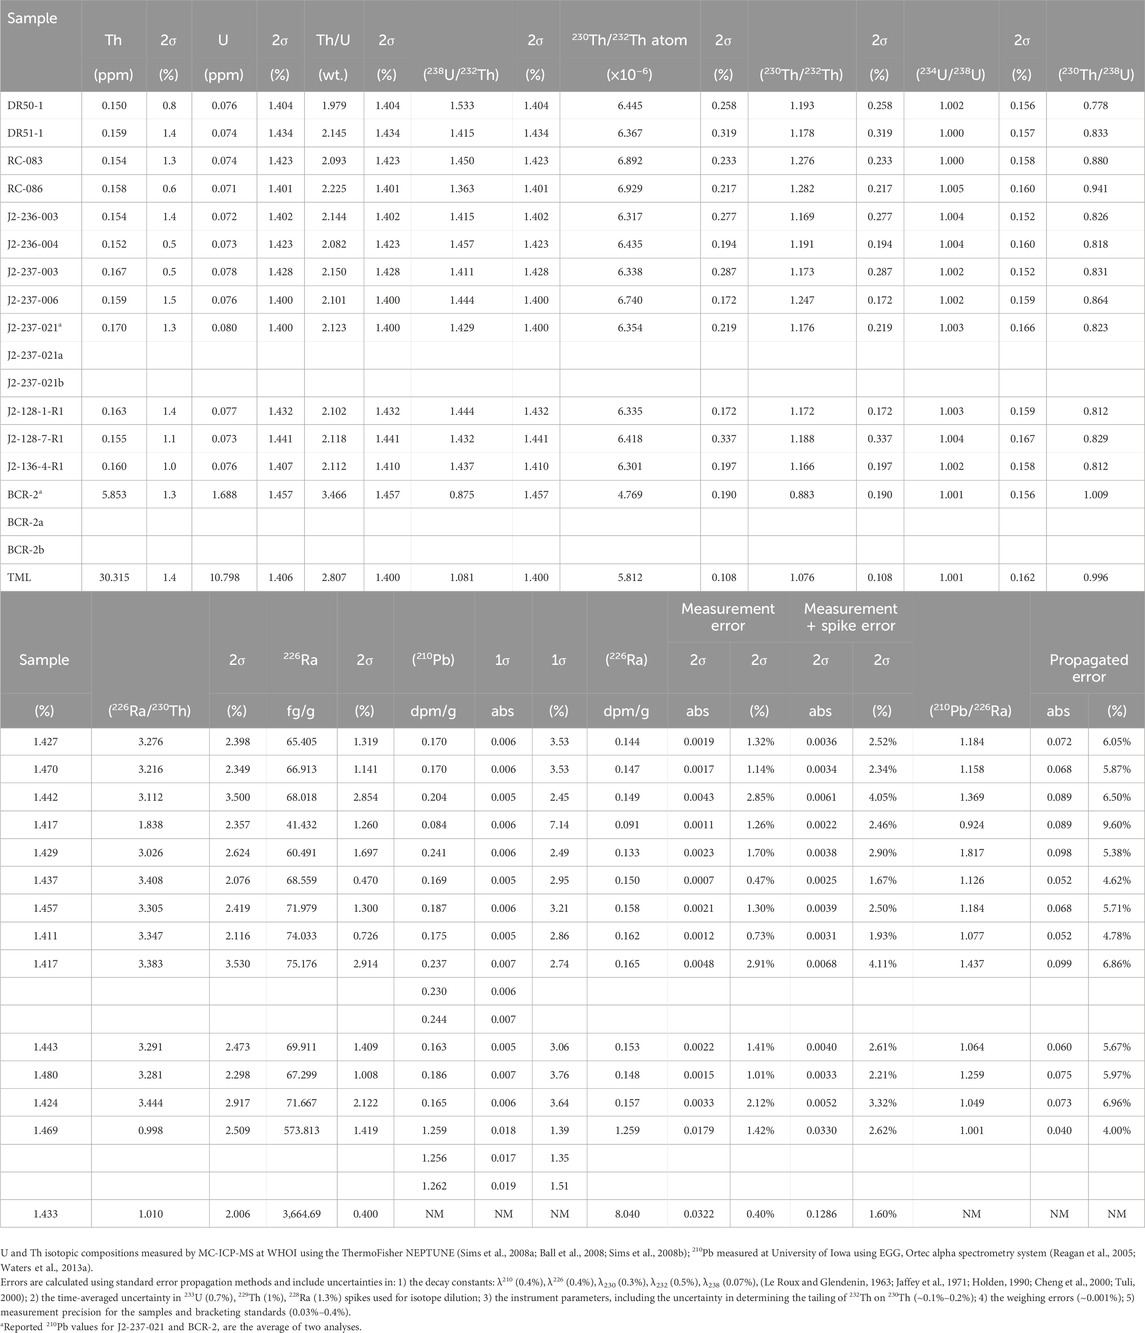
Table 4. ABE hydrothermal vent site U-series abundances and isotopes.
5 Results
On a total alkali silica diagram (Figure 2), the ABE site lavas are basaltic andesites, with silica contents ranging from 53.62–54.88 weight percent, total alkalis (Na2O plus K2O) ranging from 2.88 to 3.77 weight percent and molar Mg numbers ranging from 32 to 40 (Table 2). The ABE samples are light rare earth element (LREE) depleted with CI normalized (Palme and O’Neill, 2014) (La/Dy)n ranging from 0.49 to 0.52 and have flat heavy rare earth (HREE) element patterns with (Dy/Yb)n ranging from 0.99 to 1.01 (Table 3; Figure 3). These ABE samples’ LREE are more depleted than average N-MORB and their HREE are slightly more enriched and show a limited range in composition compared to the rest of the ELSC. On an extended trace element diagram normalized to primitive mantle (Palme and O’Neill, 2014), these samples have distinct enrichments of Ba, U and K and relative depletions of Nb and Ta (Table 3; Figure 3). Overall, these lavas are tholeiitic based on the high FeO*/MgO at approximately 54% SiO2. Their depleted LREE patterns and enrichment in fluid-mobile elements, indicate that they are very similar to classic arc-tholeiites. Compositionally, it is important to note that one sample, RC-086, has a distinctive chemistry with lower LREE and other trace element abundances, most notably Pb, than the rest of the ABE samples. Thus, sample RC-086 is plotted separately on all figures to highlight its chemical and isotopic distinction.
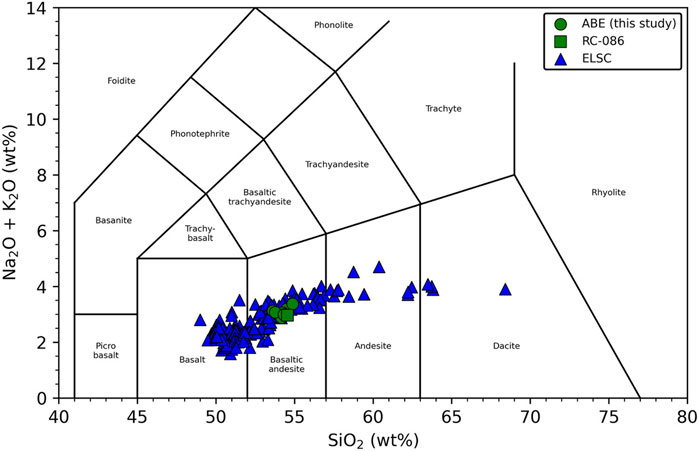
Figure 2. Total alkali vs. silica diagram after Le Maitre et al. (2002). Data for Eastern Lau Spreading Center from Peate et al. (2001), Bézos et al. (2009), and Gale et al. (2013).
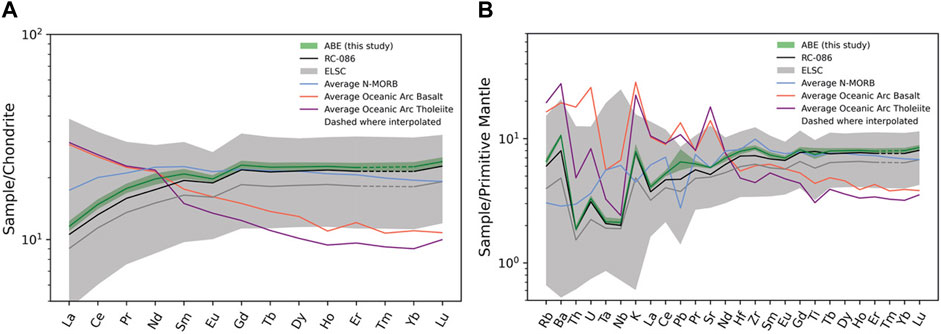
Figure 3. (A) CI normalized (Palme and O’Neill, 2014) rare-earth element plot. The green field is the ABE vent site and the dark green is the average of the ABE samples, excluding RC-086. Grey field is the Eastern Lau field with dark grey line being the average, with data for Eastern Lau field from Bezos et al. (2009). Sample RC-086 is plotted separately on all figures to highlight its chemical distinction. The mean composition of MORB comes from Gale et al. (2013). Average oceanic arc is from Kelemen et al. (2014). Average arc tholeiite comes from a weighted average of data from Vanuatu and Palau, Schmidt and Jagoutz (2017). (B) Primitive mantle normalized (Palme and O’Neill, 2014), extended trace element plot.
Radiogenic isotope ratios are only available for three ABE samples: two dredge samples (DR50-1 and DR51-1) and one rock core sample (RC-086) (Table 3). Results for the two dredge samples (DR50-1 and DR51-1) were previously reported in Escrig et al. (2009). Within the ABE vent field, 206Pb/204Pb ranges from 18.426–18.490, 207Pb/204Pb ranges from 15.535–15.530, 208Pb/204Pb ranges from 38.132–38.186; 143Nd/144Nd ranges from 0.513053–0.513064 (ƐNd = 8.30–8.66) and 87Sr/86Sr ranges from 0.703008–0.703265. The compositional range of long-lived radiogenic isotopes observed within the ABE vent field is limited, especially when compared with the whole of the ELSC (Figure 4).
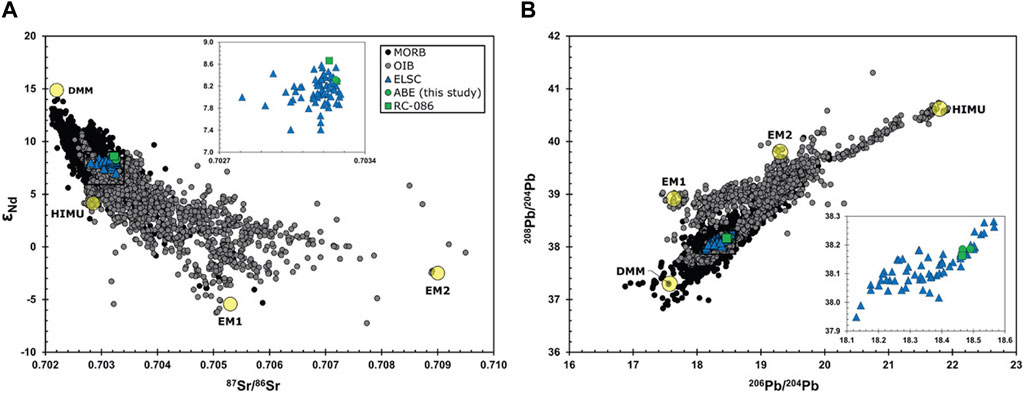
Figure 4. (A) εNd versus 87Sr/86Sr and (A) 208Pb/204Pb versus 206Pb/204Pb for ABE samples compared to ELSC (Escrig et al., 2009) and MORB-OIB database (see Supplementary Appendix SB). End-member mantle compositions are shown with yellow symbols; depleted MORB mantle (DMM) from Zindler and Hart (1986), Salters and Stracke (2004), and Sims and Hart (2006); HIMU and Enriched Mantle 1 (EM1) from Zindler and Hart (1986) and Hart et al. (1992); and Enriched Mantle 2 (EM2) from Workman et al. (2004).
U-Series abundances and activities for the ABE samples and two quality assurance standards (BCR-2 and TML) are reported in Table 4. Recommended values for these U-series standards are tabulated in Sims et al. (2008b) and Scott et al. (2019). For a full discussion of the pedigree and site locations for each of these reference materials see Sims et al. (2008b). In the following discussion we have listed the results of RC-086 separately.
• (234U/238U) ranges from 1.000 to 1.004, with an average (234U/238U) of 1.002 ± 0.001 (2SD). Both standard reference samples, TML and BCR-2, have (234U/238U) of 1.001 ± 0.002. Although all samples measured have one to two per mil (234U) excesses we note that these measurements were not conducted with abundance sensitivity (RPQ) filtering, so there is likely some down mass contribution from 235U on 234U (Scott et al., 2019). RC-086 is furthest from equilibrium with (234U/238U) of 1.005 ± 0.002. These values indicate that alteration by seawater is negligible.
• (230Th/238U) ranges from 0.778 to 0.880, with an average (230Th/238U) of 0.828 ± 0.012 (2SD). Standards reference samples TML and BCR-2 have (230Th/238U) of 0.996 and 1.009, respectively. RC-086 has a (230Th/238U) of 0.941 ± 0.013, much higher than the other ABE samples (Figure 5).
• (226Ra/230Th) ranges from 3.026 to 3.444, with an average (226Ra/230Th) of 3.281 ± 0.086 (2SD). Standards reference samples TML and BCR-2 have (226Ra/230Th) of 1.010 and 0.998, respectively. RC-086 has a (226Ra/230Th) of 1.838 ± 0.043, which is much lower than the other ABE samples (Figures 5–7).
• (210Pb/226Ra) ranges from 1.05 to 1.82, with an average (210Pb/226Ra) of 1.25 ± 0.07 (2SD). Standards reference sample BCR-2 has (210Pb/226Ra) of 1.00± 0.03. RC-086 has a (210Pb/226Ra) of 0.92 ± 0.13 (Figure 7).
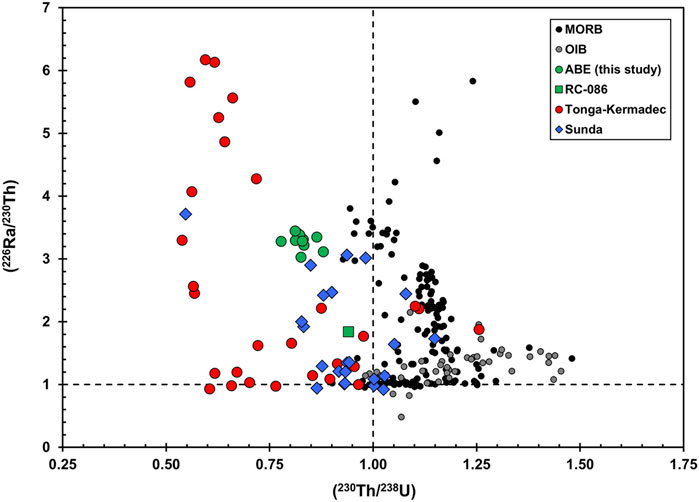
Figure 5. (230Th/238U) versus (226Ra/230Th) for the Lau ABE Basalts. Also shown are the MORB-OIB database (see Supplementary Appendix SB for references) and the lavas from the Tonga-Kermadec arc (Turner et al., 1997) and the Sunda arc (Turner and Foden, 2001). Note how all the ABE samples except RC-086 cluster tightly, suggesting similarities in their petrogenetic processes.
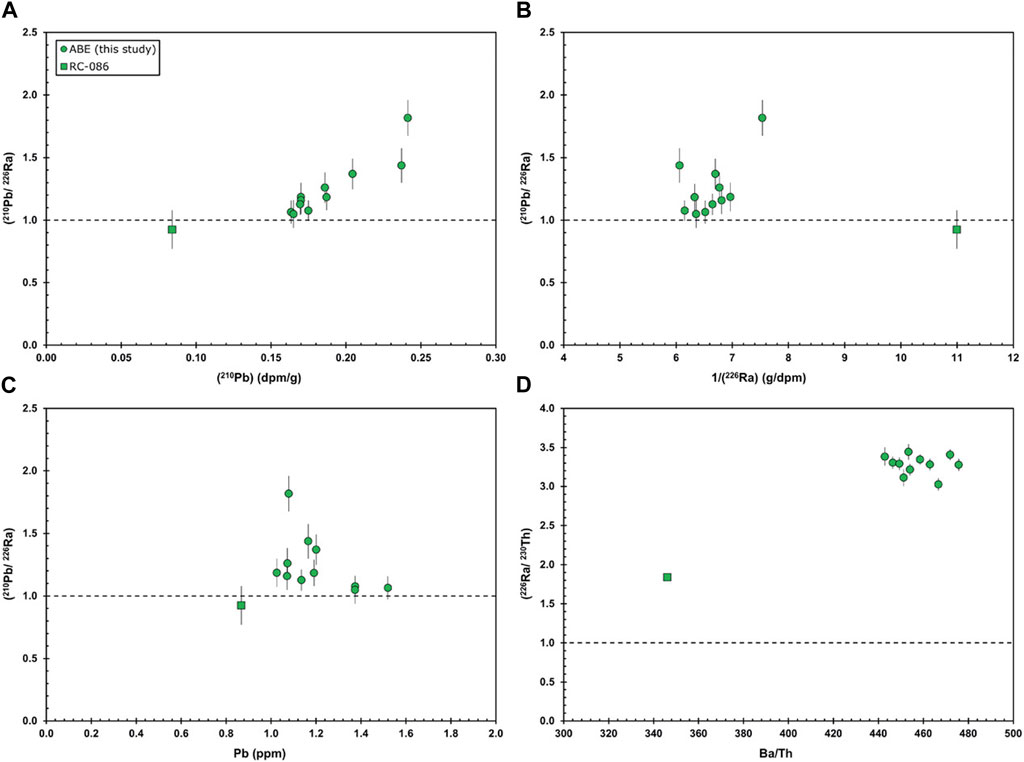
Figure 6. (210Pb/226Ra) vs. (A) (210Pb), (B) 1/(226Ra), and (C) Pb concentration. (210Pb/226Ra) is positively correlated with (210Pb), but not (226Ra) or Pb concentration (see text for details). However, sample RC-086 has low Pb concentration, which suggests that the small 210Pb deficit in this sample is possibly due to post-eruptive Pb loss. (D) (226Ra/230Th) vs. Ba/Th; note that both ratios are low in RC-086 relative to the other lavas.
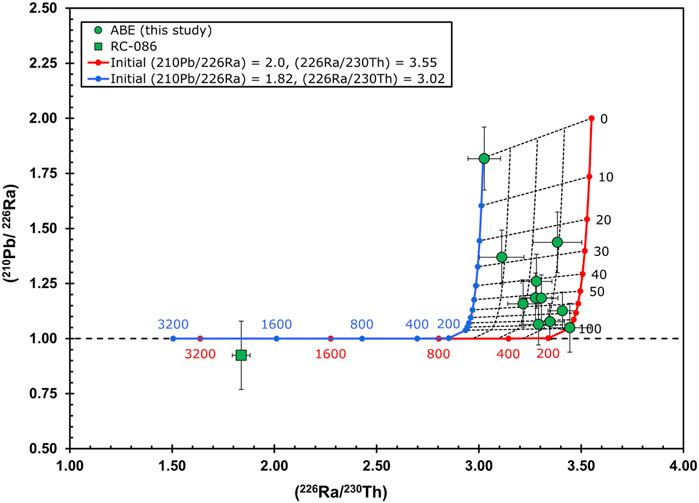
Figure 7. (210Pb/226Ra) vs. (226Ra/230Th) showing ABE vent field lavas and age trajectories calculated assuming (210Pb/226Ra)0 = 1.82 or 2.0 and (226Ra/230Th)0 = 3.02 or 3.55 and then interpolating a model zero-age isochron between the two endmembers. The majority of samples have (210Pb/226Ra) > 1, indicating that they erupted within the past 100 years. RC-086 likely erupted more than 100 years ago; if this sample had (226Ra/230Th) = 3.05–3.63, then 1,800–2,500 years have elapsed since eruption. See text for details.
6 Discussion
6.1 210Pb-226Ra-230Th ages of ABE vent site lavas
Since secular equilibrium is achieved after ∼5 half-lives, the presence of disequilibria between a parent-daughter pair provides an eruption age limit. All ABE lavas have (230Th/238U) < 1, indicating they were erupted less than 350 kyr ago and (226Ra/230Th) > 1, indicating they were erupted less than 8 kyr ago. Far more stringent constraints on their age are that all the ABE lavas (except RC-086) have (210Pb/226Ra) > 1, implying that these lavas erupted within the past 100 years.
In practice, eruption ages are better constrained than these age limits because samples with large disequilibria are likely much younger than the maximum age limit. To further constrain ages, if the initial extent of disequilibrium at the time of eruption is known or can be reasonably approximated, then the difference between the initial activity ratios and the measured activity ratios can be used to determine the lava’s eruption age. These “model ages” significantly improve the resolution of the U-series ages. For these ABE lavas, we use our (210Pb/226Ra) measurements to provide decadal constraints on lava eruption ages.
It is important to note, however, that model ages assume that, upon eruption, the lavas started with the same extent of disequilibria, which requires that they had similar source compositions, were produced by similar degrees of melting, and experienced identical petrological processing, such as extents of crystallization, or in the case of 210Pb, experienced similar magma-gas interactions. It is also important to remember that the model ages are the sum of a sample’s crustal residence time (i.e., magma storage time) and their eruption age.
For the following reasons we argue that these ABE lavas are ideal for determining (210Pb/226Ra) model ages.
(1) The lavas share a common source. Although long-lived radiogenic isotope ratios are only available for three ABE samples, the isotopic and major and trace element compositional ranges observed within the ABE vent field are small. For example, compared to the ELSC (Figure 4) range of 206Pb/204Pb of 18.13–18.66, 206Pb/204Pb within ABE is 18.46–18.49, or roughly 6% of the total range in ELSC lavas (Escrig et al., 2009). Therefore, it is reasonable to conclude that the ABE lavas share a common mantle source.
(2) The ABE lavas reflect similar extents of melting, with similar melting and ascent rates. Except for sample RC-086, the ABE lavas with 210Pb excesses have a limited range of major and trace element abundances (Tables 2, 3; Figures 2, 3) and have similar extents of (230Th/238U) and (226Ra/230Th) disequilibria (Figure 5).
(3) The ABE lavas’ U-Th-Ra-Pb disequilibria result from primary magmatic processes. Although (234U/238U) of the ABE samples are not exactly within secular equilibrium, it is highly unlikely that these slight excesses of 234U are a result of secondary alteration processes because of the likely slight tailing of 235U on 234U. Furthermore, these samples’ (234U/238U) does not vary systematically with K2O/P2O5 ratios, another measurement of secondary alteration. Furthermore, neither (234U/238U) nor K2O/P2O5 vary systematically with (210Pb/226Ra).
(4) ABE lavas have (210Pb/226Ra) as high as 1.82. This maximum value also is the highest measured to date for any lava erupted from a spreading center (c.f., Rubin et al., 2005; Waters et al., 2013) and lavas with (210Pb/226Ra) values greater than 2 are rare in any tectonic setting (e.g., Berlo and Turner, 2010; Reagan et al., 2017). Thus, the length of time that elapsed between generation of 210Pb-226Ra disequilibria in magma and eruption of lava was short with respect to the 22.3-year half-life of 210Pb. In this regard, we note that among the samples with 210Pb excess, (210Pb/226Ra) is positively correlated with (210Pb) but does not vary systematically with 1/(226Ra) or Pb concentration, indicating that (210Pb/226Ra) > 1 results from enrichment of 210Pb or its parent 222Rn, rather than removal of Ra or enrichment of Pb (Figure 6).
Given that all the ABE samples except RC-086 meet the above criteria, we calculate (210Pb/226Ra) model ages for the time (T) since sample eruption using:
where (210Pb/226Ra)m is the measured ratio, (210Pb/226Ra)o is the calculated initial ratio at the time of the lavas’ eruption (Table 5), and λ210 is the decay constant of 210Pb.
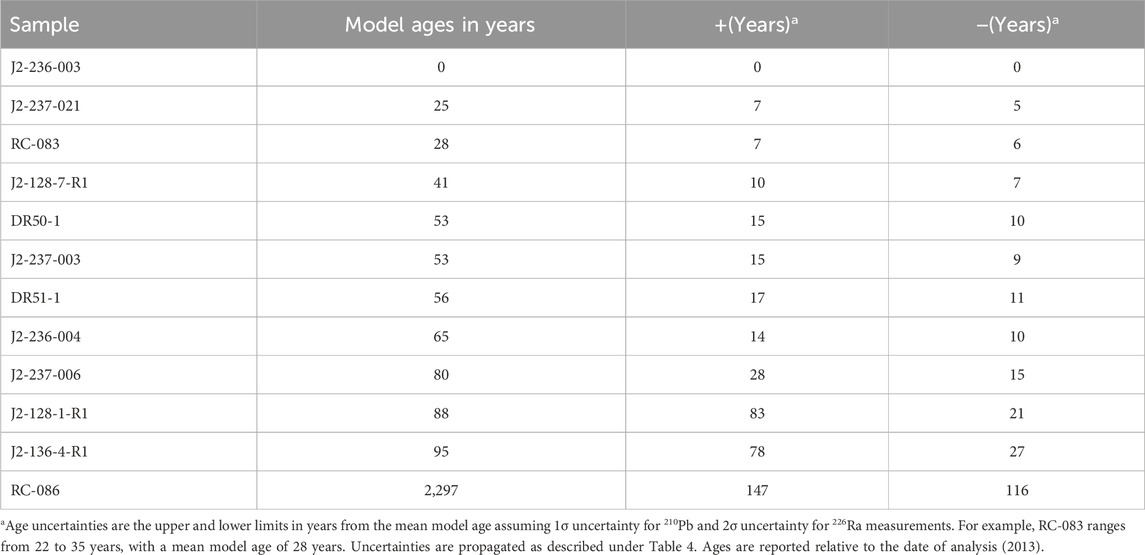
Table 5. (210Pb/226Ra) Model Ages.
Calculating these (210Pb/226Ra) model eruption ages requires an assessment of the initial extent of 210Pb excess at the time of these samples’ eruption. Although (210Pb/226Ra) as high as seven has been measured, (210Pb/226Ra) greater than two is extremely rare (Berlo and Turner, 2010; Reagan et al., 2017). To model these samples’ eruption ages, we use two possible and reasonable end-member scenarios as bracketing starting conditions. Although, somewhat arbitrary, we have chosen the given endmembers {(210Pb/226Ra)0 = 1.82 to 2.0 and (226Ra/230Th)0 = 3.02 to 3.55} because they closely bracket the observed range in the observed lavas (Figure 7; Table 4). We then interpolate a model zero-age isochron between the two endmembers (Figure 7). Given this model zero-age isochron we use the samples’ (226Ra/230Th) to establish their initial (210Pb/226Ra) and calculate the time of decay toward (210Pb/226Ra) since eruption. Because of the large difference in the half-lives of 210Pb (t1/2 = 22 years) and 226Ra (t1/2 = 1,600 years), the decay trajectory in (226Ra/230Th) versus (210Pb/226Ra) space (Figure 7) is essentially vertical. Over a period of one-hundred years, (226Ra/230Th) decreases by only 3%. For all samples except for RC-086, we calculate model eruption ages for all samples of 0–100 years, with an average eruption age for the vent field being roughly 53 ± 29 years at the time of analysis in 2013. It is important to note that because the model age isochrons get closer together over time the uncertainties in the sample ages increase.
In contrast to all other ABE vent site samples, RC-086 has a (210Pb/226Ra) that is slightly below unity but within error of equilibrium at the one-sigma level of uncertainty, and its measured (226Ra/230Th) is much lower than all other samples (Figure 7). The simplest explanation for this difference is that RC-086 is much older than the other samples; its equilibrium (210Pb/226Ra) indicates it erupted more than 100 years ago and, if one assumes the initial (226Ra/230Th) was the same as the young ABE samples (on the order of 1.8–2.0), then its measured (226Ra/230Th) provides a model eruption age of 1,800–2,500 years. However, some caution is warranted with this simple older eruption interpretation. RC-086, which is located on the northern edge of the vent field, is compositionally distinct from other ABE lavas (Figures 1–6), including having different (230Th/238U). Additionally, secondary alteration and post-eruptive Pb loss could be responsible for the lower 210Pb in this sample, since RC-086 has lower Pb concentration than the other samples and higher (234U/238U), which is also suggestive of secondary alteration. Therefore, RC-086 is either older than the other ABE samples, or the model ages for this sample are not valid because of either alteration of different initial starting conditions, or both.
To first order our model ages indicate that, at the 68% uncertainty level (1σ), all the ABE samples except RC-086 were erupted less than 100 years before the time of measurement (2013), with an average eruption age of 53 years. These very young model ages for the ABE vent field are consistent with both visual observations of these samples (Figure 8) as well as roughness analysis from side-scan sonar (Figure 9), suggesting that there is little sediment cover (Ferrini et al., 2008). Not surprisingly, the youngest of these samples cluster around the active vent sites. We thus infer that the ABE vent site’s location is a direct consequence of this concentrated young volcanism. Additionally, it is notable that the oldest eruption ages were measured for flows on the northern and southern ends of this vent site, consistent with the observations of Ferrini et al. (2008) that noted the heaviest sedimentation was observed in the extreme northern and southern extents of the survey area.
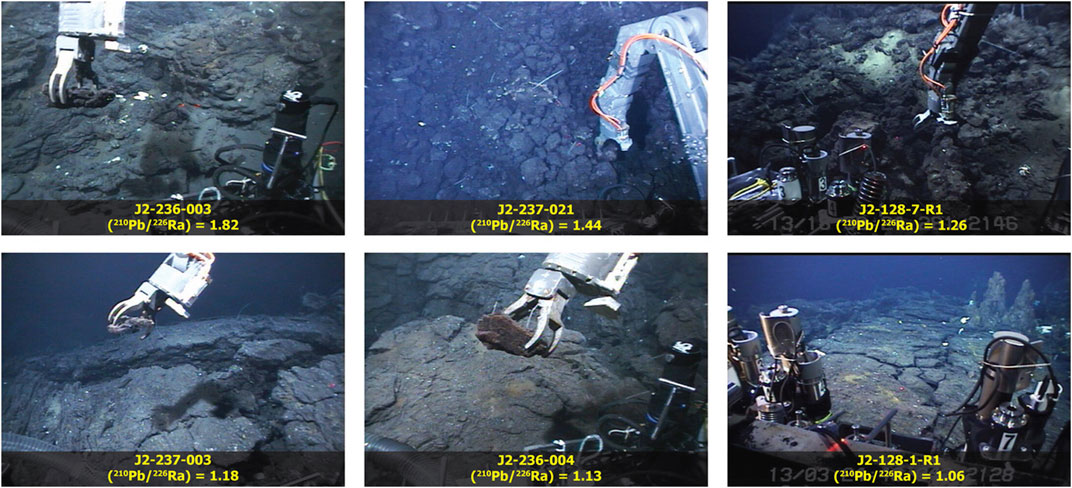
Figure 8. Sample photos taken by ROV Jason 2, arranged in order of model age (left to right with top row being the youngest).
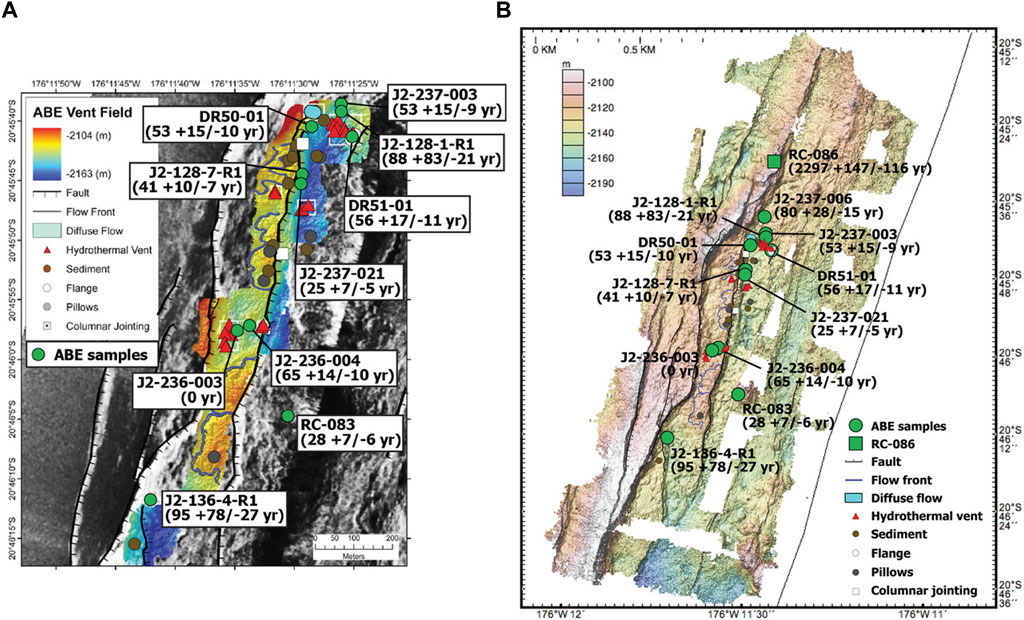
Figure 9. Maps of the ABE vent field showing sample locations and model eruption ages. Images show (A) DLS-120 Side Scan backscatter image and (B) High resolution bathymetry. Vent sites, faults and approximate location of faults and lava flow fronts from Ferrini et al. (2008).
The fact that all the ages of lava flows associated with the vent field are so young raises interesting questions about the timing relationships between eruptions and hydrothermal activity. One implication of the very young ages would be that recent eruptive activity leads to, or is at least associated with, active hydrothermal venting. Are all the hydrothermal vents along the ELSC also associated with very recent hydrothermal activity? Are eruptions on-going at this location? Is the hydrothermal activity at this site perhaps declining? Would lavas from portions of segments without recent activity be significantly older? The measurements we report hold the promise for addressing in far greater detail the connections between eruptive and hydrothermal activity on the decadal to century time scales.
6.2 Lau ridge construction
A notable aspect of the ABE vent field is that it is located ∼600 m west of the ridge axis. If one assumes that the lavas erupted on axis and that the average spreading rate at the latitude of ABE is ∼80 mm/year, then the expected age of these lavas is ∼7,500 years (Martinez and Taylor, 2002). There are two possible ways to reconcile the much younger apparent and model ages (Table 5) compared to the spreading rate ages. The first possibility is that magmatism in the ELSC is not localized at the ridge axis, and that off-axis magmatism has occurred quite recently. The second possibility is that the flows originated at the axis and have traveled as surface flows or through lava tubes to distances >600 m (e.g., Sims et al., 2003 for discussion on flows that likely originated at the axis and traveled off-axis at 9–10°N East Pacific Rise). Given the patterns of faulting, the bathymetry showing shallower depths and inflation adjacent to the vents, and the observed flow fronts, this later possibility is highly unlikely. Thus, we conclude that the ABE vent site is a locus of off-axis volcanism.
6.3 Petrological implications
These ABE lavas are notable in that they are highly enriched in (210Pb) relative to (226Ra). Such excesses of (210Pb) over (226Ra) have been reported for subsets of MORB and arc lavas and are commonly attributed to decay of 222Rn within an accumulated gas phase (e.g., Reagan et al., 2006; Sims et al., 2008a; Berlo and Turner, 2010; Condomines et al., 2010; Reubi et al., 2015), typically near a density or viscosity barrier within the magmatic system (e.g., Kayzar et al., 2009; Waters et al., 2013). In an arc setting, magmas are enriched in water from subducting plates. Loss of this water causes crystallization, which may result in rheological barriers to volatile-phase migration from below (e.g., Reagan et al., 2017). In a spreading center environment, magma differentiation away from a melt lens can also create a low-density, high-viscosity magma barrier (Waters et al., 2013). Thus, we similarly posit, for the following reasons, that these ABE lavas’ (210Pb) excesses were also created by a low-density, high-viscosity, rheological magma barrier which prevented volatile phase migration and caused a build-up of a222Rn-rich magma, which subsequently resulted in an ingrowth of 210Pb:
(1) These ABE lavas were erupted off-axis.
(2) These lavas have geochemical signatures suggesting that they have been significantly influenced by subduction processes and are therefore relatively water-rich.
(3) These lavas are significantly differentiated and are thus high viscosity and volatile rich.
7 Conclusion
• 210Pb-226Ra-230Th disequilibria presented here provide robust decadal scale age constraints for the ABE vent field lavas. While these results are specific to the ABE vent field, they demonstrate the potential of using 210Pb-226Ra disequilibria as a high-resolution chronometer for young lava fields of unknown age.
• All the samples except RC-086 have (210Pb/226Ra) > 1, which indicates that they erupted within the past 100 years. However, given the magnitude of their 210Pb-226Ra disequilibria, model ages suggest that many of the lavas erupted within the past 60 years (Table 5).
• In combination with high-resolution bathymetry, this high-resolution record provides fundamental time constraints for interdisciplinary studies examining oceanic crustal construction and the development of hydrothermal systems on in the ELSC.
• The young ages, shallower bathymetry, and localized faulting with emanating flow fronts at the ABE vent site represents a region of off-axis volcanism.
• While it may be possible to argue that sample RC-086 has an eruption age of 1,800–2,500 years, it is important to keep in mind that, although this sample is indeed likely to be much older, it has also undergone post-eruptive, secondary alteration thereby rendering its exact model age as uncertain.
• Lastly, we argue that these ABE lavas’ (210Pb) excesses were created by a low-density, high-viscosity, rheological magma barrier which prevented volatile phase migration and caused a build-up of a222Rn-rich magma, which consequently resulted in an ingrowth of 210Pb.
Data availability statement
The original contributions presented in the study are included in the article/Supplementary Material, further inquiries can be directed to the corresponding author.
Author contributions
KS: Conceptualization, Formal Analysis, Funding acquisition, Investigation, Methodology, Resources, Supervision, Writing–original draft, Data curation, Project administration, Validation, Visualization. LK: Visualization, Formal Analysis, Writing–original draft. GS: Formal Analysis, Visualization, Writing–review and editing. MR: Formal Analysis, Methodology, Writing–review and editing. JS: Formal Analysis, Methodology, Writing–review and editing. CL: Conceptualization, Funding acquisition, Resources, Writing–review and editing, Project administration.
Funding
The author(s) declare that financial support was received for the research, authorship, and/or publication of this article. This work was funded by National Science Foundation NSF OCE-0732480 (KS), NSF OCE-0732449 and OCE-0751844 (CL).
Acknowledgments
Lary Ball is greatly acknowledged for his support running the WHOI ICPMS Facility.
Conflict of interest
The authors declare that the research was conducted in the absence of any commercial or financial relationships that could be construed as a potential conflict of interest.
The author(s) declared that they were an editorial board member of Frontiers, at the time of submission. This had no impact on the peer review process and the final decision.
Publisher’s note
All claims expressed in this article are solely those of the authors and do not necessarily represent those of their affiliated organizations, or those of the publisher, the editors and the reviewers. Any product that may be evaluated in this article, or claim that may be made by its manufacturer, is not guaranteed or endorsed by the publisher.
Supplementary material
The Supplementary Material for this article can be found online at: https://www.frontiersin.org/articles/10.3389/fgeoc.2024.1413259/full#supplementary-material
References
Abdel-Karim, A. M., and Azzaz, S. A. (1995). On the age dating of the dyke swarms of southwestern Sinai, Egypt. Arab Gulf J. Sci. Res. 13 (1), 41–53.
Baker, E. T., Massoth, G. J., Nakamura, K., Embley, R. W., De Ronde, C. E. J., and Arculus, R. J. (2005). Hydrothermal activity on near-arc sections of back-arc ridges: results from the Mariana Trough and Lau Basin. Geochem. Geophys. Geosystems 6 (9), 2005GC000948. doi:10.1029/2005GC000948
Baker, E. T., Resing, J. A., Walker, S. L., Martinez, F., Taylor, B., and Nakamura, K. (2006). Abundant hydrothermal venting along melt-rich and melt-free ridge segments in the Lau back-arc basin. Geophys. Res. Lett. 33 (7), 2005GL025283. doi:10.1029/2005GL025283
Ball, L., Sims, K. W. W., and Schwieters, J. (2008). Measurement of 234U/238U and 230Th/232Th in volcanic rocks using the Neptune MC-ICP-MS. J. Anal. At. Spectrom. 23 (2), 173–180. doi:10.1039/B703193A
Batiza, R., Duncan, R. A., and Janecky, D. (1987) Dating of young MORB: report of a JO1-USSAC sponsored workshop held november 10-11. Evanston, Illinois: 1987 at Northwestern University.
Berlo, K., and Turner, S. (2010). 210Pb–226Ra disequilibria in volcanic rocks. Earth Planet. Sci. Lett. 296 (3–4), 155–164. doi:10.1016/j.epsl.2010.05.023
Bézos, A., Escrig, S., Langmuir, C. H., Michael, P. J., and Asimow, P. D. (2009). Origins of chemical diversity of back-arc basin basalts: a segment-scale study of the Eastern Lau Spreading Center. J. Geophys. Res. Solid Earth 114 (B06212). doi:10.1029/2008JB005924
Cheng, H., Edwards, R. L., Hoff, J., Gallup, C. D., Richards, D. A., and Asmerom, Y. (2000). The half-lives of uranium-234 and thorium-230. Chem. Geol. 169 (1–2), 17–33. doi:10.1016/S0009-2541(99)00157-6
Condomines, M., Sigmarsson, O., and Gauthier, P. J. (2010). A simple model of 222Rn accumulation leading to 210Pb excesses in volcanic rocks. Earth Planet. Sci. Lett. 293 (3–4), 331–338. doi:10.1016/j.epsl.2010.02.048
Cooper, K. M., Goldstein, S. J., Sims, K. W. W., and Murrell, M. T. (2003). Uranium-series chronology of Gorda Ridge volcanism: new evidence from the 1996 eruption. Earth Planet. Sci. Lett. 206 (3–4), 459–475. doi:10.1016/S0012-821X(02)01083-X
Duncan, R. A., and Hogan, L. G. (1994). Radiometric dating of young MORB using the 40Ar-39Ar incremental heating method. Geophys. Res. Lett. 21 (18), 1927–1930. doi:10.1029/94GL01375
Escrig, S., Bézos, A., Goldstein, S. L., Langmuir, C. H., and Michael, P. J. (2009). Mantle source variations beneath the Eastern Lau Spreading Center and the nature of subduction components in the Lau basin–Tonga arc system. Geochem. Geophys. Geosystems 10 (4), 2008GC002281. doi:10.1029/2008GC002281
Ferrini, V. L., Tivey, M. K., Carbotte, S. M., Martinez, F., and Roman, C. (2008). Variable morphologic expression of volcanic, tectonic, and hydrothermal processes at six hydrothermal vent fields in the Lau back-arc basin. Geochem. Geophys. Geosystems 9, Q07022. doi:10.1029/2008GC002047
Gale, A., Dalton, C. A., Langmuir, C. H., Su, Y., and Schilling, J. (2013). The mean composition of ocean ridge basalts. Geochem. Geophys. Geosystems 14 (3), 489–518. doi:10.1029/2012GC004334
Goldstein, S. J., Murrell, M. T., Janecky, D. R., Delaney, J. R., and Clague, D. A. (1991). Geochronology and petrogenesis of MORB from the Juan de Fuca and Gorda ridges by 238U–230Th disequilibrium. Earth Planet. Sci. Lett. 107 (1), 25–41. doi:10.1016/0012-821X(91)90041-F
Guillou, H., Hémond, C., Singer, B. S., and Dyment, J. (2017). Dating young MORB of the Central Indian Ridge (19°S): unspiked K-Ar technique limitations versus 40Ar/39Ar incremental heating method. Quat. Geochronol. 37, 42–54. doi:10.1016/j.quageo.2016.10.002
Haase, K. M., Brandl, P. A., Devey, C. W., Hauff, F., Melchert, B., Garbe-Schönberg, D., et al. (2016). Compositional variation and 226Ra-230Th model ages of axial lavas from the southern Mid-Atlantic Ridge, 8°48′S. Geochem. Geophys. Geosystems 17 (1), 199–218. doi:10.1002/2015GC006016
Hart, S. R., Hauri, E. H., Oschmann, L. A., and Whitehead, J. A. (1992). Mantle plumes and entrainment: isotopic evidence. Science 256 (5056), 517–520. doi:10.1126/science.256.5056.517
Hergt, J. M., and Farley, K. N. (1994). “26. Major element, trace element, and isotope (Pb, Sr, and Nd) variations in Site 834 basalts: implications for the initiation of backarc opening,” in Proceedings of the ocean drilling program. Editors J. W. Hawkins, L. M. Parson, J. F. Allan, J. Resig, and P. Weaver (Scientific Results), 135, 471–485.
Hergt, J. M., and Hawkesworth, C. J. (1994). “28. Pb-, Sr-, and Nd-isotopic evolution of the Lau Basin: implications for mantle dynamics during backarc opening,”. Proceedings of the ocean drilling program. Editors J. W. Hawkins, L. M. Parson, J. F. Allan, J. Resig, and P. Weaver (Scientific Results), 135, 505–517.
Holden, N. E. (1990). Total half-lives for selected nuclides. Pure Appl. Chem. 62 (5), 941–958. doi:10.1351/pac199062050941
Jacobs, A. M., Harding, A. J., and Kent, G. M. (2007). Axial crustal structure of the Lau back-arc basin from velocity modeling of multichannel seismic data. Earth Planet. Sci. Lett. 259 (3–4), 239–255. doi:10.1016/j.epsl.2007.04.021
Jaffey, A. H., Flynn, K. F., Glendenin, L. E., Bentley, W. C., and Essling, A. M. (1971). Precision measurement of half-lives and specific activities of 235U and 238U. Phys. Rev. C 4 (5), 1889–1906. doi:10.1103/PhysRevC.4.1889
Kayzar, T. M., Cooper, K. M., Reagan, M. K., and Kent, A. J. R. (2009). Gas transport model for the magmatic system at Mount Pinatubo, Philippines: insights from (210Pb)/(226Ra). J. Volcanol. Geotherm. Res. 181 (1–2), 124–140. doi:10.1016/j.jvolgeores.2009.01.006
Kelemen, P. B., Hanghøj, K., and Greene, A. R. (2014). “One view of the Geochemistry of subduction-related magmatic arcs, with an emphasis on primitive andesite and lower crust,” in Treatise on Geochemistry (Elsevier), 749–806. doi:10.1016/B978-0-08-095975-7.00323-5
Klein, E. M., White, S. M., Nunnery, J. A., Mason-Stack, J. L., Wanless, V. D., Perfit, M. R., et al. (2013). Seafloor photo-geology and sonar terrain modeling at the 9°N overlapping spreading center, East Pacific Rise. Geochem. Geophys. Geosystems 14 (12), 5146–5170. doi:10.1002/2013GC004858
Le Maitre, R. W., Streckeisen, A., Zanettin, B., Le Bas, M. J., Bonin, B., Bateman, P., et al. (2002) “Igneous rocks: a classification and glossary of terms,” in Recommendations of the international union of geological sciences, subcommission on the systematics of igneous rocks. Cambridge University Press.
Le Roux, L., and Glendenin, L. (1963). “Half-life of 232Th,” in Proceedings of the national meeting on nuclear energy, 83–94.
Lundstrom, C. C., Gill, J., Williams, Q., and Perfit, M. R. (1995). Mantle melting and basalt extraction by equilibrium porous flow. Science 270 (5244), 1958–1961. doi:10.1126/science.270.5244.1958
Martinez, F., and Taylor, B. (2002). Mantle wedge control on back-arc crustal accretion. Nature 416 (6879), 417–420. doi:10.1038/416417a
Martinez, F., Taylor, B., Baker, E. T., Resing, J. A., and Walker, S. L. (2006). Opposing trends in crustal thickness and spreading rate along the back-arc Eastern Lau Spreading Center: implications for controls on ridge morphology, faulting, and hydrothermal activity. Earth Planet. Sci. Lett. 245 (3–4), 655–672. doi:10.1016/j.epsl.2006.03.049
McKenzie, D. (1985). The extraction of magma from the crust and mantle. Earth Planet. Sci. Lett. 74 (1), 81–91. doi:10.1016/0012-821X(85)90168-2
Palme, H., and O’Neill, H.St. C. (2014). “Cosmochemical estimates of mantle composition,” in Treatise on Geochemistry (Elsevier), 1–39. doi:10.1016/B978-0-08-095975-7.00201-1
Peate, D. W., Kokfelt, T. F., Hawkesworth, C. J., Van Calsteren, P. W., Hergt, J. M., and Pearce, J. A. (2001). U-Series isotope data on Lau Basin glasses: the role of subduction-related fluids during melt generation in back-arc basins. J. Petrology 42 (8), 1449–1470. doi:10.1093/petrology/42.8.1449
Reagan, M., Tepley, F. J., Gill, J. B., Wortel, M., and Hartman, B. (2005). Rapid time scales of basalt to andesite differentiation at Anatahan volcano, Mariana Islands. J. Volcanol. Geotherm. Res. 146 (1–3), 171–183. doi:10.1016/j.jvolgeores.2004.10.022
Reagan, M., Turner, S., Handley, H., Turner, M., Beier, C., Caulfield, J., et al. (2017). 210Pb-226Ra disequilibria in young gas-laden magmas. Sci. Rep. 7 (1), 45186. doi:10.1038/srep45186
Reagan, M. K., Tepley, F. J., Gill, J. B., Wortel, M., and Garrison, J. (2006). Timescales of degassing and crystallization implied by 210Po–210Pb–226Ra disequilibria for andesitic lavas erupted from Arenal volcano. J. Volcanol. Geotherm. Res. 157 (1–3), 135–146. doi:10.1016/j.jvolgeores.2006.03.044
Reubi, O., Sims, K. W. W., Varley, N., Reagan, M., and Eikenberg, J. (2015). Timescales of degassing and conduit dynamics inferred from 210Pb– 226Ra disequilibria in Volcán de Colima 1998–2010 andesitic magmas. Geol. Soc. Lond. Spec. Publ. 422 (1), 189–206. doi:10.1144/SP422.5
Richter, S., and Goldberg, S. A. (2003). Improved techniques for high accuracy isotope ratio measurements of nuclear materials using thermal ionization mass spectrometry. Int. J. Mass Spectrom. 229 (3), 181–197. doi:10.1016/S1387-3806(03)00338-5
Rubin, K. H., and Macdougall, J. D. (1990). Dating of neovolcanic MORB using (226Ra/230Th) disequilibrium. Earth Planet. Sci. Lett. 101 (2–4), 313–322. doi:10.1016/0012-821X(90)90162-Q
Rubin, K. H., Macdougall, J. D., and Perfit, M. R. (1994). 210Po–210Pb dating of recent volcanic eruptions on the sea floor. Nature 368 (6474), 841–844. doi:10.1038/368841a0
Rubin, K. H., Van Der Zander, I., Smith, M. C., and Bergmanis, E. C. (2005). Minimum speed limit for ocean ridge magmatism from 210Pb–226Ra–230Th disequilibria. Nature 437 (7058), 534–538. doi:10.1038/nature03993
Salters, V. J. M., and Stracke, A. (2004). Composition of the depleted mantle. Geochem. Geophys. Geosystems 5 (5), 2003GC000597. doi:10.1029/2003GC000597
Schmidt, M. W., and Jagoutz, O. (2017). The global systematics of primitive arc melts. Geochem. Geophys. Geosystems 18 (8), 2817–2854. doi:10.1002/2016GC006699
Scott, S. R., Sims, K. W. W., Reagan, M. K., Ball, L., Schwieters, J. B., Bouman, C., et al. (2019). The application of abundance sensitivity filters to the precise and accurate measurement of uranium series nuclides by plasma mass spectrometry. Int. J. Mass Spectrom. 435, 321–332. doi:10.1016/j.ijms.2018.11.011
Sims, K. W. W., Blichert-Toft, J., Fornari, D. J., Perfit, M. R., Goldstein, S. J., Johnson, P., et al. (2003). Aberrant youth: chemical and isotopic constraints on the origin of off-axis lavas from the East Pacific Rise, 9°–10°N. Geochem. Geophys. Geosystems 4 (10), 2002GC000443. doi:10.1029/2002GC000443
Sims, K. W. W., DePaolo, D. J., Murrell, M. T., Baldridge, W. S., Goldstein, S., Clague, D., et al. (1999). Porosity of the melting zone and variations in the solid mantle upwelling rate beneath Hawaii: inferences from 238U-230Th-226Ra and 235U-231Pa disequilibria. Geochimica Cosmochimica Acta 63 (23–24), 4119–4138. doi:10.1016/S0016-7037(99)00313-0
Sims, K. W. W., DePaolo, D. J., Murrell, M. T., Baldridge, W. S., Goldstein, S. J., and Clague, D. A. (1995). Mechanisms of magma generation beneath Hawaii and mid-ocean ridges: uranium/thorium and samarium/neodymium isotopic evidence. Science 267 (5197), 508–512. doi:10.1126/science.267.5197.508
Sims, K. W. W., Gill, J. B., Dosseto, A., Hoffmann, D. L., Lundstrom, C. C., Williams, R. W., et al. (2008). An inter-laboratory assessment of the thorium isotopic composition of synthetic and rock reference materials. Geostand. Geoanalytical Res. 32 (1), 65–91. doi:10.1111/j.1751-908X.2008.00870.x
Sims, K. W. W., Goldstein, S. J., Blichert-toft, J., Perfit, M. R., Kelemen, P., Fornari, D. J., et al. (2002). Chemical and isotopic constraints on the generation and transport of magma beneath the East Pacific Rise. Geochimica Cosmochimica Acta 66 (19), 3481–3504. doi:10.1016/S0016-7037(02)00909-2
Sims, K. W. W., and Hart, S. R. (2006). Comparison of Th, Sr, Nd and Pb isotopes in oceanic basalts: implications for mantle heterogeneity and magma genesis. Earth Planet. Sci. Lett. 245 (3–4), 743–761. doi:10.1016/j.epsl.2006.02.030
Sims, K. W. W., Hart, S. R., Reagan, M. K., Blusztajn, J., Staudigel, H., Sohn, R. A., et al. (2008). 238U-230Th-226Ra-210Pb-210Po, 232Th-228Ra, and 235U-231Pa constraints on the ages and petrogenesis of Vailulu’u and Malumalu Lavas, Samoa. Geochem. Geophys. Geosystems 9 (4), 2007GC001651. doi:10.1029/2007GC001651
Sims, K. W. W., Pichat, S., Reagan, M. K., Kyle, P. R., Dulaiova, H., Dunbar, N. W., et al. (2013). On the time scales of magma genesis, melt evolution, crystal growth rates and magma degassing in the erebus volcano magmatic system using the 238U, 235U and 232Th decay series. J. Petrology 54 (2), 235–271. doi:10.1093/petrology/egs068
Sims, K. W. W., Stark, G. J., and Reagan, M. K. (2021). “An essential quaternary clock for earth system sciences: an overview of the theory and applications of U and Th decay series isotopes for the dating of young igneous and sedimentary rocks,” in Encyclopedia of geology. Editors S. Elias, and D. Alderton (Elsevier), 76–100. doi:10.1016/B978-0-08-102908-4.00167-3
Spiegelman, M., and Elliott, T. (1993). Consequences of melt transport for uranium series disequilibrium in young lavas. Earth Planet. Sci. Lett. 118 (1–4), 1–20. doi:10.1016/0012-821X(93)90155-3
Standish, J. J., and Sims, K. W. W. (2010). Young off-axis volcanism along the ultraslow-spreading southwest Indian ridge. Nat. Geosci. 3 (4), 286–292. doi:10.1038/ngeo824
Sturm, M. E., Goldstein, S. J., Klein, E. M., Karson, J. A., and Murrell, M. T. (2000). Uranium-series age constraints on lavas from the axial valley of the Mid-Atlantic Ridge, MARK area. Earth Planet. Sci. Lett. 181 (1–2), 61–70. doi:10.1016/S0012-821X(00)00177-1
Tuli, J. K. (2000) “Nuclear wallet cards,” in National nuclear data center. Upton: Brookhaven National Laboratory.
Turner, S., and Foden, J. (2001). U, Th and Ra disequilibria, Sr, Nd and Pb isotope and trace element variations in Sunda arc lavas: predominance of a subducted sediment component. Contributions Mineralogy Petrology 142 (1), 43–57. doi:10.1007/s004100100271
Turner, S., Hawkesworth, C., Rogers, N., Bartlett, J., Worthington, T., Hergt, J., et al. (1997). 238U-230Th disequilibria, magma petrogenesis, and flux rates beneath the depleted Tonga-Kermadec island arc. Geochimica Cosmochimica Acta 61 (22), 4855–4884. doi:10.1016/S0016-7037(97)00281-0
Turner, S., Sims, K. W. W., Reagan, M., and Cook, C. (2007). A 210Pb–226Ra–230Th–238U study of klyuchevskoy and bezymianny volcanoes, kamchatka. Geochimica Cosmochimica Acta 71 (19), 4771–4785. doi:10.1016/j.gca.2007.08.006
Volpe, A. M., and Goldstein, S. J. (1993). 226Ra-230Th disequilibrium in axial and off-axis mid-ocean ridge basalts. Geochimica Cosmochimica Acta 57 (6), 1233–1241. doi:10.1016/0016-7037(93)90060-A
Waters, C. L., Sims, K. W. W., Klein, E. M., White, S. M., Reagan, M. K., and Girard, G. (2013). Sill to surface: linking young off-axis volcanism with subsurface melt at the overlapping spreading center at 9°03′N East Pacific Rise. Earth Planet. Sci. Lett. 369–370, 59–70. doi:10.1016/j.epsl.2013.03.006
Waters, C. L., Sims, K. W. W., Perfit, M. R., Blichert-Toft, J., and Blusztajn, J. (2011). Perspective on the genesis of E-MORB from chemical and isotopic heterogeneity at 9–10°N East Pacific Rise. J. Petrology 52 (3), 565–602. doi:10.1093/petrology/egq091
Waters, C. L., Sims, K. W. W., Soule, S. A., Blichert-Toft, J., Dunbar, N. W., Plank, T., et al. (2013). Recent volcanic accretion at 9°N–10°N East Pacific Rise as resolved by combined geochemical and geological observations. Geochem. Geophys. Geosystems 14 (8), 2547–2574. doi:10.1002/ggge.20134
Workman, R. K., Hart, S. R., Jackson, M., Regelous, M., Farley, K. A., Blusztajn, J., et al. (2004). Recycled metasomatized lithosphere as the origin of the enriched mantle II (EM2) end-member: evidence from the Samoan volcanic chain. Geochem. Geophys. Geosystems 5 (4), 2003GC000623. doi:10.1029/2003GC000623
W Williams, R., and B Gill, J. (1989). Effects of partial melting on the uranium decay series. Geochimica Cosmochimica Acta 53 (7), 1607–1619. doi:10.1016/0016-7037(89)90242-1
Zellmer, K. E., and Taylor, B. (2001). A three-plate kinematic model for Lau Basin opening. Geochem. Geophys. Geosystems 2 (5), 2000GC000106. doi:10.1029/2000GC000106
Keywords: U-series, hydrothermal systems, high-resolution age dating, Lau Basin spreading centers, young volcanism
Citation: Sims KWW, Kant LB, Stark GJ, Reagan MK, Standish JJ and Langmuir CH (2024) High-resolution decadal-scale eruption age dating of young oceanic basalts at an active hydrothermal vent site. Front. Geochem. 2:1413259. doi: 10.3389/fgeoc.2024.1413259
Received: 06 April 2024; Accepted: 07 May 2024;
Published: 20 June 2024.
Edited by:
Jon Telling, Newcastle University, United KingdomReviewed by:
Claudio Marchesi, University of Granada, SpainAbdel-Aal M. Abdel-Karim, Zagazig University, Egypt
Copyright © 2024 Sims, Kant, Stark, Reagan, Standish and Langmuir. This is an open-access article distributed under the terms of the Creative Commons Attribution License (CC BY). The use, distribution or reproduction in other forums is permitted, provided the original author(s) and the copyright owner(s) are credited and that the original publication in this journal is cited, in accordance with accepted academic practice. No use, distribution or reproduction is permitted which does not comply with these terms.
*Correspondence: Kenneth W. W. Sims, a3NpbXM3QHV3eW8uZWR1