 Yaseswini Neelamraju1†Evisa Gjini2†Sagar Chhangawala3Hao Fan1Shuning He2Chang-Bin Jing4Ashley T. Nguyen2Subhash Prajapati1Caroline Sheridan5Yariv Houvras3
 Ari Melnick5
 A. Thomas Look2,4*
 Francine E. Garrett-Bakelman1,5,6,7*
- 1Department of Biochemistry and Molecular Genetics, University of Virginia, Charlottesville, VA, United States
- 2Department of Pediatric Oncology, Dana-Farber Cancer Institute, Boston, MA, United States
- 3Weill Cornell Medicine, New York, NY, United States
- 4Harvard Medical School, Boston, MA, United States
- 5Division of Hematology and Medical Oncology, Department of Medicine, Weill Cornell Medicine, New York, NY, United States
- 6Department of Medicine, University of Virginia, Charlottesville, VA, United States
- 7University of Virginia Cancer Center, Charlottesville, VA, United States
Introduction: Myelodysplastic syndrome (MDS) is a heterogeneous group of clonal hematopoietic disorders characterized by ineffective hematopoiesis, cytopenias, and dysplasia. The gene encoding ten-eleven translocation 2 (tet2), a dioxygenase enzyme that catalyzes the conversion of 5-methylcytosine (5mC) to 5-hydroxymethylcytosine, is a recurrently mutated tumor suppressor gene in MDS and other myeloid malignancies. Previously, we reported a stable zebrafish line with a loss-of-function mutation in the tet2 gene. The tet2m/m-mutant zebrafish developed a pre-MDS state with kidney marrow dysplasia, but normal circulating blood counts by 11 months of age and accompanying anemia, signifying the onset of MDS, by 24 months of age.
Methods: In the current study, we collected progenitor cells from the kidney marrows of the adult tet2m/m and tet2wt/wt fish at 4 and 15 months of age and conducted enhanced reduced representation of bisulfite sequencing (ERRBS) and bulk RNA-seq to measure changes in DNA methylation and gene expression of hematopoietic stem and progenitor cells (HSPCs).
Results and discussion: A global increase in DNA methylation of gene promoter regions and CpG islands was observed in tet2m/m HSPCs at 4 months of age when compared with the wild type. Furthermore, hypermethylated genes were significantly enriched for targets of SUZ12 and the metal-response-element-binding transcription factor 2 (MTF2)—involved in the polycomb repressive complex 2 (PRC2). However, between 4 and 15 months of age, we observed a paradoxical global decrease in DNA methylation in tet2m/m HSPCs. Gene expression analyses identified upregulation of genes associated with mTORC1 signaling and interferon gamma and alpha responses in tet2m/m HSPCs at 4 months of age when compared with the wild type. Downregulated genes in HSPCs of tet2-mutant fish at 4 months of age were enriched for cell cycle regulation, heme metabolism, and interleukin 2 (IL2)/signal transducer and activator of transcription 5 (STAT5) signaling, possibly related to increased self-renewal and clonal advantage in HSPCs with tet2 loss of function. Finally, there was an overall inverse correlation between overall increased promoter methylation and gene expression.
Introduction
The ten-eleven translocation 2 gene tet2, a dioxygenase enzyme that can catalyze the conversion of 5-methylcytosine (5mC) to 5-hydroxymethylcytosine, is a recurrently mutated gene in hematological malignancies, including myelodysplastic syndrome (MDS) (1, 2). TET2 functions as a tumor suppressor and thus loss-of-function mutations are found in myeloid malignancies (3–5). Because TET2 catalyzes the first step in CpG demethylation, tet2 mutations (tet2m/m) are thought to result in a failure to remove aberrant methylation, and thus would be expected to lead to a gain of DNA hypermethylation within the malignant myeloid clones, leading to the repression, or otherwise the aberrant expression, of genes important for myeloid differentiation (6).
To clarify the mechanisms through which the loss of tet2 contributes to myeloid malignancies using an in vivo animal model, we created a stable zebrafish line with loss-of-function mutations in the tet2 gene generated through zinc finger nuclease technology (7). The 4-bp deletion in tet2 (ACAT; tet2m/m) led to stop codons in amino acid 1162 (AA1162), which in turn disrupt the catalytic activity of the hydroxylase. The tet2m/m fish are viable and fertile, which allows the interrogation of tet2 loss in hematopoietic cells throughout development, from larvae to adulthood. The tet2m/m-mutant zebrafish developed myelodysplastic features in the kidney marrow at the age of 11 months (7). Myelodysplasia, reflected by aberrant nuclear and cytoplasmic maturation in May–Grünwald–Giemsa-stained blood and kidney marrow smears, was observed in the erythroid, myeloid, and progenitor cell lineages of all of the tet2 homozygous, and a subset of the heterozygous, mutant fish (7). In contrast, myelodysplasia was not observed in the kidney marrow smears of 11-month-old wild-type fish within the erythroid or myeloid cell lineages (7). The diagnosis of MDS requires both evidence of trilineage dysplasia in smears of the developing marrow cells and significantly deceased cell numbers of mature cells of at least one hematopoietic cell lineage in the peripheral blood. However, the peripheral blood counts were normal in 11-month-old tet2-mutant zebrafish, indicating that the process was limited to a pre-MDS stage (7). By 24 months of age, each of the tet2-mutant fish developed anemia, which, together with the marked dysplasia of the developing hematopoietic progenitors in the kidney marrow, formed the basis for an MDS diagnosis. The tet2m/m zebrafish model, which uniformly develops a dysplastic hematopoietic disorder that progresses to MDS with anemia thus allows for an interrogation of the underlying mechanisms that cause progression from disordered myeloid cell differentiation to fully transformed MDS. We have recently used this zebrafish model to investigate the selective activity of small-molecule drugs in the killing of tet2 mutants, compared with wild-type HSPCs, a chemical biology consequence of genomic mutations, which is analogous to the well-known genetic relationship called “synthetic lethality” (8, 9).
Using the tet2m/m zebrafish, we sought to understand the effect of tet2 loss on the CpG methylation state of the genome and gene expression patterns to identify potential molecular mechanisms that have an association with clonal expansion of the progenitor cells and disease progression in this disease model. Stem and progenitor cells, characterized by disordered growth and differentiation, play an important functional role in MDS pathogenesis and disease relapse. To capture events during disease progression to the pre-MDS state in this specific cell population, we collected progenitor cells from the kidney marrows of 4- and 15-month-old adult tet2m/m and tet2wt/wt fish and studied the changes in the DNA methylation levels associated with the promoters and CpG islands of specific genes.
Materials and methods
Zebrafish husbandry
Zebrafish are vertebrate animals, and all experiments and animal husbandry were conducted in accordance with the Dana-Farber Cancer Institute’s Institutional Animal Care and Use Committee (IACUC)-approved animal research protocol #02-107. The stocks of wild-type and mutant lines were maintained in accordance with a previously reported protocol (10).
Zebrafish genetic manipulation
One-cell fertilized zebrafish embryos were injected with various amounts of mRNAs encoding zinc finger nucleases (ZFNs) harboring DD/RR or EL/KK variant FokI nuclease domains, as previously described (7). Site-specific ZFN function was verified by PCR on genomic DNA (gDNA) using tet2-specific primers and then sequencing. The resulting tet2m/m zebrafish line, which has been described and characterized previously (7–9), was used in this study.
Genotyping
For adult stages, fish were individually genotyped using one forward (5′ ATCTCCAAGGTCTTGCAACCTA 3′) and one reverse (5′ ATACAAGCCCTCATCCACTGAT 3′) primer, as previously shown (7). The forward and reverse primers were located in the sixth and eighth exons of tet2, respectively. The PCR products, 668 bp in length, were sequenced with the forward primer.
Cell suspension preparation and flow cytometry.
The cell suspension preparation and flow cytometry were conducted as previously described (7). In short, 4-month- and 15-month-old wild-type tet2wt/wt and tet2m/m fish were anesthetized. The anesthesia of the fish was carried out prior to kidney removal to harvest the kidney marrow. The fish were anesthetized by immersion in a small fish tank containing 200 mg/L of tricaine methanesulfonate dissolved in fish water. The working solution (200 mg/L of tricaine methanesulfonate dissolved in fish water) was made fresh by diluting a stock solution of tricaine methanesulfonate (4 mg/mL) in deionized water buffered with Tris-HCL to pH 7.0, which was stored in a freezer at −20°C. Tricaine methanesulfonate is an ester-type local anesthetic agent that acts systemically when absorbed through the gills, and thereafter is distributed throughout the body via the blood and acts on the peripheral and central nervous systems. After the fish were completely anesthetized, the kidney containing the whole kidney marrow was surgically removed. We then euthanized the fish by transferring them to a small fish tank immersed in an ice bath with a higher concentration of tricaine methanesulfonate (of 500 mg/L), which was prepared fresh by diluting the stock solution as previously described. The fish were kept in this euthanizing dose of tricaine methanesulfonate for at least 30 minutes on ice and then frozen in plastic bags at −20°C in a freezer designated as the morgue, prior to disposal by our Animal Resource Facility.
The removed kidneys were dissected and placed in ice-cold 0.9 × phosphate-buffered saline (PBS) containing 5% fetal calf serum (FCS). Single-cell suspensions were generated by aspiration, followed by mild teasing of the kidney on a 40-μm nylon mesh filter with a pipette tip. Progenitor cells were sorted using a JF Aria II Cell Sorter (BD Biosciences) with high forward scatter/side scatter (FSC/SSC), as previously described.
Enhanced reduced representation of bisulfite sequencing
The enhanced reduced representation of bisulfite sequencing (ERRBS) was conducted as previously described (11, 12). Briefly, high-molecular-weight DNA was isolated from the progenitor cells using Qiagen’s AllPrep™ extraction kit, per the manufacturer’s instructions. The DNA was then digested with the MspI restriction enzyme. Fragments were purified and subjected to end repair, A-tailing, and ligation of methylated Illumina adapters. This was followed by bisulfite conversion and PCR amplification. The libraries were sequenced on an Illumina 2500 using a 50-bp single-end read approach, per the manufacturer’s instructions. The sequencing data were aligned with Zv9 as the reference genome using our in-house processing pipeline (11). The CpG sites with at least 10× coverage were used for downstream analysis. The sequencing statistics are included in Supplementary Table 1A.
Identifying high-variance CpGs
For each CpG, the interquartile range (IQR) across all samples was calculated using the “iqr” function in R (version 3.3.0; The R Foundation for Statistical Computing, Vienna, Austria). CpGs with an IQR greater than the 90th percentile were annotated as high-variance CpGs.
Bulk RNA sequencing
The RNA was isolated from the progenitor cells using Qiagen’s AllPrep extraction kit, per the manufacturer’s instructions. RNA-seq libraries were prepared using TruSeq™ RNA-Seq by poly(A) enrichment (Illumina) and sequenced on a HiSeq® 2000 system (Illumina) using a 50-bp single-end approach, per the manufacturer’s instructions. Sequencing statistics are included in Supplementary Table 1B.
RNA-seq quality control and alignment
FASTQ files were checked for quality using FASTQC (version 0.10.1). The reads were then aligned using STAR aligner (version 2.3.0) (13) in single-end mode. After sorting and indexing, the aligned files were used with BEDTools (version 2.16.1) (14) and the Ensembl zebrafish transcriptome (Zv9) to generate read counts for genes for all samples. We calculated the normalized expression values using DESeq2 normalization. The normalized expression values were averaged across the two replicates in each of the wild-type and mutant categories. Standard deviation was used to calculate the bounds for error bars.
Principal component analysis
Principal component analysis (PCA) was conducted using the “prcomp” function in R. The first two PCs were plotted using ggplot2 in R.
Differential methylation analysis
The change in DNA CpG methylation between any given groups for a given region was calculated using methylKit (15). Regions with a minimum coverage of 10 reads and a maximum coverage greater than the 90th percentile of read counts were excluded from the analysis. Regions with an absolute methylation difference of at least 15% at a statistical significance of less than 0.05 were annotated as differentially methylated regions (DMRs).
Differential gene expression analysis
Differential gene expression analysis of any two comparisons was conducted using DESeq2 (version 1.14.1) (16) package in R (version 3.3.0). The batch correction variable accounting for variation between replicates was added in the design equation. For each comparison, genes with greater than five reads across the samples were retained for analysis. Genes with an absolute value of log-fold change greater than 1 and a q-value less than 0.05 were annotated as differentially expressed genes (DEGs).
Pathway enrichment analysis
To identify significantly enriched pathways for a given set of genes (either DEGs or DMRs), we converted the zebrafish gene names to their human orthologs using BioMart from the Ensembl database (v70). Overlap of the human orthologs with known pathways was assessed using “enrichR” in the R package (17–19). Significantly enriched pathways were identified at a p-value less than 0.05.
Results
To examine the changes in DNA methylation and gene expression with aging of hematopoietic progenitors in normal and tet2-mutant zebrafish, we compared the DNA methylation status of CpG nucleotides across the zebrafish genome and gene expression by RNA-seq in the fluorescence-activated cell sorted (FACS) kidney marrow progenitor cells (HSPCs) of 4-month-old zebrafish with those of 15-month-old zebrafish (Figure 1). For the analysis of the DNA methylation status, we employed ERRBS, and RNA-seq was conducted using poly(A)-enriched RNA (see Methods, Supplementary Table 1 for sequencing statistics). PCA of the DNA methylation results separated the results based on the biological replicated pools, indicating the segregation of the biological replicates for each genotype at 4 and 15 months of age (Figure 2A), which supports a distinct DNA CpG methylation pattern in each of the genetic subtypes in fish at maturity (i.e., 4 months of age) and old age (i.e., 15 months of age).
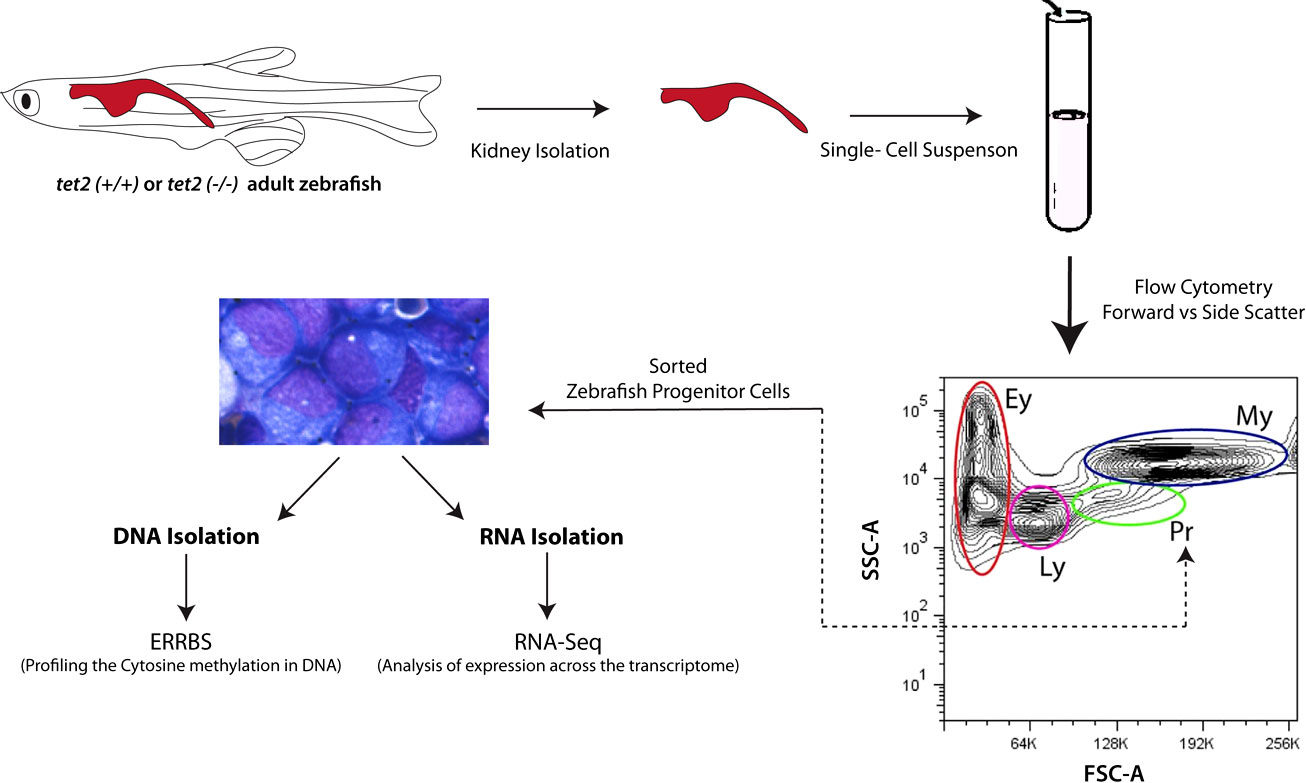
Figure 1 Schematic overview of studies of DNA methylation and RNA expression by zebrafish kidney marrow cells. The site of hematopoiesis in the adult zebrafish is in the head kidney (upper left of the diagram). Head kidney marrow cells from 4- and 15-month-old zebrafish were isolated and the progenitor cells were sorted by fluorescence-activated cell sorting based on their forward and side light scatter properties, as previously described (7). The sorted progenitor cells were then processed for DNA extraction using enhanced reduced representation of bisulfite sequencing to assess cytosine methylation. RNA was also extracted from an aliquot of the sorted progenitor cells for poly(A)+ RNA sequencing, as described in the Methods section. tet2, Ten-eleven translocation 2; ERRBS, Enhanced Reduced Representation of Bisulfite sequencing; Ey, erythrocytes; Ly, lymphocytes; Pr, progenitors; My, myelomonocytes.
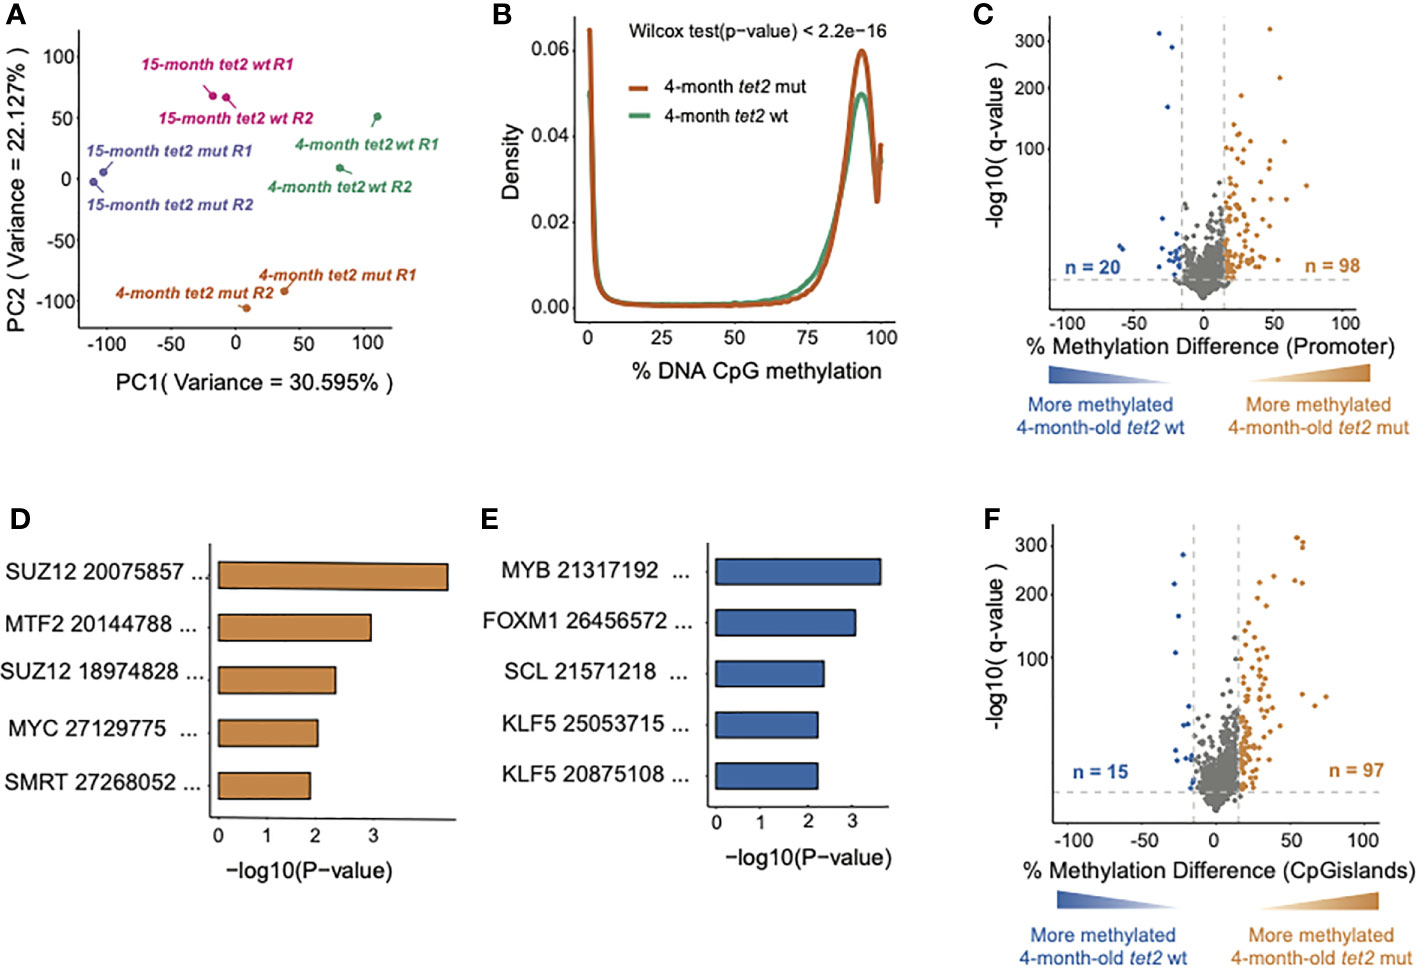
Figure 2 Loss of tet2 associated with the gain of CpG methylation in HSPCs of 4-month-old. (A) Principal component analysis (PCA) of high-variance CpGs showing the variability between biological samples and similarities between the replicates (the replicates are indicated as R1 and R2). (B) Density plots showing the distribution of the percent DNA CpG methylation in HSPCs of 4-month-old tet2m/m and 4-month-old tet2wt/wt fish. The difference between the distribution curves was calculated using the Wilcoxon rank-sum test. (C) The percentage differences in the methylation of cytosines within the promoter regions (500 bp to +250 bp upstream and downstream of the transcription initiation site) of annotated genes from 4-month-old tet2m/m fish compared with 4-month-old tet2wt/wt fish. The percentage difference in the methylation status of CpG sites in each promoter region is plotted on the x-axis and the negative logarithm of the adjusted p-value is on the y-axis. The promoters with an absolute change greater than 15% and an adjusted p-value less than 0.05 are colored. Genes that were hypermethylated in the 4-month-old tet2m/m fish are colored in orange and those that were hypomethylated are colored in blue. (D) Gene set enrichment analysis of hypermethylated gene promoters (human orthologs) against the transcription factor target ChEA 2022 database using EnrichR. The five most significant pathways are shown. The x-axis indicates the negative logarithm of the p-value from the enrichment results. (E) Gene set enrichment analysis of hypomethylated gene promoters (human orthologs) against the transcription factor target (ChEA 2022) database using EnrichR, as in panel (C) The five most significant pathways were plotted. The x-axis shows the negative logarithm of the p-value from the enrichment results. (F) The percentage differences in the methylation of cytosines within the CpG island regions in 4-month-old tet2m/m fish compared with 4-month-old tet2wt/wt fish. The percentage difference in the methylation status of CpG sites in each CpG island region is plotted on the x-axis and the negative logarithm of the adjusted p-value is on the y-axis. The CpG islands with an absolute change greater than 15% and an adjusted p-value less than 0.05 are colored. The CpG islands that were hypermethylated in the 4-month-old tet2m/m fish are colored in orange and those that were hypomethylated are colored in blue.
Loss of tet2 associates with gain of DNA CpG methylation in HSPCs of 4-month-old fish
We identified a higher density of 75%–100% DNA CpG methylation in 4-month-old tet2m/m fish than in 4-month-old tet2wt/wt fish (Wilcoxon rank-sum test p < 0.05; Figure 2B), which was consistent with the role of tet2 in catalyzing the removal of CpG methylation (20). To examine the differences in DNA methylation at the level of specific gene promoters upon tet2 loss, we compared the overall methylation levels of promoter regions in 4-month-old tet2m/m fish with those in 4-month-old tet2wt/wt fish, as visualized in the volcano plot shown in Figure 2C. Of the 4,096 promoter regions analyzed, 98 were significantly hypermethylated in 4-month-old tet2m/m fish, and 20 were hypomethylated [Figure 2C and Supplementary Table 2A; methylation difference of at least 15% and statistical significance (q-value) of less than 0.05].
We also examined the genes and pathways that were affected by differential CpG methylation in tet2-mutant hematopoietic progenitor cells. We conducted gene set enrichment analysis (GSEA) to identify transcription factor gene targets with promoters that were significantly hypermethylated or hypomethylated in the HSPCs of 4-month-old tet2m/m fish compared with those of tet2wt/wt fish, based on the CHEA Transcription Factor Target Dataset (21, 22). Of the 98 hypermethylated promoters in 4-month-old tet2m/m fish, 28 were predicted to be targets of SUZ12, a component of the polycomb repressive complex 2 (PRC2), which mediates H3K27 trimethylation (H3K27me3) (23). Another 21 gene promoters with increased methylation were predicted to be targets of the metal-response-element-binding transcription factor 2 (MTF2) (p-value < 0.05). MTF2 is a metal-response-element-binding transcription factor that recruits PRC2 to specific genes (24). Furthermore, 19 of the hypermethylated genes are common targets of SUZ12 and MTF2, including the transcription factors NKX-2, DBMX1, TSC22D3, and NR2F2. Therefore, the pathways affected by increased methylation due to tet2 loss involve both the recruitment and functional activity of PRC2 (Figure 2D, Supplementary Table 2B). Hypomethylated gene promoters in 4-month-old tet2m/m fish were the targets of the master transcription factors MYB, FOXM1, SCL (or TAL1), and KLF5, which are involved in the control of cell proliferation (Figure 2E, Supplementary Table 2C) (25, 26). Each of these master transcription factors is upregulated in cancers of different types.
We also assessed differences in the methylation levels of CpG islands (CGIs) between 4-month-old tet2m/m fish and 4-month-old tet2wt/wt fish. Of the 4,350 CpG islands assessed, 97 were hypermethylated and 15 were hypomethylated in 4-month-old tet2m/m fish, similar to the pattern of promoter methylation (Figure 2F, Supplementary Table 2D). Notably, nine of the CpG islands were within gene promoter regions and showed a consistent pattern of differential methylation as the promoter region in 4-month-old tet2m/m fish (Supplementary Table 2D).
tet2m/m HSPCs acquire a distinct DNA methylation signature during aging
We next compared the DNA CpG methylation patterns in the gene promoter regions of 15-month-old tet2m/m fish to those of 4-month-old tet2m/m fish (Figure 3A). Of the 3,873 promoters analyzed, we found that 55 were significantly hypermethylated and 74 were significantly hypomethylated (Figure 3A, Supplementary Table 3A) at 15 months. We conducted GSEA to identify the transcription factor gene targets with promoters that had acquired significant hypermethylation or hypomethylation at 15 months, based on the CHEA Transcription Factor Target Dataset (18, 22). Hypermethylated gene promoters were identified to be targets of CEBPB, RING1B, SOX2, SETDB1, and TCF4 (Figure 3B, Supplementary Table 3B). In addition, hypomethylated gene promoters were identified to be targets of EZH2, CDX2, SOX9, RING1B, and SUZ12 (Figure 3C, Supplementary Table 3C). In addition to promoters, we also identified changes in DNA methylation in CGIs (Figure 3D, Supplementary Figure 3D). Of the 4,336 CGIs analyzed, we identified 76 that were significantly hypermethylated and 68 that were significantly hypomethylated in the HSPCs of 15-month-old tet2m/m fish compared with 4-month-old tet2m/m fish.
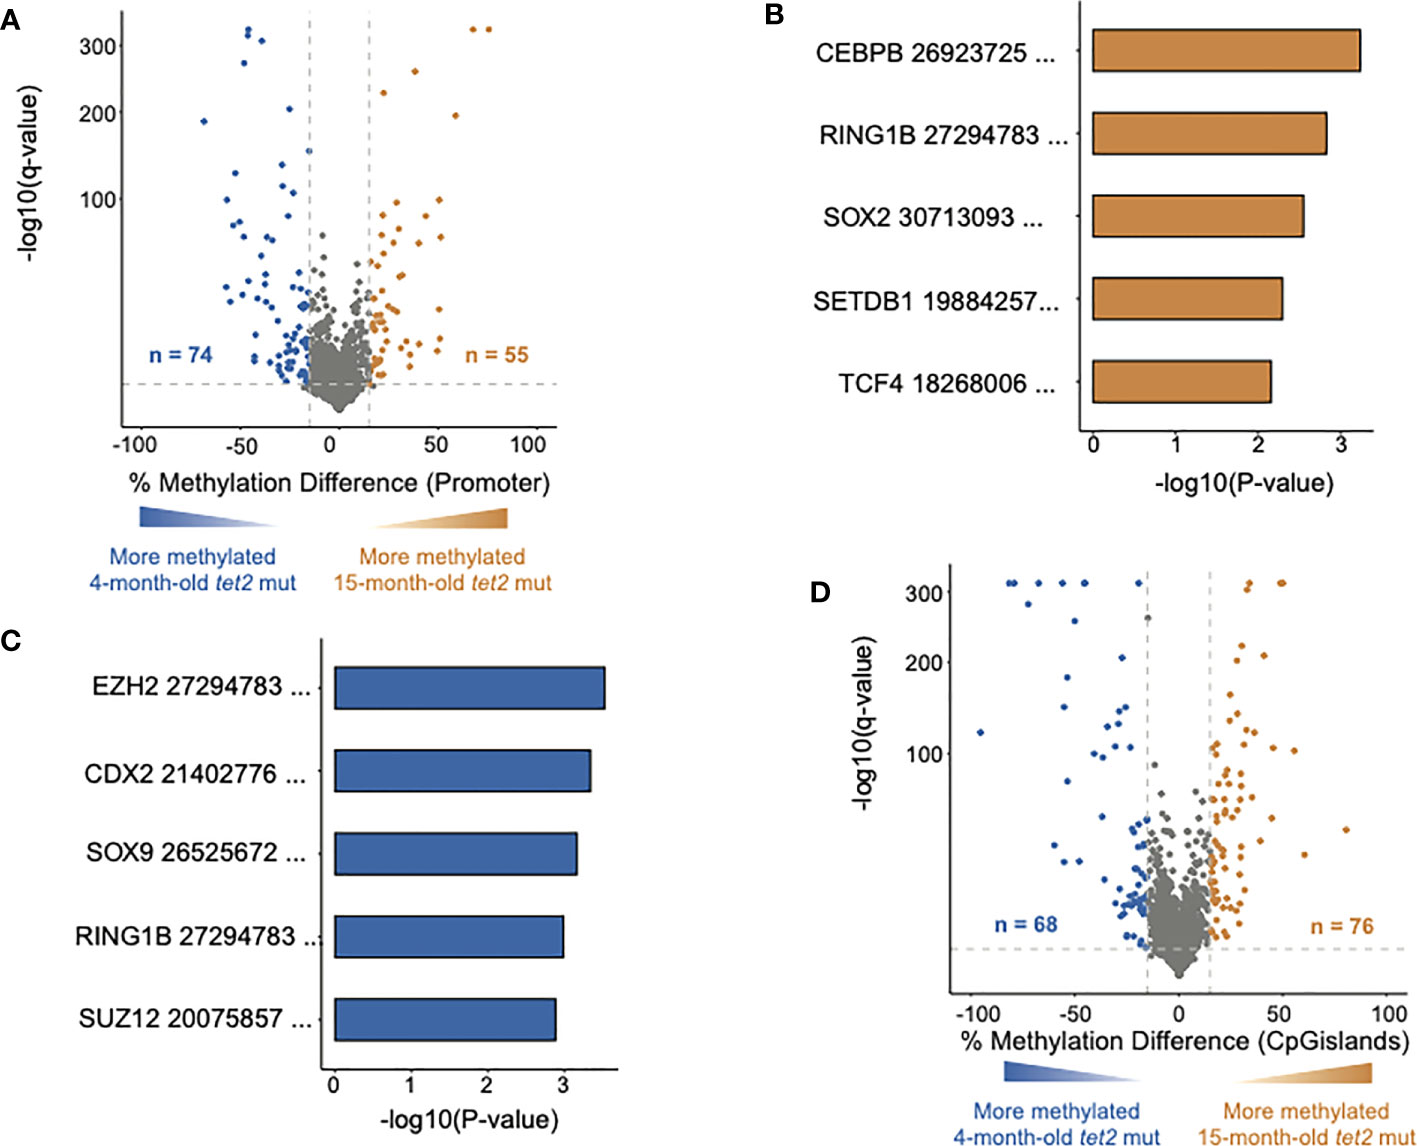
Figure 3 DNA methylation changes in HSPCs of aging tet2m/m fish. (A) The percentage differences in the methylation of cytosines within the promoter regions (500 bp to +250 bp upstream and downstream of the transcription initiation site) of annotated genes from 15-month-old tet2m/m fish compared with 4-month-old tet2m/m fish. The percentage difference in the methylation status of each promoter region is plotted on the x-axis and the negative logarithm of the adjusted p-value is on the y-axis. The regions with an absolute change greater than 15% and an adjusted p-value less than 0.05 are colored. The genes that were hypermethylated in the 15-month-old tet2m/m fish are colored in orange and those that were hypomethylated are colored in blue. (B) Gene set enrichment analysis of hypermethylated gene promoters (human orthologs) against the ChEA 2022 database using EnrichR. The top five significant pathways were plotted. The x-axis indicates the negative logarithm of the p-value from the enrichment results. The y-axis represents individual pathways. (C) Gene set enrichment analysis of hypomethylated gene promoters (human orthologs) against the transcription factor target database (ChEA 2022) using EnrichR. The top five significant pathways were plotted. The x-axis indicates the negative logarithm of the p-value from the enrichment results. The y-axis indicates the individual pathways. (D) The percentage differences in the methylation of cytosines within the CpG island regions in 15-month-old tet2m/m fish compared with 4-month-old tet2m/m fish. The percentage difference in methylation status of CpG sites in each CpG island region is plotted on the x-axis and the negative logarithm of the adjusted p-value is on the y-axis. The CpG islands with an absolute change greater than 15% and an adjusted p-value less than 0.05 are colored. The CpG islands that were hypermethylated in the 4-month-old tet2m/m fish are colored in orange and those that were hypomethylated are colored in blue.
We then assessed if the changes in the DNA CpG methylation acquired by HSPCs in 15-month-old tet2m/m fish were a continuation of the differences identified between 4-month-old tet2m/m and 4-month-old tet2wt/wt fish (Supplementary Figure 1). We found that 89 of the gene promoters that were unchanged (or not significantly differentially methylated) in the 4-month-old fish were newly differentially methylated in the 15-month-old tet2m/m fish compared with the 4-month-old tet2m/m fish (Supplementary Figure 1). Interestingly, the new DMRs arising in 15-month-old tet2m/m fish were approximately evenly divided between significant hypermethylation and hypomethylation. Among the 44 newly hypermethylated gene promoters, 15 were predicted to be either CEBPB or RING1B targets, whereas the targets of the 45 newly hypomethylated gene promoters included CDX2, YY1, CEBPB, ERA, and CREB1 (Supplementary Figure 1 and Supplementary Table 4).
Furthermore, 66 of the gene promoters that were hypermethylated in the HSPCs of 4-month-old tet2m/m fish compared with those of 4-month-old tet2wt/wt fish were not differentially methylated in the 15-month-old tet2m/m compared with the 4-month-old tet2m/m fish.
Twenty-eight promoters were hypermethylated in the HSPCs of 4-month-old tet2m/m compared with those of 4-month-old tet2wt/wt fish; these then lost methylation in 15-month-old tet2m/m fish, whereas seven hypomethylated promoters in the HSPCs of 4-month-old tet2m/m fish, compared with 4-month-old tet2wt/wt fish, gained methylation in the HSPCs of 15-month-old tet2m/m fish. Interestingly, the promoters of TSC22D3 and NKX2-5, which were hypermethylated in 4-month-old tet2m/m fish, become hypomethylated in 15-month-old tet2m/m fish.
We next sought to determine if the DNA CpG methylation changes identified in HSPCs between 4- and 15-month-old tet2m/m fish were distinct from those observed during the normal aging process. We compared the DNA CpG methylation patterns in the gene promoter regions of HSPCs of 15-month-old tet2wt/wt fish to those of the 4-month-old tet2wt/wt fish (Figure 4A, Supplementary Table 5A). Of the 4,145 promoter regions analyzed, 99 promoters were hypermethylated and 44 were hypomethylated in the 15-month-old tet2wt/wt fish (Figure 4A, and bottom row Figure 4B). Interestingly, most of these changes affect different genes than those that differed between the 4-month-old tet2m/m fish and 4-month-old tet2wt/wt fish (middle row, Figure 4B). Of the promoters identified as different between the 15-month-old tet2m/m fish and 4-month-old tet2m/m fish (top row, Figure 4B), most were different from the promoters that were differentially methylated during normal aging (bottom row, Figure 4B). Thus, of the small percentage of promoters with altered levels DNA methylation during normal aging, most of these alterations appear to depend on tet2 because they are lost in tet2m/m HSPCs (Supplementary Table 5B).
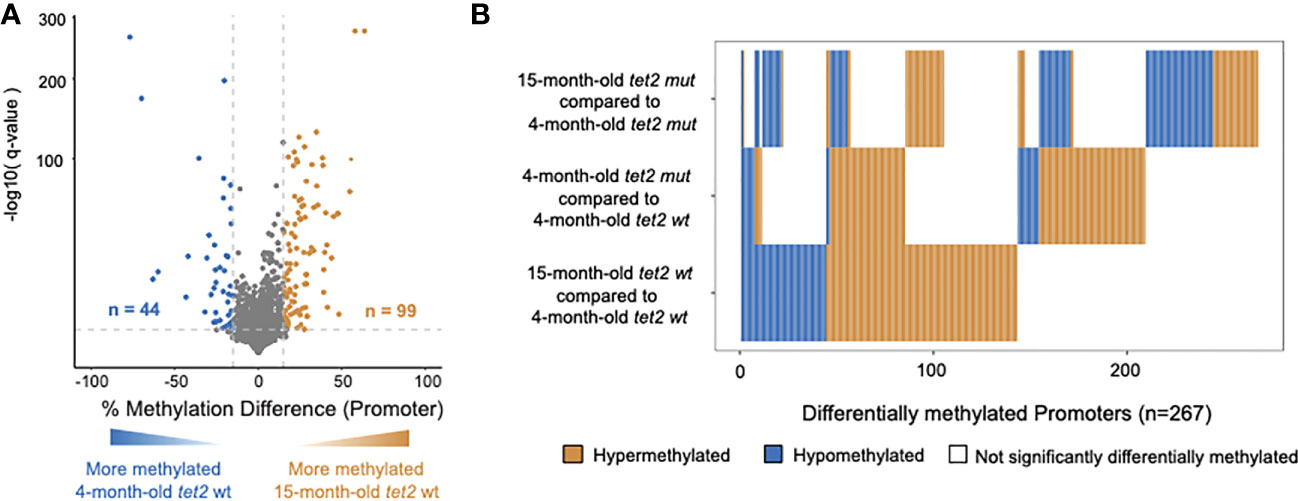
Figure 4 DNA methylation changes in HSPCs of aging tet2wt/wt fish. (A) The percentage differences in the methylation of cytosines within the promoter regions (500 bp to +250 bp upstream and downstream of the transcription initiation site). HSPCs from 15-month-old tet2wt/wt fish were compared with those of 4-month-old tet2wt/wt fish, with the latter as the baseline. The percentage difference in the methylation status of CpG sites in each promoter region is plotted on the x-axis and the negative logarithm of the adjusted p-value is on the y-axis. The regions with an absolute change greater than 15% and an adjusted p-value less than 0.05 are colored. The genes that were hypermethylated in the 15-month-old tet2wt/wt fish are colored in orange and those that were hypomethylated are colored in blue. (B) Horizontal bar plot comparing the methylation status of significantly differentially methylated promoters identified in 15-month-old tet2m/m fish compared with 4-month-old tet2m/m fish (top); 4-month-old tet2m/m fish compared with 4-month-old tet2wt/wt fish (middle); and 15-month-old tet2wt/wt fish compared with 4-month-old tet2wt/wt fish (bottom). Orange represents > 15% hypermethylation, blue represents > 15% hypomethylation, and white represents no differential methylation.
tet2m/m fish acquire aberrant DNA CpG promoter methylation, which overlaps with changes previously reported in human MDS specimens
We have previously shown that tet2-mutant fish develop trilineage dysplasia by 15 months of age, which progresses over the next 7 months to anemia, thus fulfilling the diagnostic criteria of MDS (27). The HSPCs of 15-month-old zebrafish are thus equivalent to the tet2 mutant “pre-MDS” HSPCs in humans. A previous study assessed for the effect of tet2 mutations in CD34+ HSPCs from MDS patients with age-matched controls (27). To determine if the DNA CpG methylation changes observed in the tet2 fish model recapitulate the observations in humans, we compared DNA CpG methylation in gene promoter regions of 15-month-old tet2m/m to the 15-month-old tet2wt/wt fish (Figure 5A). Of the 3,929 promoters analyzed, we identified 49 hypermethylated and 62 hypomethylated in the 15-month-old old tet2m/m fish (Figure 5A, Supplementary Table 6). The small number of differentially methylated promoters in HSPCs of 15-month-old tet2m/m fish overall compared with that in human MDS patient cells presumably reflects the less-complete sequencing coverage of the zebrafish genome and the fact that 15-month-old fish did not yet have MDS, which they would not develop for another 7 months (i.e., at 22 months of age). Nevertheless, 19.8% (n = 22) of the significantly differentially methylated gene promoters in 15-month-old zebrafish HSPCs overlapped with published differentially methylated promoters of human orthologs in MDS patients compared with those in age-matched control individuals (Figure 5B). These genes included NKX2-5, which is predicted to regulate aberrant gene expression in human MDS (28) and CLK2, a proposed oncogene in breast cancer (29); the promoters of both of these genes were hypomethylated in 15-month-old tet2m/m fish compared with 15-month-old tet2wt/wt fish.
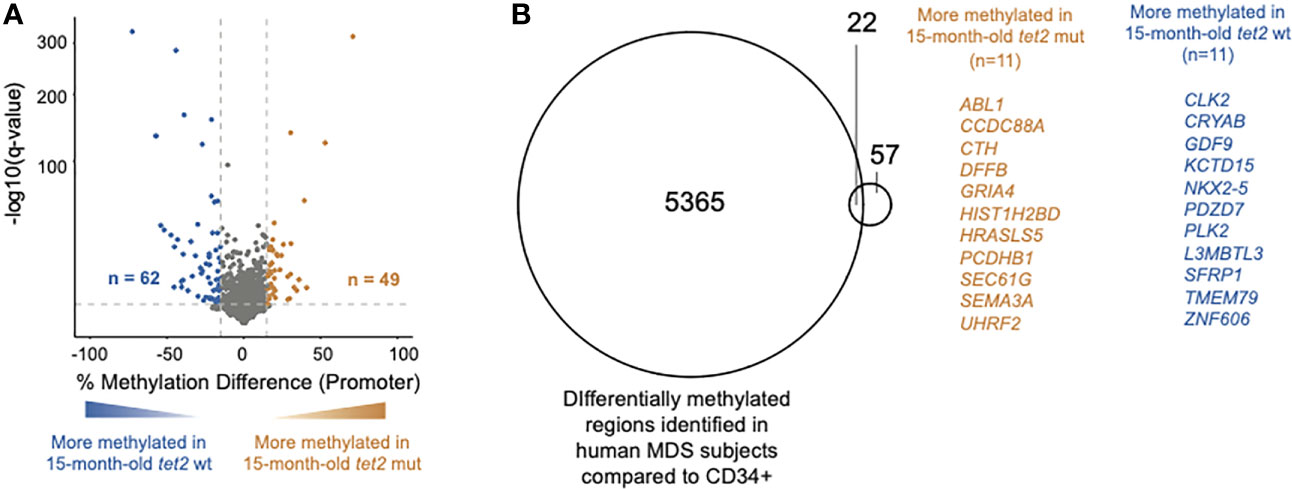
Figure 5 Overlap of DNA CpG promoter methylation in tet2m/m fish with changes previously reported in human MDS specimens. (A) The percentage differences in the methylation of cytosines within the promoter regions (500 bp to +250 bp upstream and downstream of the transcription initiation site) in the HSPCs of 15-month-old tet2m/m fish compared with those 15-month-old tet2wt/wt fish, with the latter as the baseline. The percentage difference in the methylation status of the CpG sites in each promoter region is plotted on the x-axis and the negative logarithm of the adjusted p-value is on the y-axis. The regions with an absolute change greater than 15% and an adjusted p-value less than 0.05 are colored. The genes that were hypermethylated in the 15-month-old tet2m/m fish are colored in orange and those that were hypomethylated are colored in blue. (B) Overlap of differentially methylated promoters identified in Figure 5A with those identified in human MDS specimens. Common genes are highlighted—genes in orange are hypermethylated in the HSPCs of 15-month-old tet2m/m fish and those in blue are hypomethylated in the HSPCs of 15-month-old tet2m/m fish.
Loss of tet2 in 4-month-old fish causes dysregulation of genes involved in interferon signaling and heme metabolism
We next determined the gene expression pathways that were either upregulated or downregulated in tet2m/m HSPCs compared with tet2wt/wt HSPCs in 4-month-old fish. We first identified differentially expressed genes (DEGs) in the 4-month-old tet2m/m and 4-month-old tet2wt/wt fish (Figure 6A, Supplementary Table 7A). We identified 105 upregulated genes and 119 downregulated genes (absolute log2-fold change > 1 and q-value < 0.05; Figure 6A). Pathway enrichment of the human orthologs of these zebrafish genes identified several dysregulated pathways within the hallmark gene sets from the Molecular Signature Database (MSigDB) (30). Upregulated genes were enriched in interferon alpha and gamma pathway genes and genes controlling MTORC1 signaling (Figure 6B, Supplementary Table 7B). Interferon-induced protein 44-like gene (ifi44l) was included in genesets for both interferon alpha and gamma pathways. Interestingly, each of the four orthologs of ifi44l in the zebrafish was upregulated by 5- to 19-fold in tet2-mutant zebrafish HSPCs compared with wild-type zebrafish HSPCs, as illustrated in Figure 7. The other upregulated genes in tet2-mutant zebrafish HSPCs in the interferon alpha and gamma pathways are shown in Supplementary Figure 2. In addition, the relative expression of representative upregulated genes in the mTORC1 signaling pathway is plotted in Supplementary Figure 3.
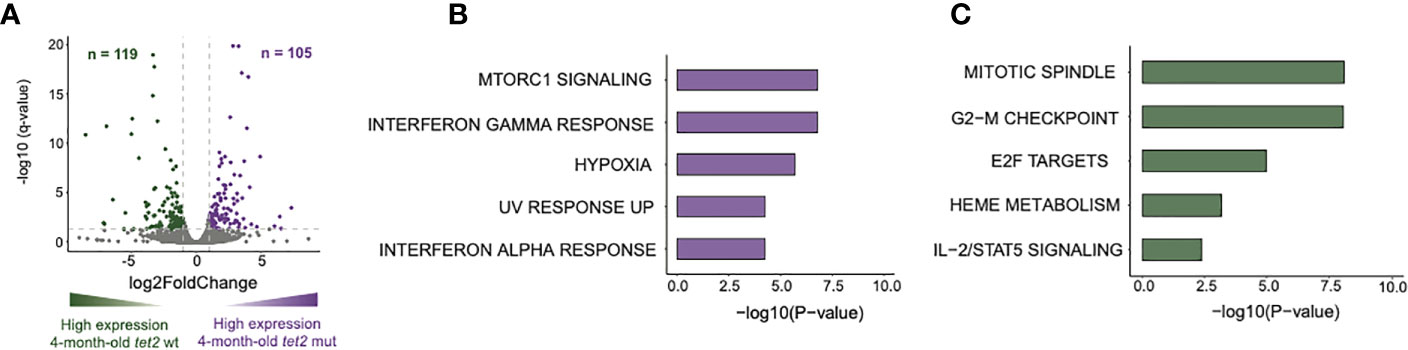
Figure 6 Loss of tet2 associated with changes in expression of genes associated with inflammation, metabolism, and the cell cycle in 4-month HSPCs. (A) Volcano plot representing the differentially expressed genes identified from the bulk-RNAseq sequencing data. Differentially expressed genes were identified between 4-month-old tet2m/m and 4-month-old tet2wt/wt HSPCs, with 4-month-old tet2wt/wt as the baseline. The genes with an absolute log2-fold change greater than 1 and an adjusted p-value less than 0.05 are colored. The upregulated genes in the 4-month-old tet2m/m fish are colored in violet and the downregulated genes in the 4-month-old tet2wt/wt fish are colored in dark green. (B) Pathway enrichment analysis of the upregulated genes against the hallmark database was conducted using EnrichR. The top five significant pathways (p < 0.05) were plotted. The x-axis indicates the negative logarithm of the p-value from the enrichment results. The y-axis represents individual pathways. (C) Pathway enrichment analysis of the downregulated genes against the hallmark database was conducted using EnrichR. The top five significant pathways were plotted. The x-axis indicates the negative logarithm of the p-value from the enrichment results. The y-axis represents individual pathways.
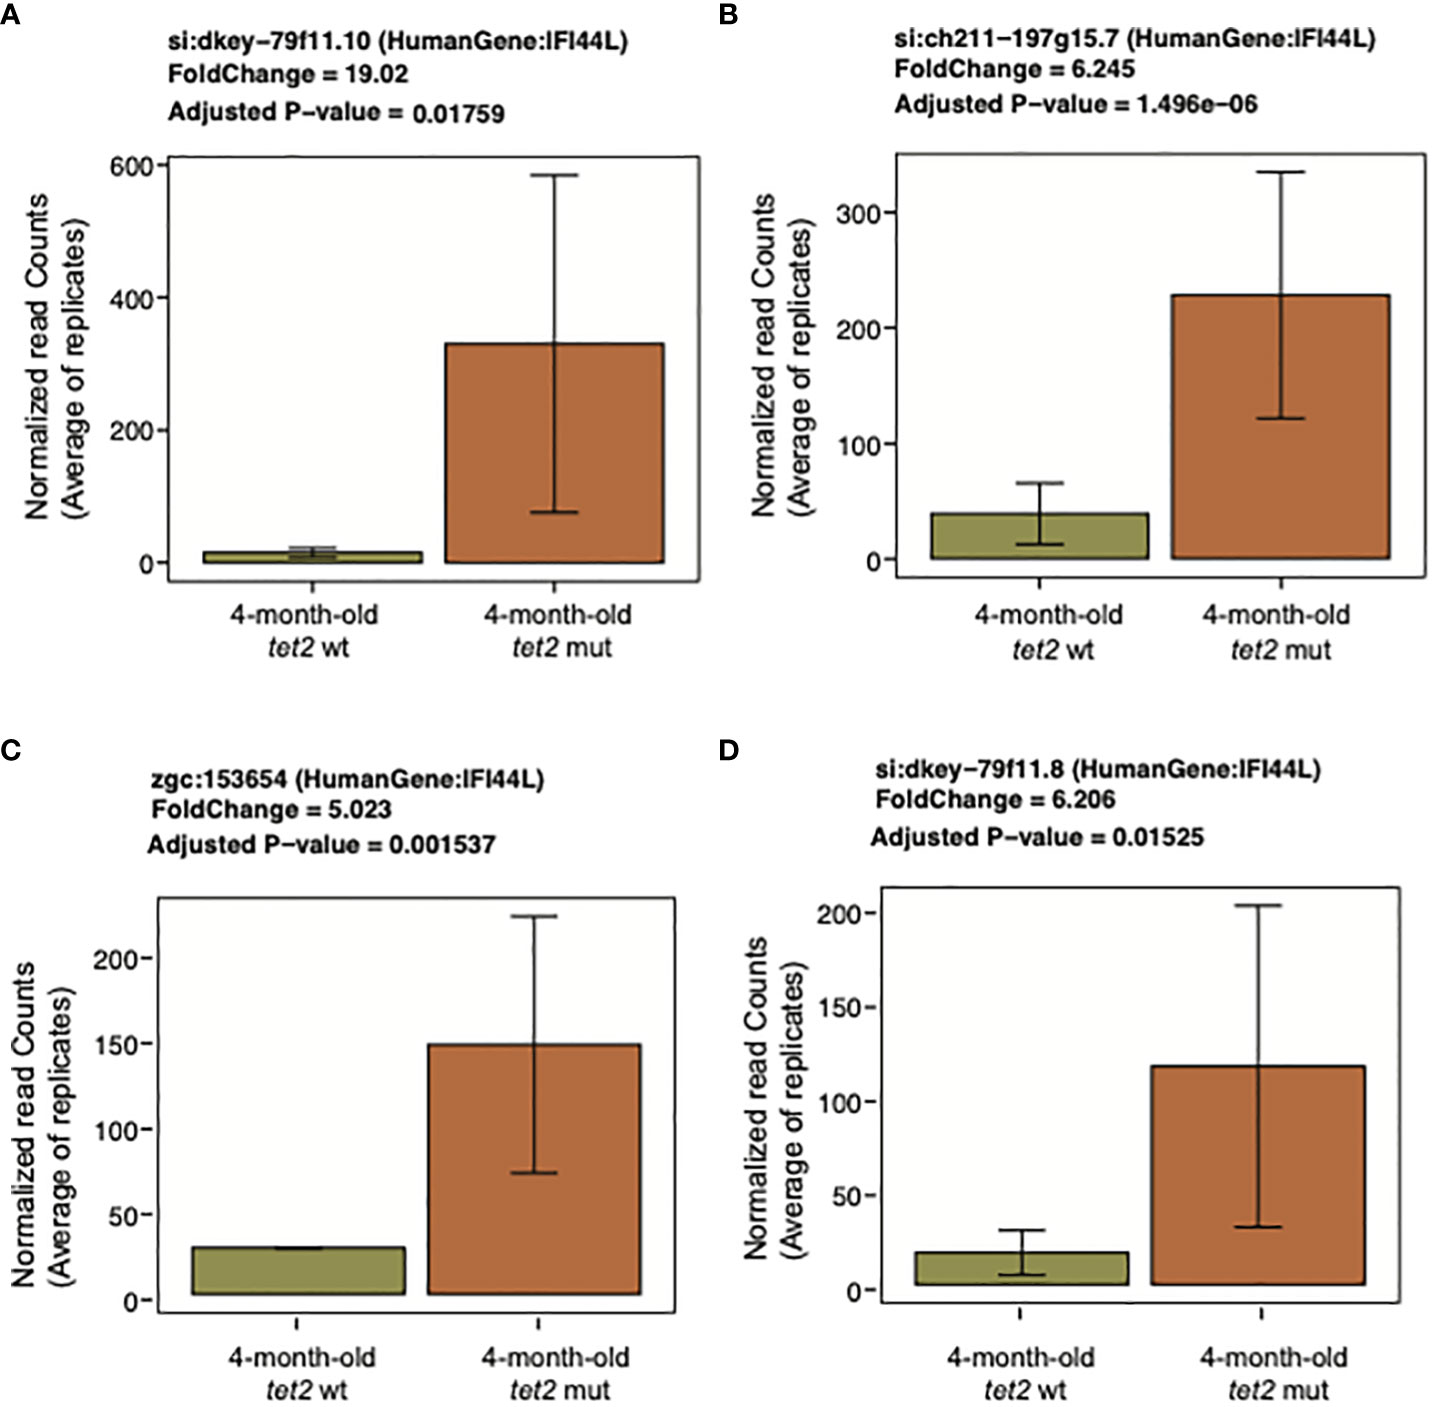
Figure 7 Upregulation of interferon-induced protein 44-like (IFI44L). Bar plots representing the normalized expression values averaged across replicates on the y-axis and 4-month-old tet2wt/wt fish and tet2m/m fish on the x-axis. The error bars are calculated as mean expression ± standard deviation. (A–D) represent different orthologs of this gene in zebrafish.
The genes in pathways that were downregulated in tet2-mutant HSPCs include pqpig, slc4a1, and cpox, which are associated with heme metabolism (Figure 8, Supplementary Table 7C). The downregulation of genes involved in heme metabolism in tet2-mutant zebrafish HSPCs is in line with the finding that the cell type found to be significantly decreased in the peripheral blood was the erythrocyte. Furthermore, by 24 months of age, most of the tet2 homozygous mutant fish tested were found to have anemia (7). Downregulated genes were also enriched for the E2F targets and G2M checkpoint (Supplementary Figure 4) and interleukin 2 (IL2)/signal transducer and activator of transcription 5 (STAT5) signaling (Supplementary Figure 5). It will be important in future studies to examine protein expression by Western blotting to verify that the levels of differences of the expressed proteins correspond to the differences of the RNA expression values.
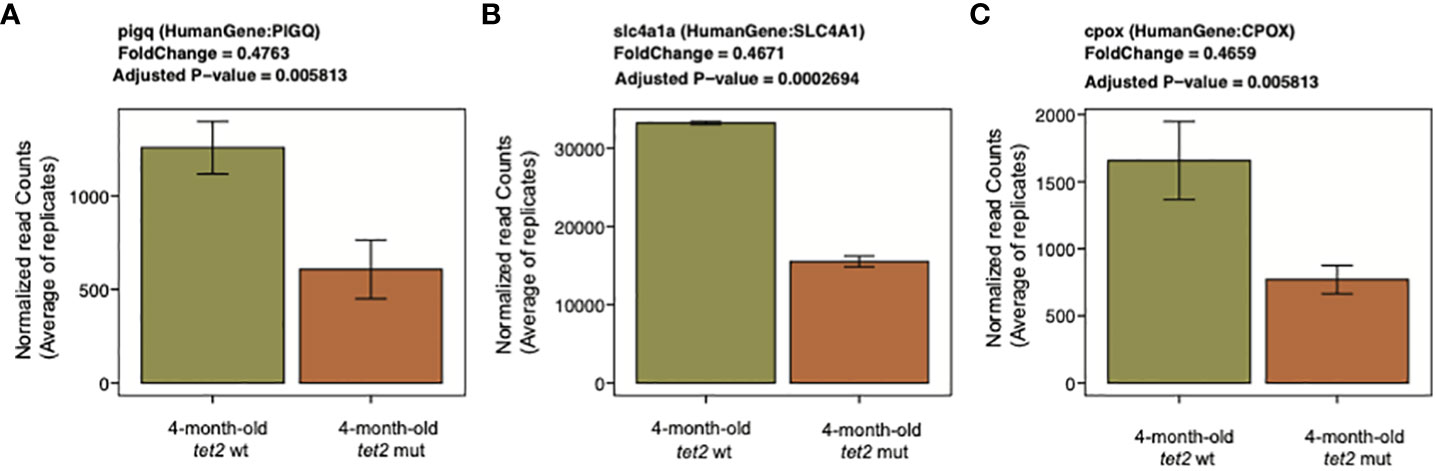
Figure 8 Representative downregulated genes associated with the heme metabolism pathway. Bar plots representing the normalized expression values averaged across replicates on the y-axis and 4-month-old tet2wt/wt fish and tet2m/m fish on the x-axis. The error bars are calculated as mean expression ± standard deviation. PIGQ, Phosphatidylinositol Glycan Anchor Biosynthesis Class Q; SLC4A1, Solute Carrier Family 4 Member 1; CPOX, Coproporphyrinogen Oxidase.
Finally, we assessed the possible correlation between the gene promoters subject to differential methylation and the pattern of gene expression using GSEA (30). We found a negative association between hypermethylated gene promoters and gene expression changes observed in 4-month-old tet2m/m fish compared with 4-month-old tet2wt/wt fish (Figure 9).
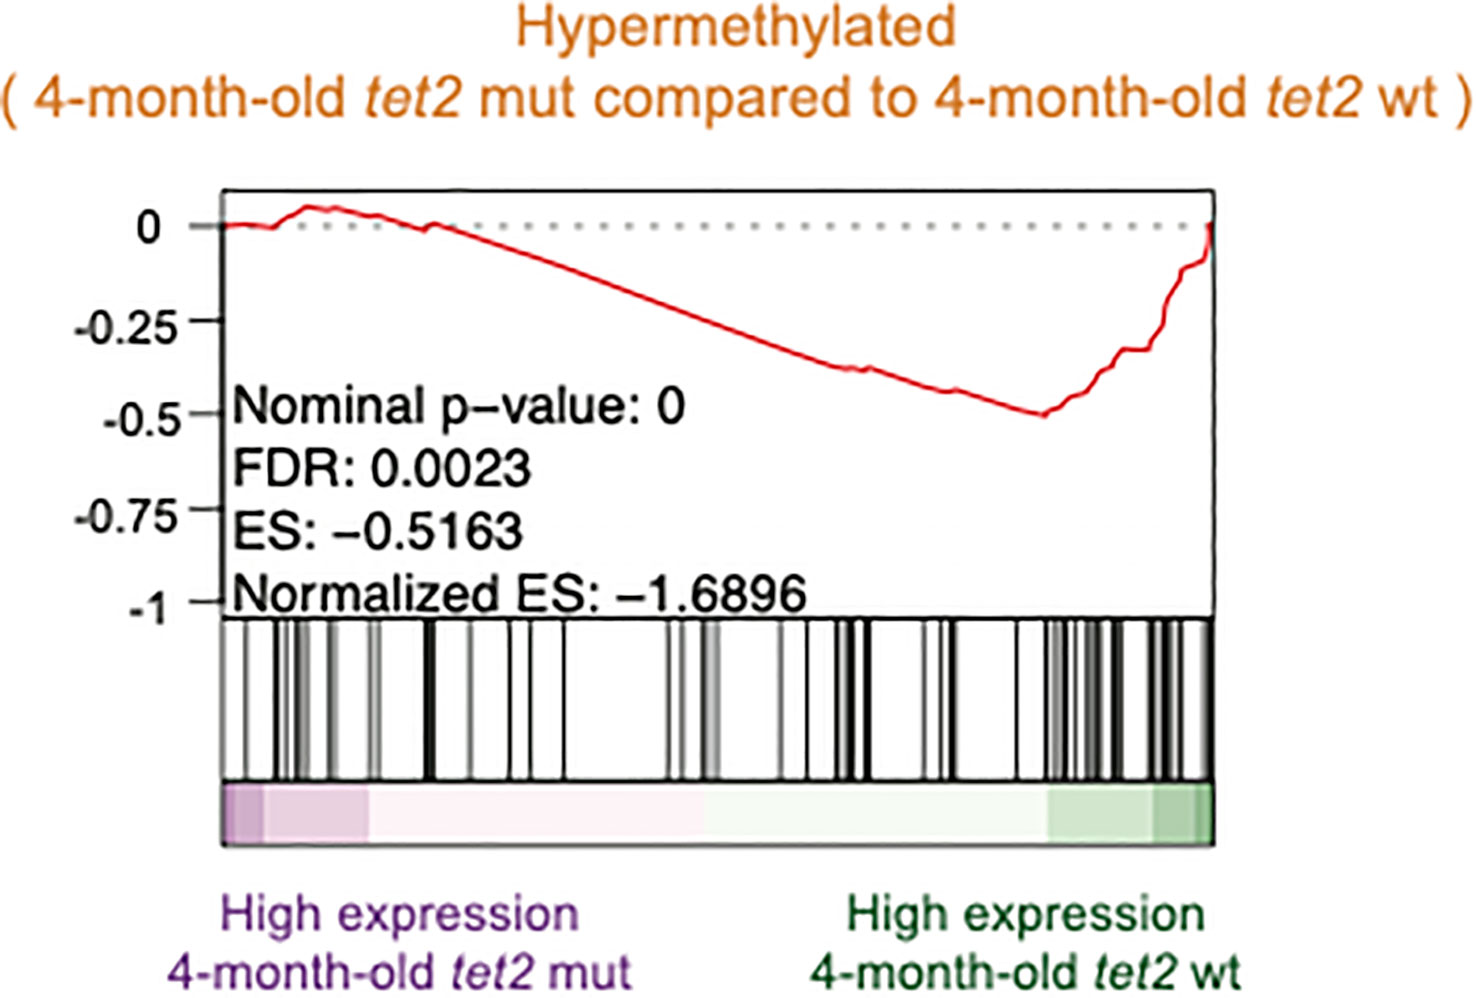
Figure 9 Negative association between hypermethylated gene promoters and gene expression changes observed in 4-month-old tet2m/m fish compared with 4-month-old tet2wt/wt fish. Gene set enrichment analysis of hypermethylated promoters identified in Figure 2A against the ranked list of genes (sorted from the highest fold change value to the lowest) identified from Figure 6A.
Discussion
In this study, we examined the CpG methylation levels of gene promoters and CpG islands of tet2-mutant and wild-type HSPCs in zebrafish at 4 months of age, by which point the fish had reached reproductive age, and at 15 months of age, to analyze age-related changes that occur after maturity. We found that at 4 months of age, five times more gene promoters and CpG islands were hypermethylated in tet2-mutant fish compared with wild-type zebrafish than were hypomethylated (Figure 2C), consistent with the known function of tet2 in catalyzing the removal of methylation from CpG sites in the genome. Interestingly, the hypermethylation was found at promoters of the targets of the polycomb repressive complex 2 (PRC2), which includes SUZ12 and MTF2, known to help recruit PRC2 to its targets in DNA (Figure 2). The PRC2 complex plays an important role in histone trimethylation for the establishment of H3K27me3, which is associated with the repression of gene expression (31).
As noted, the increased proportion of hypermethylated compared with hypomethylated genes in HSPCs at 4 months of age is consistent with the known role of tet2 in catalyzing the removal of aberrant CpGs that arise during embryogenesis (32). However, in our study of the HSPCs of 15-month-old fish, we observed an unexplained reversal of this trend as the tet2-mutant fish matured from 4 months to 15 months of age. In contrast to the predominate hypermethylation of gene promoter CpGs in the 4-month-old tet2-mutant fish compared with wild-type HSPCs (Figure 2C), in the 15-month-old tet2-mutant fish compared with wild-type HSPCs, we observed an approximately 1.5-fold greater representation of hypomethylated than hypermethylated promoters (Figure 5A). To understand this unexpected trend toward promoter hypomethylation in tet2-mutant HSPCs as fish age from 4 months to 15 months, we examined the successive changes with age in tet2-mutant fish compared with wild-type fish (Figure 4B). This comparison demonstrates that the change in the promoter DNA methylation pattern does not represent a smooth progression as tet2-mutant fish age from 4 to 15 months. This heat map demonstrates that approximately half of the genes that were hypermethylated at 4 months of age remain hypermethylated, whereas a significant proportion become newly hypermethylated or hypomethylated as the tet2-mutant fish age to 15 months (right side of the top row of Figure 4B). The basis for these new changes appearing as the fish age and how it relates to the mutational inactivation of tet2 in these fish is unknown and represents an important question for further study. It is likely that the mechanism driving these changes will prove to be important, because the risk of myeloid malignancy increases with age in both zebrafish and humans with tet2-mutant HSPCs.
DNA methylation changes near the transcription start sites have been closely associated with tissue-specific alterations in gene expression (33, 34). Genes with hypermethylated promoters showed overall decreased expression in the HSPCs of 4-month-old fish (Figure 9). Genes that were significantly upregulated in the HSPCs of 4-month-old fish were associated with the interferon alpha and gamma response, which is consistent with recent studies in murine models linking tet2 mutations to the increased expression of proinflammatory cytokines in tet2-mutant myeloid malignancies (35). Further studies investigating the impact of promoter DNA methylation on gene expression in vivo in the HSPCs of tet2 fish compared with wild type fish will benefit from new approaches using single cell RNA-sequencing to separately examine gene expression in different subset of HSPCs in the kidney marrow.
Data availability statement
The datasets presented in this study can be found in online repositories. The names of the repository/repositories and accession number(s) can be found below: https://www.ncbi.nlm.nih.gov/geo/query/acc.cgi?acc=GSE238176. Scripts used for analyses and figures' generation are available here: https://github.com/Yaseswini/TET2_MDS.
Ethics statement
All zebrafish studies and maintenance were done in accordance with Dana-Farber Cancer Institute institutional animal care and use committee (IACUC)–approved protocol #02-107. The study was conducted in accordance with the local legislation and institutional requirements.
Author contributions
Conceived and designed the study: FG-B, EG, and ATL. Conducted experiments: EG, HF, SP, CS, and FG-B. Conducted analyses and initial data processing: SG and FG-B. Conducted genomic data analysis and interpretation: YN, EG, ATL, and FG-B. Data deposition: YN and FG-B. Wrote the manuscript: YN, EG, ATL, and FG-B. Preparation of response to reviewers: YN, SH, ATL, and FG-B. Reviewed, edited, and approved the manuscript: All authors.
Funding
FG-B: UVA Cancer Center through the NCI Cancer Center Support Grant P30 CA44579, the University of Virginia and funding from the American Society of Hematology (ASHAMFDP-20121) under the ASH-AMFDP partnership with the Robert Wood Johnson Foundation to FG-B. This work was also supported by the National Cancer Institute, National Institutes of Health (grant R35-CA-210064 to ATL); Edward P. Evans Foundation (to ATL); by a Leukemia and Lymphoma Society Special Fellow Award (to EG); by an Alex’s Lemonade Stand Foundation Young Investigator Award (to EG); by the Andrew McDonough B+ Foundation (to EG and C-BJ);; the Andrew McDonough B+ Foundation (to C-BJ), and an International Award of Lady Tata Memorial Trust (to C-BJ).
Acknowledgments
The authors thank the following service providers. Next-generation sequencing services were provided by the Weill Cornell Medicine Genomics Core facility. Computational resources and technical support were provided by the Weill Cornell Medicine Applied Bioinformatics and the School of Medicine Research Computing at the University of Virginia.
Conflict of interest
The authors declare that the research was conducted in the absence of any commercial or financial relationships that could be construed as a potential conflict of interest.
Publisher’s note
All claims expressed in this article are solely those of the authors and do not necessarily represent those of their affiliated organizations, or those of the publisher, the editors and the reviewers. Any product that may be evaluated in this article, or claim that may be made by its manufacturer, is not guaranteed or endorsed by the publisher.
Supplementary material
The Supplementary Material for this article can be found online at: https://www.frontiersin.org/articles/10.3389/frhem.2023.1235170/full#supplementary-material
References
1. Sperling AS, Gibson CJ, Ebert BL. The genetics of myelodysplastic syndrome: from clonal haematopoiesis to secondary leukaemia. Nat. Rev. Cancer (2017) 17(1):5–19. doi: 10.1038/nrc.2016.112
2. Haferlach T, Nagata Y, Grossmann V, Okuno Y, Bacher U, Nagae G, et al. Landscape of genetic lesions in 944 patients with myelodysplastic syndromes. Leukemia (2014) 28(2):241–7. doi: 10.1038/leu.2013.336
3. Delhommeau F, Dupont S, Della Valle V, James C, Trannoy S, Massé A, et al. Mutation in TET2 in myeloid cancers. New Engl. J. Med. (2009) 360(22):2289–301. doi: 10.1056/NEJMoa0810069
4. Kosmider O, Gelsi-Boyer V, Ciudad M, Racoeur C, Jooste V, Vey N, et al. TET2 gene mutation is a frequent and adverse event in chronic myelomonocytic leukemia. Haematologica (2009) 94(12):1676–81. doi: 10.3324/haematol.2009.011205
5. Langemeijer SM, Kuiper RP, Berends M, Knops R, Aslanyan MG, Massop M, et al. Acquired mutations in TET2 are common in myelodysplastic syndromes. Nat. Genet. (2009) 41(7):838–42. doi: 10.1038/ng.391
6. Figueroa ME, Abdel-Wahab O, Lu C, Ward PS, Patel J, Shih A, et al. Leukemic IDH1 and IDH2 mutations result in a hypermethylation phenotype, disrupt TET2 function, and impair hematopoietic differentiation. Cancer Cell. (2010) 18(6):553–67. doi: 10.1016/j.ccr.2010.11.015
7. Gjini E, Mansour MR, Sander JD, Moritz N, Nguyen AT, Kesarsing M, et al. A zebrafish model of myelodysplastic syndrome produced through tet2 genomic editing. Mol. Cell Biol. (2015) 35(5):789–804. doi: 10.1128/MCB.00971-14
8. Jing C-B, Prutsch N, He S, Zimmerman MW, Landesman Y, Look AT. Synthetic lethal targeting of TET2-mutant hematopoietic stem and progenitor cells by XPO1 inhibitors. Br. J. Haematology (2023) 201(3):489–501. doi: 10.1101/2022.10.12.511957
9. Jing CB, Fu C, Prutsch N, Wang M, He S, Look AT. Synthetic lethal targeting of TET2-mutant hematopoietic stem and progenitor cells (HSPCs) with TOP1-targeted drugs and PARP1 inhibitors. Leukemia (2020) 34(11):2992–3006. doi: 10.1038/s41375-020-0927-5
10. Bolli N, Payne EM, Grabher C, Lee JS, Johnston AB, Falini B, et al. Expression of the cytoplasmic NPM1 mutant (NPMc+) causes the expansion of hematopoietic cells in zebrafish. Blood (2010) 115(16):3329–40. doi: 10.1182/blood-2009-02-207225
11. Garrett-Bakelman FE, Sheridan CK, Kacmarczyk TJ, Ishii J, Betel D, Alonso A, et al. Enhanced reduced representation bisulfite sequencing for assessment of DNA methylation at base pair resolution. J. Vis. Exp. (2015) 96:e52246. doi: 10.3791/52246
12. Akalin A, Garrett-Bakelman FE, Kormaksson M, Busuttil J, Zhang L, Khrebtukova I, et al. Base-pair resolution DNA methylation sequencing reveals profoundly divergent epigenetic landscapes in acute myeloid leukemia. PloS Genet. (2012) 8(6):e1002781. doi: 10.1371/journal.pgen.1002781
13. Dobin A, Davis CA, Schlesinger F, Drenkow J, Zaleski C, Jha S, et al. STAR: ultrafast universal RNA-seq aligner. Bioinformatics (2013) 29(1):15–21. doi: 10.1093/bioinformatics/bts635
14. Quinlan AR, Hall IM. BEDTools: a flexible suite of utilities for comparing genomic features. Bioinformatics (2010) 26(6):841–2. doi: 10.1093/bioinformatics/btq033
15. Akalin A, Kormaksson M, Li S, Garrett-Bakelman FE, Figueroa ME, Melnick A, et al. methylKit: a comprehensive R package for the analysis of genome-wide DNA methylation profiles. Genome Biol. (2012) 13(10):R87. doi: 10.1186/gb-2012-13-10-r87
16. Love MI, Huber W, Anders S. Moderated estimation of fold change and dispersion for RNA-seq data with DESeq2. Genome Biol. (2014) 15(12):550. doi: 10.1186/s13059-014-0550-8
17. Chen EY, Tan CM, Kou Y, Duan Q, Wang Z, Meirelles GV, et al. Enrichr: interactive and collaborative HTML5 gene list enrichment analysis tool. BMC Bioinf. (2013) 14:128. doi: 10.1186/1471-2105-14-128
18. Kuleshov MV, Jones MR, Rouillard AD, Fernandez NF, Duan Q, Wang Z, et al. Enrichr: a comprehensive gene set enrichment analysis web server 2016 update. Nucleic Acids Res. (2016) 44(W1):W90–7. doi: 10.1093/nar/gkw377
19. Xie Z, Bailey A, Kuleshov MV, Clarke DJB, Evangelista JE, Jenkins SL, et al. Gene set knowledge discovery with enrichr. Curr. Protoc. (2021) 1(3):e90. doi: 10.1002/cpz1.90
20. Ko M, An J, Pastor WA, Koralov SB, Rajewsky K, Rao A. TET proteins and 5-methylcytosine oxidation in hematological cancers. Immunol. Rev. (2015) 263(1):6–21. doi: 10.1111/imr.12239
21. Rouillard AD, Gundersen GW, Fernandez NF, Wang Z, Monteiro CD, McDermott MG, et al. The harmonizome: a collection of processed datasets gathered to serve and mine knowledge about genes and proteins. Database (Oxford) (2016) 2016. doi: 10.1093/database/baw100
22. Lachmann A, Xu H, Krishnan J, Berger SI, Mazloom AR, Ma'ayan A. ChEA: transcription factor regulation inferred from integrating genome-wide ChIP-X experiments. Bioinformatics (2010) 26(19):2438–44. doi: 10.1093/bioinformatics/btq466
23. Pasini D, Bracken AP, Jensen MR, Lazzerini Denchi E, Helin K. Suz12 is essential for mouse development and for EZH2 histone methyltransferase activity. EMBO J. (2004) 23(20):4061–71. doi: 10.1038/sj.emboj.7600402
24. Perino M, van Mierlo G, Karemaker ID, van Genesen S, Vermeulen M, Marks H, et al. MTF2 recruits Polycomb Repressive Complex 2 by helical-shape-selective DNA binding. Nat. Genet. (2018) 50(7):1002–10. doi: 10.1038/s41588-018-0134-8
25. Graf T. Myb: a transcriptional activator linking proliferation and differentiation in hematopoietic cells. Curr. Opin. Genet. Dev. (1992) 2(2):249–55. doi: 10.1016/S0959-437X(05)80281-3
26. Wierstra I. The transcription factor FOXM1 (Forkhead box M1): proliferation-specific expression, transcription factor function, target genes, mouse models, and normal biological roles. Adv. Cancer Res. (2013) 118:97–398. doi: 10.1016/B978-0-12-407173-5.00004-2
27. Figueroa ME, Skrabanek L, Li Y, Jiemjit A, Fandy TE, Paietta E, et al. MDS and secondary AML display unique patterns and abundance of aberrant DNA methylation. Blood (2009) 114(16):3448–58. doi: 10.1182/blood-2009-01-200519
28. Wang H, Wen J, Chang CC, Zhou X. Discovering transcription and splicing networks in myelodysplastic syndromes. PLoS One (2013) 8(11):e79118. doi: 10.1371/journal.pone.0079118
29. Yoshida T, Kim JH, Carver K, Su Y, Weremowicz S, Mulvey L, et al. CLK2 is an oncogenic kinase and splicing regulator in breast cancer. Cancer Res. (2015) 75(7):1516–26. doi: 10.1158/0008-5472.CAN-14-2443
30. Liberzon A, Birger C, Thorvaldsdottir H, Ghandi M, Mesirov JP, Tamayo P. The Molecular Signatures Database (MSigDB) hallmark gene set collection. Cell Syst. (2015) 1(6):417–25. doi: 10.1016/j.cels.2015.12.004
31. Margueron R, Reinberg D. The Polycomb complex PRC2 and its mark in life. Nature (2011) 469(7330):343–9. doi: 10.1038/nature09784
32. Arand J, Chiang HR, Martin D, Snyder MP, Sage J, Reijo Pera RA, et al. Tet enzymes are essential for early embryogenesis and completion of embryonic genome activation. EMBO Rep. (2022) 23(2):e53968. doi: 10.15252/embr.202153968
33. Bird AP. CpG-rich islands and the function of DNA methylation. Nature (1986) 321(6067):209–13. doi: 10.1038/321209a0
34. Eden S, Cedar H. Role of DNA methylation in the regulation of transcription. Curr. Opin. Genet. Dev. (1994) 4(2):255–9. doi: 10.1016/S0959-437X(05)80052-8
Keywords: TET2, myelodysplastic syndrome, hematopoietic progenitors, zebrafish, DNA methylation
Citation: Neelamraju Y, Gjini E, Chhangawala S, Fan H, He S, Jing C-B, Nguyen AT, Prajapati S, Sheridan C, Houvras Y, Melnick A, Look AT and Garrett-Bakelman FE (2023) Depletion of tet2 results in age-dependent changes in DNA methylation and gene expression in a zebrafish model of myelodysplastic syndrome. Front. Hematol. 2:1235170. doi: 10.3389/frhem.2023.1235170
Received: 05 June 2023; Accepted: 10 August 2023;
Published: 14 September 2023.
Edited by:
Elspeth Payne, University College London, United KingdomReviewed by:
Xingliang Guo, University of Texas MD Anderson Cancer Center, United StatesKristbjorn Orri Gudmundsson, National Cancer Institute at Frederick (NIH), United States
Copyright © 2023 Neelamraju, Gjini, Chhangawala, Fan, He, Jing, Nguyen, Prajapati, Sheridan, Houvras, Melnick, Look and Garrett-Bakelman. This is an open-access article distributed under the terms of the Creative Commons Attribution License (CC BY). The use, distribution or reproduction in other forums is permitted, provided the original author(s) and the copyright owner(s) are credited and that the original publication in this journal is cited, in accordance with accepted academic practice. No use, distribution or reproduction is permitted which does not comply with these terms.
*Correspondence: A. Thomas Look, dGhvbWFzX2xvb2tAZGZjaS5oYXJ2YXJkLmVkdQ==; Francine E. Garrett-Bakelman, Zmc1cUB1dmFoZWFsdGgub3Jn
†These authors have contributed equally to this work