 Kathleen E. McGrath
- Department of Pediatrics, University of Rochester Medical Center, Rochester, NY, United States
Erythropoiesis occurs through specification from multipotent progenitors to erythroid restricted potential, expansion of erythroid progenitors, and terminal maturation of precursors to red blood cells. Acute anemia can induce changes at multiple stages of erythropoiesis, thus delineation and comparison of intermediates is critical to understanding this regulation. Historically, erythropoietic intermediates have been defined by functional colony forming assays (progenitors) or microscopy (precursors). While these sensitive single cell techniques have allowed detailed studies of the erythron, they do not allow for prospectively identifying and isolating live cells for experimental analyses. This has fueled development of flow cytometric criteria for analyzing the erythron from many different research groups for both the human and mouse systems. With these data, models of the immunophenotypic continuum of the erythron can be generated progressing from the earliest erythroid specific progenitors through late erythroblasts revealing remarkable conservation between human and murine cells. Recent data have also uncovered issues with previous classification schemes of erythromyeloid progenitors that are particularly problematic for erythroid progenitors. Applying these flow cytometric tools requires consideration of gating on a continuum in a reproducible fashion, fragments of macrophages caused by tissue dissociation on a proportion of erythropoietic cells, and ultimately application in anemia where signaling may impact the range of expression of specific immunophenotyping markers.
Introduction
The generation of red blood cells (RBCs), erythropoiesis, can be divided into three stages (Figure 1A). First, multipotential hematopoietic progenitors differentiate to an erythroid fate. Second, erythroid-specific progenitors expand massively while maturing. Third, visually distinct erythroid precursors undergo a limited number of cell divisions during terminal maturation. There is evidence that each of these stages can be modified during anemia. During terminal maturation, early release of immature erythrocytes into circulation can cause a short-term increase in RBCs (1, 2). Prolonged increases in erythroid output are achieved by increased erythroid-specific progenitors due to preservation of late progenitors normally lost to apoptosis and increased number of divisions in progenitors before terminal maturation (3–6). Signals in response to anemia have also been proposed to shift multipotential progenitors more towards an erythroid fate (7–9). In contrast, when anemia occurs in combination with inflammation, inflammatory signals prioritize upstream progenitors towards myeloid output and concomitant shifts in the type and environment of early erythroid progenitors compensate to produce a bolus of erythroid cells (10). It is this orchestrated response across the erythron that produces both rapid and sustained increases in erythroid output required to resolve acute anemia. Thus, the study of response to anemia requires resolving the breadth of erythroid intermediates.
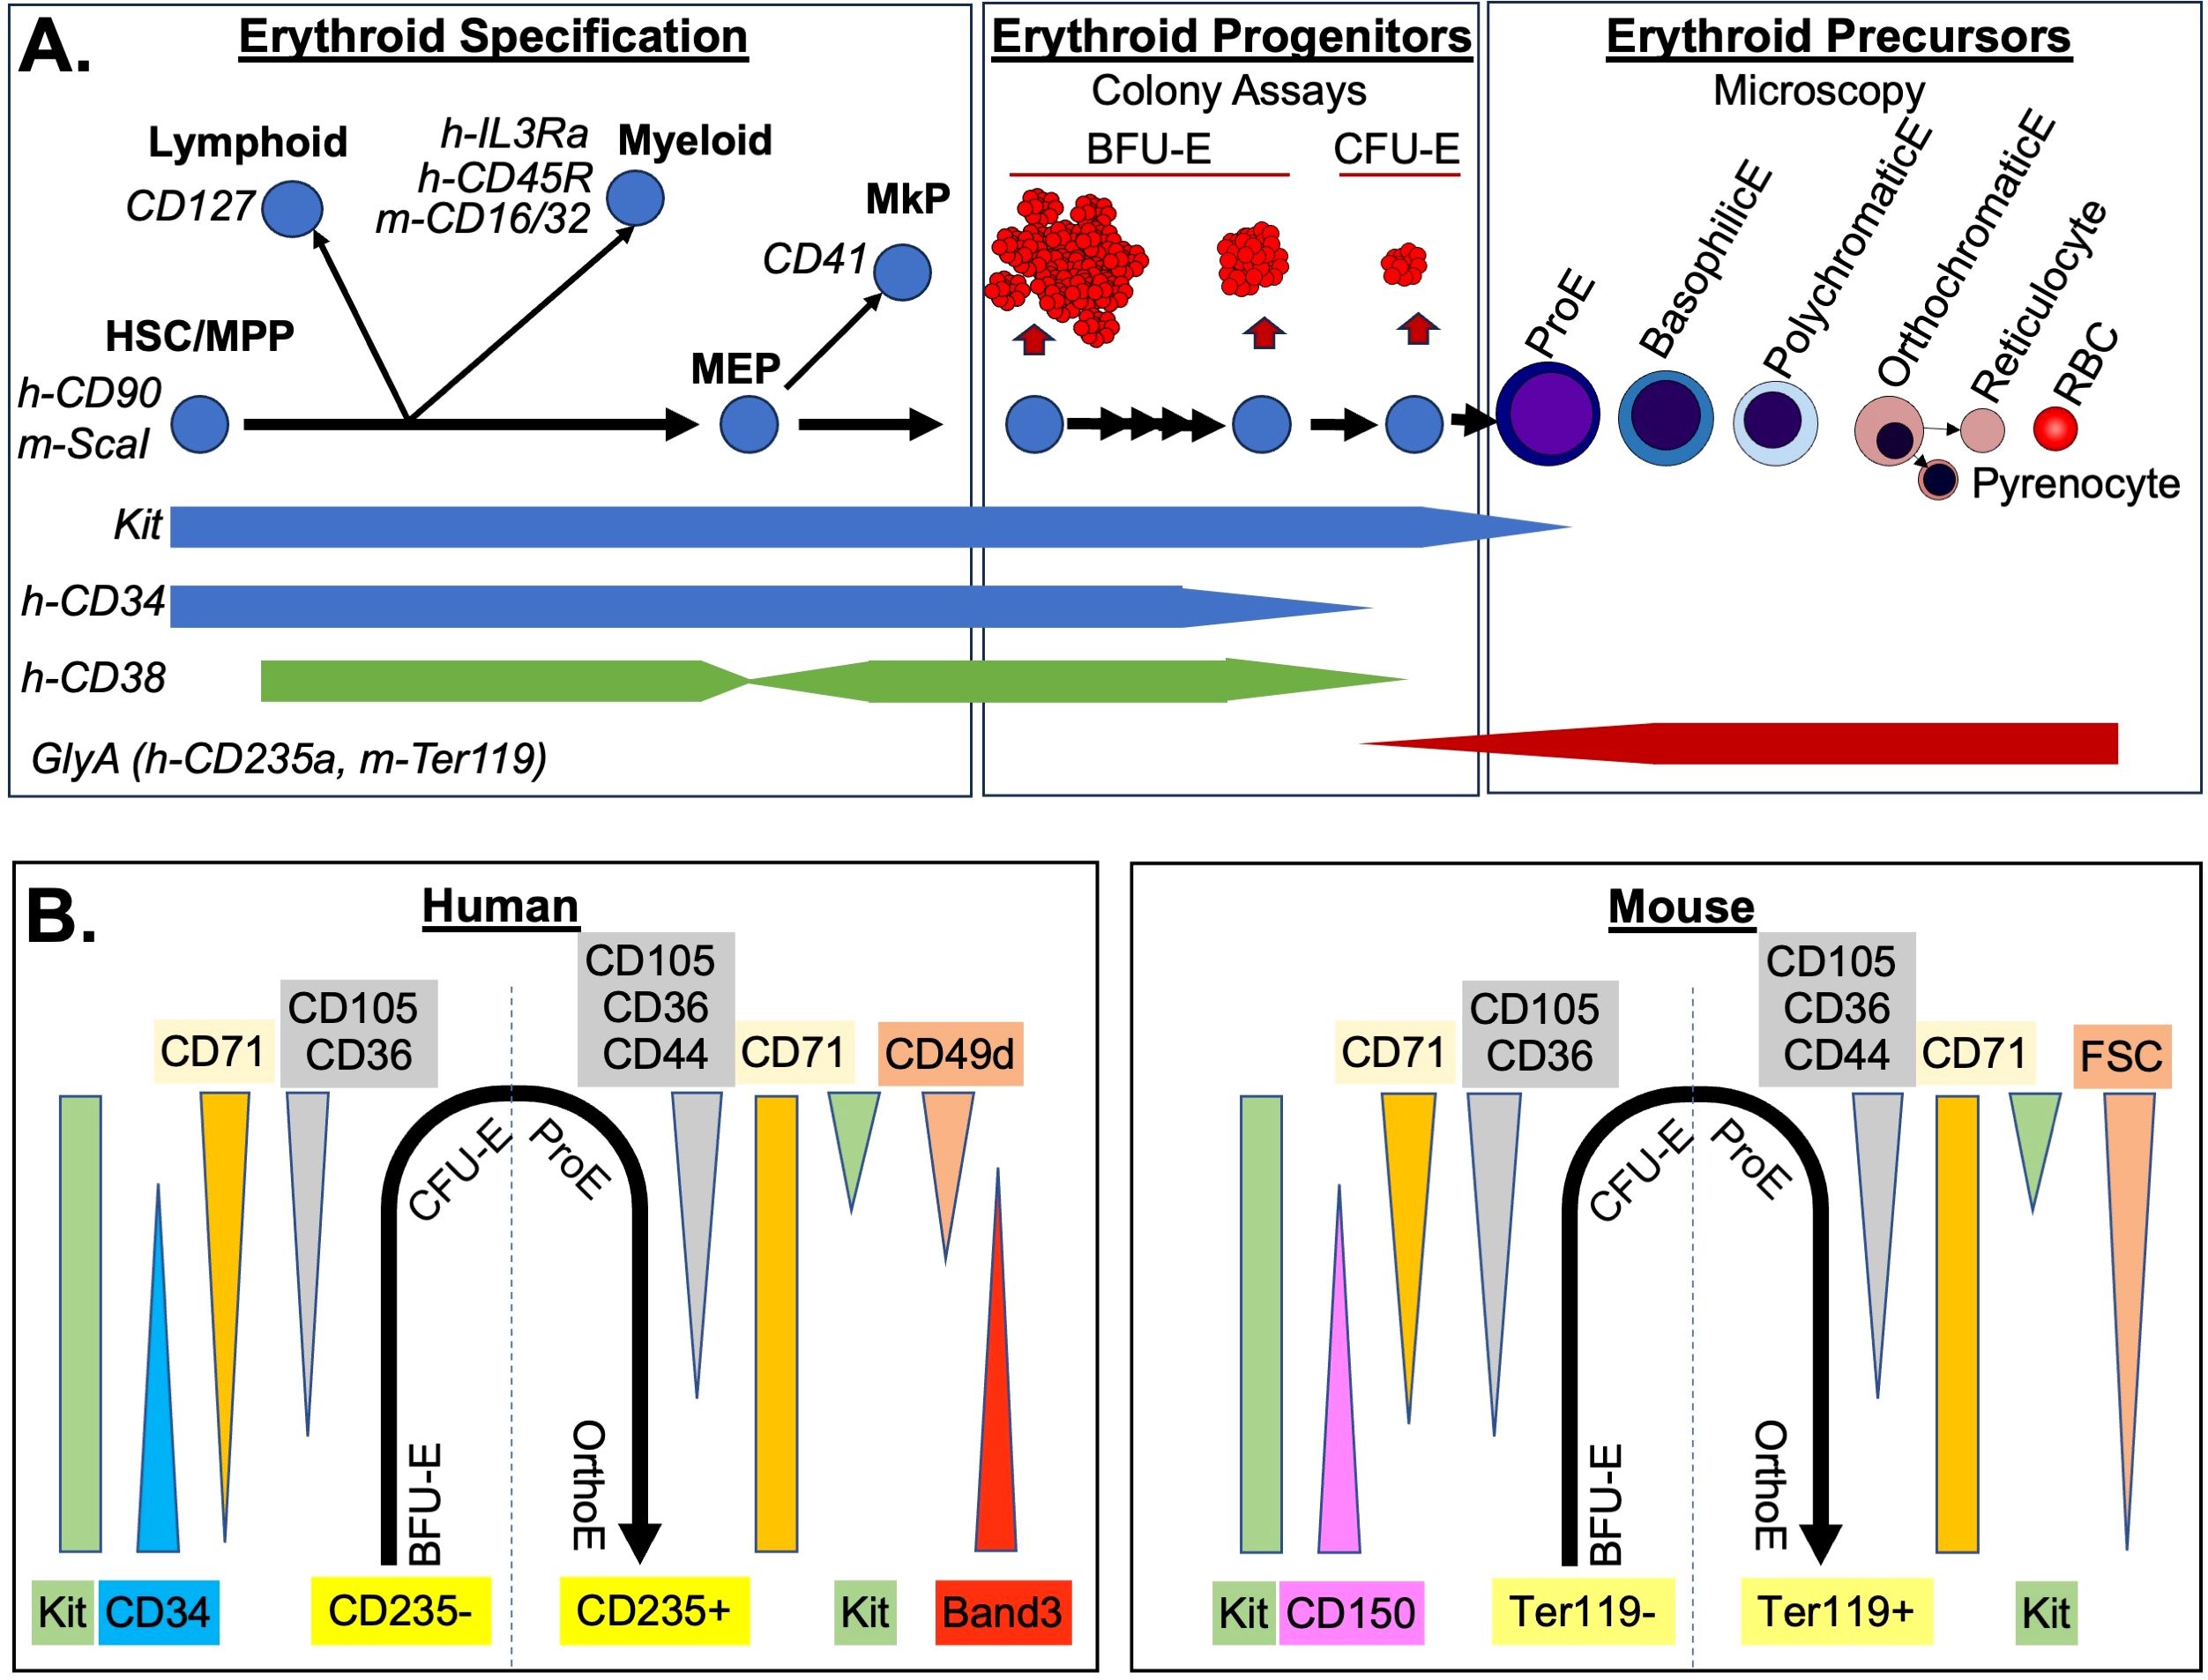
Figure 1. Immunophenotyping of the Erythron. (A) Three stages of erythropoiesis are diagrammed. Common immunophenotyping markers used during erythroid specification (left) to remove non-erythroid intermediates are indicated in italic. General progenitor marker levels are indicated below. If specific for human or mouse, they are designated with h- or m- respectively. Erythroid specific progenitors (middle) were defined by size of colonies produced in semi-solid media and the requirement for early for burst-forming activity (BFU-E vs CFU-E). Terminal maturation of precursors (right) was defined by microscopy including reduced cell size and nuclear size of erythroblasts (E), as well as loss of basophilic (blue) staining and increase acidophic (red) staining. Enucleated erythrocytes include the immature reticulocytes which then lose remaining organelles becoming RBC. (B) Immunophenotype of the erythron from erythroid specific progenitors (negative for glycophorin A i.e h-CD235a, m-Ter119) through terminal erythroblast stages (glycophorin A positive). Changes in common antibodies and scatter (FSC) parameters are indicated.
Our understanding of the various stages of the erythron has been facilitated by a long history of single cell analytical techniques. Indeed, single cell analysis of RBC began over almost 400 years ago at the dawn of microscopy when single blood “cells” were first discovered (11). The progression of erythroid precursors during terminal maturation were defined by microscopy. Decrease in cell size and nuclear condensation are key delineators of this progression, along with changes in staining characteristics as basophilic ribosomes are lost and eosinophilic hemoglobin accumulates. The legacy of this visual classification is apparent in the names of the erythroblasts that begin as proerythroblasts then sequentially go through basophilic, polychromatophilic, and orthochromatic erythroblast stages before enucleating into visibly reticulated erythrocytes, and finally mature RBC lacking all internal organelles (Figure 1A).
50 years ago, functional single cell erythroid progenitor assays were developed based on colony growth in blood clots (12). Now carried out in semi-solid methylcellulose, erythroid progenitors are classified based on the colonies they produce with more immature progenitors producing larger colonies that take longer to mature. Additionally, cytokine requirements shift as more immature burst-forming units erythroid (BFU-E), which require “burst forming activity” cytokines such as IL-3, GM-CSF and SCF, mature into colony forming units (CFU-E) that only require erythropoietin (13, 14, Figure 1A). Most commonly, BFU-E are assayed at day 7 and 14 for mouse and human systems, respectively, whereas CFU-E are enumerated at day 2 and 7 for mouse and human systems (15). However, progenitors exist in a continuum of maturation: for example, late BFU-E have been counted at day 12 and 3 for human and mouse systems (16, 17) where murine day 3 BFU-E have been shown, along with CFU-E, to respond to erythropoietin (5, 16). Similar intermediates have been described as early CFU-E that require SCF (18). Variations of these progenitors have been associated with anemia, including inflammation-induced large immature “stress-BFU-E” that don’t require burst forming activity cytokines, and the recently defined “stress-CFU-E” which has intermediate colony size and growth characteristics similar to day 3 BFU-E (19–21).
As powerful as these historical single cell techniques are, they do not allow prospective analysis and isolation of live cell intermediates. This has fueled the development of flow cytometric criteria to identify erythroid intermediates. Flow cytometry allows investigators rapidly quantifying millions of cells, as well as sort immunophenotypically defined cell populations. This review will present the flow cytometric criteria that have been developed for all three stages of erythropoiesis, as well as address the challenges of integrating different staining approaches under conditions of acute anemia.
Flow cytometric distinction of erythroid progenitors within the hematopoietic hierarchy
The hierarchy of hematopoietic stem and progenitor cells has been intensively investigated for many years leading to alternate models of cellular intermediates along the path to unipotenital progenitors (22–26). In general, the path of generation of erythropoietic progenitors is thought to be through hematopoietic stem cell/multipotential progenitors (HSC/MPP), which first lose potential for myeloid and lymphoid fates as they become restricted megakaryocyte/erythroid progenitors (MEPs), which then differentiate into megakaryocyte progenitors (MkP) or erythroid progenitors (Figure 1A). The first step in flow cytometric gating of this hierarchy is to separate progenitors from maturing precursors by utilizing negative selection for a mix of “lineage” markers for myeloid and lymphoid cells, as well as glycophorin A (CD235a in human, Ter119 in mouse) for erythroid cells. This is paired with a positive selection for a widely expressed marker of progenitors such as kit (CD117, receptor for SCF) or CD34 (27, 28). A challenge for discriminating erythroid progenitors is that glycophorin A begins to be expressed at low levels on late-stage erythroid progenitors, and kit, as well as other late erythroid progenitor markers (such as CD36 and CD105), are still expressed on the most immature erythroid precursor, the proerythroblast (29–31). The functional colony-forming assay of CFU-E can be used to check the accuracy of the progenitor/precursor boundary based on glycophorin A in different staining protocols. A second challenge for this initial gating strategy is that CD34 is decreased on later erythroid progenitors, which would cause them to be excluded from many standard human hematopoietic gating strategies (31, 32).
Once hematopoietic progenitors are identified, it is necessary next to query markers that separate them based on their lineage potential (Figure 1A). Commonly these markers include CD127 (IL7R) for lymphoid progenitors, and CD16/32(FcGRII/III) in mouse, or CD45RA (B220) or IL3RA (CD123) in human for myeloid progenitors (29, 31). For the upstream compartment, HSC/MPP, ScaI is used as a marker in mice, and in human CD38 is used as a negative marker (28, 33). However, CD38 is variable in megakaryocyte/erythroid progenitors decreasing in MEP, increasing in BFU-E only to decrease again by CFU-E stage causing potential issues with discriminating intermediates of erythroid specification (31, 32, 34, 35). Other markers that can be included are CD41 (integrin αIIb) for megakaryocyte progenitors, or in mice Esam for HSC/MPP and megakaryocytes and CD49f (integrin α6) for non-erythroid progenitors (36, 37).
One particularly problematic scheme for derivation of intermediate progenitors within erythroid/myeloid specification is the initial gating of GMP (granulocyte-macrophage progenitor), CMP (common myeloid progenitor), and MEP that is still found broadly utilized in the literature. In this scheme all myeloid/erythroid/megakaryocyte progenitors are divided into these three populations, based on high versus low expression of two markers (CD16/32 and CD34 in mouse, or IL3Ra and CD45RA in human systems) (38, 39). These three populations were termed “GMP”, “CMP”, and “MEP”, despite being mainly comprised of more abundant downstream unipotential progenitors, as evidenced by colony forming assays and later confirmed in single cell transcriptomics (25, 26, 40). “MEP” population in particular, defined as being low in both markers, contain rare bipotential MEP and unipotential MkP, as well more abundant erythroid progenitors. In mouse, more immature BFU-E with higher levels of CD34+ are also found in the “CMP” population along with all other combinations of myeloid single and bipotential progenitors (38). This significant mixture of cells makes shifts in these populations difficult to interpret. More recent studies have highlighted specific markers that better discriminate erythroid megakaryocyte progenitors within these “MEP” and “CMP” populations (29, 32, 35, 41–43). In these protocols, initial gating for broad progenitors is followed by negative selection for non-erythroid lineages (Figure 1A) including CD41 for MkP and then erythroid-specific progenitors can be analyzed by combining markers such as CD150 (Slamf1), CD105 (endoglin), CD36 and CD71 (transferrin receptor) (see below).
Flow cytometric markers of erythroid progenitor maturation
Approximately 15 years ago, groundbreaking work in the mouse demonstrated that the that had been negatively selected against HSC, lymphoid, myeloid, and megakaryocyte progenitors (Lin-kit+, Sca1-, CD127-, CD16/32-, CD41-) could be further subdivided into erythroid progenitors using CD105 (endoglin) and CD150 expression (29). Single-positive CD150 contained bipotential MEP, as well as some BFU-E; double-positive CD150 CD105 cells contained later BFU-E and some CFU-E (termed Pre-CFU-E); and single positive CD105 cells contained mainly CFU-E. More recently, single cell transcriptomic analysis has been used to derive a variation of this gating strategy with initial gating of erythroid progenitors as CD55+, CD49f-, CD105+. Then early to late erythroid progenitors are gated based on decreasing CD150 expression, as well as increasing expression of CD71 (37). Similar maturational series of human erythroid progenitors have also been published. Starting with Lin-, CD45+, CD235a- progenitors, BFU-E can be gated as positive for CD34 and negative for CD36, with CFU-E having the reverse pattern and also expressing high CD71 (32). More recently, in a similar gating strategy to the murine system, it was found human erythroid progenitors can be gated from Kit+, CD235a- cells that were additionally negative for other lineage progenitors (CD45RA-, IL3Ra-, CD41-), and low to high for CD71. Then erythroid progenitors can be gated on a continuum using CD105 and CD34 (29, 31).
Combination these different flow cytometry strategies demonstrates two overarching conclusions about the immunophenotype of erythroid progenitors (Figure 1B). First, there is an overall conserved pattern of marker expression in human and mouse. Of the few differences, CD150 expression appears to be species-specific in murine erythroid progenitors (32, 44). Other differences may possibly be related to differences in antibody affinity. For example, despite similar onset of CD71 expression in human and murine erythroid progenitors at the RNA level, human BFU-E are CD71low, while murine BFU-E are CD71 negative (32, 37, 45). Second, examination of the flow cytometry profiles of erythroid progenitors demonstrate that they transition through these changes in marker expression along a continuum without discreate breaks in staining pattern (29, 31, 37). This continuum, reflected also in the range of size and maturation times of erythroid progenitor colony formation (Figure 1A), proves to be a distinct challenge for consistent gating using flow cytometry. Ultimately, what is critical is that cells are ranked by maturity and then segmentation of progenitor populations is consistently applied and reported in a fashion that allows others to replicate it. This can be facilitated by utilizing and reporting a biological gating control (46). For example, normal bone marrow samples can serve as a control for each experiment with gates established to derive similar percentages of maturational intermediates, and then applied to the experimental samples. For erythroid progenitor populations derived from in vitro differentiation, control cells with defined growth conditions could also serve a similar control function. While there will still be variability, especially with primary human samples, consistent guidelines for normal proportions will provide our best option for longitudinal studies and sharing of protocols across different machine platforms and staining panels.
Delineating erythroid precursors by flow cytometry
Erythroid precursor progression can also be assayed in a by flow cytometry (Figure 1B). Indeed, a soon as flow cytometric analysis of precursors was reported it rapidly was incorporated in quantitative analysis of erythropoiesis (47). Initial gating of glycophorin A positive is used, with the same caveat that low levels may be detected on CFU-Es as discussed above. Proerythroblasts are poised at the transition between progenitor and precursor and can be recognized by their staining for kit and lower levels of CD235a or Ter119 (29, 31). The intermediate erythroblasts are more difficult to gate by flow cytometry. Studies using imaging flow cytometry to overlap morphological definitions with immunophenotype have shown that they express maximal levels of glycophorin A and markers such as CD71 and CD44 change very little between basophilic and orthochromatic erythroblast stages (46). Perhaps not surprisingly, a powerful flow cytometric assay for discriminating mid-erythroblasts is light scattering measured by forward scatter (FSC). FSC is not a direct measurement of cell size but detects how much light is deflected around the cell which is affected by object size. However, FSC is also affected the light that is blocked by the cell and so is also sensitive to cell density including nuclear/cytoplasmic ratios. In murine samples, FSC decreases due to the morphological changes associated with maturation has been used and may be helpful in human erythropoiesis as well (41, 48, 49). Other measurements also correlated with morphological changes in precursor maturation include reduced staining of the vital DNA stain Hoechst, which is impeded by nuclear condensation, paired with decreased RNA in later erythroblasts detected by thiazole orange (50). In the human system, decreased expression of CD49d (α4-integrin) during erythroid maturation has been paired with the increase of Band 3 (51). As with FSC, this is another example that variations in analysis between human and mouse terminal maturation are often due to convention as mouse RBC are also rich in band3 but a commercial antibody is not yet commonly used for murine analysis. The numbers of cells in each of the erythroblast compartment increases due to a combination of precursors division to the next stage of maturation modified by differences in cell cycle between stages. Thus, accurately assigning intermediate stage erythroblast, as described by microscopy, to these flow cytometric defined subsets requires quantitative microscopy on sorted cells, or imaging flow cytometry. For the final stages of maturation, DNA stains can easily detect loss of nuclei between erythroblasts and erythrocytes. Stains for cellular components such as mitochondria (e.g. mitotracker) or RNA (e.g. thiazole orange), as well as loss of CD71 can resolve reticulocytes from RBCs (52, 53).
All together this diversity of metrics for precursor stages allows different aspects of maturation to be assayed. However, as with progenitor maturation, comparisons of precursor maturation will be most robust when used in combination with biological gating controls as described above. Finally, when proportions of erythropoietic intermediates are determined, it is important to remember that mature RBCs (Glycophorin A+, CD71-) are not an intermediate of marrow erythropoiesis but are produced from reticulocytes after they enter the circulation, and thus should not be included in the denominator of total erythropoiesis in the marrow. Instead, the RBCs in marrow samples is an indication of the circulating blood and reflects the degree of anemia, which is more accurately and directly measured by the RBC count or hematocrit from a sample of peripheral blood.
Impact of macrophage fragmentation on analysis of the erythron
The recent finding that macrophages fragment during tissue dissociation in multiple tissues, including marrow and spleen, resulting in macrophage remnants on a wide variety of hematopoietic cells has implications for flow cytometry of erythroid cells (54). This is not an integration of macrophage membrane into the cells, i.e. trogocytosis as has been suggested for some HSC populations (55), but rather distinct, small pieces of F4/80+ macrophages attached to the outside of cells including macrophage cytoplasm. This was evident in re-analysis of single cell transcriptomic data which demonstrated contamination of macrophage-associated transcripts in a subset of all populations of hematopoietic cells (54). As erythroid cells mature in vivo in association with macrophages in erythroblastic islands, it is not surprising that this contamination specifically included erythroblasts, as well as progenitors (54, 56). Therefore, this must be considered when evaluating markers on erythroid cells that could be associated with macrophages. While no ameliorating dissociation protocols have been published thus far, the use of F4/80 in staining protocols could help remove those erythroid cells with macrophage remnants on them. Imaging flow cytometry or microscopic analysis of sorted cells can be used to validate the extent of macrophage contamination with this gating. However, an important consideration is this may also remove a non-random subset of erythroid intermediates based on association with macrophages and thus, depending on the downstream assay, this needs to be considered (57). While this phenomenon has not been quantitated in human primary samples, it could certainly also be an issue given macrophage erythroid interactions.
Challenges applying erythron flow cytometry in anemia
It is important to remember that the cell surface markers used for flow cytometry are not on cells so that we can sort them but serve specific cellular functions. Therefore, under conditions that can alter function, such as anemia or inflammation, these markers may change their distribution on cells. Two known examples relevant to anemia are Sca1 and CD71. Inflammatory signals, found in many types of acute anemia, causes upregulation of Sca1 on more restricted progenitors outside of the HSC/MPP compartment (58). CD86 also marks HSC/MPP cells and is less altered by inflammation and can be used as an alternative (58). CD71 is directly regulated by erythropoietin, which is elevated in response to anemia (59). So, an increase in CD71high precursors might be due to a block in maturation, or to a delay in down-regulating CD71 in more mature erythroid precursors. Likewise, an increase in CD71+ progenitors could be due to expansion of late-stage erythroid progenitors, or due to increased expression of CD71 on more immature progenitors. Thankfully, the historical single cell technologies of microscopy, imaging flow cytometry, and colony-forming assays can help clarify these alternatives and need to be considered whenever translating steady-state immunophenotypic definitions of erythroid intermediates to anemic conditions. Interestingly, a recent paper utilizing imaging flow cytometry has shown shifts in size of erythroid progenitors downstream of erythropoietin signaling although nuclear placement was still predictive of stage (60). Culture conditions may also alter normal immunophenotypes as it is often carried out in higher oxygen, supraphysiological levels of erythropoietin, as well as a mixture of other cytokines and signaling molecules such as glucocorticoids. Additionally, while we use Ter119 staining to measure glycophorin A and it is dependent on glycophorin A expression, Ter119 actually may bind a protein closely associated with glycophorin A that can be sensitive to culture conditions (61–63). Altogether, this means that immunophenotyping of erythroid intermediates using steady-state parameters must be carefully tested when applied to anemic or in vitro culture conditions.
Discussion
There are many different cell surface markers and staining approaches for focused analyses by flow cytometry of all cellular intermediates of the erythron. It is unlikely that anyone staining protocol will be optimal for all situations. Therefore, it is critical to provide transparent data on the staining panel, and gating, as well as provide verification when needed by colony-forming assays or microscopy that similar cells are being compared by different approaches and under altered conditions. However, the presence of overlapping patterns of markers in both human and mouse should facilitate comparison of current and past studies. Addition of flow cytometric analyses to the already powerful single cells analyses of microscopy and of functional colony-forming assays provide a powerful platform to interrogate the complex regulation of erythropoiesis in steady state and in response to anemia. This will only become more important as flow cytometry provides access to a wide array of biological assays of cell cycle, cell signaling, and cell death, and can provide purified cell populations for single cell assays of transcriptomics, proteomics and metabolomics.
Author contributions
KM: Writing – original draft, Writing – review & editing.
Funding
The author(s) declares financial support was received for the research, authorship, and/or publication of this article. This work was supported by NIH R01 HL59484, R01 HL116364, and R01 DK119285.
Acknowledgments
I thank James Palis and Paul Kingsley for reading this manuscript and their suggestions. I also thank the training support and input of the URMC Flow Cytometry Resource (RRID: SCR_012360).
Conflict of interest
The author declares that the research was conducted in the absence of any commercial or financial relationships that could be construed as a potential conflict of interest.
Publisher’s note
All claims expressed in this article are solely those of the authors and do not necessarily represent those of their affiliated organizations, or those of the publisher, the editors and the reviewers. Any product that may be evaluated in this article, or claim that may be made by its manufacturer, is not guaranteed or endorsed by the publisher.
References
1. Aoki M, Tavassoli M. Dynamics of red cell egress from bone marrow after blood letting. Br J Haematol. (1981) 49:337–47. doi: 10.1111/j.1365-2141.1981.tb07235.x
2. Noble NA, Xu QP, Hoge LL. Reticulocytes II: Reexamination of the in vivo survival of stress reticulocytes. Blood. (1990) 75:1877–82. doi: 10.1182/blood.V75.9.1877.1877
3. Koury MJ, Bondurant MC. Erythropoietin retards DNA breakdown and prevents programmed death in erythroid progenitor cells. Science. (1990) 248:378–81. doi: 10.1126/science.2326648
4. Crauste F, Pujo-Menjouet L, Genieys S, Molina C, Gandrillon O. Adding self-renewal in committed erythroid progenitors improves the biological relevance of a mathematical model of erythropoiesis. J Theor Biol. (2008) 250:322–38. doi: 10.1016/j.jtbi.2007.09.041
5. Peslak SA, Wenger J, Bemis JC, Kingsley PD, Koniski AD, McGrath KE, et al. EPO-mediated expansion of late-stage erythroid progenitors in the bone marrow initiates recovery from sublethal radiation stress. Blood. (2012) 120:2501–11. doi: 10.1182/blood-2011-11-394304
6. Hyrien O, Peslak SA, Yanev NM, Palis J. Stochastic modeling of stress erythropoiesis using a two-type age-dependent branching process with immigration. J Math Biol. (2015) 70:1485–521. doi: 10.1007/s00285-014-0803-x
7. Grover A, Mancini E, Moore S, Mead AJ, Atkinson D, Rasmussen KD, et al. Erythropoietin guides multipotent hematopoietic progenitor cells toward an erythroid fate. J Exp Med. (2014) 211:181–8. doi: 10.1084/jem.20131189
8. Singh RP, Grinenko T, Ramasz B, Franke K, Lesche M, Dahl A, et al. Hematopoietic Stem Cells but Not Multipotent Progenitors Drive Erythropoiesis during Chronic Erythroid Stress in EPO Transgenic Mice. Stem Cell Rep. (2018) 10:1908–19. doi: 10.1016/j.stemcr.2018.04.012
9. Tseng YJ, Kageyama Y, Murdaugh RL, Kitano A, Kim JH, Hoegenauer KA, et al. Increased iron uptake by splenic hematopoietic stem cells promotes TET2-dependent erythroid regeneration. Nat Commun. (2024) 15:538. doi: 10.1038/s41467-024-44718-0
10. Paulson RF, Hariharan S, Little JA. Stress erythropoiesis: definitions and models for its study. Exp Hematol. (2020) 89:43–54 e42. doi: 10.1016/j.exphem.2020.07.011
12. Stephenson JR, Axelrad AA, McLeod DL, Shreeve MM. Induction of colonies of hemoglobin-synthesizing cells by erythropoietin in vitro. Proc Natl Acad Sci USA. (1971) 68:1542–6. doi: 10.1073/pnas.68.7.1542
13. Sonoda Y, Yang YC, Wong GG, Clark SC, Ogawa M. Erythroid burst-promoting activity of purified recombinant human GM-CSF and interleukin-3: studies with anti-GM-CSF and anti-IL-3 sera and studies in serum-free cultures. Blood. (1988) 72:1381–6. doi: 10.1182/blood.V72.4.1381.1381
14. Sonoda Y, Sakabe H, Ohmisono Y, Tanimukai S, Yokota S, Nakagawa S, et al. Synergistic actions of stem cell factor and other burst-promoting activities on proliferation of CD34+ highly purified blood progenitors expressing HLA-DR or different levels of c-kit protein. Blood. (1994) 84:4099–106. doi: 10.1182/blood.V84.12.4099.bloodjournal84124099
15. Palis J, Koniski A. Functional analysis of erythroid progenitors by colony-forming assays. Methods Mol Biol. (2018) 1698:117–32. doi: 10.1007/978-1-4939-7428-3_7
16. Gregory CJ. Erythropoietin sensitivity as a differentiation marker in the hemopoietic system: studies of three erythropoietic colony responses in culture. J Cell Physiol. (1976) 89:289–301. doi: 10.1002/jcp.1040890212
17. Gregory CJ, Eaves AC. Human marrow cells capable of erythropoietic differentiation in vitro: definition of three erythroid colony responses. Blood. (1977) 49:855–64. doi: 10.1182/blood.V49.6.855.855
18. Socolovsky M, Fallon AE, Lodish HF. The prolactin receptor rescues EpoR-/- erythroid progenitors and replaces EpoR in a synergistic interaction with c-kit. Blood. (1998) 92:1491–6. doi: 10.1182/blood.V92.5.1491
19. Lenox LE, Perry JM, Paulson RF. BMP4 and Madh5 regulate the erythroid response to acute anemia. Blood. (2005) 105:2741–8. doi: 10.1182/blood-2004-02-0703
20. Perry JM, Harandi OF, Paulson RF. BMP4, SCF, and hypoxia cooperatively regulate the expansion of murine stress erythroid progenitors. Blood. (2007) 109:4494–502. doi: 10.1182/blood-2006-04-016154
21. Hsieh HH, Yao H, Ma Y, Zhang Y, Xiao X, Stephens H, et al. Epo-IGF1R cross talk expands stress-specific progenitors in regenerative erythropoiesis and myeloproliferative neoplasm. Blood. (2022) 140:2371–84. doi: 10.1182/blood.2022016741
22. Adolfsson J, Mansson R, Buza-Vidas N, Hultquist A, Liuba K, Jensen CT, et al. Identification of Flt3+ lympho-myeloid stem cells lacking erythro-megakaryocytic potential a revised road map for adult blood lineage commitment. Cell. (2005) 121:295–306. doi: 10.1016/j.cell.2005.02.013
23. Iwasaki H, Akashi K. Myeloid lineage commitment from the hematopoietic stem cell. Immunity. (2007) 26:726–40. doi: 10.1016/j.immuni.2007.06.004
24. Kohn LA, Hao QL, Sasidharan R, Parekh C, Ge S, Zhu Y, et al. Lymphoid priming in human bone marrow begins before expression of CD10 with upregulation of L-selectin. Nat Immunol. (2012) 13:963–71. doi: 10.1038/ni.2405
25. Notta F, Zandi S, Takayama N, Dobson S, Gan OI, Wilson G, et al. Distinct routes of lineage development reshape the human blood hierarchy across ontogeny. Science. (2016) 351:aab2116. doi: 10.1126/science.aab2116
26. Schippel N, Sharma S. Dynamics of human hematopoietic stem and progenitor cell differentiation to the erythroid lineage. Exp Hematol. (2023) 123:1–17. doi: 10.1016/j.exphem.2023.05.001
27. Okada S, Nakauchi H, Nagayoshi K, Nishikawa S, Nishikawa S, Miura Y, et al. Enrichment and characterization of murine hematopoietic stem cells that express c-kit molecule. Blood. (1991) 78:1706–12. doi: 10.1182/blood.V78.7.1706.1706
28. Rusten LS, Jacobsen SE, Kaalhus O, Veiby OP, Funderud S, Smeland EB. Functional differences between CD38- and DR- subfractions of CD34+ bone marrow cells. Blood. (1994) 84:1473–81. doi: 10.1182/blood.V84.5.1473.1473
29. Pronk CJ, Rossi DJ, Mansson R, Attema JL, Norddahl GL, Chan CK, et al. Elucidation of the phenotypic, functional, and molecular topography of a myeloerythroid progenitor cell hierarchy. Cell Stem Cell. (2007) 1:428–42. doi: 10.1016/j.stem.2007.07.005
30. Peslak SA, Wenger J, Bemis JC, Kingsley PD, Frame JM, Koniski AD, et al. Sublethal radiation injury uncovers a functional transition during erythroid maturation. Exp Hematol. (2011) 39:434–45. doi: 10.1016/j.exphem.2011.01.010
31. Yan H, Ali A, Blanc L, Narla A, Lane JM, Gao E, et al. Comprehensive phenotyping of erythropoiesis in human bone marrow: Evaluation of normal and ineffective erythropoiesis. Am J Hematol. (2021) 96:1064–76. doi: 10.1002/ajh.26247
32. Li J, Hale J, Bhagia P, Xue F, Chen L, Jaffray J, et al. Isolation and transcriptome analyses of human erythroid progenitors: BFU-E and CFU-E. Blood. (2014) 124:3636–45. doi: 10.1182/blood-2014-07-588806
33. Spangrude GJ, Heimfeld S, Weissman IL. Purification and characterization of mouse hematopoietic stem cells. Science. (1988) 241:58–62. doi: 10.1126/science.2898810
34. Debili N, Coulombel L, Croisille L, Katz A, Guichard J, Breton-Gorius J, et al. Characterization of a bipotent erythro-megakaryocytic progenitor in human bone marrow. Blood. (1996) 88:1284–96. doi: 10.1182/blood.V88.4.1284.bloodjournal8841284
35. Sanada C, Xavier-Ferrucio J, Lu YC, Min E, Zhang PX, Zou S, et al. Adult human megakaryocyte-erythroid progenitors are in the CD34+CD38mid fraction. Blood. (2016) 128:923–33. doi: 10.1182/blood-2016-01-693705
36. Ishibashi T, Yokota T, Tanaka H, Ichii M, Sudo T, Satoh Y, et al. ESAM is a novel human hematopoietic stem cell marker associated with a subset of human leukemias. Exp Hematol. (2016) 44:269–281 e261. doi: 10.1016/j.exphem.2015.12.010
37. Tusi BK, Wolock SL, Weinreb C, Hwang Y, Hidalgo D, Zilionis R, et al. Population snapshots predict early haematopoietic and erythroid hierarchies. Nature. (2018) 555:54–60. doi: 10.1038/nature25741
38. Akashi K, Traver D, Miyamoto T, Weissman IL. A clonogenic common myeloid progenitor that gives rise to all myeloid lineages. Nature. (2000) 404:193–7. doi: 10.1038/35004599
39. Manz MG, Miyamoto T, Akashi K, Weissman IL. Prospective isolation of human clonogenic common myeloid progenitors. Proc Natl Acad Sci USA. (2002) 99:11872–7. doi: 10.1073/pnas.172384399
40. Kucinski I, Campos J, Barile M, Severi F, Bohin N, Moreira PN, et al. A time- and single-cell-resolved model of murine bone marrow hematopoiesis. Cell Stem Cell. (2024) 31:244–259 e210. doi: 10.1016/j.stem.2023.12.001
41. Chen K, Liu J, Heck S, Chasis JA, An X, Mohandas N. Resolving the distinct stages in erythroid differentiation based on dynamic changes in membrane protein expression during erythropoiesis. Proc Natl Acad Sci USA. (2009) 106:17413–8. doi: 10.1073/pnas.0909296106
42. Mori Y, Chen JY, Pluvinage JV, Seita J, Weissman IL. Prospective isolation of human erythroid lineage-committed progenitors. Proc Natl Acad Sci USA. (2015) 112:9638–43. doi: 10.1073/pnas.1512076112
43. Scanlon VM, Thompson EN, Lawton BR, Kochugaeva M, Ta K, Mayday MY, et al. Multiparameter analysis of timelapse imaging reveals kinetics of megakaryocytic erythroid progenitor clonal expansion and differentiation. Sci Rep. (2022) 12:16218. doi: 10.1038/s41598-022-19013-x
44. Novershtern N, Subramanian A, Lawton LN, Mak RH, Haining WN, McConkey ME, et al. Densely interconnected transcriptional circuits control cell states in human hematopoiesis. Cell. (2011) 144:296–309. doi: 10.1016/j.cell.2011.01.004
45. Di Tullio A, Vu Manh TP, Schubert A, Castellano G, Mansson R, Graf T. CCAAT/enhancer binding protein alpha (C/EBP(alpha))-induced transdifferentiation of pre-B cells into macrophages involves no overt retrodifferentiation. Proc Natl Acad Sci USA. (2011) 108:17016–21. doi: 10.1073/pnas.1112169108
46. McGrath KE, Catherman SC, Palis J. Delineating stages of erythropoiesis using imaging flow cytometry. Methods. (2017) 112:68–74. doi: 10.1016/j.ymeth.2016.08.012
47. Socolovsky M, Nam H, Fleming MD, Haase VH, Brugnara C, Lodish HF. Ineffective erythropoiesis in Stat5a(-/-)5b(-/-) mice due to decreased survival of early erythroblasts. Blood. (2001) 98:3261–73. doi: 10.1182/blood.V98.12.3261
48. Liu Y, Pop R, Sadegh C, Brugnara C, Haase VH, Socolovsky M. Suppression of Fas-FasL coexpression by erythropoietin mediates erythroblast expansion during the erythropoietic stress response in vivo. Blood. (2006) 108:123–33. doi: 10.1182/blood-2005-11-4458
49. Liu J, Zhang J, Ginzburg Y, Li H, Xue F, De Franceschi L, et al. Quantitative analysis of murine terminal erythroid differentiation in vivo: novel method to study normal and disordered erythropoiesis. Blood. (2013) 121:e43–49. doi: 10.1182/blood-2012-09-456079
50. Kingsley PD, Greenfest-Allen E, Frame JM, Bushnell TP, Malik J, McGrath KE, et al. Ontogeny of erythroid gene expression. Blood. (2013) 121:e5–e13. doi: 10.1182/blood-2012-04-422394
51. Hu J, Liu J, Xue F, Halverson G, Reid M, Guo A, et al. Isolation and functional characterization of human erythroblasts at distinct stages: implications for understanding of normal and disordered erythropoiesis in vivo. Blood. (2013) 121:3246–53. doi: 10.1182/blood-2013-01-476390
52. An X, Chen L. Flow cytometric analysis of erythroblast enucleation. Methods Mol Biol. (2018) 1698:193–203. doi: 10.1007/978-1-4939-7428-3_11
53. Kalfa T, McGrath KE. Analysis of erythropoiesis using imaging flow cytometry. Methods Mol Biol. (2018) 1698:175–92. doi: 10.1126/science.adp2065
54. Millard SM, Heng O, Opperman KS, Sehgal A, Irvine KM, Kaur S, et al. Fragmentation of tissue-resident macrophages during isolation confounds analysis of single-cell preparations from mouse hematopoietic tissues. Cell Rep. (2021) 37:110058. doi: 10.1016/j.celrep.2021.110058
55. Gao X, Carpenter RS, Boulais PE, Zhang D, Marlein CR, Li H, et al. Regulation of the hematopoietic stem cell pool by C-Kit-associated trogocytosis. Science. (2024) 385:eadp2065. doi: 10.1126/science.adp2065
56. Romano L, Seu KG, Papoin J, Muench DE, Konstantinidis D, Olsson A, et al. Erythroblastic islands foster granulopoiesis in parallel to terminal erythropoiesis. Blood. (2022) 140:1621–34. doi: 10.1182/blood.2022015724
57. Hume DA, Millard SM, Pettit AR. Macrophage heterogeneity in the single-cell era: facts and artifacts. Blood. (2023) 142:1339–47. doi: 10.1182/blood.2023020597
58. Kanayama M, Izumi Y, Yamauchi Y, Kuroda S, Shin T, Ishikawa S, et al. CD86-based analysis enables observation of bona fide hematopoietic responses. Blood. (2020) 136:1144–54. doi: 10.1182/blood.2020004923
59. Kerenyi MA, Grebien F, Gehart H, Schifrer M, Artaker M, Kovacic B, et al. Stat5 regulates cellular iron uptake of erythroid cells via IRP-2 and TfR-1. Blood. (2008) 112:3878–88. doi: 10.1182/blood-2008-02-138339
60. Hidalgo D, Bejder J, Pop R, Gellatly K, Hwang Y, Maxwell Scalf S, et al. EpoR stimulates rapid cycling and larger red cells during mouse and human erythropoiesis. Nat Commun. (2021) 12:7334. doi: 10.1038/s41467-021-27562-4
61. Kina T, Ikuta K, Takayama E, Wada K, Majumdar AS, Weissman IL, et al. The monoclonal antibody TER-119 recognizes a molecule associated with glycophorin A and specifically marks the late stages of murine erythroid lineage. Br J Haematol. (2000) 109:280–7. doi: 10.1046/j.1365-2141.2000.02037.x
62. Otani T, Nakamura S, Inoue T, Ijiri Y, Tsuji-Takayama K, Motoda R, et al. Erythroblasts derived in vitro from embryonic stem cells in the presence of erythropoietin do not express the TER-119 antigen. Exp Hematol. (2004) 32:607–13. doi: 10.1016/j.exphem.2004.04.007
Keywords: erythropoiesis, flow cytometry, anemia, progenitor, precursor
Citation: McGrath KE (2024) Delineation of erythropoietic intermediates by flow cytometry. Front. Hematol. 3:1496916. doi: 10.3389/frhem.2024.1496916
Received: 15 September 2024; Accepted: 18 November 2024;
Published: 03 December 2024.
Edited by:
Robert F. Paulson, The Pennsylvania State University (PSU), United StatesReviewed by:
Lily Huang, University of Texas Southwestern Medical Center, United StatesMerav Socolovsky, University of Massachusetts Boston, United States
Theodosia A. Kalfa, Cincinnati Children’s Hospital Medical Center, United States
Copyright © 2024 McGrath. This is an open-access article distributed under the terms of the Creative Commons Attribution License (CC BY). The use, distribution or reproduction in other forums is permitted, provided the original author(s) and the copyright owner(s) are credited and that the original publication in this journal is cited, in accordance with accepted academic practice. No use, distribution or reproduction is permitted which does not comply with these terms.
*Correspondence: Kathleen E. McGrath, a2F0aGxlZW5lX21jZ3JhdGhAVVJNQy5yb2NoZXN0ZXIuZWR1