 Ali Farshid
 Sarah E. Null
- 1Department of Watershed Sciences, Utah State University, Logan, UT, United States
- 2Institute for Water, Environment and Health, United Nations University, Richmond Hill, ON, Canada
Urban flooding presents a global challenge, disproportionately affecting socially vulnerable communities. In the U.S., catastrophic floods are compounded by climate change, aging infrastructure, rapid land development, and population growth. Flooding causes more damage than any other severe weather-related event, with an annual average cost of US $4.5 billion and an average of 17 fatalities per year between 1980 and 2024. FEMA’s outdated 100-year floodplain delineations fail to capture evolving flood risk, leading to development inside and outside of 100-year floodplains and potentially higher flood risk for vulnerable communities. Excluding development in 500-year floodplains would reduce risk, although encroachment of urban development into 500-year floodplains exacerbates risks. Despite extensive coastal flood risk and environmental justice research, few studies have been conducted in inland areas like the Intermountain West. Our study analyzes FEMA’s National Flood Hazard Layer and data from the 2017–2021 American Community Survey to quantify flood injustices in Salt Lake County, Utah. We develop a straight-forward and easily implementable approach for city and county level planning and flood injustice policymaking. Our objectives include assessing demographic attributes within and outside 500-year floodplains, identifying household and population flood injustices, and overlaying 500-year floodplain maps and selected flood injustice variables. Results show that although 44% of Salt Lake County’s 500-year floodplain is in the City of South Salt Lake, the cities of Millcreek and South Jordan emerge as most vulnerable for 500-year flood injustices, these cities have flood risk ratios of 1.92 and 1.67, respectively, where a risk ratio greater than 1.00 indicates potentially concerning flood injustice. These findings highlight observed inequities but do not indicate or prove systematic, intentional, or historical biases resulting from past or present discriminatory policies and practices within these cities. This study contributes to a deeper understanding of flood injustices in inland urban areas, shedding light on the intersection of flood risk and social vulnerability at microscales. Identifying flood injustice communities can inform targeted interventions and policy measures to mitigate flood injustices and enhance flood resilience and adaptation in inland urban areas for vulnerable communities.
1 Introduction
Urban flooding (flooding) is the most devastating, financially burdensome, and deadliest natural disaster worldwide (Escobar Carías et al., 2022). From 1994 to 2013, it was the predominant type of natural disaster, comprising 43% of all documented events, affecting nearly 2.5 billion people globally, and resulting in 160,000 thousand fatalities (Doocy et al., 2013; Wang et al., 2021). Between 1980 and 2024, the United States (U.S.) experienced 44 catastrophic floods, each causing over a billion dollars in damage. These events resulted in a total cost of $200.7 billion in 2024 dollars (adjusted for inflation) and claimed 738 lives (NOAA, 2025).
Federal Emergency Management Agency’s (FEMA) flood maps show flood zones, floodplain boundaries, and base flood elevations in the U.S. (FEMA, 2025). The 100-year floodplain zones indicate areas with a 1% chance of annual flooding. They are used to determine flood risk for residential, commercial, and industrial developments, and trigger flood insurance requirements (Brody et al., 2014). As of 2018, about 13.3% of the U.S. population lived in the 100-year floodplain (Wing et al., 2018). However, the 100-year floodplain has major limitations for assessing flood risk (Patterson and Doyle, 2009; Brody et al., 2014; Blessing et al., 2017; Tyler et al., 2019). First, the 100-year floodplain encourages development immediately outside of its boundary because flood insurance is not required, although the probability of flooding may be only nominally lower than inside the flood boundary (Patterson and Doyle, 2009). Also, the intensification of hydrological patterns driven by climate change is exacerbating flood risk (Ficklin et al., 2022). By 2050, regions within the 100-year FEMA floodplain may have double the flood risk, effectively downgrading these regions to 50-year floodplains (Arnell and Gosling, 2016).
Areas outside of the 100-year floodplain and within the 500-year floodplain (i.e., with a 0.2% chance of annual flooding) are common for dense development (Utah Flood Hazards, 2020). Several studies have underscored a vital need to assess flood risks within 500-year floodplains (Patterson and Doyle, 2009; Zoll, 2021; Mostafiz et al., 2022; Al Assi et al., 2023). The increase in development density within 100-year and especially 500-year floodplains could potentially equate to significant future flood exposure in response to climate change and population growth (Pielke and Downton, 2000; Patterson and Doyle, 2009; Cutter et al., 2018; Kourtis et al., 2021).
In the U.S., the primary metric of assessing flood impacts has historically been economic losses, rather than focusing on who is exposed, which opens the possibility that various people and communities are affected differently (Tate et al., 2021). This places flood (in)justice within the realm of Environmental Justice (EJ). EJ began as a civil rights movement to address the disproportionate vulnerability of marginalized communities to human-induced pollution (Bullard, 1993; Schlosberg, 2013). It has expanded to broadly encompass equitable protection from environmental harms like flooding and pollution, and equal access to decision-making for a healthy environment (US EPA., 2023; Kato-Huerta and Geneletti, 2023). Populations that live in flood zones disproportionately experience higher rates of morbidity and mortality because of their heightened exposure to flooding and limited access to protective and mitigative resources (Zahran et al., 2008; Collins et al., 2013; Linscott et al., 2022).
Multiple studies have underscored the unequal challenges experienced by vulnerable populations during and following flood disasters, largely due to the concentration of vulnerable populations residing in flood-prone areas (Collins et al., 2018). Several flood injustice studies focus on flooding in 100-year floodplains in southern and southeastern states, regions more prone to coastal flooding than inland flooding (for example, Chakraborty et al., 2014; Grineski et al., 2015; Maldonado et al., 2016; Collins et al., 2018). Many studies in southeastern states have also examined the nexus between inland flooding and 500-year floodplains. For example, Debbage (2019) found that non-Hispanic black individuals were over eight times more likely to reside in the 500-year floodplain than non-Hispanic white individuals in the region stretching from Charlotte, NC to Atlanta, GA. In North Carolina, 500-year floodplains were used as a proxy for flood risk to identify areas with a disproportionately high exposure to flood hazards for Hispanic, non-Hispanic Black, and below poverty populations (Yaryan Hall and Bledsoe, 2023). We did not identify any studies that assess the intersection of FEMA 500-year floodplains and injustice implications in the Intermountain West, although Carothers (2018) surveyed local knowledge, perceptions, and experiences among minority communities living adjacent to the Jordan River in Salt Lake County. She found that women show higher concern for water quality while immigrant and Latinx respondents express greater concern about flooding. We did not identify any studies that assess the intersection of FEMA 500-year floodplains and injustice implications in the Intermountain West.
Analyzing flood injustices at the city level enables municipalities to identify disparities within their jurisdictions and develop targeted strategies to correct flood injustices that are aligned with governance responsibilities and budgetary constraints. Simultaneously, counties evaluate flood injustices across cities, facilitating the prioritization of resources to mitigate injustices. Cities primarily focus on enforcing local floodplain and land use regulations, developing and maintaining stormwater and flood control infrastructure, and engaging communities to address the immediate needs of vulnerable populations (Blaikie et al., 2004). In contrast, counties typically offer the technical expertise, financial resources, and coordination necessary to implement cohesive, region-wide flood risk and injustice reduction strategies (Cutter et al., 2003). Furthermore, emerging research underscores the importance of scalable, accessible tools, ranging from GIS-based mapping to integrated vulnerability assessments, in equipping local governments to more effectively manage flood risks and promote flood justice (Chang et al., 2021; Hughes et al., 2021; Pellerey et al., 2025).
Our overarching goal is to develop a straightforward and easily-implementable framework for analyzing flood injustices using publicly available data at the city and county scales. We selected this spatial scale because cities and counties play a distinct role in managing flood risks, as states largely delegate these responsibilities to them for enforcing land-use regulations, including floodplain management (Tullos, 2018). By providing a clear and data-driven approach, this study enables local and state agencies, as well as the public, to better understand the extent and severity of flood injustices in their communities.
We quantify and map flood injustices at the city and county scale in Salt Lake County (SLCO), Utah, by intersecting 500-year floodplain flood risk and vulnerability, as measured by socioeconomic and demographic variables. We use the latest version of the FEMA’s National Flood Hazard Layer (NFHL) for SLCO to delineate 500-year floodplain and the U.S. Census Bureau’s 2017–2021 American Community Survey (ACS) data to quantify human vulnerability. We address three key research objectives: (1) summarize the socioeconomic and demographic attributes of residents inside and outside of 500-year floodplains, (2) determine if the densities of vulnerable communities are statistically different in the 500-year floodplain compared to non-floodplain areas, and (3) create maps to visualize flood injustices for the most vulnerable cities rather than developing a complex analysis.
2 Materials and methods
2.1 Study area
SLCO is in northern Utah, with an area of 1,188 km2. The county is bounded by the Wasatch Mountains to the east, the Oquirrh Mountains to the west, the Traverse Mountains to the south and Great Salt Lake to the north. It is the most populous county in the state with an estimated population of 1,186,257 as of July 2022 (U.S. Census Bureau, 2024a) and has undergone considerable land development and population growth in the past two decades (Khatri et al., 2019). Per the Kem C. Gardner Policy Institute’s Demographics Projections (Kem, C. Gardner Policy Institute, 2022), the population of SLCO is expected to exceed 1.6 million by 2060. Aside from mountain areas, SLCO is mostly urban. It encompasses 63 municipal boundaries, comprising 20 cities, 3 towns, and 40 unincorporated areas (Salt Lake County Surveyor’s Office, 2024). The Cities of Herriman, Bluffdale, Kearns, Cottonwood Heights, Emigration Canyon, and Magna were omitted from analysis because they had no 500-year floodplains or no people living in 500-year floodplains. Salt Lake City is the largest city in the county and state, and serves as the economic, cultural, and political hub of the region.
SLCO has mountainous headwaters with snowmelt-dominated streamflow. The Jordan River flows northerly for 81 kilometers from Utah Lake to Great Salt Lake (Figure 1). Major perennial tributaries are located on the east side of the county with a few non-perennial rivers on the west side. The flows of the Jordan River from Utah Lake are controlled, and flood potential is somewhat reduced upstream of the major Jordan River tributaries by the dams, diversions, and pump stations. However, all tributaries and the Jordan River have the potential to flood in response to extreme runoff events beyond the design capacity of the flood control structures (Bowen Collins & Associates, 2019).
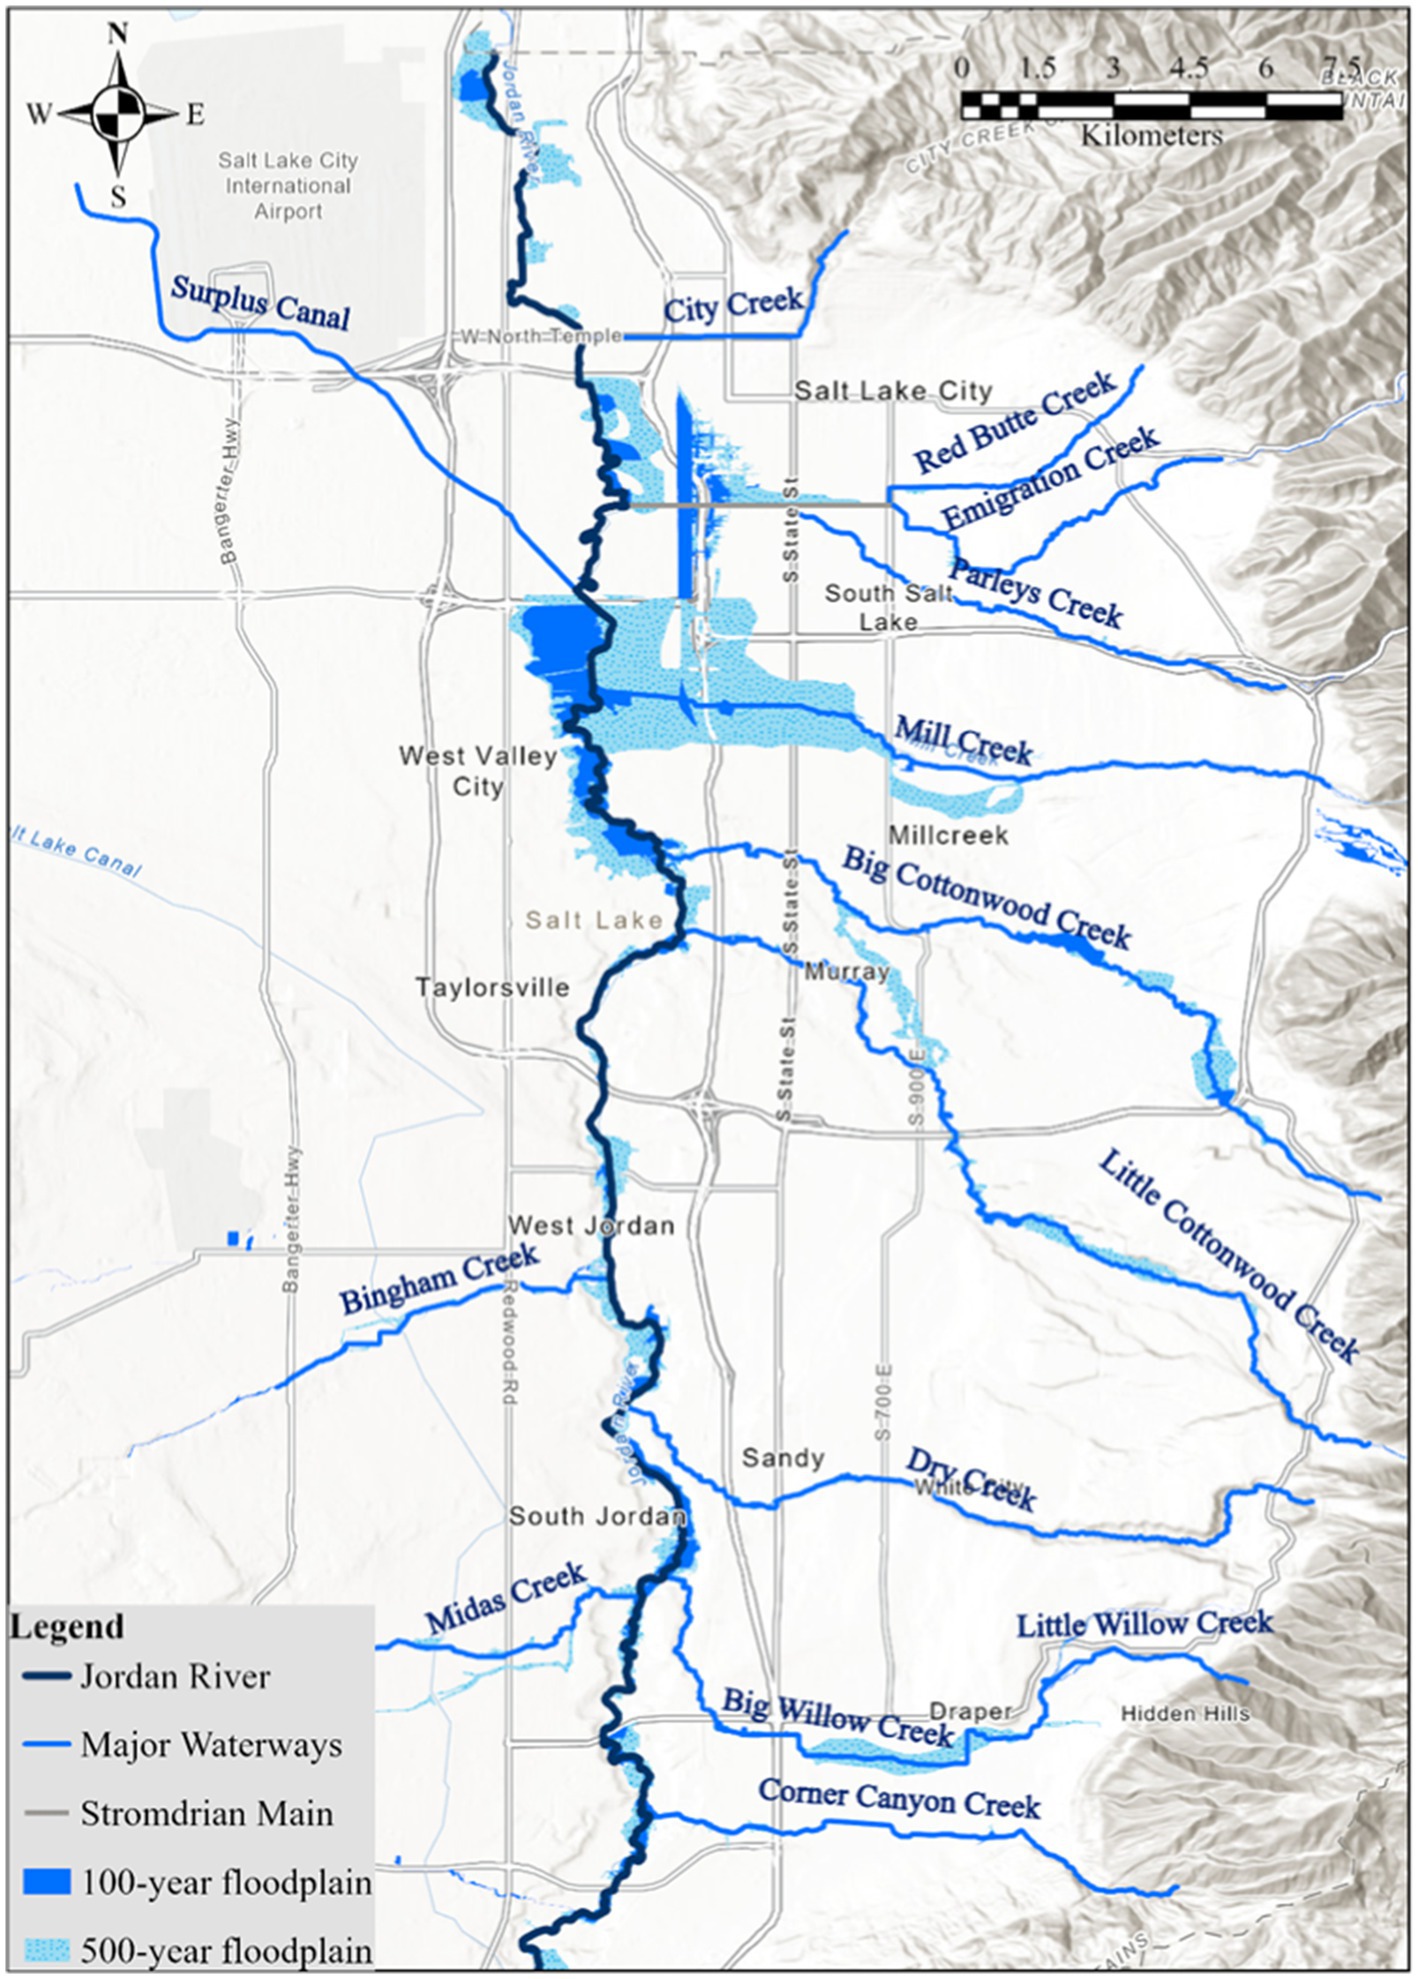
Figure 1. Distribution of FEMA’s 100-year and 500-year floodplains in SLCO (Sources: Esri, NASA, NGA, USGS, FEMA, Murray City GIS, County of Salt Lake, Utah Geospatial Resource Center, TomTom, Garmin, SafeGraph, Bureau of Land Management, EPA, NPS, USDA, USFWS).
Approximately 35% of all flood claims in Utah submitted to the National Flood Insurance Program between 1978 and 2019 were from SLCO (Utah Division of Emergency Management, 2019). Hydrologic intensification, with wetter wet periods and drier dry periods, is anticipated to exacerbate flood potential (Sun and Wang, 2012; Donat et al., 2016). A rain event that is currently associated with a 100-year return period in Salt Lake City is anticipated to have a return period of 20–30 years under future 2050–2099 climate projections (Vahedifard et al., 2021).
2.2 Analysis
The following sections explain our analytical approach (Figure 2). First, we describe our analysis of Salt Lake City International Airport long-term rainfall data to understand temporal precipitation trends in SLCO. Next, we use FEMA’s 500-year floodplain data along with socioeconomic and demographic data from the 2017–2021 ACS to conduct a geospatial analysis. This study identifies and extracts socioeconomic and demographic variables that indicate flood injustice for SLCO and 14 cities within the county. We develop maps that overlay the 500-year floodplains with the selected socioeconomic and demographic variables.
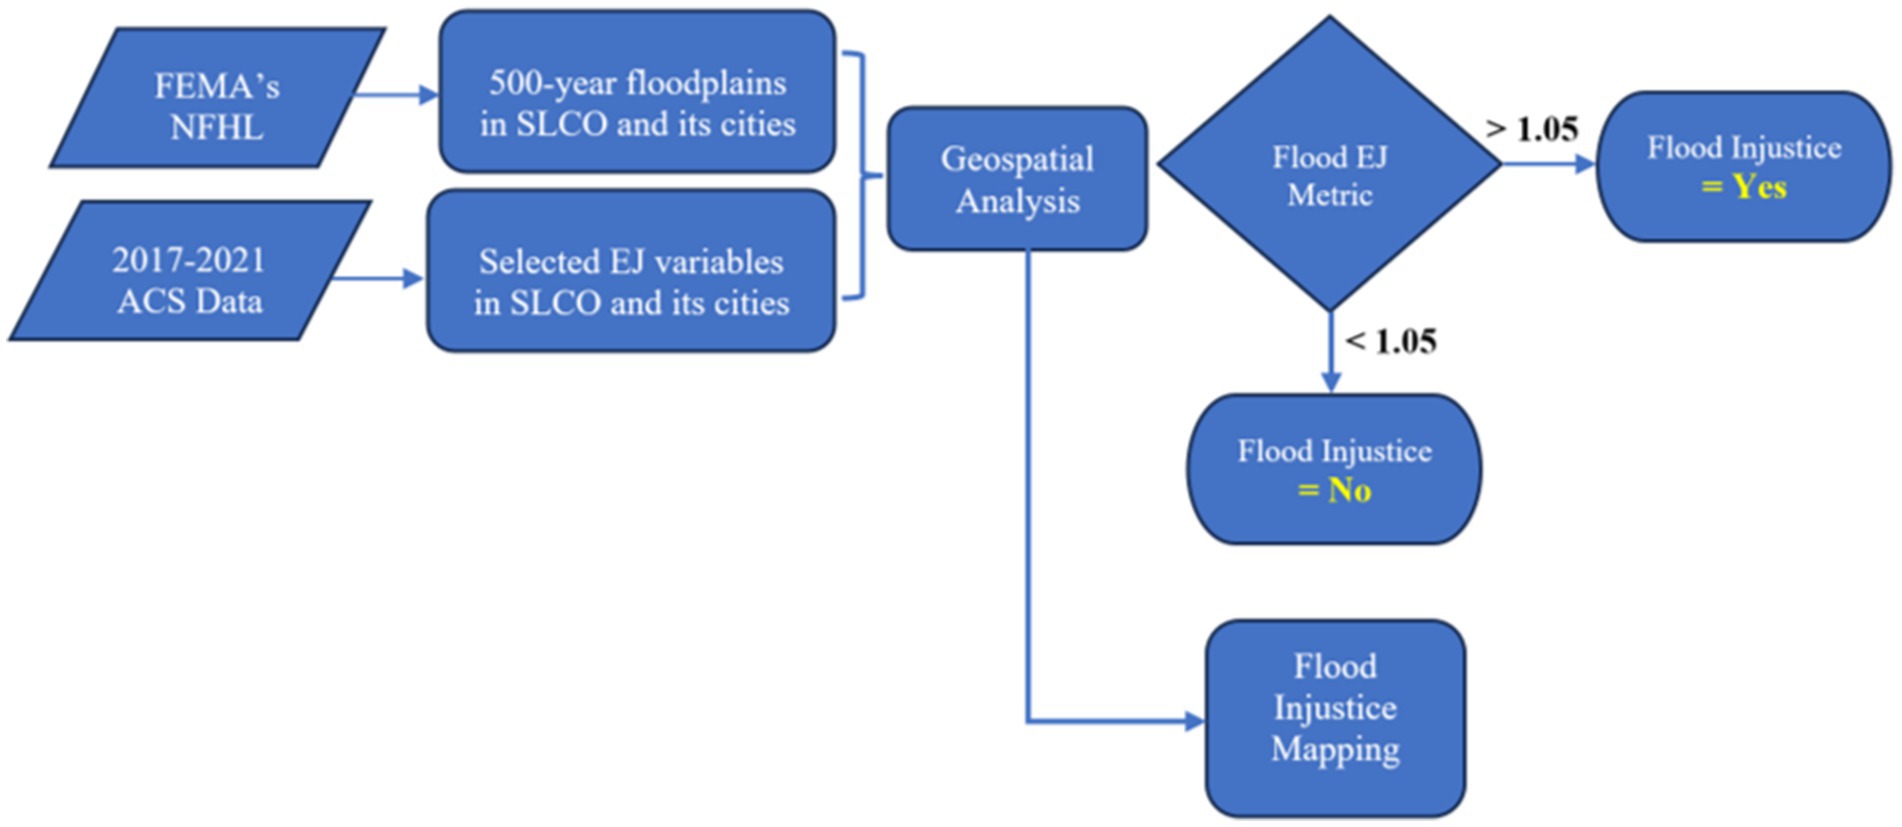
Figure 2. Study analysis approach for quantifying flood injustices in SLCO.
2.3 Rainfall temporal trend analysis
We used innovative trend analysis (ITA) to assess temporal rainfall trends in SLCO. ITA is a non-parametric statistical test that has been widely used for detecting trends in meteorological, hydrological, and environmental time series (Şen, 2012; Kisi, 2015). It divides a time series into two equal sub-series and sorts them in ascending order. The first sub-series is plotted on the horizontal axis (x-axis) and the second sub-series is plotted on the vertical axis (y-axis) (Wu and Qian, 2017). If the time series are identical to each other, their points scatter along the 1∶1 (45°) line. Compared to traditional trend identification techniques, such as Mann-Kendall and Spearman’s rho tests, the ITA method has fewer restrictive assumptions such as non-linearity, normality, serial correlation, and length of data (Şen, 2012). ITA can detect obscure trends and can calculate trend slope (Gumus et al., 2022; Wu and Qian, 2017). Detailed descriptions of ITA can be found in Şen (2012) and Wang et al. (2020). We calculated rainfall trend slope through time using annual water year precipitation from 1875 to 2022 (147 years) measured at the Salt Lake City International Airport National Weather Service station.
2.4 FEMA floodplains
FEMA identifies areas of high (within 100-year floodplain), moderate (within 100-year and 500-year floodplains), and minimal (outside of the 500-year floodplain) flood risk and publishes them as flood maps (FEMA, 2025). Historically, more than 20% of flood damage claims submitted to FEMA were made by policyholders in moderate and minimal flood risk zones (FEMA, 2023). We downloaded SLCO’s National Flood Hazard Layer (NFHL) (Product ID: NFHL_49035C) from the FEMA Flood Map Service Center webpage with development and revision dates of 11/19/2021 and 02/21/2023, respectively (Figure 1). We then uploaded NFHL to ArcGIS Pro to extract 100-year and 500-year floodplain boundaries within SLCO (Figure 1).
2.5 American community survey
The U.S. Census Bureau’s American Community Survey (ACS) is a nationwide annual survey that gathers population data, including social, racial, economic, housing, and demographic characteristics. Every year, the Census Bureau contacts over 3.5 million households across the country to participate. The U.S. Census Bureau provides a margin of error with a 90% confidence interval to quantify the statistical reliability of the data (U.S. Census Bureau, 2021).
We used 2017–2021 ACS 5-year estimates to extract the values of eight variables. Four of these variables were based on household surveys: income below the poverty level (Income), one or more disabled person in the household (Disability), reliance on government food assistance, officially known as Supplemental Nutrition Assistance Program (SNAP), and Internet access (Internet). The other four variables were based on individual surveys: Hispanic or Latino (Ethnicity), non-white (Race), education level of a high school diploma or lower (Education), and divorced or widowed marital status (Unmarried) individuals.
These variables have been used in previous flood injustice studies because the facilitate timely and secure evacuation during floods and expedite recovery following floods (Maantay and Maroko, 2009; Cutter, 2006; Tate et al., 2021; Xu and Qiang, 2024). While some studies have suggested additional variables such as English language proficiency and health insurance as key elements influencing vulnerability to flooding (Qiang, 2019; Tate et al., 2021), we excluded these variables from our study because English language proficiency is highly correlated with ethnicity and race, and over 90% of the SLCO population has healthcare coverage (U.S. Census Bureau, 2023).
These variables are appropriate to evaluate social injustices and differential flood risks. For example, low-income households are disproportionately impacted by local flood events, underscoring inequities in accessing resources for flood prevention, mitigation, and recovery (Aerts et al., 2018). Physical and mental disabilities impede mobility during evacuations, while hearing, visual, or cognitive impairments can limit access to emergency alerts and risk information (Bailie et al., 2022). Reliance on food assistance programs, such as SNAP reflects broader socioeconomic vulnerabilities that increase the likelihood of households experiencing disproportionate adverse impacts during and after flood events (Fitzpatrick et al., 2020; Clay et al., 2020). Lack of internet access exacerbates flood injustices by limiting vulnerable populations’ ability to prepare, respond, and recover (Hao et al., 2022). Flooding disproportionately impacts racial and ethnic minorities due to long-standing systemic inequalities, including discriminatory policies like redlining, that have historically forced marginalized communities into flood-prone areas with poor flood control infrastructure, and in some cases, English as a second language (Elliott and Pais, 2006; Tate et al., 2021). Limited educational attainment exacerbates flood injustices from reduced awareness of flood risks and preparedness strategies (Tate et al., 2021).
While some studies have suggested additional variables such as English language proficiency and health insurance as key elements influencing vulnerability to flooding (Qiang, 2019; Tate et al., 2021), we excluded these variables from our study because English language proficiency is highly correlated with ethnicity and race, and over 90% of the SLCO population has healthcare coverage (U.S. Census Bureau, 2023).
2.6 Geospatial analysis
ACS geographic units (e.g., block groups, census tracts) do not align precisely with FEMA-designated flood zones. Consequently, a spatial allocation method is required to appropriately distribute ACS data within FEMA flood zone polygons. We apportioned ACS demographic data to flood risk polygons with the Enrich Tool in ArcGIS Pro v3.2.2 (ESRI, Redlands, CA, USA). The block apportionment method uses weighted centroid geographic retrieval to aggregate data for custom polygons. The Enrich Tool is effective at this task and has been used in studies that include U.S. Census Bureau and ACS data (Sannigrahi et al., 2020). However, this method assumes that flood risk and population are uniform within census units, which can introduce error.
The Enrich tool in ArcGIS Pro provides two reliability scores with a potential range of 1.0 (best) to 5.0 (worst) (Esri, 2025). The most important score is the ratio of the population polygon’s area to the number of people estimated to live there. This ratio was 2.2 for all the enriched polygons in this study. The second score represents overall reliability, including the reliability of the ratio of the polygon area to the population and a rating of the reliability of the census data. The census reliability accounts for the date of the census, the collection method, and completeness of the census. This ratio was 2.6 for all enriched polygons. Esri also estimates coefficient of variation (CV) as a quick reference to assess the usability of an ACS estimate. In our study, all ACS variables have CVs less than or equal to 12%. This suggests that the sampling error is small compared to the estimate (Esri, 2023).
2.7 Estimating flood injustice
To quantify flood injustice across the eight variables at the county and city levels, we adopted the Comparative Environmental Risk Index (CERI), developed by Harner et al. (2002). This metric, also known as the risk ratio (Debbage, 2019), classifies the social, racial, economic, housing, and demographic characteristics or households or individuals into two categories: those within the 500-year floodplain and those outside of the 500-year floodplain. For example, to evaluate the intersection of vulnerability and race, we sum non-white individuals in the 500-year floodplain and divide by the total number of non-white individuals in the county. Then we repeat the process for the white population to provide a ratio of flood risk and race (Equation 1). In other words, CERI is the ratio of two ratios, indicating the percentage of non-white individuals vulnerable to flood risk compared to the percentage of white individuals at risk (Harner et al., 2002). We selected the CERI method because it is an established metric for quantifying flood injustice and has been used in similar research (Fielding and Burningham, 2005; Debbage, 2019; Yaryan Hall and Bledsoe, 2023; Selsor et al., 2023; Vahedifard et al., 2023).
A value greater than one signifies flood injustice, indicating social, racial, economic, housing, or demographic flood injustice variables are over-represented in households or individuals in the 500-year floodplains. We used this equation to calculate the Flood Injustice Index at the county and city levels. At the county level, we used Equation 1 to calculate the indices for the eight variables. At the city level, we used the same equation for each of the eight variables in every selected city individually. Then, we calculated the arithmetic mean across all eight variables for each city and ranked the cities based on these averages, from highest to lowest (Table 1). In this study, we establish a threshold for flood injustice when over-representation exceeded 5%, or when the Flood Injustice Index exceeded 1.05. We used the “fmsb” package in R (version 4.3.1) to compute the indices, calculate MOEs with a 95% confidence interval, and determine corresponding p-values for assessing statistical significance (Debbage, 2019; Nakazawa, 2023).
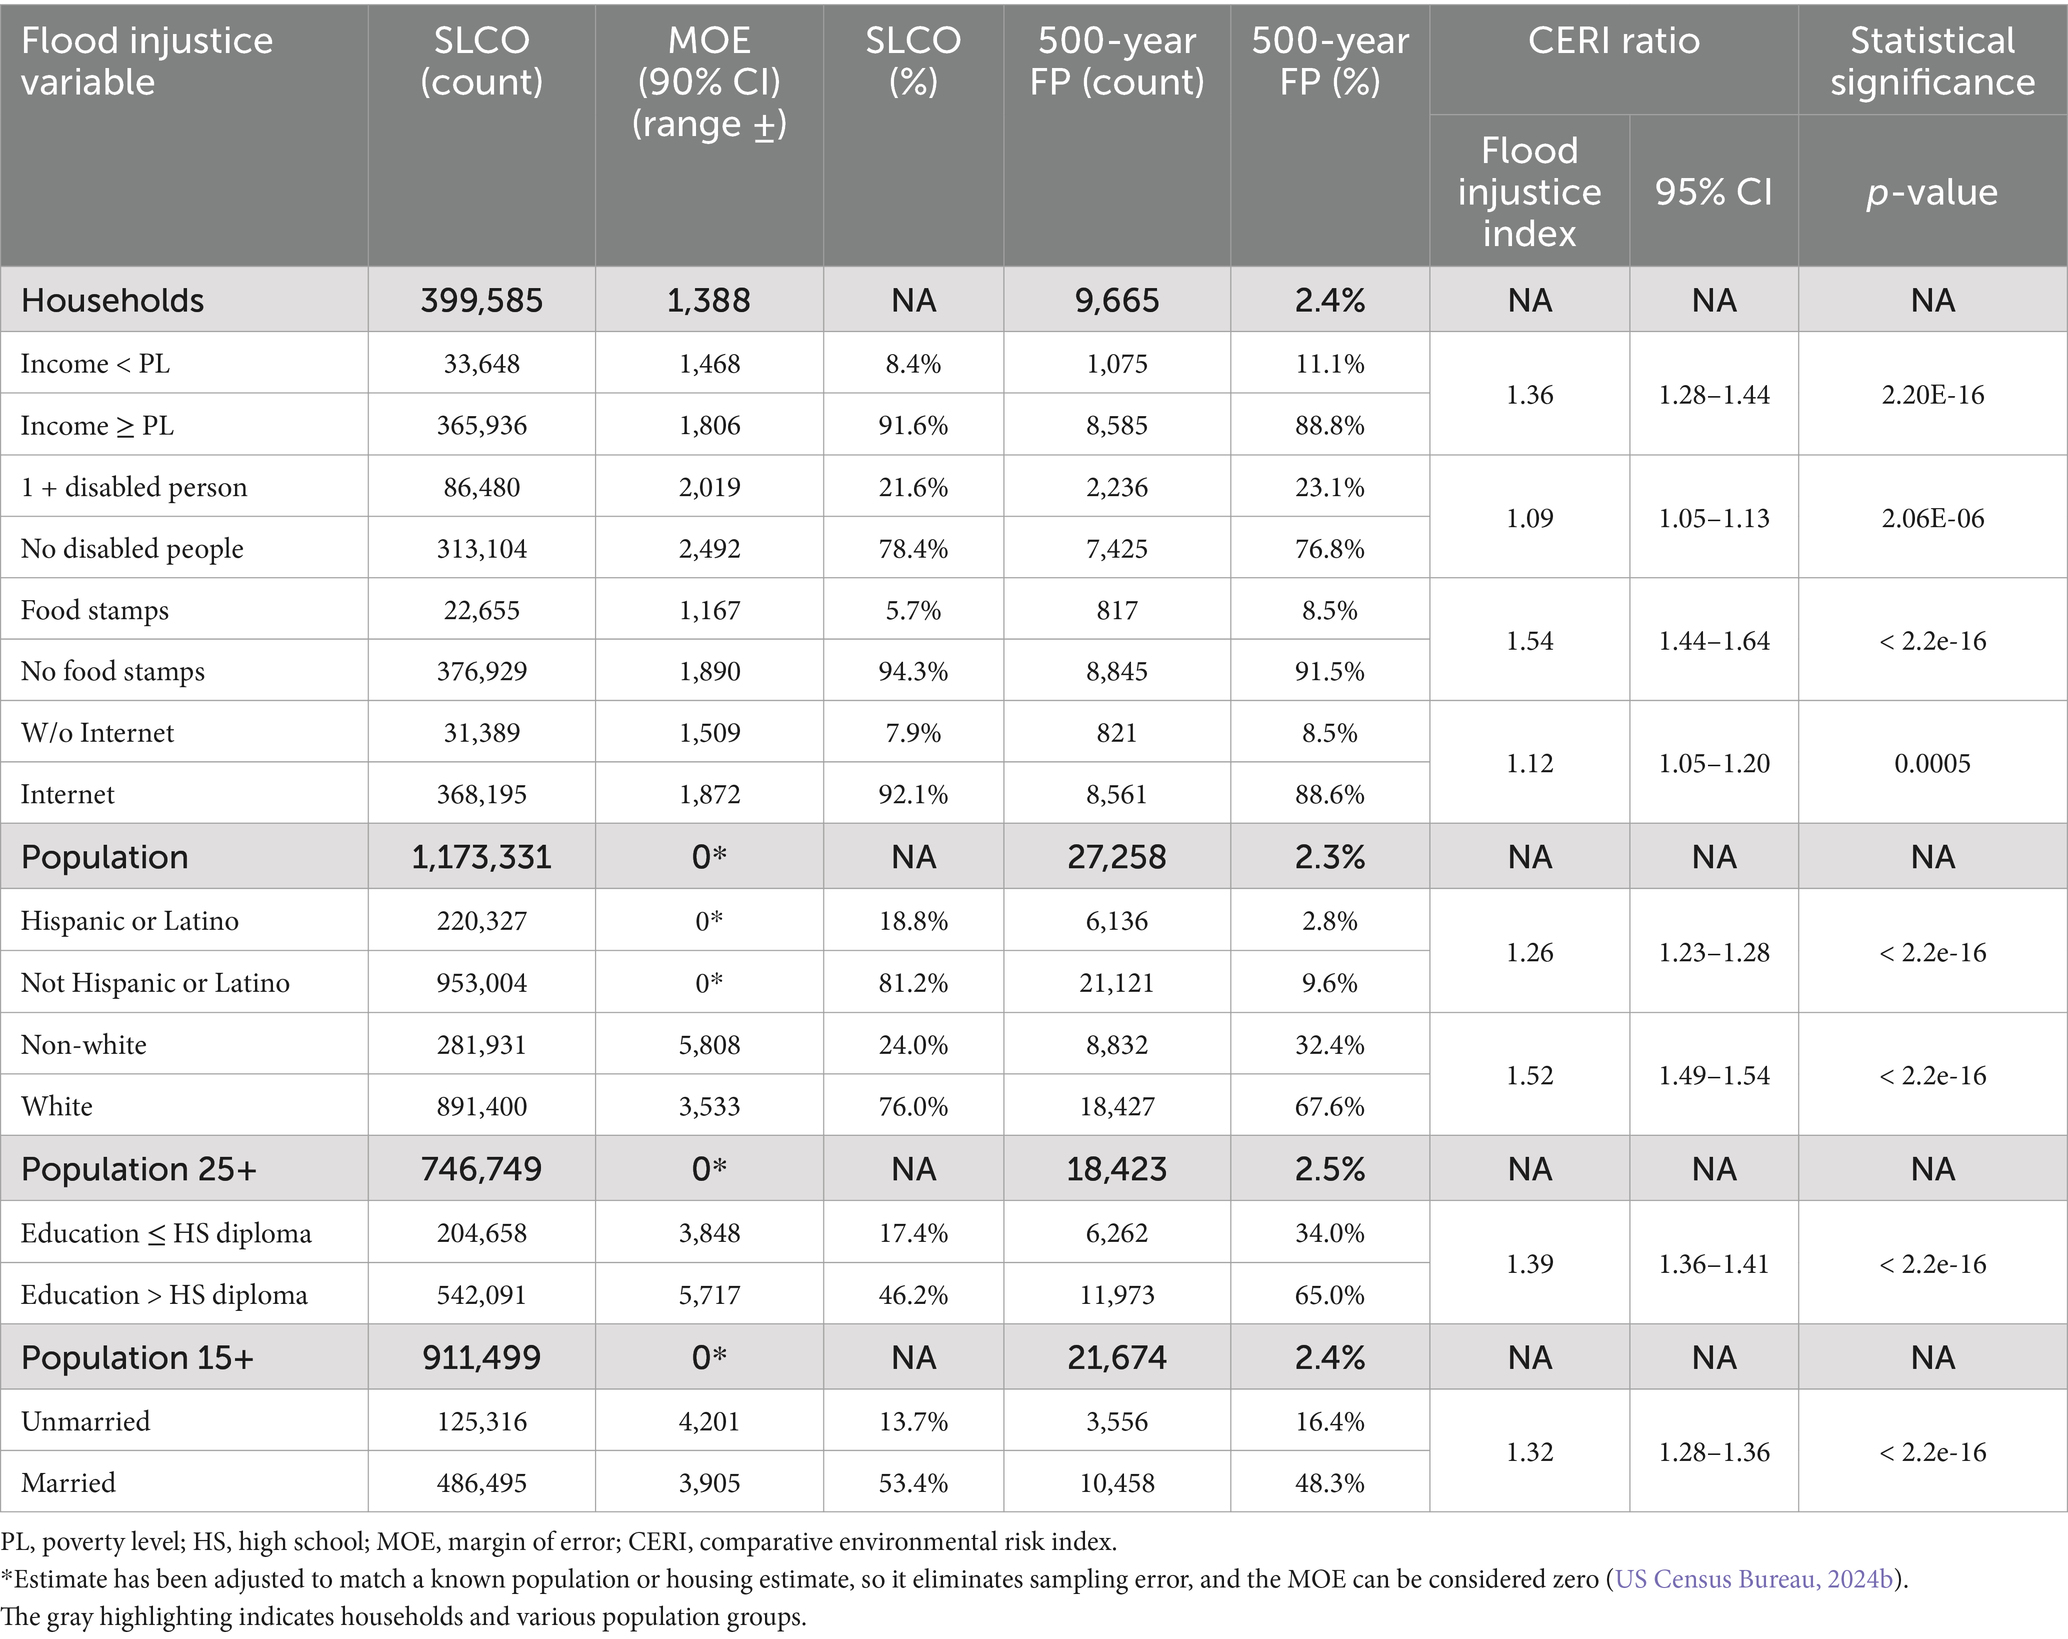
Table 1. Flood injustice indices for select variables in Salt Lake County (SLCO) and SLCO’s 500-year floodplain (FP).
2.8 Flood injustice mapping
In addition to using the Flood Injustice Index to quantify flood injustices, we created flood injustice maps that overlay the socioeconomic and demographic variables of census blocks with 500-year floodplains. These maps are understandable and intuitive, helping both the public and policymakers identify flood injustice communities and facilitating effective flood protection measures and resource allocation for marginalized and underserved communities (Flores et al., 2023). We used the Enrich Tool in ArcGIS Pro to supplement the census blocks within each city with selected household and population variables. We then symbolized the census tracts to display the distribution of flood injustice variables across the city, enabling a visual assessment of the overlap between higher-value census blocks and the extent and boundaries of 500-year floodplains.
3 Results
3.1 Rainfall temporal trend
Annual rainfall in Salt Lake City (represented by the rainfall records at the airport) exhibits non-monotonic characteristics, indicating more hydrologic variability in the latter half of dataset (Figure 3). Precipitation between the 25th and 75th percentiles show a slight decreasing trend in the latter half of the time series, while precipitation below the 25th percentile displays no evident temporal trend. Extreme rainfall events exceeding the 75th percentile, when precipitation is at least 460 mm per year, are increasing. In some cases, intense precipitation events elevate concerns about destructive flooding events and increase the number of people at risk from floods (Swain et al., 2020).
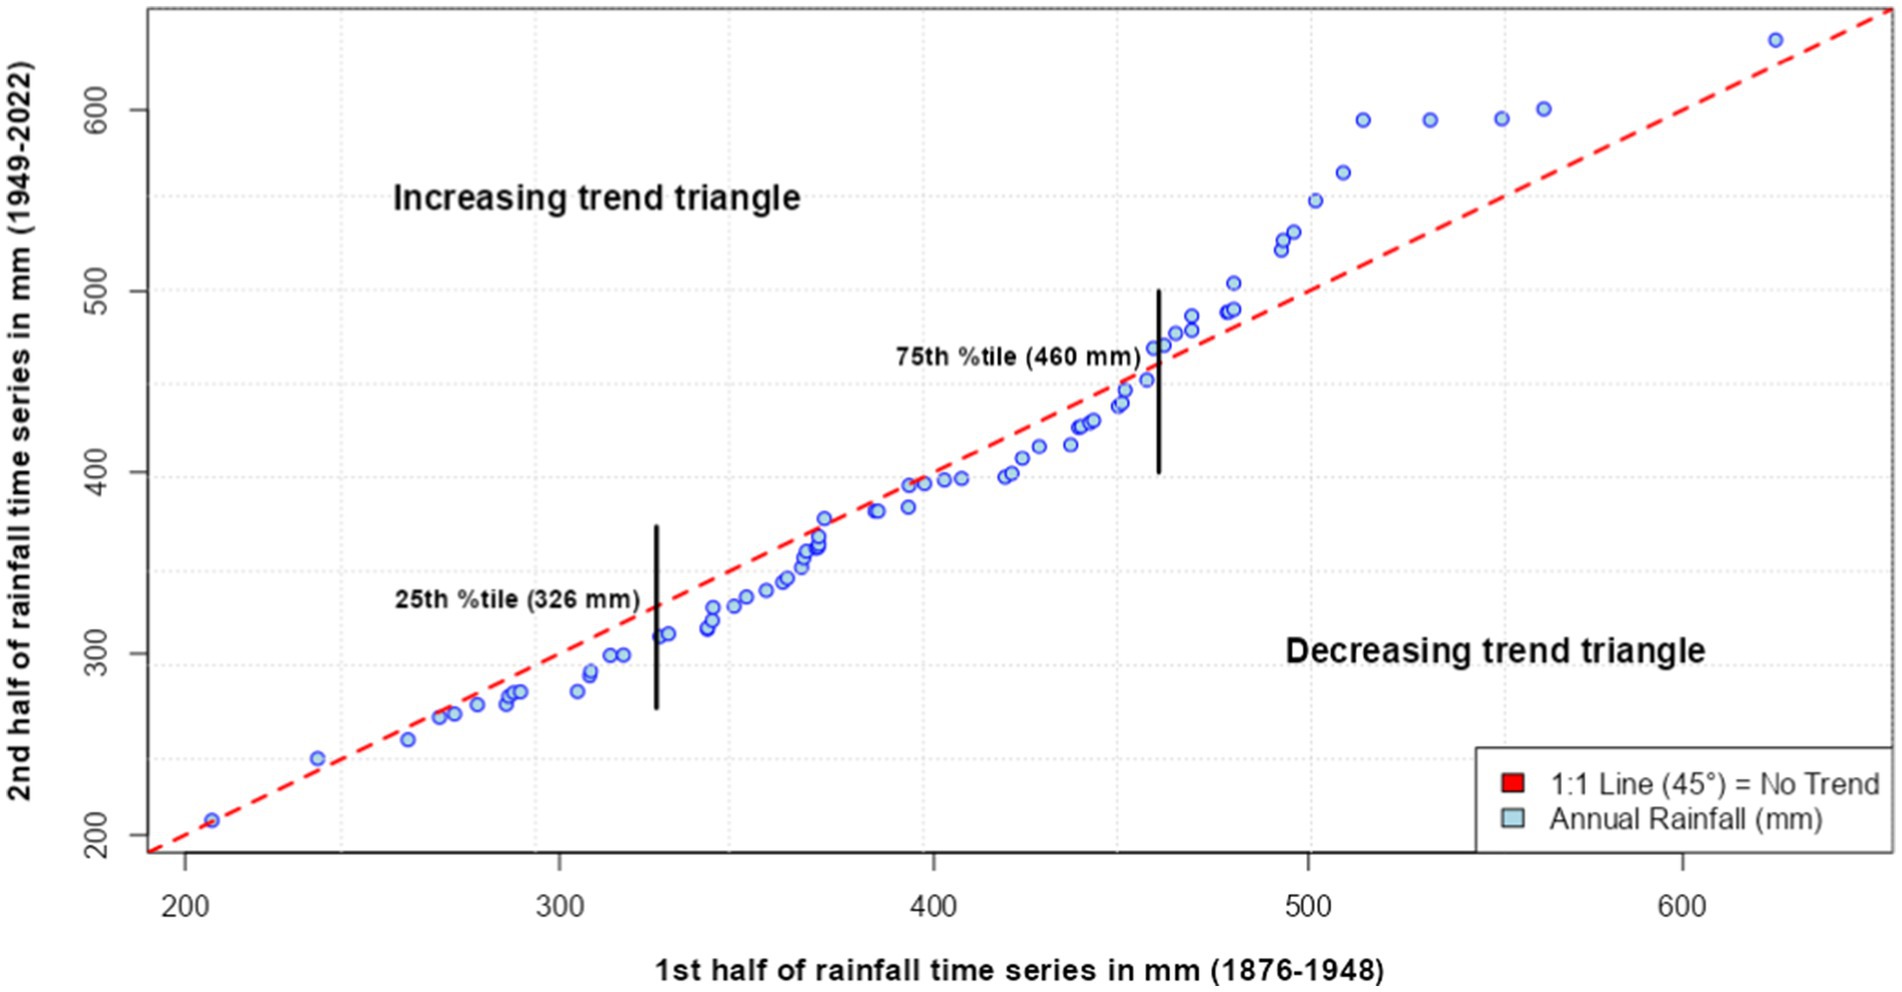
Figure 3. Innovative trend analysis of annual rainfall records at the SLC airport (1876–2022).
3.2 SLCO 500-year floodplains and population
SLCO has 399,585 households and 1,173,331 residents. Of these, 9,665 households (2.4%) and 27,258 individuals (2.3%) live within 500-year floodplains. The 500-year floodplains in the 14 cities in this study cover approximately 24.25 km2 (1.16%) of SLCO’s area (Table 2). South Salt Lake has 44% of its area and 7,000 people, or nearly 28% of its population, in the 500-year floodplain, the largest proportions of all the cities in SLCO. At the other extreme, Salt Lake has only 3% of its population in the 500-year floodplain, but that translates to over 6,000 people living in the floodplain because Salt Lake is so much larger than South Salt Lake (Table 2).
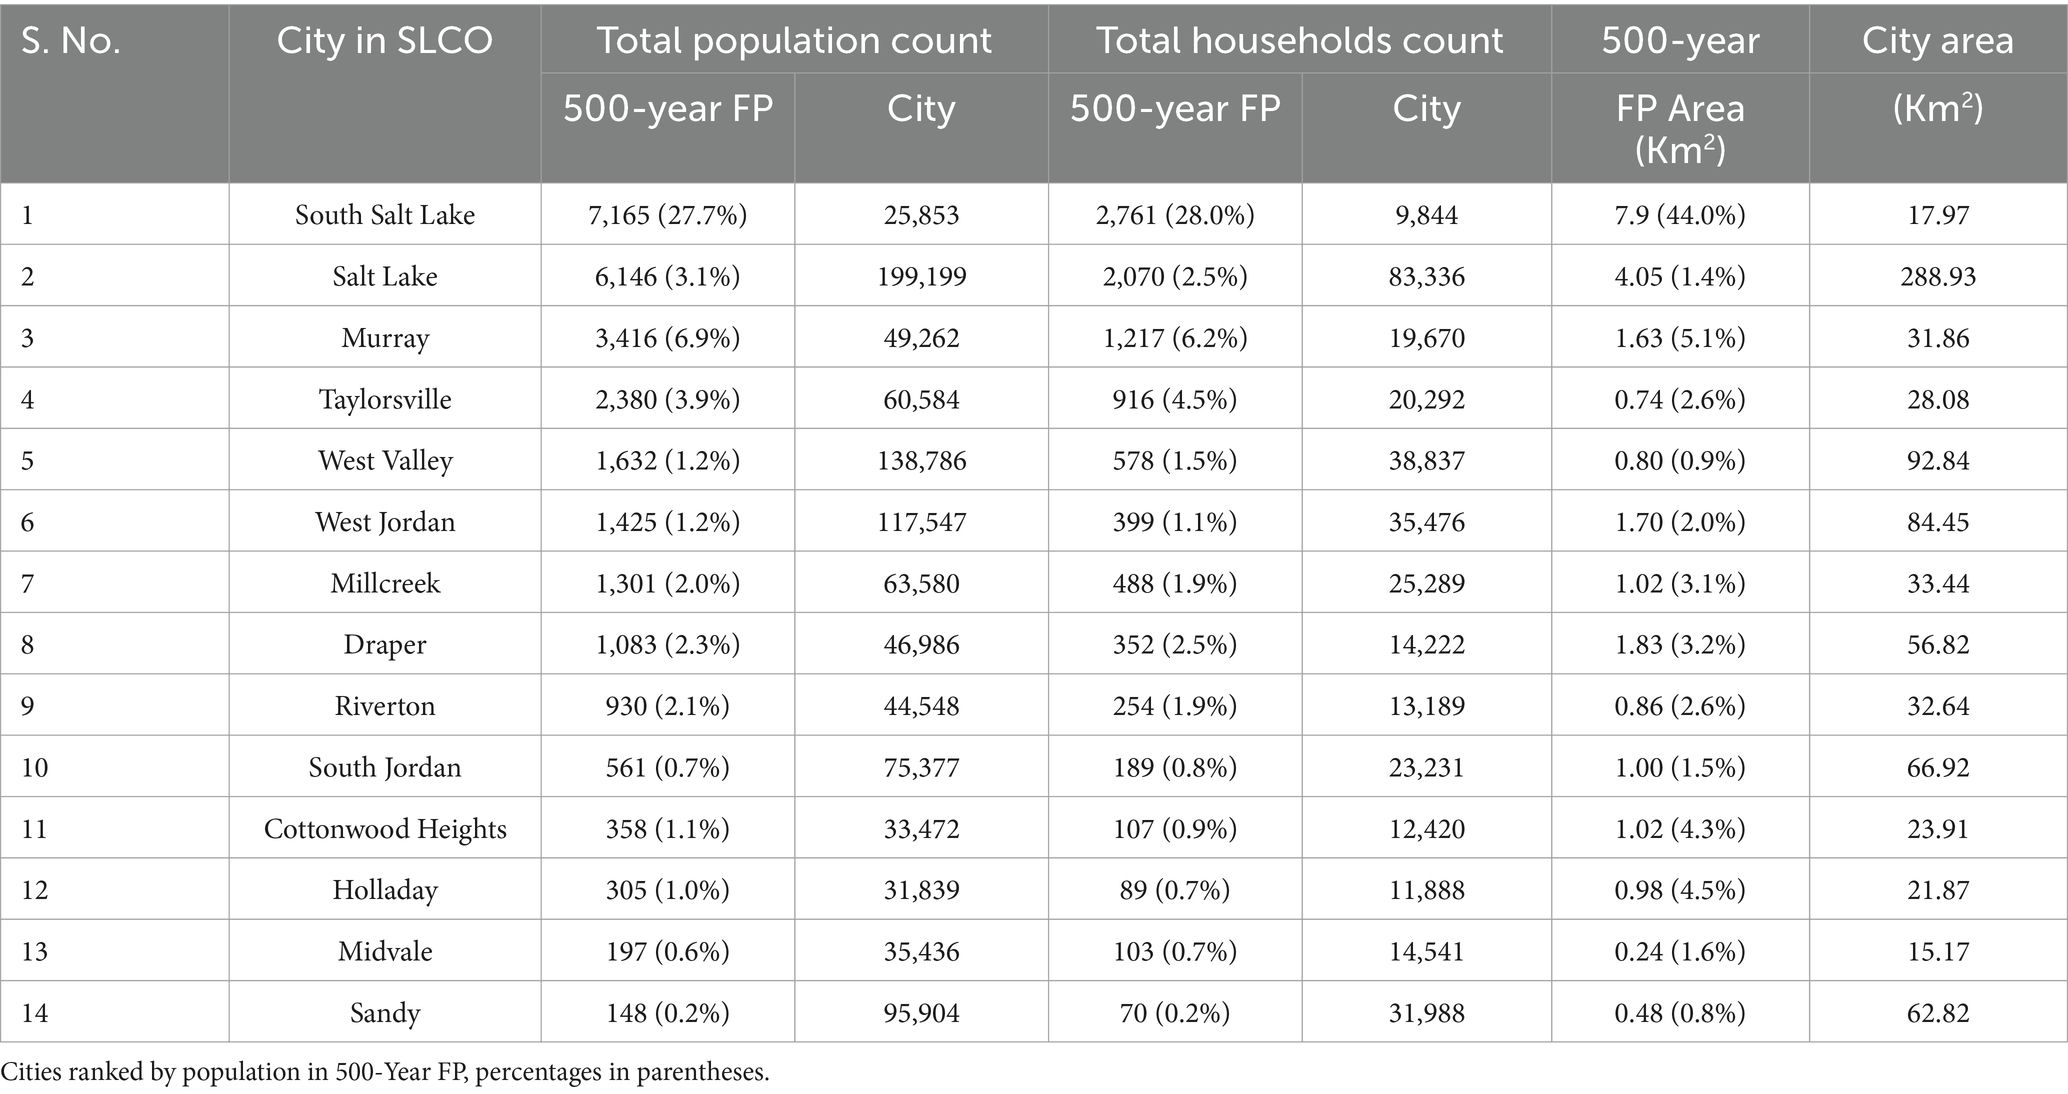
Table 2. Salt Lake County (SLCO) 500-year floodplain (FP) population and total population, 500-Year FP household count and total household count, total area, and 500-year FP area by city.
3.3 Flood injustice in SLCO 500-year floodplains
All eight flood injustice variables are over-represented in 500-year floodplains at the county level, as their CERI Ratios are greater than our threshold of 1.05 (Table 1). County-wide, households receiving food stamps and non-white population are over-represented by more than 50% in the floodplains, with indices of 1.54 and 1.52, respectively (Table 1). Households with incomes below the poverty level, populations with high school diploma or less, and unmarried populations are over-represented by more than 30% in floodplains, with indices of 1.36, 1.39, and 1.32, respectively. The non-white and Hispanic or Latino populations have the highest counts in SLCO’s 500-year floodplains with 8,832 and 6,136 individuals, respectively (Table 1).
Analyzing flood injustice at the city level reveals several notable findings. Eight cities of the 14 included in this study—Millcreek, South Jordan, West Valley, Salt Lake, Riverton, Draper, Holladay, and South Salt Lake—have an average Flood Injustice Index greater than 1.05 (Table 3). Millcreek, with the highest average index, exhibits significant flood-related socioeconomic and demographic disparities, largely due to a high index (7.7) for education level. South Jordan, ranked second, has higher indices than Millcreek for disability, lack of internet access, food stamps, non-white, and unmarried residents, indicating a more diverse and potentially more disadvantaged population in certain respects.
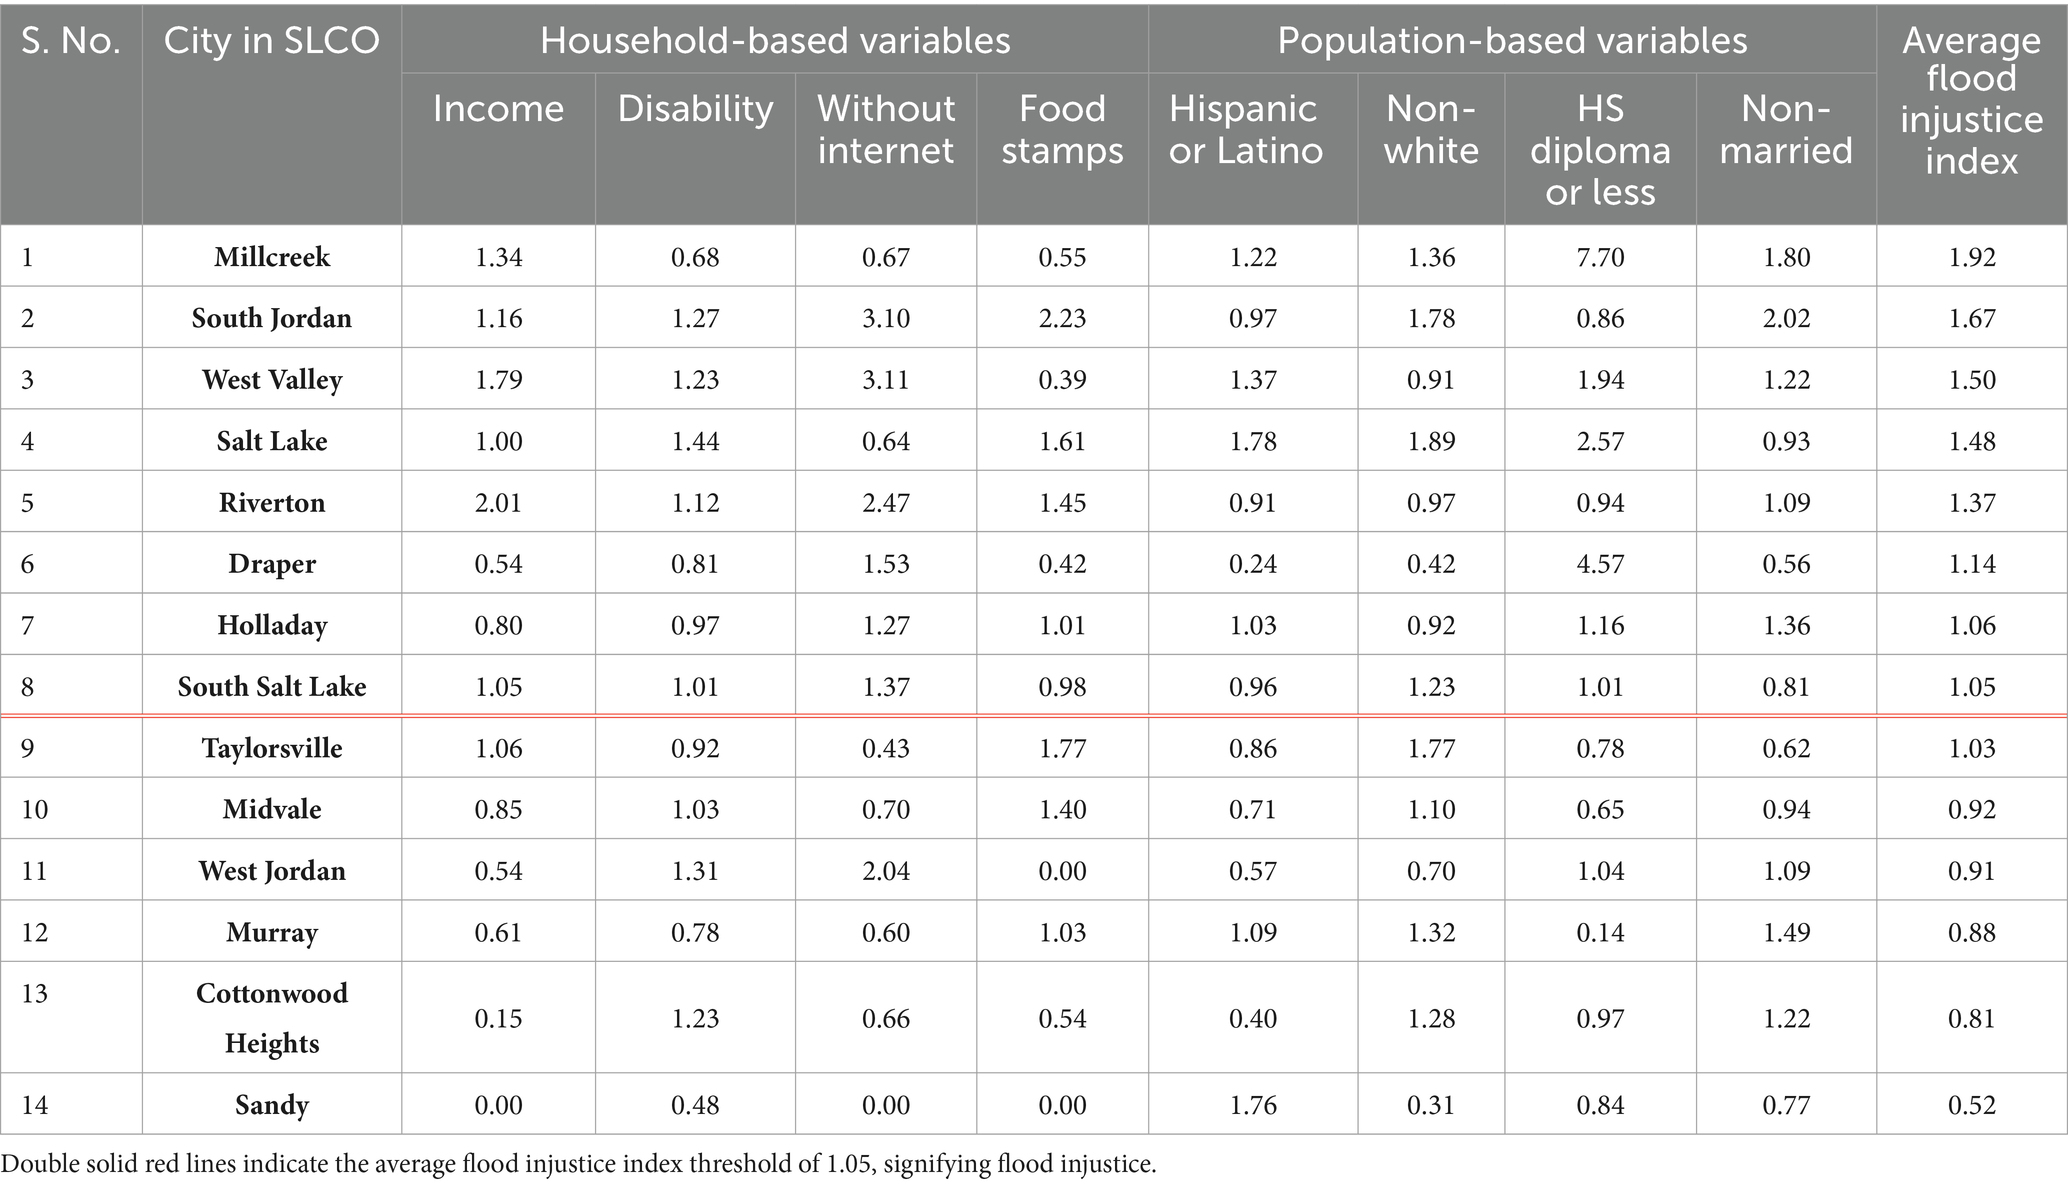
Table 3. Flood injustice indices for the household and population variables for selected cities in SLCO, ranked by averaged descending flood injustice index.
Interestingly, South Salt Lake has the largest population within its 500-year floodplain (Table 1), but ranks eighth for the average flood injustice index, just at the flood injustice threshold of 1.05. The city’s flood injustice relates to lack of internet access which could impede flood preparedness and response (Table 3). In contrast, Salt Lake, with only 3.1% of its population in the 500-year floodplain, exhibits higher flood injustice with an average Flood Injustice Index of 1.48. This is caused by several attributes, including higher incidence of disability, food stamps, Hispanic or Latino populations, non-white populations, and education level in the 500-year floodplain. This indicates broad flood-related socioeconomic disparities in Utah’s state capital. Notably, Salt Lake has the highest flood injustice indices for ethnicity (Hispanic or Latino at 1.78) and race (non-white at 1.89) among all the cities studied (Table 3).
Riverton and West Valley have the highest indices for income below the poverty level, at 2.01 and 1.79, respectively. Draper has the highest index for education, at 4.5, among all the cities in this study (Table 3). Another intriguing finding pertains to Murray, which ranks second in terms of total 500-year floodplain area and has the highest number of households within the floodplain (Table 2). However, households in this city are not over-represented in any of the four flood injustice variables examined, although this city does have a moderate over-representation of non-white (1.32) and unmarried (1.49) individuals living in floodplains (Table 3). Although Sandy ranked lowest in the Average Flood Injustice Index (0.52), with the smallest population count (148) within 500-year floodplains among the cities in this study, its Hispanic or Latino population index (1.76) indicates a moderate over-representation of this minority group in the 500-year floodplain, highlighting flood injustices related to ethnicity (Table 3).
3.4 Flood injustice mapping
To visualize 500-year floodplain injustices, we generated maps for all eight flood injustice variables overlain on the 500-year floodplain for the cities of Millcreek and South Jordan. We selected these cities because they have the highest average Flood Injustice Indices of 1.92 and 1.62, respectively (Table 3). These maps visualize the intersection of flood risk and social vulnerability. The eight maps provide a nuanced view of how different socioeconomic and demographic factors correlate with areas at risk of a 500-year flood.
In Millcreek, multiple dimensions of vulnerability—economic, physical, racial, educational, and social—converge within Millcreek’s 500-year floodplain (Figure 4). Portions of the 500-year floodplain have high incidence of households below the poverty level, households with disabilities, households without internet access, households receiving food stamps, higher Hispanic, Latino, or non-white populations, lower education levels, and more unmarried individuals.
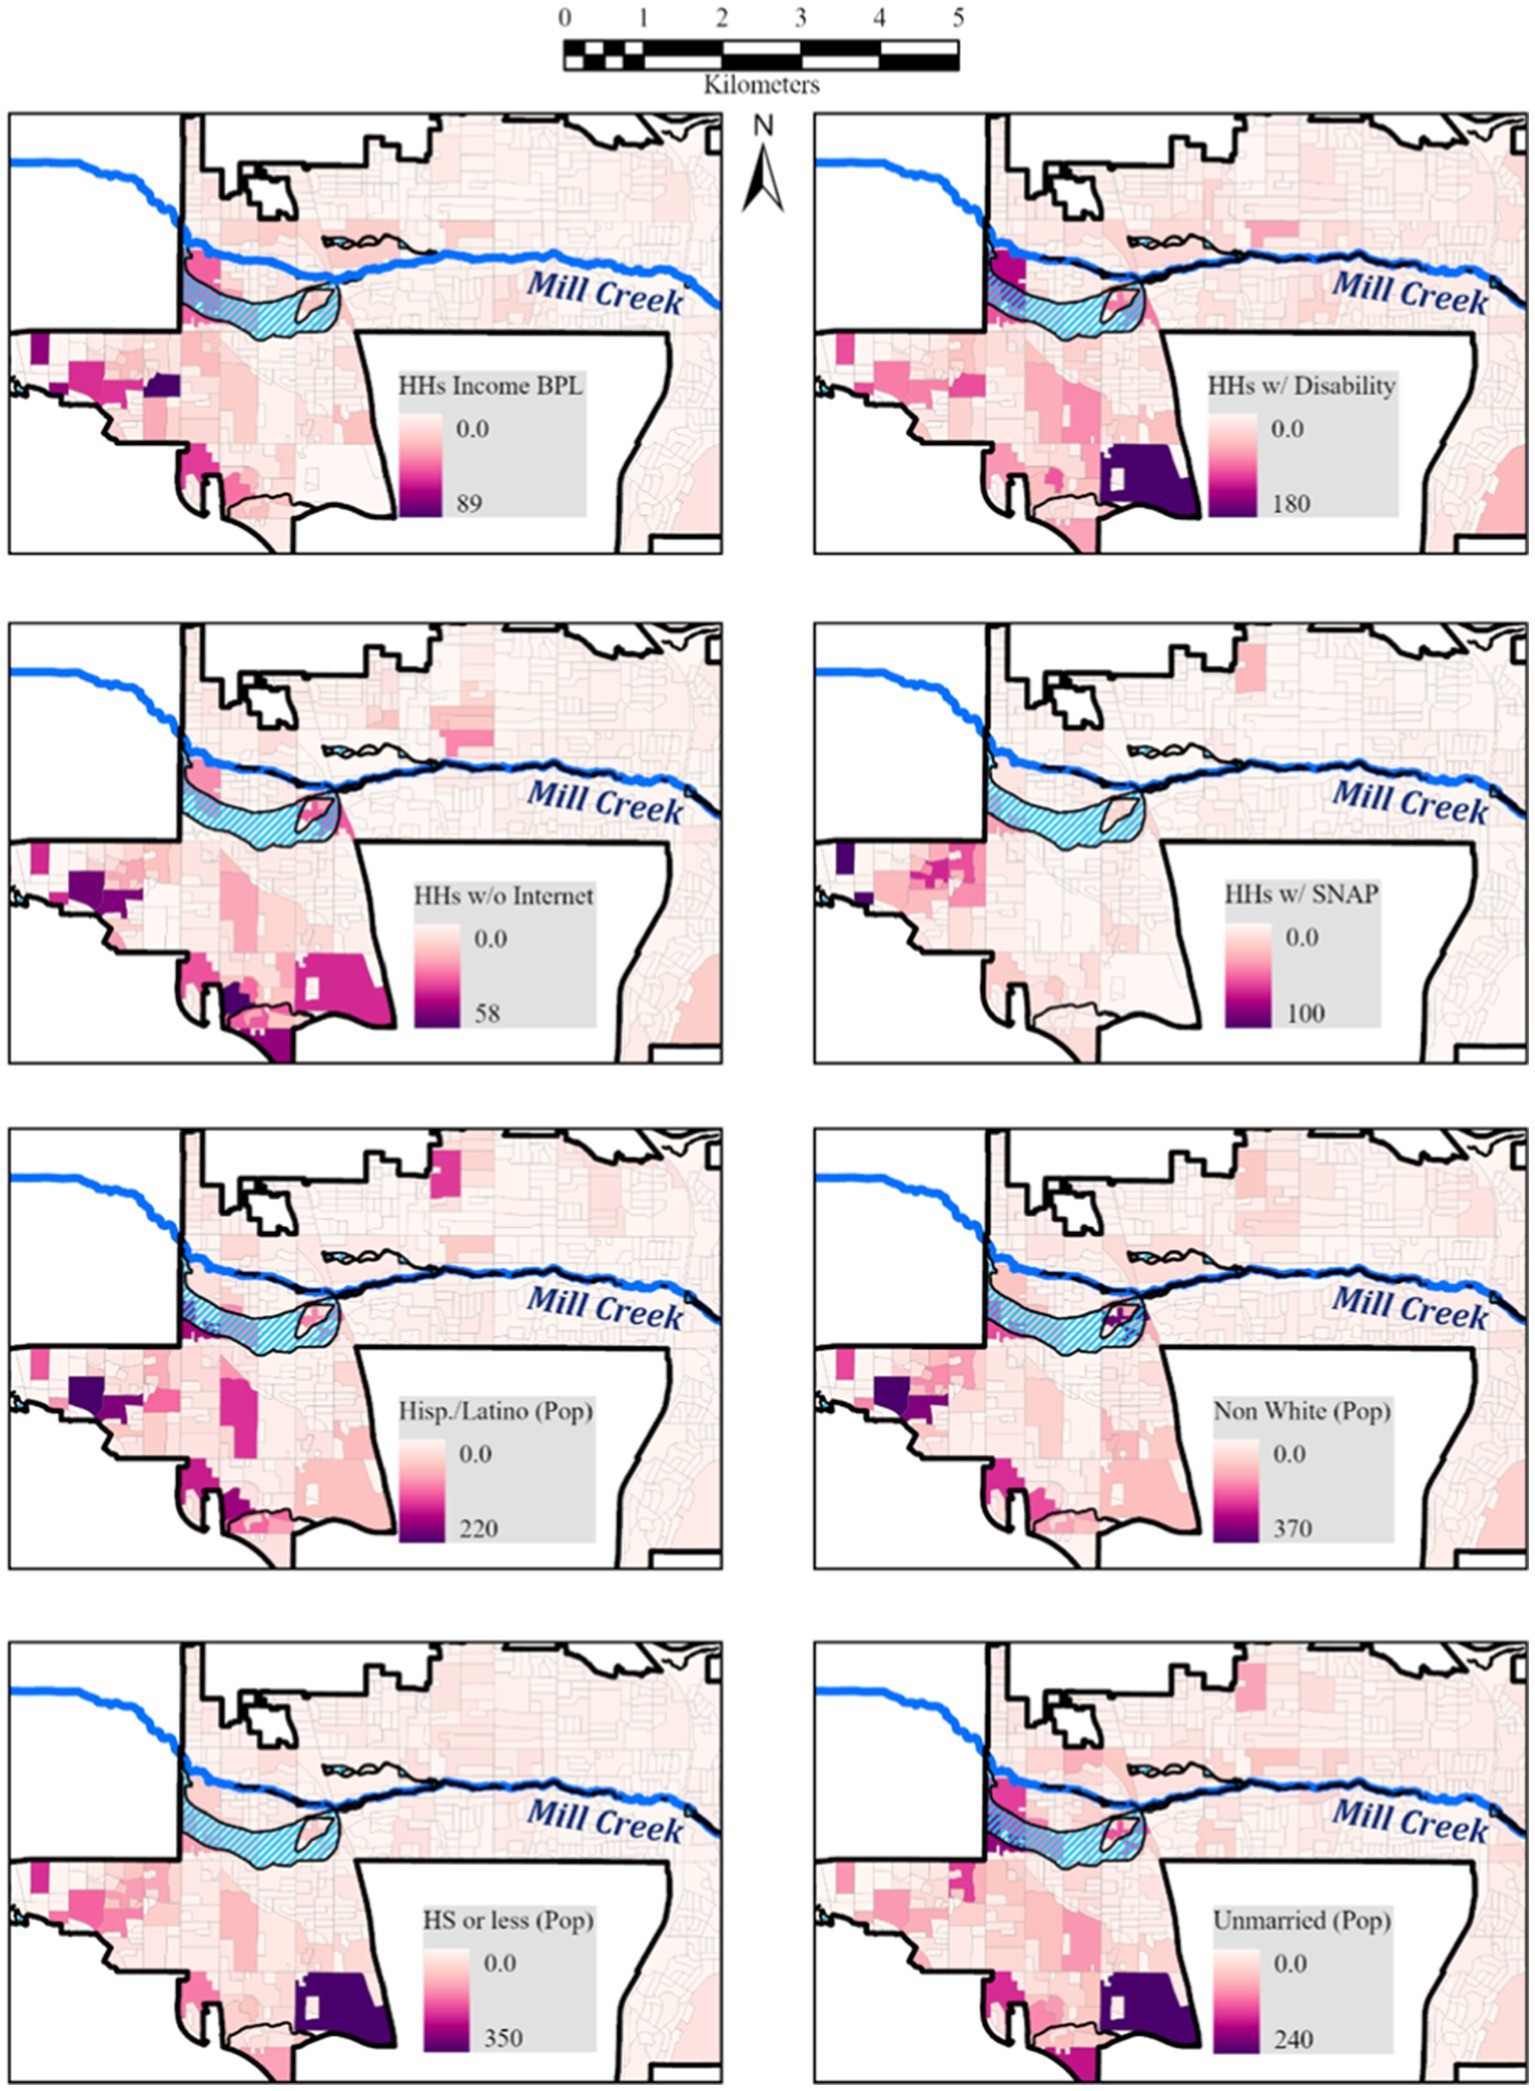
Figure 4. Flood Injustice maps for the 500-year floodplains (blue-shaded) in Millcreek, Utah.
Spatial analysis shows that multiple dimensions of vulnerability—economic, physical, racial, educational, and social—converge within South Jordan’s 500-year floodplains. Households with at least one disabled person, households receiving food stamps, Hispanic or Latino and non-white populations, and individuals with a high school education or less are over-represented in the southwestern-most portion of the 500-year floodplain in South Jordan (Figure 5). The other three flood injustice variables, households with income below the poverty level, without Internet access, and individuals that are unmarried, do not overlap in the southwestern-most 500-year floodplain in South Jordan (Figure 5), but are still over-represented in 500-year floodplains in the city (Table 3).
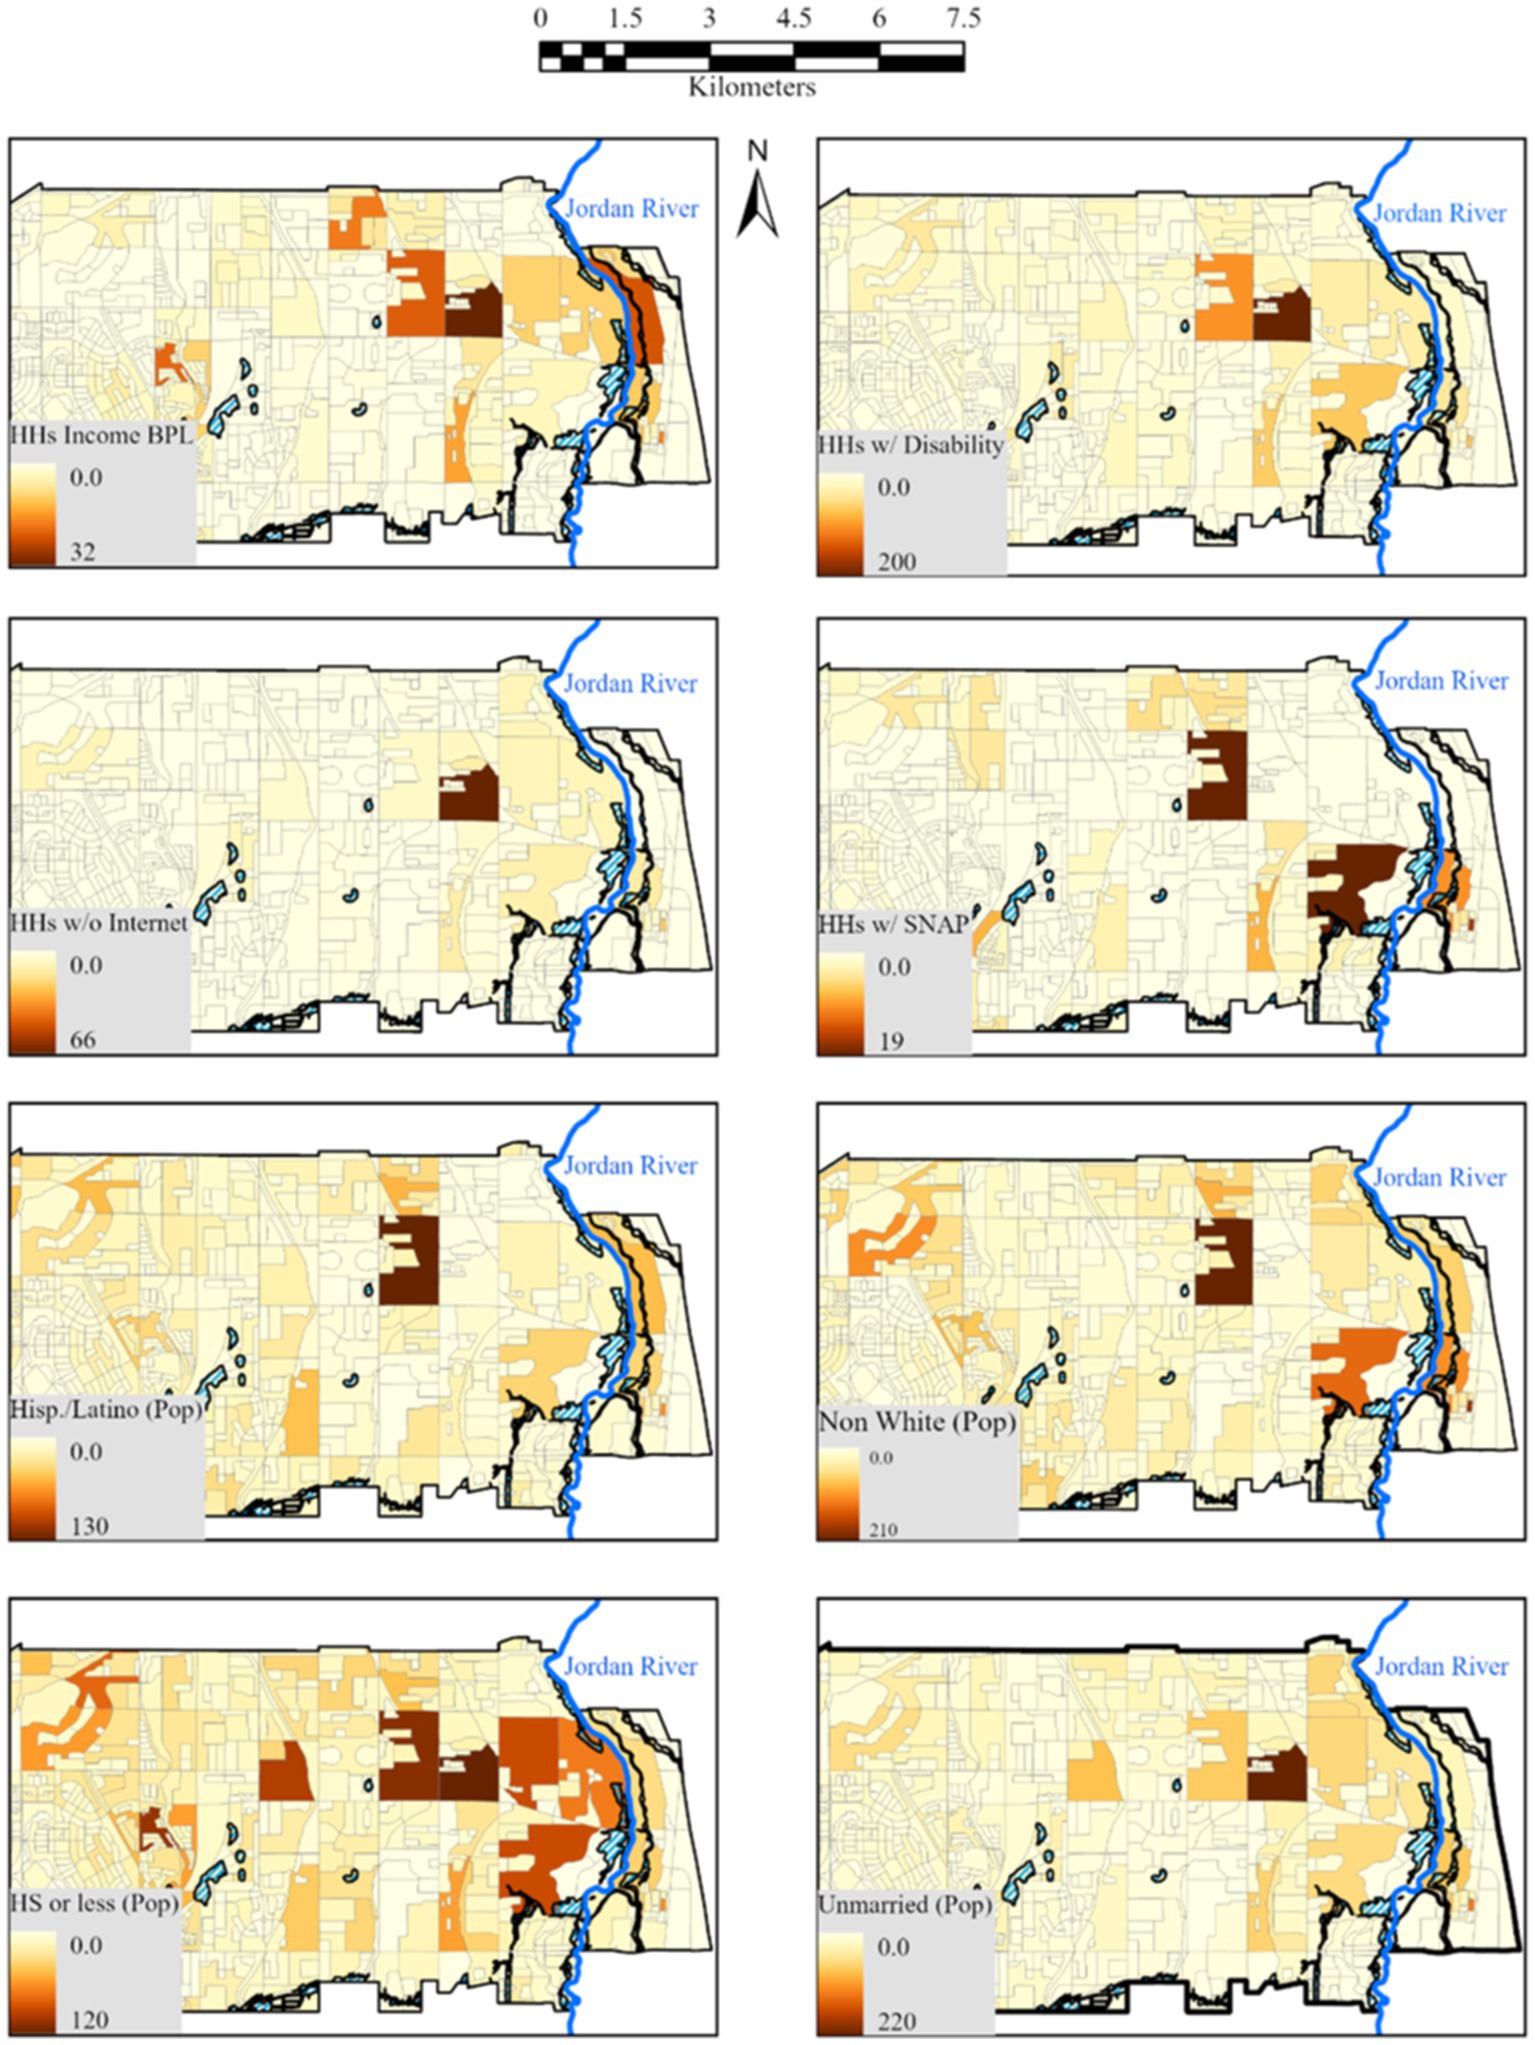
Figure 5. Flood injustice maps for the 500-year floodplains (blue-shaded) in South Jordan, Utah.
4 Discussion
Our study highlights significant socioeconomic and demographic flood injustices within 500-year floodplains across SLCO and its major cities. We also show that hydrologic variability has been increasing through time, particularly extreme precipitation events that lead to flooding (Figure 3). At the county scale, variables such as households receiving food stamps, non-white populations, those with incomes below the poverty level, and individuals with lower education are over-represented in the floodplain areas, with indices indicating over-representation ranging from 30% to over 50% (Table 1).
Cities have varying levels of flood injustice, with Millcreek exhibiting the highest average flood injustice index primarily due to the population with high school education or less living in the 500-year floodplain (Table 3). South Jordan has multiple high indices, including disability and access to resources like internet and food stamps. Some cities, like South Salt Lake, have nearly 30% of its population (7,165 people) living in the floodplain (Table 2), but have little flood injustice by our metrics. In contrast, Salt Lake City has just over 3% of its population living within the 500-year floodplain (6,146 people) and faces significant flood injustice disparities related to ethnicity, race, disability, and education level (Table 3). Sandy, with the lowest overall Flood Injustice Index, nevertheless demonstrates significant ethnic disparities within its small floodplain population. These distinctions emphasize localized challenges in 500-year flood risk management and socioeconomic and demographic equity.
However, we did not find evidence that these inequalities were deliberately caused by discriminatory policies in the study area. In other words, while flood risk is unevenly distributed, we did not attribute this outcome to specific biases such as redlining or other intentional segregation practices within 500-year floodplains. According to the University of Richmond’s Mapping Inequality project, Millcreek and South Jordan cities were not subject to redlining practices established in the U.S. during the 1930s. In the literature, some scholars have used the term ‘disparities’ to describe differences in climatic and flood exposure risks across individuals and communities. However, there are also published studies similar to ours, such as Flores et al. (2021) and Debbage (2019), that have used the term ‘injustice’ to identify, quantify, and map flood-related inequities. For clarity and consistency, we have adopted the term ‘flood injustice’ throughout our study to describe the flood-risk inequalities we observed. We use this language to align with the broader environmental justice framework, which asserts that any clear inequality in vulnerability, especially those based on race or socioeconomic factors, should be addressed as a justice issue. This consistent terminology avoids confusion and redundancy.
Our findings align with other EJ research in SLCO, which predominantly examine disparities related to air pollution and dust exposure from ambient fine particulate matter (PM2.5) due to the decline of Great Salt Lake. These studies report significant disparities in exposure levels among demographic groups based on race or ethnicity (including Hispanic and Pacific Islander populations), income levels, and educational attainment (Mullen et al., 2024; Grineski et al., 2024). Future research that intersects multiple EJ risks or exposures for this region is warranted.
4.1 Limitations and complexity in flood injustice assessment
Like any survey data, the ACS provides estimates of socioeconomic and demographic characteristics rather than complete population and household counts. Uncertainties in ACS datasets arise from sampling error, non-response bias, measurement error, and changes in survey methodology (Spielman et al., 2014; Wei et al., 2023). Despite these challenges, the ACS remains valuable for understanding US demographic and socio-economic trends. However, researchers and policymakers should exercise caution when interpreting and using ACS data in flood injustice studies, for example by focusing on areas with relatively low data uncertainties such as counties with low MOEs (Xu and Qiang, 2024).
Dasymetric mapping is an approach to more accurately apportion census data within floodplains (Mennis, 2003; Flores et al., 2023). Dasymetric mapping identifies uninhabitable areas (e.g., roads, railroads) by incorporating land cover and land use data, thereby preventing the erroneous allocation of population data to such areas (Baynes et al., 2022). We did not use the technique to maintain a straightforward and easily-repeatable approach and because variations in dasymetric mapping methodologies can substantially alter both the estimated population size and the socioeconomic characteristics within designated flood zones (Debbage, 2019). It remains a promising technique to better align and apportion disparate datasets for more sophisticated analytical approaches.
Delineating 100-year and 500-year floodplains are challenging because of uncertain topographic data, design flow, streamflow records, hydrological and hydraulic modeling estimates, and infrequent updates to adapt to rapid changes in climate and land use (Merwade et al., 2008; Qiang et al., 2017). The intersection of flood risk and flood injustice indices underscore the complex and multifaceted nature of capturing and comprehending flood injustices, necessitating a combination of quantification, mapping, and local surveying. Relying on any single method to determine the existence and magnitude of flood injustices could oversimplify the issue, potentially resulting in either overestimation or underestimation of flood risk and communities involved.
FEMA’s flood maps (including 500-year floodplains) have errors and uncertainties that can undermine accuracy and effectiveness (Huang and Merwade, 2023). A primary limitation stems from FEMA’s reliance on historical data, which fails to account for the increasing frequency and intensity of extreme weather events due to climate change (Flores et al., 2023). FEMA flood maps can also underestimate the spatial extent of the 100-year and 500-year floodplain, primarily due to the systematic exclusion of pluvial flood risk (Weill, 2022; Wing et al., 2022). This leads to an underestimation of flood hazards, potentially leaving communities unprepared. The uncertainties associated with FEMA floodplain delineations may result in underestimation of both the severity and spatial extent of flood injustices within our area.
4.2 Flood injustice variables and importance
Households with income below the poverty level and households receiving food stamps highlight compounded vulnerabilities where economic hardship intersects with flood risks, and households likely have limited resources to prepare for or recover from flood events. Households without internet access indicate groups who might not receive timely emergency notifications and access online services during floods, exacerbating their vulnerability. Households with at least one disabled person face heightened flood risks, with challenges in both evacuation and recovery due to potential mobility and health constraints.
Hispanic or Latino and non-white populations raise critical environmental justice issues as racial and ethnic minorities are disproportionately exposed to the 500-year flood risks, potentially exacerbating social and economic inequalities during flood events. Areas with high percentages of individuals with a high school education or less might lack knowledge or resources to effectively respond to and recover from flood events. Finally, areas with higher percentages of unmarried individuals could increase vulnerability due to a lack of social support systems necessary for effective response and recovery during flood events.
These variables underscore the urgent need for targeted, multifaceted interventions to mitigate flood risks and enhance resilience among the most vulnerable populations. Policies should focus on inclusive emergency planning, resilient infrastructure, and community-based initiatives to ensure equitable protection and recovery for residents.
There is a federal EPA tool called EJScreen Tool that assesses and identifies EJ communities nationwide. For this study, we opted not to use the EPA EJScreen tool because our spatial scale is the city and county level, whereas EPA EJScreen is a national level screening tool, making its socioeconomic indicators broad and potentially inapplicable to finer scales like cities and counties. Also, as a federally administered tool, the EPA EJScreen is susceptible to administration shifts and policy changes, which may result in discontinuation or archival. For example, the White House rescinded Federal Actions to Address Environmental Justice in Minority Populations and Low-Income Populations (Executive Order 12898) in January 2025 (The White House, 2025). This effectively freezes or archives many federal websites, tools, and datasets, including EJScreen. Such political uncertainties raise concerns about the long-term reliability and accessibility of the EPA EJScreen tool.
4.3 Disintegrated approaches in flood injustice studies
We calculate separate flood injustice indices for each variable and city, providing a detailed and understandable approach for both the public and policymakers. Our straightforward approach to quantifying flood injustice aligns with recent research suggesting composite-based methods of estimating flood injustice may be misleading. Composite assessments integrate numerous social vulnerability variables into a single index using sophisticated statistical methods like Principal Component Analysis (Cutter, 2024). The Social Vulnerability Index (SoVI), widely used in EJ studies, is sensitive to subjective interpretation of components, statistical weighting of components, and criteria for component selection, all of which can increase uncertainty and cloud result interpretability (Bakkensen et al., 2017; Rufat et al., 2019; Tate et al., 2021; Cutter, 2024).
Combining EJ variables into single vulnerability index could result in imprecise, oversimplified, or misleading assessments of flood injustice, thereby reducing the effectiveness of mitigation efforts. However, by employing a simple, direct, and non-composite approach to measure flood injustice, specifically the Flood Injustice Index, which averages all variables equally, flood injustice can be clearly conveyed and characterized, and each EJ variable can be evaluated separately to quantify their specific influence on flood injustice. The methods developed in this study could be used in any region and at different spatial scales (county, city, census block, etc.) to quantify and map the presence and severity of flood injustices and link them to socioeconomic and demographic variables.
4.4 Emerging significance of the 500-year floodplain for delineating current and future flood risk
The Association of State Floodplain Managers have suggested using the 500-year floodplain boundary to limit development although this has been met with resistance (Bourget and Bailey, 2004). In July 2024, as part of its ongoing response to escalating national flood risks, FEMA published a new directive and policy called the Federal Flood Risk Management Standard (FFRMS) to encourage federal agencies to consider and manage current and future flood risks, promoting a more resilient nation (Federal Emergency Management Agency (FEMA), 2024). It requires agencies to determine flood elevation and corresponding flood hazard area for project siting, design, and construction. Agencies can use one of three approaches to assess current and future flood risks: 1) Climate Informed Science, which uses the best available hydrologic and hydraulic data, factoring in the future changes in flooding based on climate science; 2) Freeboard Value Approach, which adds 2 feet to the base flood elevation for non-critical actions and 3 feet for critical actions; and 3) using the 500-year floodplain to delineate flood risk. For the regions and communities that the boundaries are established, the 500-year floodplain approach is the most effective approach that does not require extensive modeling or geospatial analysis like the other two approaches. The FFRMS highlights the critical importance of the 500-year floodplain in assessing current and future flood risks.
4.5 Uncertainties in FEMA’s flood zones
Errors and uncertainties in FEMA floodplain delineations have direct socioeconomic implications, as inaccurate flood maps influence community planning, property values, and insurance rates, sometimes disproportionately affecting marginalized communities (Scata, 2020; Wing et al., 2022). For example, FEMA estimates that 13 million U.S. residents live in 100-year flood zones, while the First Street Foundation a non-profit organization, whose mission is to quantify and communicate America’s climate risks, estimates 41 million (Wing et al., 2018). The binary depiction of floodplain boundaries, defined by either the 100-year or 500-year flood lines, oversimplifies risk assessments. Continuous flood probability maps, rather than rigid boundaries, provide a more accurate representation of flood risks (Merwade et al., 2008). Enhancing flood risk communication through interactive and probabilistic flood maps could improve public understanding and preparedness (Sanders et al., 2020). Improving FEMA floodplain delineation and probability requires a comprehensive approach that integrates updated climate projections, probabilistic mapping techniques, advanced modeling techniques, and policy reforms to ensure that flood risk assessments accurately reflect current and future threats.
Despite the inherent uncertainties in FEMA’s flood maps, the dataset is publicly and freely available for individuals and governmental agencies, making it a practical resource for analysis and decision-making. It remains one of the most commonly used tools for identifying and mapping flood-prone areas. Many cities and regulatory jurisdictions rely on FEMA-designated flood zones as the basis for flood risk assessment, regulatory compliance, and urban planning. For example, Salt Lake City ordinances require that developments incorporate the 100-year floodplain into planning and risk mitigation strategies (SLC Ordinance 18.68.030). Given the continued institutional reliance on FEMA flood zones, use of the 500-year floodplain aligns with existing regulatory frameworks, proving simplified and quick flood injustice assessment.
4.6 Flood risk management and adaptation for vulnerable communities
There are several initiatives that highlight the importance of incorporating flood justice into 500-year floodplains. An example is the Justice40 Initiative, which directs 40% of the benefits from certain federal investments—including affordable housing—to disadvantaged and EJ communities (The White House, 2021), although its website has been archived as of January 2025. That initiative was used by communities to access federal funds to improve flood justice in their 500-year floodplains, provided that the data is quantified, mapped, and presented scientifically and without bias. Our quantitative approach and mapping methodology, based on federally provided datasets, aims to offer agencies an easy-to-apply, actionable framework that meets both the FFRMS and the Justice40 Initiative requirements simultaneously.
This research enables the assessment of options and development of solutions to reduce flood injustices. Our framework, results, and findings can help officials and policymakers engage with residents, highlighting specific 500-year flood risks shaped by distinct socioeconomic and demographic characteristics. As cities may lack the necessary resources, a collaborative regional approach is essential to prevent injustices in managing flood risk and to achieve equitable flood justice.
Data availability statement
Publicly available datasets were analyzed in this study. This data can be found here: https://www.hydroshare.org/resource/43d39b74f7194676ae5220d4fab1842a/.
Author contributions
AF: Conceptualization, Data curation, Formal analysis, Software, Visualization, Writing – original draft, Writing – review & editing. SN: Conceptualization, Supervision, Writing – review & editing.
Funding
The author(s) declare that no financial support was received for the research and/or publication of this article.
Conflict of interest
The authors declare that the research was conducted in the absence of any commercial or financial relationships that could be construed as a potential conflict of interest.
The author(s) declared that they were an editorial board member of Frontiers, at the time of submission. This had no impact on the peer review process and the final decision.
Publisher’s note
All claims expressed in this article are solely those of the authors and do not necessarily represent those of their affiliated organizations, or those of the publisher, the editors and the reviewers. Any product that may be evaluated in this article, or claim that may be made by its manufacturer, is not guaranteed or endorsed by the publisher.
References
Aerts, J. C. J. H., Botzen, W. J., Clarke, K. C., Cutter, S. L., Hall, J. W., Merz, B., et al. (2018). Integrating human behaviour dynamics into flood disaster risk assessment. Nat. Clim. Chang. 8, 193–199. doi: 10.1038/s41558-018-0085-1
Al Assi, A., Mostafiz, R. B., Friedland, C. J., Rahim, M. A., and Rohli, R. V. (2023). Flood risk assessment for residences at the neighborhood scale by owner/occupant type and first-floor height. Front. Big Data 5:997447. doi: 10.3389/fdata.2022.997447
Arnell, N. W., and Gosling, S. N. (2016). The impacts of climate change on river flood risk at the global scale. Clim. Chang. 134, 387–401. doi: 10.1007/s10584-014-1084-5
Bailie, J., Matthews, V., Bailie, R., Villeneuve, M., and Longman, J. (2022). Exposure to risk and experiences of river flooding for people with disability and carers in rural Australia: a cross-sectional survey. BMJ Open 12:e056210. doi: 10.1136/bmjopen-2021-056210
Bakkensen, L. A., Fox-Lent, C., Read, L. K., and Linkov, I. (2017). Validating resilience and vulnerability indices in the context of natural disasters. Risk Anal. 37, 982–1004. doi: 10.1111/risa.12677
Baynes, J., Neale, A., and Hultgren, T. (2022). Improving intelligent dasymetric mapping population density estimates at 30 m resolution for the conterminous United States by excluding uninhabited areas. Earth Syst. Sci. Data 14, 2833–2849. doi: 10.5194/essd-14-2833-2022
Blaikie, P., Cannon, T., Davis, I., and Wisner, B. (2004). At risk: natural hazards, People’s vulnerability and disasters. 2nd Edn. London: Routledge.
Blessing, R., Sebastian, A., and Brody, S. D. (2017). Flood risk delineation in the United States: how much loss are we capturing? Nat. Hazar. Rev. 18:04017002. doi: 10.1061/(ASCE)NH.1527-6996.0000242
Bourget, L., and Bailey, T. (2004). Reducing flood losses: is the 1% chance (100-year) flood standard sufficient? Available online at: https://www.asfpmfoundation.org/ace-images/forum/2004_Forum_BackgroundPapers.pdf?pagename=forum/2004_forum_backgroundpapers.pdf#page=46 (Accessed April 20, 2025).
Bowen Collins & Associates. (2019). Jordan River Hydraulic Study: Volume I - Report. Salt Lake County Flood Control. Available at: https://www.saltlakecounty.gov/globalassets/1-site-files/flood-control/studies/jordan-river-hydraulics/volume-i---report.pdf (Accessed April 20, 2025).
Brody, S., Blessing, R., Sebastian, A., and Bedient, P. (2014). Examining the impact of land use/land cover characteristics on flood losses. J. Environ. Plan. Manag. 57, 1252–1265. doi: 10.1080/09640568.2013.802228
Carothers, T. L. (2018). Justice and the River: Community Connections to an Impaired Urban River in Salt Lake City. Doctoral dissertation, Utah State University. Available at: https://doi.org/10.26076/2258-66e4
Chakraborty, J., Collins, T. W., Montgomery, M. C., and Grineski, S. E. (2014). Social and spatial inequities in exposure to flood risk in Miami, Florida. Nat. Hazar. Rev. 15:04014006. doi: 10.1061/(ASCE)NH.1527-6996.0000140
Chang, H., Pallathadka, A., Sauer, J., Grimm, N. B., Zimmerman, R., Cheng, C., et al. (2021). Assessment of urban flood vulnerability using the social-ecological-technological systems framework in six US cities. Sustain. Cities Soc. 68:102786. doi: 10.1016/j.scs.2021.102786
Clay, L. A., Goetschius, J. B., Papas, M. A., Trainor, J., Martins, N., and Kendra, J. M. (2020). Does preparedness matter? The influence of household preparedness on disaster outcomes during superstorm sandy. Disaster Med. Public Health Prep. 14, 71–79. doi: 10.1017/dmp.2019.78
Collins, T. W., Grineski, S. E., and Chakraborty, J. (2018). Environmental injustice and flood risk: a conceptual model and case comparison of metropolitan Miami and Houston, USA. Reg. Environ. Chang. 18, 311–323. doi: 10.1007/s10113-017-1121-9
Collins, T. W., Jimenez, A. M., and Grineski, S. E. (2013). Hispanic health disparities after a flood disaster: results of a population-based survey of individuals experiencing home site damage in El Paso (Texas, USA). J. Immigr. Minor. Health 15, 415–426. doi: 10.1007/s10903-012-9626-2
Cutter, S. L. (2024). The origin and diffusion of the social vulnerability index (SoVI). Int. J. Disaster Risk Reduct. 109:104576. doi: 10.1016/j.ijdrr.2024.104576
Cutter, S. L., Boruff, B. J., and Shirley, W. L. (2003). Social vulnerability to environmental hazards*. Soc. Sci. Q. 84, 242–261. doi: 10.1111/1540-6237.8402002
Cutter, S. L., Emrich, C. T., Gall, M., and Reeves, R. (2018). Flash flood risk and the paradox of urban development. Nat. Hazar. Rev. 19:05017005. doi: 10.1061/(ASCE)NH.1527-6996.0000268
Debbage, N. (2019). Multiscalar spatial analysis of urban flood risk and environmental justice in the Charlanta megaregion, USA. Anthropocene 28:100226. doi: 10.1016/j.ancene.2019.100226
Donat, M. G., Lowry, A. L., Alexander, L. V., O’Gorman, P. A., and Maher, N. (2016). More extreme precipitation in the world’s dry and wet regions. Nat. Clim. Chang. 6, 508–513. doi: 10.1038/nclimate2941
Doocy, S., Daniels, A., Murray, S., and Kirsch, T. D. (2013). The human impact of floods: a historical review of events 1980-2009 and systematic literature review. PLoS Curr. 5:e8171a. doi: 10.1371/currents.dis.f4deb457904936b07c09daa98ee8171a
Elliott, J. R., and Pais, J. (2006). Race, class, and hurricane Katrina: social differences in human responses to disaster. Soc. Sci. Res. 35, 295–321. doi: 10.1016/j.ssresearch.2006.02.003
Escobar Carías, M. S., Johnston, D. W., Knott, R., and Sweeney, R. (2022). Flood disasters and health among the urban poor. Health Econ. 31, 2072–2089. doi: 10.1002/hec.4566
Esri. (2025). Apportionment reliability for raster-based settlement points. Available at: https://developers.arcgis.com/rest/geoenrichment/reliability/ (Accessed April 20, 2025).
Esri. (2023). Methodology Statement: 2017–2021 American Community Survey. Available at: https://downloads.esri.com/esri_content_doc/dbl/us/J10020_American_Community_Survey_2023_JUNE_final.pdf (Accessed April 20, 2025).
Federal Emergency Management Agency (FEMA). (2023). FEMA Flood Maps and Zones Explained. Available at: https://www.fema.gov/blog/fema-flood-maps-and-zones-explained (Accessed April 20, 2025).
Federal Emergency Management Agency (FEMA). (2024). Federal Flood Risk Management Standard (FFRMS) Policy. Available at: https://www.fema.gov/sites/default/files/documents/fema_floodplain-management_ffrms-policy_092024.pdf (Accessed April 20, 2025).
Federal Emergency Management Agency (FEMA). (2025). Flood Maps. Available at: https://www.fema.gov/flood-maps (Accessed April 20, 2025).
Ficklin, D. L., Null, S. E., Abatzoglou, J. T., Novick, K. A., and Myers, D. T. (2022). Hydrological intensification will increase the complexity of water resource management. Earth’s Future 10:e2021EF002487. doi: 10.1029/2021EF002487
Fielding, J., and Burningham, K. (2005). Environmental inequality and flood hazard. Local Environ. 10, 379–395. doi: 10.1080/13549830500160875
Fitzpatrick, K. M., Willis, D. E., Spialek, M. L., and English, E. (2020). Food insecurity in the post-hurricane Harvey setting: risks and resources in the midst of uncertainty. Int. J. Environ. Res. Public Health 17:8424. doi: 10.3390/ijerph17228424
Flores, A. B., Collins, T. W., Grineski, S. E., Amodeo, M., Porter, J. R., Sampson, C. C., et al. (2023). Federally overlooked flood risk inequities in Houston, Texas: novel insights based on dasymetric mapping and state-of-the-art flood modeling. Ann. Am. Assoc. Geogr. 113, 240–260. doi: 10.1080/24694452.2022.2085656
Flores, A. B., Collins, T. W., Grineski, S. E., Griego, A. L., Mullen, C., Nadybal, S. M., et al. (2021). Environmental injustice in the disaster cycle: hurricane Harvey and the Texas Gulf Coast. Environ. Just. 14, 146–158. doi: 10.1089/env.2020.0039
Grineski, S., Collins, T. W., Chakraborty, J., and Montgomery, M. (2015). Hazardous air pollutants and flooding: a comparative interurban study of environmental injustice. GeoJournal 80, 145–158. doi: 10.1007/s10708-014-9542-1
Grineski, S. E., Renteria, R. A., Collins, T. W., Bakian, A. V., Bilder, D., VanDerslice, J. A., et al. (2024). PM2.5 threshold exceedances during the prenatal period and risk of intellectual disability. Journal of Exposure Science & Environmental. Epidemiology 34, 861–867. doi: 10.1038/s41370-024-00647-0
Gumus, V., Avsaroglu, Y., and Simsek, O. (2022). Streamflow trends in the Tigris River basin using Mann−Kendall and innovative trend analysis methods. J. Earth Syst. Sci. 131:34. doi: 10.1007/s12040-021-01770-4
Hao, H., Wang, Y., and Kang, S. (2022). Examining “digital” vulnerability to flooding among subsidized housing residents in Florida. Int. J. Disaster Risk Reduct. 82:103302. doi: 10.1016/j.ijdrr.2022.103302
Harner, J., Warner, K., Pierce, J., and Huber, T. (2002). Urban environmental justice indices. Prof. Geogr. 54, 318–331. doi: 10.1111/0033-0124.00333
Huang, T., and Merwade, V. (2023). Uncertainty analysis and quantification in flood insurance rate maps using Bayesian model averaging and hierarchical BMA. J. Hydrol. Eng. 28:04022038. doi: 10.1061/JHYEFF.HEENG-5851
Hughes, S., Dobie, S., Schwarz, K., LaMarr LeMee, G., Lane, M., and Gonzalez, A. (2021). Centering racial justice in urban flood resilience policy and planning: tools for practitioners. Environ. Just. 15:env.2021.0045. doi: 10.1089/env.2021.0045
Kato-Huerta, J., and Geneletti, D. (2023). A distributive environmental justice index to support green space planning in cities. Landsc. Urban Plan. 229:104592. doi: 10.1016/j.landurbplan.2022.104592
Kem, C. Gardner Policy Institute. (2022). Utah population to increase by 2.2 million people through 2060. University of Utah. Available at: https://gardner.utah.edu/news/utah-population-to-increase-by-2-2-million-people-through-2060/ (Accessed April 20, 2025).
Khatri, K. B., Strong, C., Von Stackelberg, N., Buchert, M., and Kochanski, A. K. (2019). Impact of climate and land use change on streamflow and sediment yield in a snow-dominated semiarid mountainous watershed. J. Am. Water Resour. Assoc. 55, 1540–1563. doi: 10.1111/1752-1688.12803
Kisi, O. (2015). An innovative method for trend analysis of monthly pan evaporations. J. Hydrol. 527, 1123–1129. doi: 10.1016/j.jhydrol.2015.06.009
Kourtis, I. M., Bellos, V., Kopsiaftis, G., Psiloglou, B., and Tsihrintzis, V. A. (2021). Methodology for holistic assessment of grey-green flood mitigation measures for climate change adaptation in urban basins. J. Hydrol. 603:126885. doi: 10.1016/j.jhydrol.2021.126885
Linscott, G., Rishworth, A., King, B., and Hiestand, M. P. (2022). Uneven experiences of urban flooding: examining the 2010 Nashville flood. Nat. Hazards 110, 629–653. doi: 10.1007/s11069-021-04961-w
Maantay, J., and Maroko, A. (2009). Mapping urban risk: flood hazards, race, & environmental justice in New York. Appl. Geogr. 29, 111–124. doi: 10.1016/j.apgeog.2008.08.002
Maldonado, A., Collins, T., Grineski, S., and Chakraborty, J. (2016). Exposure to flood hazards in Miami and Houston: are Hispanic immigrants at greater risk than other social groups? Int. J. Environ. Res. Public Health 13:775. doi: 10.3390/ijerph13080775
Mennis, J. (2003). Generating surface models of population using dasymetric mapping. Prof. Geogr. 55, 31–42. doi: 10.1111/0033-0124.10042
Merwade, V., Olivera, F., Arabi, M., and Edleman, S. (2008). Uncertainty in flood inundation mapping: current issues and future directions. J. Hydrol. Eng. 13, 608–620. doi: 10.1061/(ASCE)1084-0699(2008)13:7(608)
Mostafiz, R. B., Rahim, M. A., Friedland, C. J., Rohli, R. V., Bushra, N., and Orooji, F. (2022). A data-driven spatial approach to characterize the flood hazard. Front. Big Data 5:1022900. doi: 10.3389/fdata.2022.1022900
Mullen, C. J., Grineski, S. E., Collins, T. W., and Flores, A. B. (2024). Air quality sensors and distributional environmental justice: a case study of salt Lake County, Utah. Environ. Soc. 10, 179–191. doi: 10.1080/23251042.2023.2295099
Nakazawa, M. (2023). fmsb: Functions for medical statistics book with some demographic data version 0. 7. 6 from CRAN. Available online at: https://rdrr.io/cran/fmsb/ (Accessed February 18, 2025).
NOAA National Centers for Environmental Information (NCEI). (2025). U.S. Billion-Dollar Weather and Climate Disasters. Available at: https://www.ncei.noaa.gov/access/billions/ (Accessed April 20, 2025).
Patterson, L. A., and Doyle, M. W. (2009). Assessing effectiveness of national flood policy through spatiotemporal monitoring of socioeconomic exposure1. J. Am. Water Resour. Assoc. 45, 237–252. doi: 10.1111/j.1752-1688.2008.00275.x
Pellerey, V., Torabi Moghadam, S., and Lombardi, P. (2025). A systematic review of justice integration to climate resilience: current trends and future directions. Urban Clim. 59:102250. doi: 10.1016/j.uclim.2024.102250
Pielke, R. A., and Downton, M. W. (2000). Precipitation and damaging floods: trends in the United States, 1932–97. J. Clim. 13, 3625–3637. doi: 10.1175/1520-0442(2000)013<3625:PADFTI>2.0.CO;2
Qiang, Y. (2019). Flood exposure of critical infrastructures in the United States. Int. J. Disaster Risk Reduct. 39:101240. doi: 10.1016/j.ijdrr.2019.101240
Qiang, Y., Lam, N. S. N., Cai, H., and Zou, L. (2017). Changes in exposure to flood hazards in the United States. Ann. Am. Assoc. Geogr. 107, 1332–1350. doi: 10.1080/24694452.2017.1320214
Rufat, S., Tate, E., Emrich, C. T., and Antolini, F. (2019). How valid are social vulnerability models? Ann. Am. Assoc. Geogr. 109, 1131–1153. doi: 10.1080/24694452.2018.1535887
Salt Lake County Surveyor’s Office. (2024). Municipal Boundaries. Salt Lake County Open Data. Available at: https://gisdata-slco.opendata.arcgis.com/datasets/municipal-boundaries (Accessed April 20, 2025).
Sanders, B. F., Schubert, J. E., Goodrich, K. A., Houston, D., Feldman, D. L., Basolo, V., et al. (2020). Collaborative modeling with fine-resolution data enhances flood awareness, minimizes differences in flood perception, and produces actionable flood maps. Earth’s. Futures 8:e2019EF001391. doi: 10.1029/2019EF001391
Sannigrahi, S., Zhang, Q., Pilla, F., Basu, B., and Basu, A. S. (2020). Effects of west coast forest fire emissions on atmospheric environment: a coupled satellite and ground-based assessment.
Scata, J. (2020). A rising tide lifts all damage costs: The need for a federal flood protection standard. Nat. Resour. Environ. 34, 21–25.
Schlosberg, D. (2013). Theorising environmental justice: the expanding sphere of a discourse. Environ. Polit. 22, 37–55. doi: 10.1080/09644016.2013.755387
Selsor, H., Bledsoe, B. P., and Lammers, R. (2023). Recognizing flood exposure inequities across flood frequencies. Anthropocene 42:100371. doi: 10.1016/j.ancene.2023.100371
Şen, Z. (2012). Innovative trend analysis methodology. J. Hydrol. Eng. 17, 1042–1046. doi: 10.1061/(ASCE)HE.1943-5584.0000556
Spielman, S. E., Folch, D., and Nagle, N. (2014). Patterns and causes of uncertainty in the American community survey. Appl. Geogr. 46, 147–157. doi: 10.1016/j.apgeog.2013.11.002
Sun, J., and Wang, H. (2012). Changes of the connection between the summer North Atlantic oscillation and the east Asian summer rainfall. J. Geophys. Res. Atmos. 117:2012JD017482. doi: 10.1029/2012JD017482
Swain, D. L., Wing, O. E. J., Bates, P. D., Done, J. M., Johnson, K. A., and Cameron, D. R. (2020). Increased flood exposure due to climate change and population growth in the United States. Earth’s. Futures 8:e2020EF001778. doi: 10.1029/2020EF001778
Tate, E., Rahman, M. A., Emrich, C. T., and Sampson, C. C. (2021). Flood exposure and social vulnerability in the United States. Nat. Hazards 106, 435–457. doi: 10.1007/s11069-020-04470-2
The White House. (2021). Executive Order on Tackling the Climate Crisis at Home and Abroad. Available at: https://bidenwhitehouse.archives.gov/briefing-room/presidential-actions/2021/01/27/executive-order-on-tackling-the-climate-crisis-at-home-and-abroad/ (Accessed April 20, 2025).
The White House. (2025). Ending illegal discrimination and restoring merit-based opportunity. Available at: https://www.whitehouse.gov/presidential-actions/2025/01/ending-illegal-discrimination-and-restoring-merit-based-opportunity/ (Accessed April 20, 2025).
Tullos, D. (2018). How to achieve better flood-risk governance in the United States. Proc. Natl. Acad. Sci. 115, 3731–3734. doi: 10.1073/pnas.1722412115
Tyler, J., Sadiq, A.-A., and Noonan, D. S. (2019). A review of the community flood risk management literature in the USA: lessons for improving community resilience to floods. Nat. Hazards 96, 1223–1248. doi: 10.1007/s11069-019-03606-3
U.S. Census Bureau. (2023). Salt Lake County, Utah: Health Profile. Available at: https://data.census.gov/profile/Salt_Lake_County,_Utah?g=0500000US49035#health (Accessed April 20, 2025).
U.S. Census Bureau. (2024a). Salt Lake County, Utah profile. U.S. Census Bureau. Available at: https://data.census.gov/profile/Salt_Lake_County,_Utah?g=050XX00US49035 (Accessed August 15, 2024).
U.S. Census Bureau. (2024b). Understanding American Community Survey Data Release Rules for Tabulated Data Products. Available at: https://www2.census.gov/programs-surveys/acs/tech_docs/data_suppression/ACS_Data_Release_Rules.pdf (Accessed April 20, 2025).
U.S. Census Bureau. (2021). Understanding and Using American Community Survey Data: What Users of Data for American Indians and Alaska Natives Need to Know – Chapter 7: Understanding Error and Determining Statistical Significance. Available at: https://www.census.gov/content/dam/Census/library/publications/2021/acs/acs_aian_handbook_2021_ch07.pdf (Accessed April 20, 2025).
Utah Division of Emergency Management. (2019). Utah State Hazard Mitigation Plan. Available at: https://hazards.utah.gov/wp-content/uploads/Utah-State-Hazard-Mitigation-Plan-2019.pdf (Accessed April 20, 2025).
Utah Flood Hazards. (2020). Quick Guide: Understanding Floodplain Management. Available at: https://floodhazards.utah.gov/wp-content/uploads/2023/06/Quick-Guide_June2020_FINAL.pdf (Accessed April 19, 2025).
Vahedifard, F., Azhar, M., and Brown, D. C. (2023). Overrepresentation of historically underserved and socially vulnerable communities behind levees in the United States. Earth’s. Futures 11:e2023EF003619. doi: 10.1029/2023EF003619
Vahedifard, F., Madani, K., AghaKouchak, A., and Thota, S. K. (2021). Are we ready for more dam removals in the United States? Environ. Res. Infrastruct. Sustain. 1:013001. doi: 10.1088/2634-4505/abe639
Wang, S., Najafi, M. R., Cannon, A. J., and Khan, A. A. (2021). Uncertainties in riverine and coastal flood impacts under climate change. Water 13:1774. doi: 10.3390/w13131774
Wang, Y., Xu, Y., Tabari, H., Wang, J., Wang, Q., Song, S., et al. (2020). Innovative trend analysis of annual and seasonal rainfall in the Yangtze River Delta, eastern China. Atmos. Res. 231:104673. doi: 10.1016/j.atmosres.2019.104673
Wei, R., Knaap, E., and Rey, S. (2023). American community survey (Acs) data uncertainty and the analysis of segregation dynamics. Popul. Res. Policy Rev. 42:5. doi: 10.1007/s11113-023-09754-6
Wing, O. E. J., Bates, P. D., Smith, A. M., Sampson, C. C., Johnson, K. A., Fargione, J., et al. (2018). Estimates of present and future flood risk in the conterminous United States. Environ. Res. Lett. 13:034023. doi: 10.1088/1748-9326/aaac65
Wing, O. E. J., Lehman, W., Bates, P. D., Sampson, C. C., Quinn, N., Smith, A. M., et al. (2022). Inequitable patterns of US flood risk in the Anthropocene. Nat. Clim. Chang. 12, 156–162. doi: 10.1038/s41558-021-01265-6
Wu, H., and Qian, H. (2017). Innovative trend analysis of annual and seasonal rainfall and extreme values in Shaanxi, China, since the 1950s. Int. J. Climatol. 37, 2582–2592. doi: 10.1002/joc.4866
Xu, J., and Qiang, Y. (2024). Environmental justice implications of flood risk in the contiguous United States – a spatiotemporal assessment of flood exposure change from 2001 to 2019. Cartogr. Geogr. Inf. Sci. 51, 492–512. doi: 10.1080/15230406.2024.2328159
Yaryan Hall, H. R., and Bledsoe, B. P. (2023). Integrated urban riverscape planning: Spatial prioritization for environmental equity. ASCE OPEN: Multidisciplinary Journal of Civil Engineering. 1:04023004. doi: 10.1061/AOMJAH.AOENG-0001
Zahran, S., Brody, S. D., Peacock, W. G., Vedlitz, A., and Grover, H. (2008). Social vulnerability and the natural and built environment: a model of flood casualties in Texas. Disasters 32, 537–560. doi: 10.1111/j.1467-7717.2008.01054.x
Keywords: urban flooding, flood exposure, FEMA, environmental justice, Salt Lake County, Utah, USA
Citation: Farshid A and Null SE (2025) Flood injustice in 500-year floodplains. Front. Hum. Dyn. 7:1496686. doi: 10.3389/fhumd.2025.1496686
Edited by:
Khandaker Jafor Ahmed, University of Michigan, United StatesReviewed by:
Aaron Flores, Arizona State University, United StatesDaniel Mendoza, The University of Utah, United States
Copyright © 2025 Farshid and Null. This is an open-access article distributed under the terms of the Creative Commons Attribution License (CC BY). The use, distribution or reproduction in other forums is permitted, provided the original author(s) and the copyright owner(s) are credited and that the original publication in this journal is cited, in accordance with accepted academic practice. No use, distribution or reproduction is permitted which does not comply with these terms.
*Correspondence: Ali Farshid, YWxpLmZhcnNoaWRAdXN1LmVkdQ==