 Zhu Ye
 Han Wang
 Hongjin Chen
 Yong Yu
- 1Academy of the Zhonghuaminzu Community, Yangtze Normal University, Chongqing, China
- 2Faculty of Science, Universiti Malaya, Kuala Lumpur, Malaysia
- 3School of Economics and Management, Tibet University, Lhasa, China
- 4School of Management, Yangtze Normal University, Chongqing, China
- 5Asia-Europe Institute, Universiti Malaya, Kuala Lumpur, Malaysia
Based on the environmental quality data pertaining to human well-being in Bhutan from 2002 to 2022, the ARDL-ECM model was employed to examine the long-term equilibrium and short-term dynamic relationships between international trade, foreign direct investment, and demographic structure with Bhutan’s per capita ecological footprint. Additionally, the Granger causality test was utilized to further investigate these relationships. The results showed that: During the study period, the environmental quality of human well-being in Bhutan was deteriorating continuously; The increase of international trade can increase the per capita ecological footprint of Bhutan, which leads to the decline of Bhutan’s environmental quality, and it is also the Granger cause of the change in Bhutan’s per capita ecological footprint. Foreign direct investment and demographic structure move in the opposite direction of Bhutan’s per capita ecological footprint. This serves as a point of reference for policymakers when formulating pertinent strategies, and offers a theoretical foundation and practical guidance for other nations in their pursuit of sustainable development pathways.
Introduction
Among the top 10 nations on the ‘World Happiness Map’1 Bhutan uniquely secures the eighth position as a developing small country. In the past two decades, the Bhutan’s “Gross National Happiness (GNH)” has attracted more and more attention in the international community (Easterlin, 2004; Organisation for Economic Co-operation and Development, 2012). However, the majority of nations have excessively pursued socio-economic advancement at the cost of irreversible ecological damage in their pursuit of industrialization and urbanization processes. In other words, modern society has largely transformed into one driven by market-centric ideologies (Polanyi, 2001), or a consumer society underpinned by financial, governmental, and ecological indebtedness (Jackson, 2009), or a society driven by consumer-oriented market economics (Nair, 2011), leading to significant environmental degradation and ecological harm. Additionally, South Asia is home to 27 of the 30 cities with the worst air pollution globally (IQAir, 2020). Since the 21st century, the issue of environmental degradation caused by human activities has garnered significant attention from scholars focused on sustainable human development (Gokmenoglu et al., 2021). Many organizations and countries have started to emphasize the reduction of negative impacts on the environment and the enhance of ecological environmental quality for boosting human well-being, including the Paris Agreement and the Kyoto Protocol (Ali et al., 2016).
However, environmental pollution is inherently complexity and multifaceted, extending well beyond mere air and atmospheric pollution. Solely utilizing CO2 emissions as a metric does not comprehensively account for the regional environmental quality (Murshed et al., 2022a). Unlike CO2 emissions, the ecological footprint—which measures the biological resources required to support human activities—offers a comprehensive indicator of environmental sustainability and quality (Biçen and Çoban, 2024). An increase in the ecological footprint level equates to heightened human ecological demands, which can be interpreted as a deterioration in environmental quality. Thus, adopting the ecological footprint as a measure provides a deeper insight into the region’s environmental capacity and the sustainability of its socio-economic development (Li and Lu, 2023).
Across the South Asian region, the majority of countries exhibit annual economic growth rates exceeding 6%, particularly driven by the profound impacts of international trade (Goretti et al., 2019). International trade in South Asia has altered the resource supply and demand dynamics as well as production methods. From the perspective of trade structure, South Asian countries are highly dependent on the import of traditional fossil fuels (Murshed, 2018). Bhutan is no exception. In regional trade in South Asia, Bhutan has signed a free trade agreement with India and a preferential trade agreement with Bangladesh. In 2024, Bhutan signed the Thailand-Bhutan Free Trade Agreement with Thailand again, which indicates that it is willing and actively taking actions to integrate into the world economic system. In terms of population structure, Bhutan’s population is approximately 763,000, and the growth rate in 2022 is about 0.94%.2 To meet the demands of economic growth and population growth, most developing countries will choose a large amount of fossil energy to meet the daily production and living needs (Okunol et al., 2018). Facts have proved that from 2002 to 2022, Bhutan’s per capita ecological footprint gradually increased from 4.4 hm2 to 4.7 hm2, reflecting the decline in Bhutan’s environmental quality and resulting in an ecological deficit in environmental carrying capacity.
Against this background, this study takes Bhutan as an example, aiming to evaluate the relationship among international trade, foreign direct investment, demographic structure and environmental quality. The research adopted cointegration technology, ARDL model and Granger causality test. This research has contributed to the field of environmental quality in the following aspects:
1. It helps to understand how international trade, foreign direct investment and demographic structure affect the environmental quality of developing countries. Can these factors serve as driving forces for environmental deterioration?
2. We use ecological footprint as a measure of environmental deterioration, which is more accurate than the traditional use of carbon dioxide emissions as a measure.
3. It conducted a detailed environmental quality analysis of a developing country like Bhutan, which provided important information for public policy decision-makers to help them establish mechanisms to mitigate environmental deterioration and formulate strategies for a sustainable environment.
Literature review
Research on the relationship between international trade and environmental quality
Research on the relationship between international trade and environmental quality is extensive and dates back to the 1970s. Notable reviews have been conducted by Dean (1992), Jaffe et al. (1995), Jayadevappa and Chhatre (2000), Lu (2012), and Peng and Zhang (2016). The findings can generally be categorized into three perspectives:
(1) International trade significantly worsens environmental pollution (Machado et al., 2001; Mukhopadhyay and Chakraborty, 2005; Feridun et al., 2006; Solarin et al., 2017). For every 1% increase in trade openness, carbon dioxide emissions rise by 0.579% (Managi, 2004). This is attributed to changes in the structure of economic activities induced by regional trade, which leads to increased air pollution (Kukla-Gryz, 2009). Shapiro (2016), using 2007 trade data from 128 countries, similarly confirmed that international trade increased CO₂ emissions by 5%. In developed countries, trade openness raised CO₂ emissions across 18 EU economies, worsening pollution (Tachie et al., 2020). Similar findings were observed in developing countries (Shui and Harriss, 2006; Ang, 2009; Wang and Xu, 2015). For instance, Li and Qi (2011), using CO₂ emissions data from 30 Chinese provinces (1997–2008), empirically showed that international trade increased China’s CO₂ emissions and carbon intensity. In South Asia, countries such as Bangladesh, India, Pakistan, and Sri Lanka rely heavily on fossil fuels (Wijayatunga, 2013), and international trade among them correlates positively with ecological footprints (Sabir and Gorus, 2019). Environmentalists argue that international trade expansion enlarges the global economy and intensifies natural resource consumption, especially in developing countries with lenient environmental policies, where trade liberalization aggravates pollution (Daly, 1993; Chichilnisky, 2017; Khor, 2001). Theories supporting this include the “Pollution Haven Hypothesis” (Copeland and Taylor, 1995), the “Race to the Bottom” hypothesis (Revesz, 1992; Brueckner, 2000; Basinger and Hallerberg, 2004), and the “Capital-Labour Hypothesis” (KLH).
(2) International trade can significantly reduce pollutant emissions and improve environmental quality (Xu and Deng, 2012). Antweiler et al. (2001), through mathematical modeling, demonstrated that international trade generally reduces pollution, including concentrations of SO₂, NO₂, and particulate matter. Frankel and Rose (2005) found almost no adverse environmental effects from international trade. In developed countries, the North American Free Trade Agreement led to notable reductions in emissions from U. S. manufacturing plants (Cherniwchan, 2017). Forslid et al. (2018), studying about 600 Swedish enterprises, discovered that exports reduced pollution intensity without affecting total emissions. Similar results were found for developing countries (Dean, 2002; Chai, 2002; Shen and Tang, 2008). Pei et al. (2021), analyzing data from 38,422 Chinese industrial enterprises in 2007, found that export intensity negatively impacted SO₂ emissions. Lu (2020) confirmed that international trade reduced ecological footprints in 13 Asian countries. Murshed et al. (2022b), by exploring the relationship among intra-regional trade, renewable energy use, foreign direct investments, economic growth and ecological footprint in South Asia, found that promoting intra-regional trade and stimulating renewable energy transition are imperative for reducing the ecological footprint of South Asian countries. Trade liberals argue that international trade is not the primary cause of pollution but rather the failure of markets and governments. Restricting international might worsen pollution (Anderson and Blackhurst, 1992).
(3) There is a nonlinear relationship between international trade and pollution. Generally, international trade benefits the environment in developed countries but harms it in developing countries (Liu and Zhang, 2011). international trade helps reduce pollution in OECD countries but increases SO₂ and CO₂ emissions in non-OECD countries (Managi et al., 2009). The impact of trade openness on the environment varies by income level—positive in high-income countries and negative in low-and middle-income countries (Le et al., 2016). A key theory explaining this nonlinear relationship is the “ACT Theory” (Anderson, 1992).
Research on the relationship between foreign direct investment and environmental quality
Current research on the effects of FDI on environmental quality generally falls into three categories:
(1) The “Pollution Haven Hypothesis” proposed by Copeland and Taylor (1995) suggests that developing countries attract foreign investment by lowering environmental standards, while developed countries relocate high-polluting industries to the developing countries, turning them into pollution havens (Doytch, 2020). Hoffmann et al. (2005) used Granger causality test to study French manufacturing and found that relaxed environmental policies in underdeveloped nations may attract FDI but impact environmental pollution through technological modernization. Bakhsh et al. (2017), using Pakistani panel data (1980–2014) and 3SLS methods, found a positive correlation between FDI and pollution. Ponce et al. (2023) also holds the same view. They believe that there is a significant positive relationship between foreign direct investment and the ecological footprint in low or middle income countries. This is because the environmental regulations in these countries are relatively weak, attracting a large amount of highly polluting foreign direct investment. Ozkan et al. (2023) employed the dynamic ARDL method to verify that foreign direct investment has a negative impact on China’s environmental quality, demonstrating that China’s situation is more in line with the “Pollution Haven Hypothesis” rather than the “Pollution Halo Effect.”
(2) The “Pollution Halo Effect” suggests that developed countries possess advanced clean technologies and environmental management systems that help improve environmental quality in host countries. Birdsall and Wheeler (1993) challenged the “pollution haven hypothesis,” stating that trade liberalization does not promote polluting industries but fosters clean industry. Grey and Brank (2002) introduced the “pollution halo effect,” emphasizing that FDI brings advanced technology and management practices that benefit host countries’ environmental governance (Wang et al., 2019). Udemba (2020) took India as an example and adopted the ARDL model to prove that foreign direct investment had a positive impact on environmental quality and established a negative correlation with the ecological footprint. Liang (2014), analyzing socioeconomic panel data from 260 major Chinese cities, found that foreign firms’ technology diffusion improved resource efficiency and reduced SO2 emissions. He (2006), Zeng and Eastin (2007) found that FDI led to less pollution emissions in provinces with higher economic development levels. Moreover, FDI improves environmental quality as economic strength grows, marketization progresses, and spatial agglomeration deepens (Du and Yu, 2016).
(3) FDI’s environmental effects are multi-dimensional and vary by analysis target, time frame, and variable selection (Perkins and Neumayer, 2009). Dong and Bai (2015) and Shi et al. (2017) argue that in the early stages of development, FDI may create pollution havens, but as economies transform, FDI helps reduce pollution. Under certain conditions, a dual effect may emerge—coexistence of “pollution halo” and “pollution haven” effects—fostering a blended hypothesis (Yang and Tian, 2017). Huo et al. (2019), through analysis of environmental technology spillovers from FDI, argue that these effects are dynamic and shift with societal development.
Research on the relationship between demographic structure and environmental quality
Findings on the impact of demographic structure on environmental quality fall into two main perspectives:
(1) Changes in demographic structure exacerbate pollution. Data from Canada and the U.S. show that higher fertility rates burden ecosystems (Alola et al., 2020). Yu et al. (2018) argued that population aging reduces labor quality, accelerates human capital depreciation, and hinders industrial upgrading, ultimately impeding environmental improvements.
(2) Demographic changes can also reduce pollution. In Asia, demographic structure strongly influences ecosystems (Sharma et al., 2020). In China, the growth of the working-age population significantly improves environmental quality (Zhang et al., 2018). Dalton et al. (2008) used a computable general equilibrium model—PET (Population-Environment-Technology)—to analyze how changes in household age structure affect U.S. energy consumption. For example, an aging population increases consumption of low-energy goods like healthcare, reducing overall energy use.
In recent years, research has broadened to include new dimensions, such as how entrepreneurship (Yang et al., 2020) and environmental awareness (Fan and Mu, 2017) mediate the impact of demographic shifts on environmental quality.
Literature gaps
From the existing literature, scholars have investigated the environmental quality of human well-being from various perspectives, but the focus has largely been on the impact of individual macroeconomic variables on environmental quality. This approach does not facilitate a comprehensive understanding of the relationship between multiple macroeconomic variables and environmental quality. Based on this, The marginal contributions of this study include: (1) This study comprehensively examines the impact of macroeconomic variables such as international trade, foreign direct investment, and demographic structure on the environmental quality of human well-being in Bhutan. (2) Given the multidimensional nature of environmental pollution in the South Asia region, solely utilizing carbon dioxide emissions does not adequately reflect the overall environmental quality of Bhutan. This study employs the ecological footprint as a measure of environmental quality, which not only indicates whether Bhutan’s consumption of resources and energy surpasses the environmental capacity for regeneration but also evaluates the sustainability of Bhutan’s socio-economic development. (3) It can provide a scientific basis for Bhutan to formulate more effective environmental protection policies, economic development strategies and social management measures, and help Bhutan achieve better results in maintaining ecological balance and promoting human well-being. (4) The findings can provide lessons for other developing countries to help them achieve the Sustainable Development Goals in the context of globalization and changing population dynamics.
Theoretical framework
As an important manifestation of economic integration, the environmental effects of international trade have not yet been uniformly determined. At present, except for Bhutan, most South Asian countries are facing serious negative environmental impacts while experiencing economic growth. This leads to an ecological deficit in its environmental carrying capacity (GFN, 2020). Unlike other countries in South Asia, Bhutan’s GNH holds that the existence of human beings fundamentally depends on the environment, and the quality of the environment is a key factor for people’s well-being. However, the Pollution Haven Hypothesis holds that pollution-intensive industries in areas with strict environmental regulations will shift to areas with lenient regulations, making the latter a “pollution haven.” Strict environmental regulations increase the compliance costs of enterprises (such as pollution control and technological upgrading), weakening their comparative advantages. Most developing countries, due to low environmental standards and weak law enforcement, attract a large number of foreign polluting enterprises to settle in, which in turn leads to ecological and environmental pollution.
The Pollution Halo Effect holds that multinational enterprises enhance the environmental protection level of the host country through technological spillover and advanced management experience, forming a “halo” rather than a “refuge.” Foreign enterprises introduce efficient and clean technologies, promoting local enterprises to imitate and upgrade, and forming a technology spillover effect. Facts have proved that as an agricultural-based country, the inflow of foreign capital has indeed promoted the development of infrastructure in Bhutan, provided more job opportunities at the same time, and driven Bhutan’s economic growth (Dhume, 2020). According to the “Environmental Kuznets Curve” hypothesis, environmental pollution shows an “inverted U-shaped” trajectory of deteriorating first and then improving along with economic growth. This means that in the early stage of industrialization, a large number of foreign enterprises flooded in, Bhutan’s per capita GDP increased, and environmental pollution intensified along with economic growth. When the per capita GDP reaches the critical value, the global unified standards of multinational companies force the host countries to strengthen environmental management, and the pollution level peaks and gradually decreases.
Population, as an important factor affecting environmental quality, has long been mentioned in IPAT identity. Specifically, this model simplifies environmental pressure to the product of three factors: population, affluence and technological efficiency, emphasizing the linear superposition effect of the three. However, it ignores structural factors such as industrialization, urbanization and spatial distribution. Similar to this is the ecological modern theory, whose core lies in transforming environmental constraints into economic opportunities through innovation-driven structural adjustment, thereby achieving sustainable development and advocating ecological consumption and citizen participation. Therefore, as the main body of economic activities, the scale, quality and spatial distribution of the population deeply shape the quality of the ecological environment through resource consumption, production patterns and pollution emissions.
To sum up, this study takes Bhutan as an example and attempts to incorporate International trade, Foreign direct investment, Demographic structure and Environmental quality into a unified theoretical framework for analysis. The ARDL-EMC model is adopted to reveal the influence mechanism among variables (as shown in Figure 1).
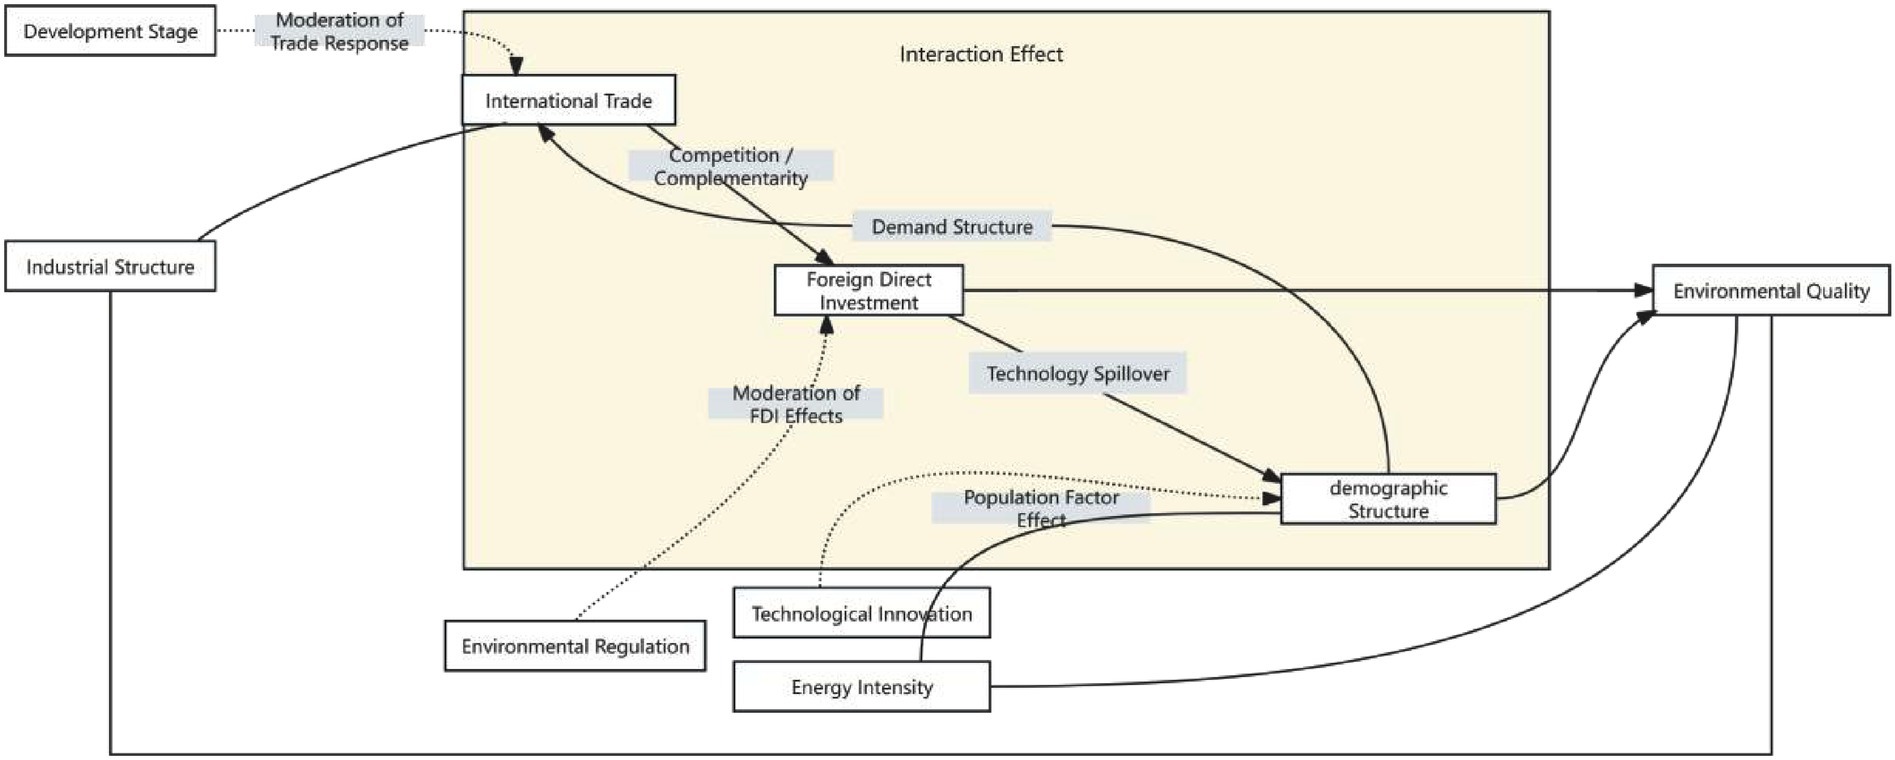
Figure 1. Theoretical framework.
Research design
Model development
Ecological footprint model
Rees (1992) introduced the ecological footprint model, which was later refined and expanded by Wackernagel and Rees (1998). The model measures these areas based on the bioproductive land and sea required to fulfill humanity’s various demands for ecological resources and to assimilate the waste generated in the process. These ecological demands include the need for cropland, pasture, forest, built-up land, fossil energy land, and marine (aquatic) areas. The ecological footprint model serves as a quantitative method for assessing the sustainability of ecological practices within the productive land area.
Ecological footprint per capita
Referring to the measurement method of Liu et al. (2010), ecological footprint per capita model is constructed as follows by measuring the degree of human utilisation of energy consumption and natural resources from the demand perspective:
In Equation 1, EF represents the Bhutan’s per capita ecological footprint (hm2/person); N is the total population; is the equivalence factor for the j category of bioproductive area. is the consumption of the i good (kg), and is the national average yield of the i good (kg/hm2).
Ecological carrying capacity per capita
Referring to the measurement method of Li and Lu (2023), ecological carrying capacity per capita is constructed as follows by measuring the land area required to provide the natural resources necessary for human production and living from a supply-side perspective:
In Equation 2, EC represents the per capita ecological carrying capacity (hm2/person); is the per capita area of the j category of land; is the equivalence factor for the j category of land; is the yield factor for the j category of land, and is the proportion of the area used for biodiversity conservation.
ARDL-ECM model
Aauto-regressive distributedlag (ARDL) is suitable for co-integration testing with small sample data and can enhance the robustness of the model. The model is more flexible, no longer requiring the variables to be both I (0) or both I (1) processes; If the variables are endogenous, the co-integration estimation of the model is not affected. The steps of ARDL-ECM model establishment are as follows:
In the first step, the stationarity of the variables is tested by the unit root test method and determine the single integral order. If the variables conform to zero order single integral I (0) or first order single integral I (1), the model can be further constructed.
The second step is to build the ARDL model as follows:
Equation 3: α0 is a constant term, α1, α2 represent short-term dynamic relations, and α3, α4 represent long-term dynamic relations or co-integration relations. t is the trend term; μt is a white noise process. m, n represent the lag order of the explained variable and the explanatory variable, which are determined by Schwarz information criterion (SIC).
The null hypothesis of the co-integration test is that “there is no long-term equilibrium relationship between variables,” that means the null hypothesis H0: α3 = α4 = 0; The alternative hypothesis is H1: α3 ≠ α4 ≠ 0. According to the judgment of F statistic, when F statistic is less than the lower critical value, the null hypothesis is accepted, and there is no long-term co-integration relationship between variables. If it is greater than the upper critical value, the null hypothesis is rejected and there is a long-term co-integration relationship between variables. If it is between the two critical values, it is further judged according to the single integral order of the sequence.
After determining the existence of long-term equilibrium relationship between variables, the long-term equilibrium relationship is obtained, as shown in Equation 4. Then, the third step of model building is to establish a short-term error correction model, as shown in Equation 5. It should be noted that when there is no long-term equilibrium relationship between variables, the short-term dynamic relationship and error correction model cannot be established.
In Equations 4 and 5, ECMt-1 is the lag error correction factor; Represents the self-correcting speed, usually 0< <1.
Variable establishment and measurement
The environmental quality of human well-being (EF)
This study utilizes the per capita ecological footprint to measure the environmental quality of human well-being (Ajmi and Inglesi-Lotz, 2021). Based on the calculation methods in the Ecological Footprint Model (Equation 1) and the Ecological Carrying Capacity Model (Model 2), this study calculates ecological footprint per capita, ecological carrying capacity per capita, and ecological surplus per capita in Bhutan from 2002 to 2022. Details are presented in Table 1.
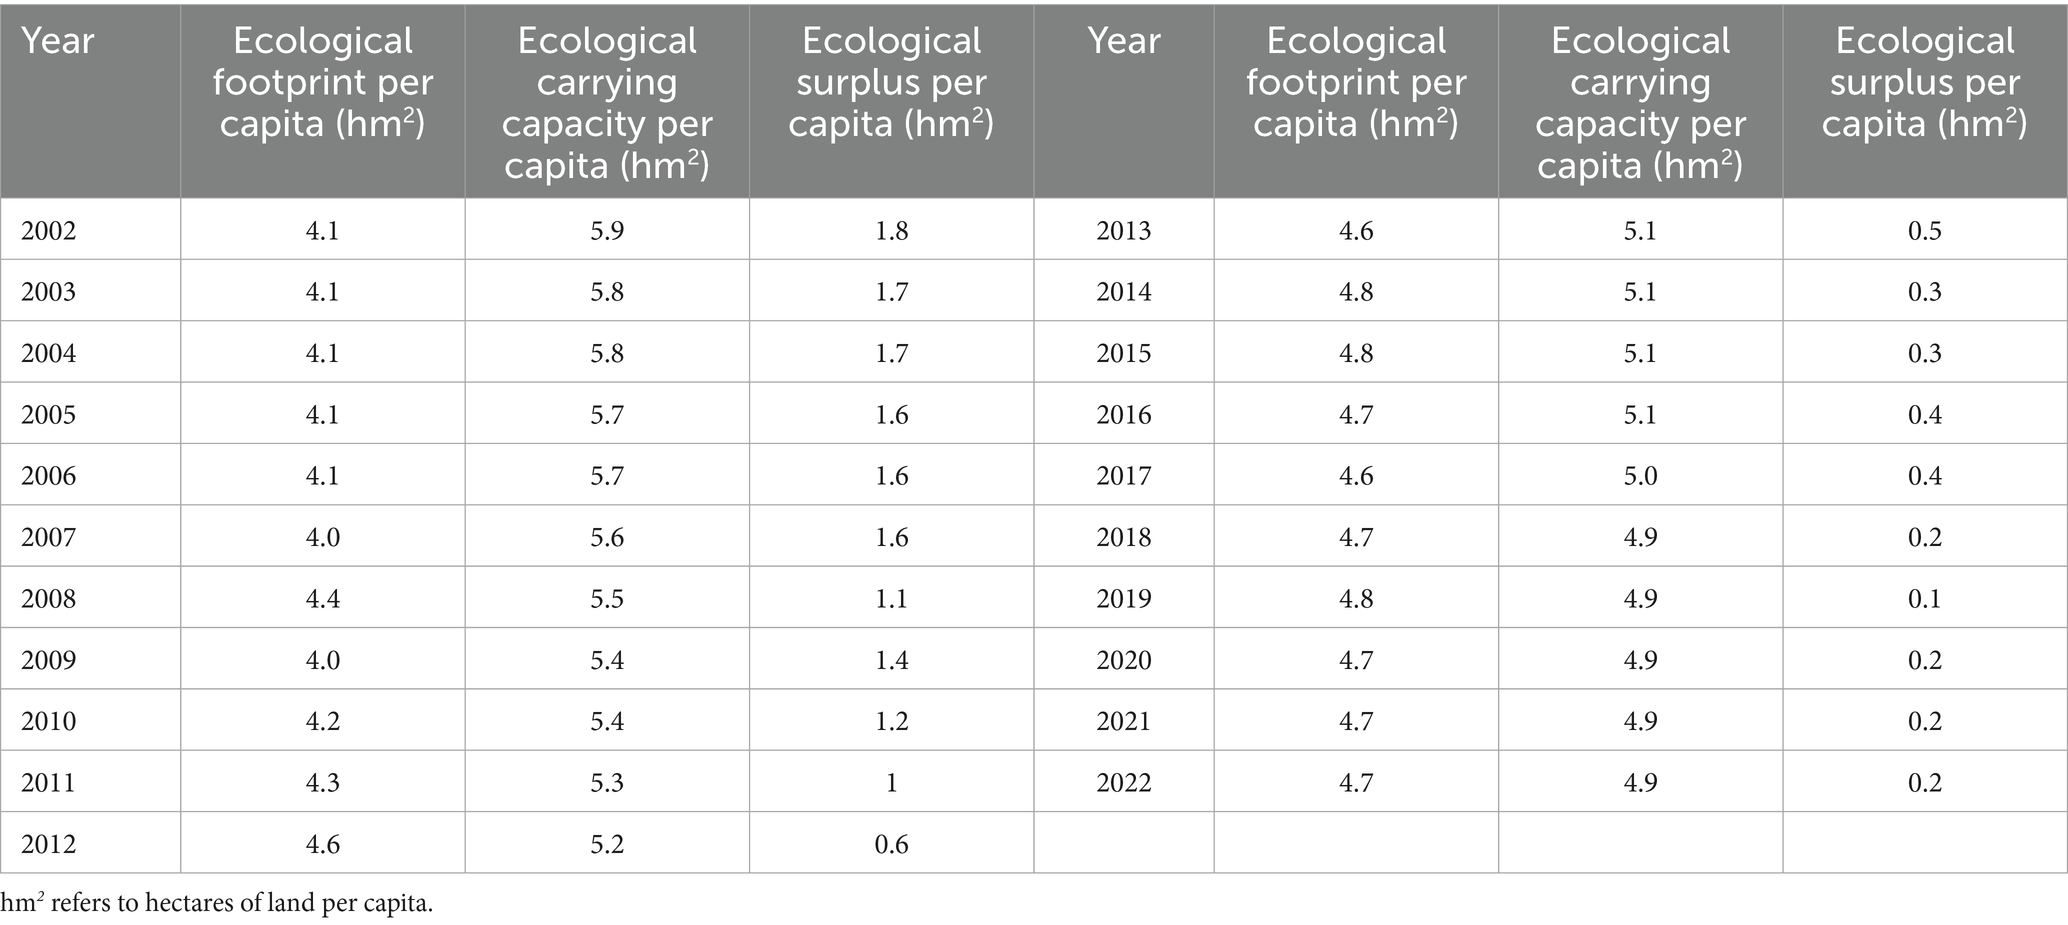
Table 1. Trends in Bhutan’s ecological status.
As shown in Table 2, ecological footprint per capita in Bhutan has grown annually, increasing from 4.1 hm2 in 2002 to 4.7 hm2 in 2022. This indicates a continuous rise in Bhutan’s ecological demands, reflecting a decline in environmental quality. Meanwhile, Bhutan’s ecological carrying capacity per capita decreased from 5.9 hm2 in 2002 to 4.9 hm2 in 2022, indicating an increased load on Bhutan’s ecological carrying capacity per capita. From 2002 to 2022, Bhutan’s per capita ecological surplus was always above zero, indicating that the environmental quality in Bhutan has been relatively good over the past two decades. However, Bhutan’s ecological surplus per capita decreased from 1.8 hm2 in 2002 to 0.2 hm2 in 2022, showing a yearly decline in Bhutan’s ecological environmental quality.
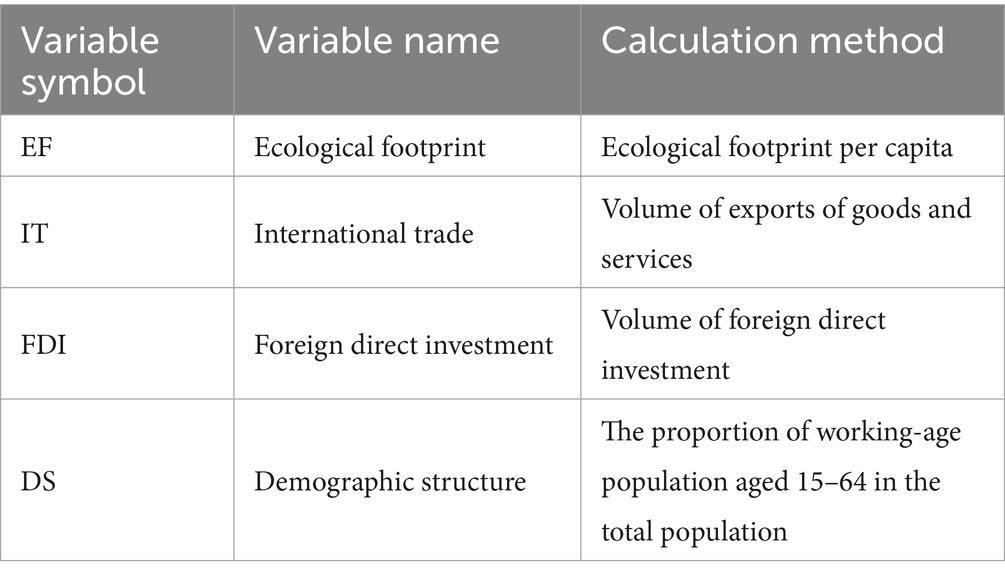
Table 2. Summary of variables.
International trade (IT)
International trade refers to the trade among countries within regional international economic integration organizations, which usually occurs between neighboring countries and regions with geographical advantages. Accordingly, this study measures Bhutan’s international trade using the volume of exports of goods and services.
Foreign direct investment (FDI)
Since 2002, a substantial inflow of foreign direct investment into Bhutan has significantly propelled the construction of infrastructure and socio-economic development (Dhume, 2020). Hence, this study selects the amount of foreign direct investment to measure this variable.
Demographic structure (DS)
Drawing on the approach of Liu et al. (2022), this study uses the proportion of working-age population aged 15–64 in the total population to measure Bhutan’s demographic structure. A summary and description of the variables can be found in Table 2.
Data sources
Data related to international trade, the amount of foreign direct investment, and the population aged 15–64 years are all obtained from the World Bank.3 The relevant data required for the Ecological Footprint Model (Equation 1) and the Ecological Carrying Capacity Model (Equation 2) come from the Bhutan Statistical Yearbook and the World Bank.
Empirical analysis
Data processing
The logarithms of the variables (EF, IT, FDI, DS) are taken, respectively, to ensure the stationarity of the time series, while preserving the relationship between these variables. According to the results of the white test, F-statistic = 1.916 (p = 0.148), Obs*R^2 = 10.664 (p = 0.154), we accept the null hypothesis, which proves that heteroscedasticity can be effectively eliminated by taking logarithms of all variables.
Study Period: Since 2002, a significant inflow of foreign direct investment into Bhutan has commenced, hence the study period chosen is from 2002 to 2022.
This study utilizes Eviews 11.0 software for Unit root test, ARDL-ECM model, and Granger causality analysis.
Descriptive statistics and normality tests
Table 3 presents descriptive statistics for all variables, including sample size, minimum, maximum, mean, and standard error.
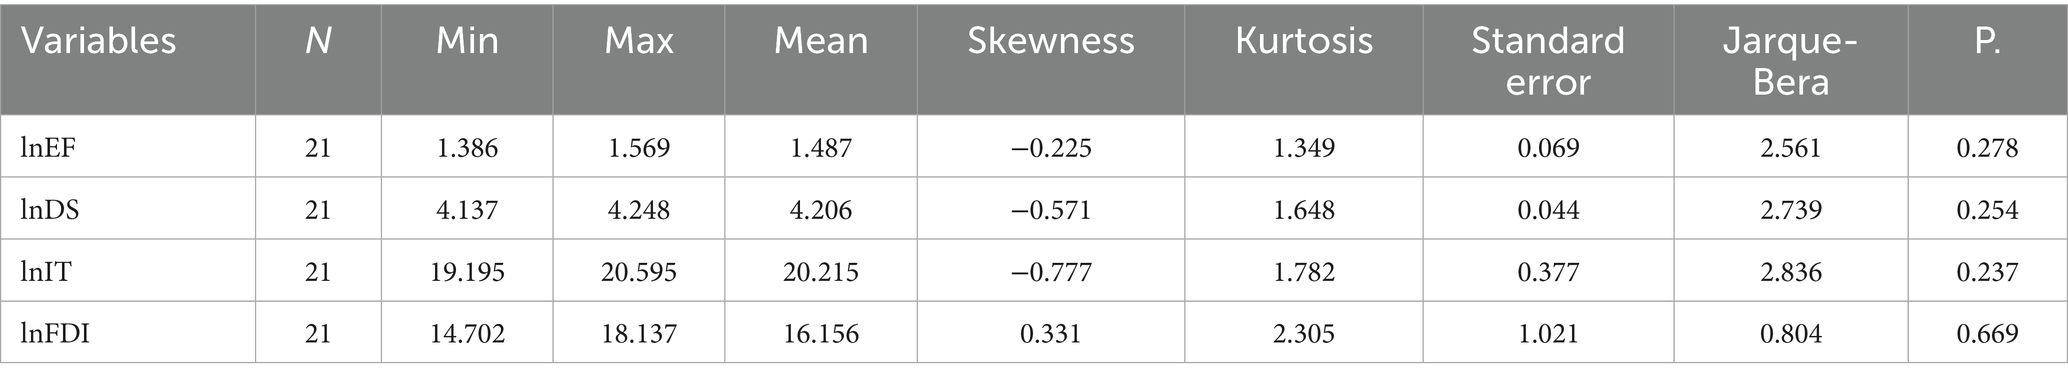
Table 3. Descriptive statistics.
According to the Jarque-Bera test results, the p-values of the four variables were all greater than 0.05. The null hypothesis was retained, and the sample data followed a normal distribution.
ARDL bounds test
Table 4 presents the results of the ARDL Bounds Test. The value of the F-statistic is 17.431, which is greater than the upper limit (I1bound) of the significance level. Then, the cointegration and long-term forms continue to be estimated.
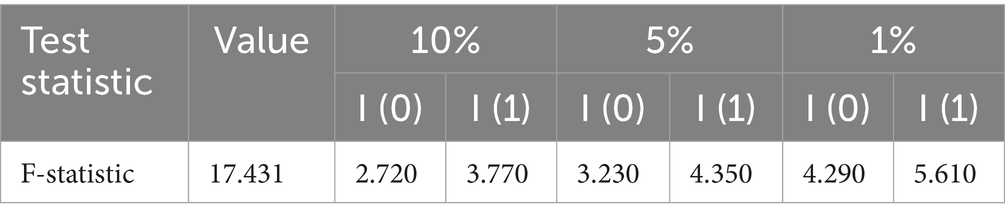
Table 4. ARDL bounds test.
Unit root test
Before the co-integration test, the variables need to be tested for stationarity. The ADF test method commonly used in unit root test was adopted in this study. The test results are shown in Table 5, where the First-order difference of the four variables is steady, meeting the ARDL test conditions.
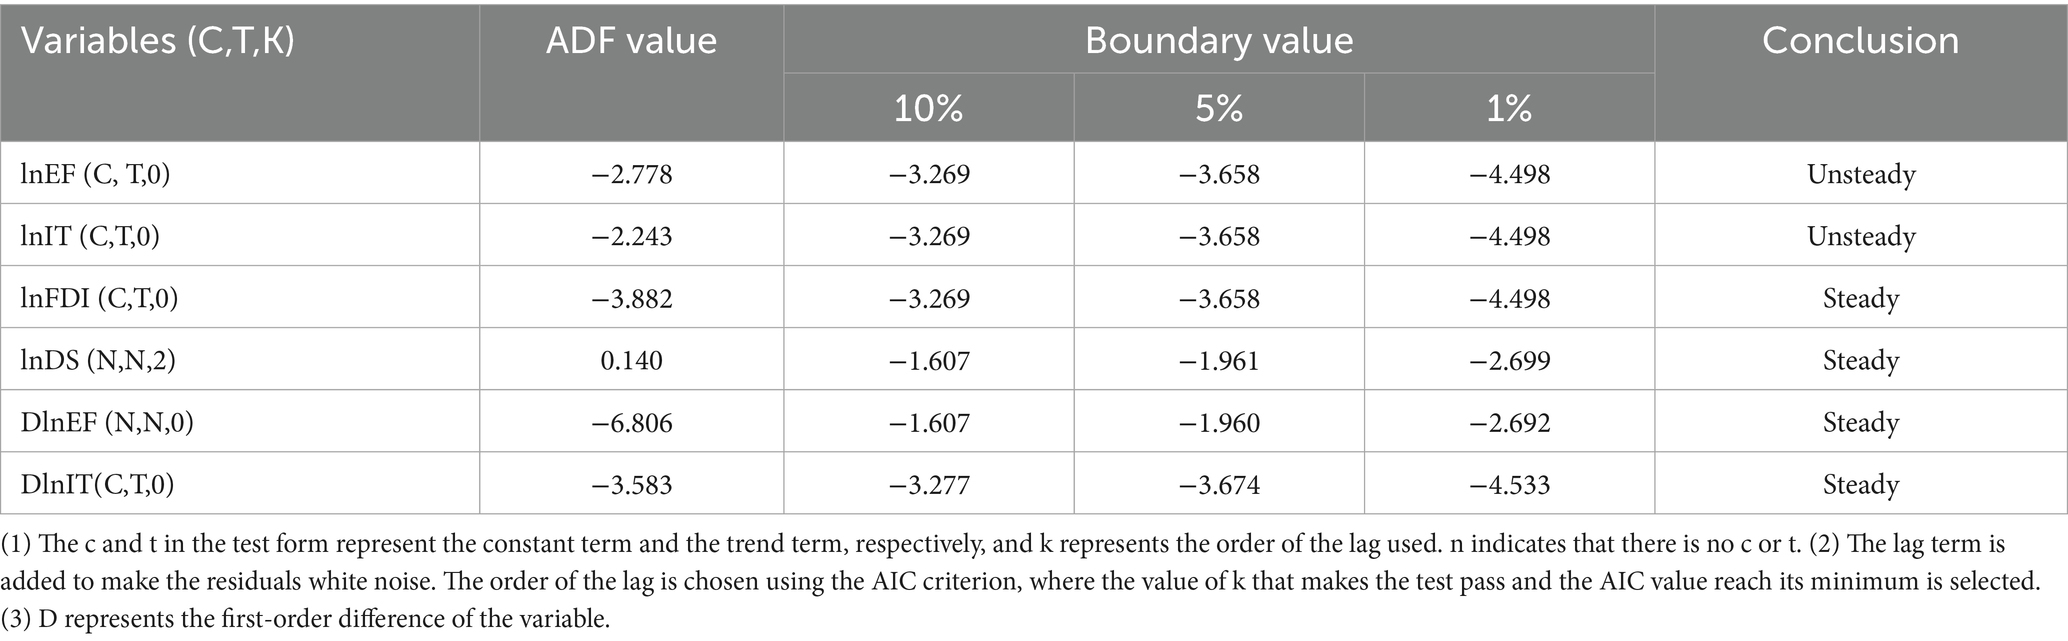
Table 5. ADF test results.
Co-integration test and analysis
ARDL-ECM model was used to analyze the relationship between long-term equilibrium and short-term dynamic adjustment among variables, and the results were shown in Table 6.
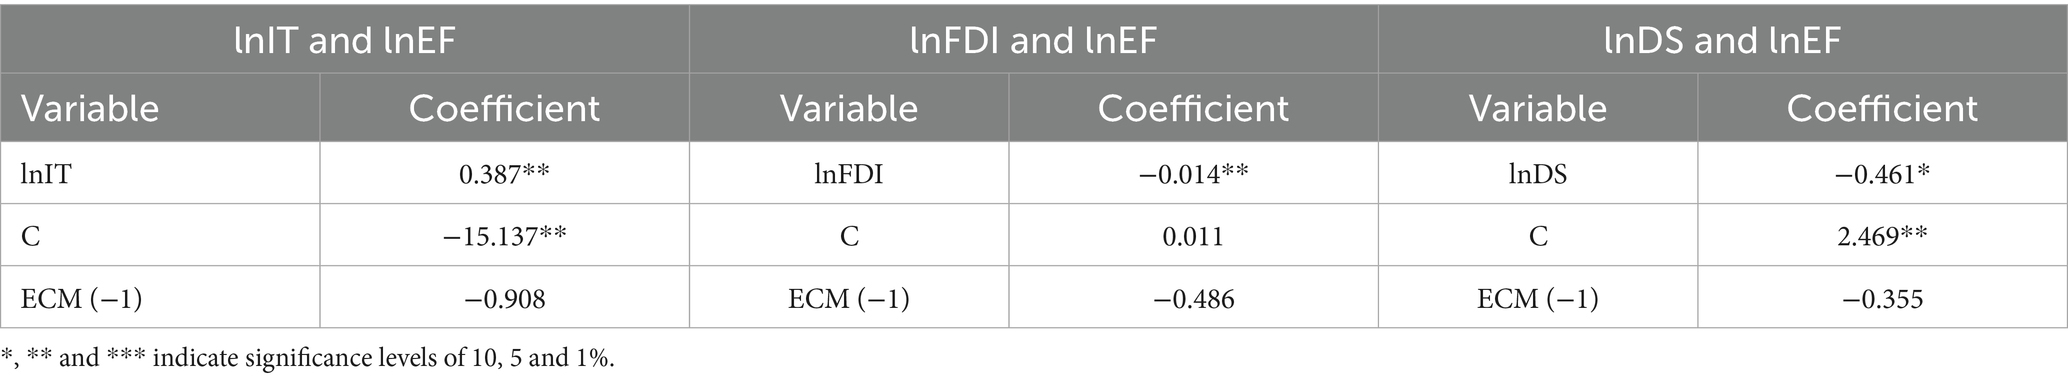
Table 6. ARDL-ECM model.
The ARDL model was established for international trade (lnIT) and ecological footprint (lnEF), and the optimal lag order was determined by SIC. The optimal model was ARDL (5,5), and the R-squared of the regression result was 0.973, indicating a good fit. The lnIT coefficient is significantly positive, indicating that in the long run, the increase of international trade can raise the ecological footprint per capita in Bhutan, and the lnEF increases by 0.387% for every 1% increase in lnIT. Based on the estimation of the long-term co-integration relationship, a short-term error correction model was established to analyze the short-term dynamic relationship between international trade and Bhutan’s per capita ecological footprint. It can be seen that when the short-term fluctuation deviates from the long-term equilibrium, the actual value should be adjusted to the equilibrium value at a rate of 90.8% in the next period.
The optimal model between foreign direct investment (lnFDI) and ecological footprint (lnEF) is ARDL (1,0). In the long run, the increase of foreign direct investment can reduce the level of ecological footprint per capita in Bhutan. Every 1% increase in lnFDI, lnEF decreases by 0.014%. When the short-term fluctuation deviates from the long-term equilibrium, the actual value needs to be adjusted to the equilibrium value at a rate of 48.6% in the next period.
The optimal co-integration model of demographic structure (lnDS) and ecological footprint (lnEF) is ARDL (1,0), and the coefficient is significantly negative. It can be seen that the change of demographic structure can also reduce the ecological footprint level per capita in Bhutan, and the deviation caused by short-term shocks will recover to the long-term equilibrium level at a faster rate of 35.5%.
Model stability test
The CUSUM test was adopted to diagnose whether the model parameters were stable (whether there were structural mutations). As shown in Figure 2, the CUSUMS statistic consistently operates within the banded area formed by two confidence boundaries (it does not break through the upper or lower boundaries), indicating that the null hypothesis is accepted at the 5% significance level. This means that the model is stable throughout the entire sample period.
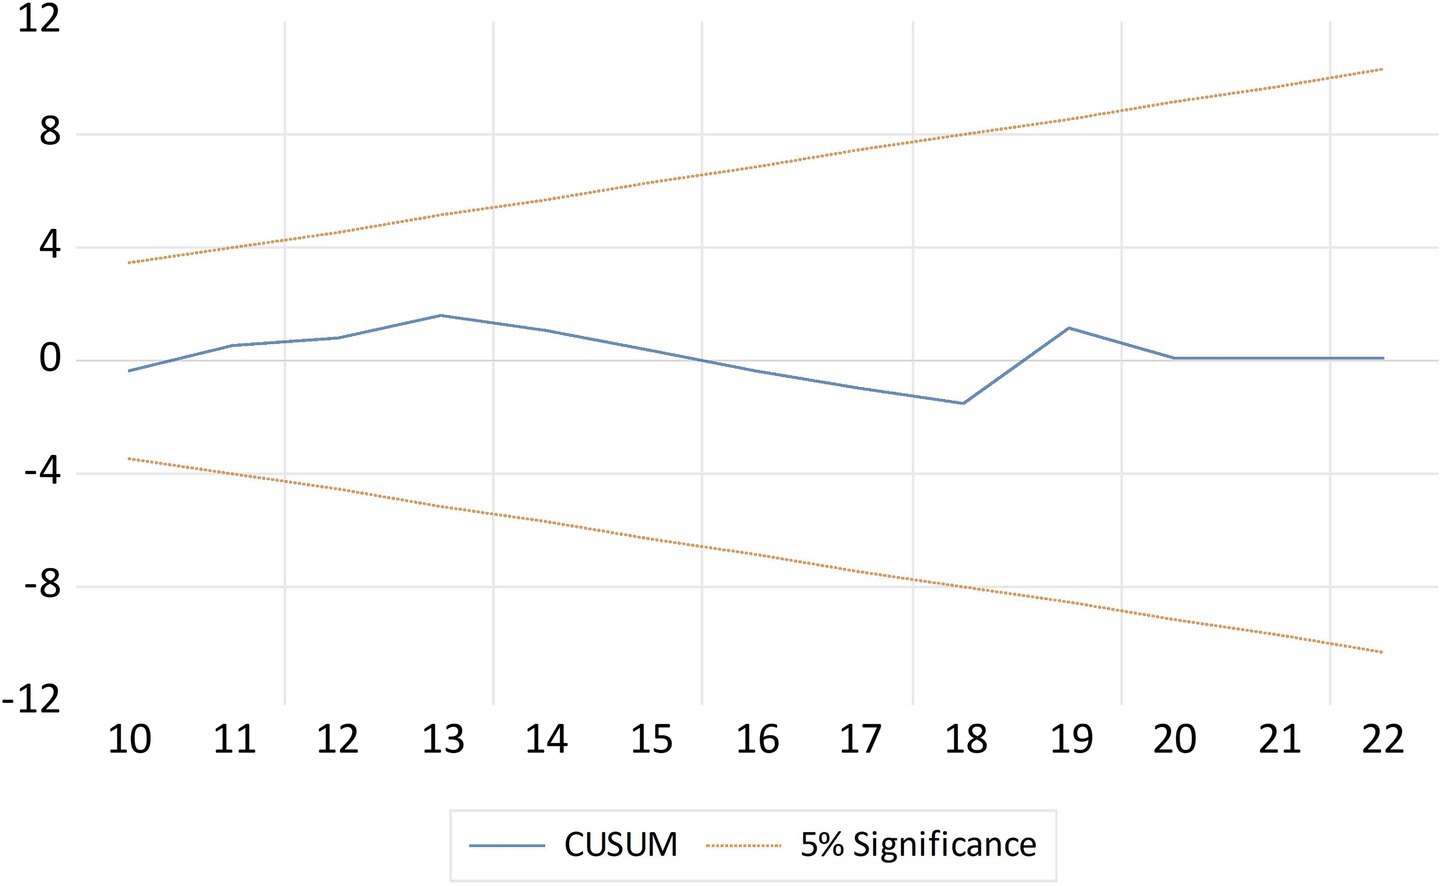
Figure 2. CUSUM test results.
Granger causality test
Granger causality test was used to analyze the internal relationship between variables (Table 7). In general, the results of Granger causality test are consistent with the results of ARDL long-term co-integration relationship test, which can confirm each other, reflecting the scientificity and reliability of the combined research of co-integration relationship and Granger causality test.
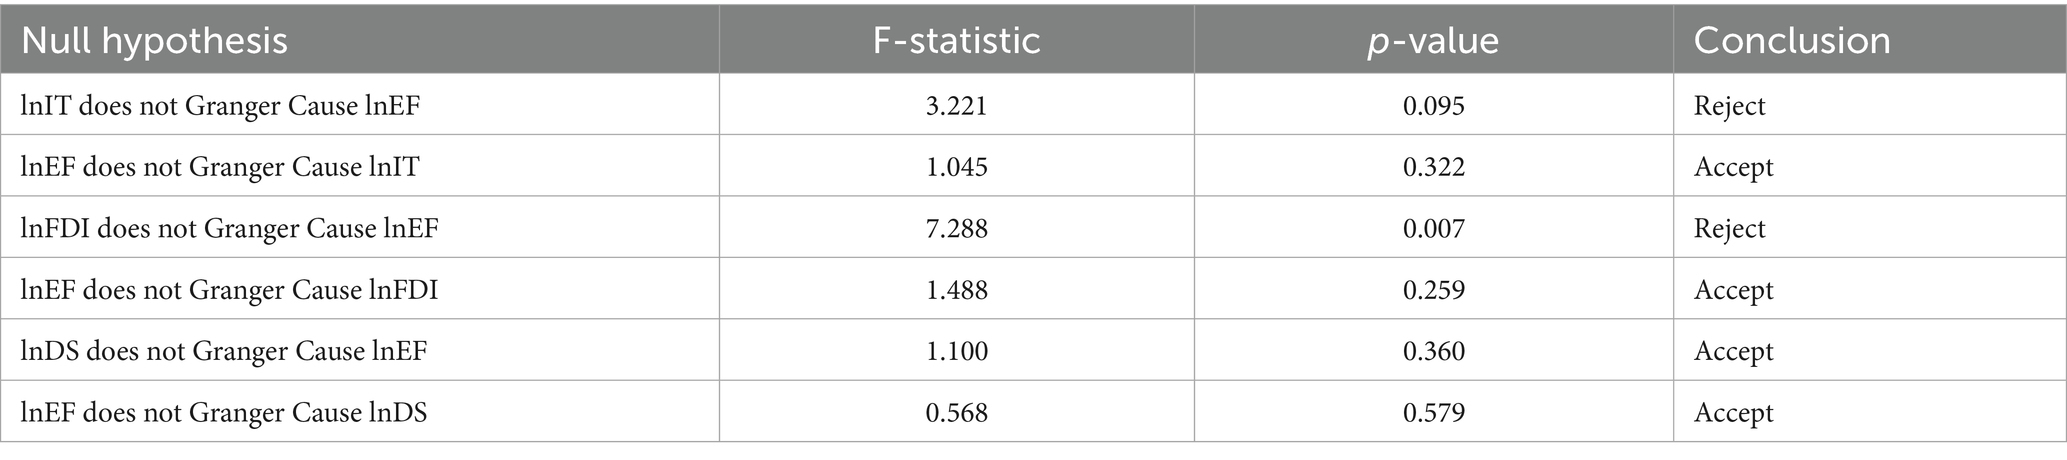
Table 7. Granger causality test results.
Conclusions and implications
Conclusion
Based on the perspective of environmental quality of human well-being, this study assesses the impact of international trade, foreign direct investment, and demographics structure on Bhutan’s per capita ecological footprint from 2002 to 2022. ARDL-ECM model was used to analyze the relationship among variables, and the following conclusions are drawn:
(1) Ecological Footprint Trends: From 2002 to 2022, Bhutan’s per capita ecological footprint exhibited a steadily increasing trend, while its per capita biocapacity and per capita ecological surplus showed a continuous decline. This indicates a gradual deterioration in Bhutan’s ecological and environmental quality over time.
(2) Relationship between International Trade and Environmental Quality: In the long term, increased international trade raises Bhutan’s ecological footprint per capita. When short-term fluctuations deviate from the long-term equilibrium, adjustments toward equilibrium occur rapidly at a rate of 90.8% in the following period. Overall, increased international trade tends to negatively impact Bhutan’s environmental quality.
(3) Relationship between Foreign Direct Investment (FDI) and Environmental Quality: In the long run, increasing foreign direct investment contributes to lowering Bhutan’s ecological footprint per capita. Short-term deviations from equilibrium adjust to equilibrium values at a rate of 48.6% in the subsequent period. Overall, increased foreign direct investment positively influences Bhutan’s environmental quality.
(4) Relationship between Demographic Structure and Environmental Quality: Over the long term, changes in demographic Structure reduce Bhutan’s ecological footprint per capita, and short-term disturbances return to equilibrium at a relatively quick pace of 35.5%. Thus, demographic Structure changes positively impact Bhutan’s environmental quality.
Policy implications
Based on the above findings, this study provides the following references for policy makers when formulating relevant strategies:
(1) The excessive use of fossil fuels is a primary cause of declining environmental quality. Thus, reducing dependency on fossil fuels can lower ecological footprint, thereby improving environmental quality. However, the majority of developing countries inevitably overuse fossil fuels during industrialization and urbanization processes, making it difficult to reduce reliance on fossil fuels internally. Therefore, initiating regional cooperation to promote international trade, especially through cross-border renewable energy trade, actively introducing international advanced technology and management experience, vigorously developing the trade of green products are crucial to address multi-faceted environmental adversities. Moreover, it is necessary to overcome barriers that hinder trade between neighboring countries, resolve external conflicts among nations, foster regional cooperation and trade, gradually reduce dependency on fossil fuels, and achieve sustainable environmental development.
(2) It is crucial to focus on technological development and investment related to the environment to mitigate the negative impacts of foreign direct investment inflows on the environment. The inflow of foreign direct investment, especially from countries rich in renewable resources to those dependent on fossil fuels, can generate a technology spillover effect, aiding in lowering the barriers to renewable energy technology development. Moreover, there should also be an improvement in the foreign investment introduction mechanism, raising the entry threshold for foreign investments, with a preference for high value-added, low-pollution, technology innovation enterprises, and an emphasis on the application of renewable energy technologies, thereby contributing to environmental protection.
(3) Furthermore, attention must be paid to structural transformation in the industrial sector when implementing population policies and environmental regulations, especially in terms of energy efficiency and clean technologies, which are essential for improving environmental quality. Establish a sustainable youth employment framework that promotes environmentally friendly job opportunities and allocate dedicated funding to support young individuals returning to their hometowns to engage in low-impact industries. Integrate ecological awareness into the national education curriculum by incorporating traditional environmental conservation practices into formal schooling. Leverage the strengths of Bhutan’s matriarchal traditions by implementing sustainable textile training programs and household energy management initiatives for women. Mobilize healthy senior citizens over the age of 60 to participate in low-intensity environmental protection activities, thereby effectively utilizing the human resources of the elderly population.
(4) The majority of rulers around the world claim to enhance the well-being of their citizens, but very few can truly achieve it. However, Bhutan has not only implemented a Gross National Happiness development model but has also achieved success with it. For China, Bhutan’s development model is highly noteworthy. Over the past 40 years of reform and opening-up, alongside the “Chinese miracle,” the “Chinese puzzle” has gradually emerged. In the process of rapid economic development, the life satisfaction of the Chinese people has been decreasing year by year (Brockmann et al., 2009). In the past decade, the issue of happiness has been placed on the agenda of China’s government governance and has received great attention. Therefore, although small, Bhutan is worth learning from.
Research limitations
Despite being the first to assess the relationships between international trade, foreign direct investment (FDI), demographic Structure, and Bhutan’s per capita ecological footprint, this study has several limitations. First, in addition to international trade, foreign direct investment and demographic structure, other important variables such as technological advancement, energy structure, and environmental regulations may also impact Bhutan’s per capita ecological footprint and environmental quality, warranting further research. Second, the study focuses solely on Bhutan. While this allows for an in-depth understanding of Bhutan’s specific context, the absence of comparative analyses with similar countries or regions limits the generalizability and applicability of the findings.
Data availability statement
Publicly available datasets were analyzed in this study. This data can be found at: https://data.worldbank.org.cn/.
Author contributions
ZY: Funding acquisition, Writing – original draft. HW: Writing – original draft. HC: Methodology, Writing – review & editing. YY: Writing – review & editing.
Funding
The author(s) declare that financial support was received for the research and/or publication of this article. The study was by the 2024 National Social Science Fund Project of China. “Research on the Economic Promotion of Common Prosperity for All Ethnic Groups along the Border at Southwest Land Border Ports” (Grant No: 24CMZ036, Zhu Ye).
Conflict of interest
The authors declare that the research was conducted in the absence of any commercial or financial relationships that could be construed as a potential conflict of interest.
Generative AI statement
The author(s) declare that no Gen AI was used in the creation of this manuscript.
Publisher’s note
All claims expressed in this article are solely those of the authors and do not necessarily represent those of their affiliated organizations, or those of the publisher, the editors and the reviewers. Any product that may be evaluated in this article, or claim that may be made by its manufacturer, is not guaranteed or endorsed by the publisher.
Footnotes
1. ^Source: Downloaded from http://www.mindpowernews.com/HappinessMap.htm [18 November 2012].
2. ^Data from Bhutan Country Profile, Ministry of Foreign Affairs of the People’s Republic of China, 2022.6.
References
Ajmi, A. N., and Inglesi-Lotz, R. (2021). Revisiting the Kuznets curve hypothesis for Tunisia: carbon dioxide vs. ecological footprint. Energy Sources Part B Econ. Plann. Policy. 16, 406–419. doi: 10.1080/15567249.2020.1850923
Ali, W., Abdullah, A., and Azam, M. (2016). The dynamic linkage between technological innovation and carbon dioxide emissions in Malaysia: an autoregressive distributed lagged bound approach. Int. J. Energy Econ. Policy 6, 389–400. Available at: https://econpapers.repec.org/article/ecojourn2/2016-03-4.htm
Alola, A. A., Arikewuyo, A. O., Ozad, B., Alola, U. V., and Arikewuyo, H. O. (2020). A drain or drench on biocapacity? Environmental account of fertility, marriage, and ICT in the USA and Canada. Environ. Sci. Pollut. Res. 27, 4032–4043. doi: 10.1007/s11356-019-06719-1
Anderson, J. R. (1992). Automaticity and the ACT theory. Am. J. Psychol. 105, 165–180. doi: 10.2307/1423026
Anderson, K., and Blackhurst, R. (1992). The greening of world trade issues, xviii–276. New Jersey: Prentice-Hall.
Ang, J. B. (2009). CO2 emissions, research and technology transfer in China. Ecol. Econ. 68, 2658–2665. doi: 10.1016/j.ecolecon.2009.05.002
Antweiler, W., Copeland, B. R., and Taylor, M. S. (2001). Is free trade good for the environment? Am. Econ. Rev. 91, 877–908. doi: 10.1257/aer.91.4.877
Bakhsh, K., Rose, S., Ali, M. F., Ahmad, N., and Shahbaz, M. (2017). Economic growth, CO2 emissions, renewable waste and FDI relation in Pakistan: new evidences from 3SLS. J. Environ. Manag. 196, 627–632. doi: 10.1016/j.jenvman.2017.03.029
Basinger, S. J., and Hallerberg, M. (2004). Remodeling the competition for capital: how domestic politics erases the race to the bottom. Am. Polit. Sci. Rev. 98, 261–276. doi: 10.1017/S0003055404001133
Biçen, Ö. F., and Çoban, M. N. (2024). G-7 ülkelerinde ekonomik özgürlük ile ekolojik ayak izi ilişkisi: QRPD yöntemi ile analiz. Kafkas Üniversitesi İktisadi ve İdari Bilimler Fakültesi Dergisi 15, 163–187. doi: 10.36543/kauiibfd.2024.007
Birdsall, N., and Wheeler, D. (1993). Trade policy and industrial pollution in Latin America: where are the pollution havens? J. Environ. Dev. 2, 137–149. doi: 10.1177/107049659300200107
Brockmann, H., Delhey, J., Welzel, C., and Yuan, H. (2009). The China puzzle: falling happiness in a rising economy. J. Happiness Stud. 10, 387–405. doi: 10.1007/s10902-008-9095-4
Brueckner, J. K. (2000). Welfare reform and the race to the bottom: theory and evidence. South. Econ. J. 66, 505–525. doi: 10.2307/1061423
Chai, J. C. (2002). Trade and environment: evidence from China's manufacturing sector. Sustain. Dev. 10, 25–35. doi: 10.1002/sd.174
Cherniwchan, J. (2017). Trade liberalization and the environment: evidence from NAFTA and US manufacturing. J. Int. Econ. 105, 130–149. doi: 10.1016/j.jinteco.2017.01.005
Chichilnisky, G. (2017). North–south trade and the global environment In: G. Chichilnisky, Ed. (London: Routledge), 261–284. doi: 10.4324/9781315201986-19
Copeland, B. R., and Taylor, M. S. (1995). Trade and the environment: a partial synthesis. Am. J. Agric. Econ. 77, 765–771. doi: 10.2307/1243249
Dalton, M., o'Neill, B., Prskawetz, A., Jiang, L., and Pitkin, J. (2008). Population aging and future carbon emissions in the United States. Energy Econ. 30, 642–675. doi: 10.1016/j.eneco.2006.07.002
Daly, H. E. (1993). The perils of free trade. Sci. Am. 269, 50–57. doi: 10.1038/scientificamerican1193-50
Dean, J. M. (1992). Trade and the environment: A survey of the literature. Washington: Policy Research Working Paper Series.
Dean, J. M. (2002). Does trade liberalization harm the environment? A new test. Can. J. Econ./Rev. Can. Econ. 35, 819–842. doi: 10.1111/0008-4085.00155
Dhume, P. (2020). Effect of FDI on economic growth of least developing countries-evidence from Bhutan
Dong, K., and Bai, B. (2015). Examining the pollution paradise effect of interregional industrial transfer in China. Chin. Popul. Resour. Environ. 25, 46–50. Available at: https://kns.cnki.net/kcms2/article/abstract?v=oWJgMrFo8ucAxzy-HtzzjMgQW56VTaN6V1_3kzAwEYCw2f7dSxE20bpzIWAvUeizolKGAOYS5_RQSljXPs3j7A_56PRBZvCBUSjT9N9tp5_u_hQ-kIEQ1qpq7FEYUaMgg0C5IszBqwVU-ouqPHcblFwGccr3fSniunVyIUMCW0X0U25slhJrpg==&uniplatform=NZKPT&language=CHS
Doytch, N. (2020). The impact of foreign direct investment on the ecological footprints of nations. Environ. Sustain. Indic. 8:100085. doi: 10.1016/j.indic.2020.100085
Du, B., and Yu, G. S. (2016). Impact of foreign direct investment on environmental pollution in China. Enviro. Econ. Res. 2, 25–35. doi: 10.19511/j.cnki.jee.2016.02.003
Easterlin, R. A. (2004). The economics of happiness. Daedalus 133, 26–33. doi: 10.1162/001152604323049361
Fan, H. M., and Mu, H. H. (2017). Study on the impact mechanism of population aging on environmental quality. J. Guangdong Univ. Finan. Econ. 32, 41–52. Available at: https://kns.cnki.net/kcms2/article/abstract?v=oWJgMrFo8udtaXbrsfYwyoOo059jM9YETLuYxNdYi6NudAN18FcQtpwmm2LEvDRcFUYeFBlo9dHwwPFW_flFz48iZZqMlcRWJqffboyTRSZXU40x7wOHOgl-cAGzZ1uCMmM8AZKTTq7b3uTuckACY1kWaEMN8sWa2S1ojoupsnUADZjv5QE4-Q==&uniplatform=NZKPT&language=CHS
Feridun, M., Ayadi, F. S., and Balouga, J. (2006). Impact of trade liberalization on the environment in developing countries: the case of Nigeria. J. Dev. Soc. 22, 39–56. doi: 10.1177/0169796X06062965
Forslid, R., Okubo, T., and Ulltveit-Moe, K. H. (2018). Why are firms that export cleaner? International trade, abatement and environmental emissions. J. Environ. Econ. Manag. 91, 166–183. doi: 10.1016/j.jeem.2018.07.006
Frankel, J. A., and Rose, A. K. (2005). Is trade good or bad for the environment? Sorting out the causality. Rev. Econ. Stat. 87, 85–91. doi: 10.1162/0034653053327577
Gokmenoglu, K. K., Taspinar, N., and Rahman, M. M. (2021). Military expenditure, financial development and environmental degradation in Turkey: a comparison of CO2 emissions and ecological footprint. Int. J. Financ. Econ. 26, 986–997. doi: 10.1002/ijfe.1831
Goretti, M. M., Kihara, M. D., Salgado, M. R. M., and Gulde, M. A. M. (2019). Is South Asia ready for take off?: a sustainable and inclusive growth agenda. Int. Monetary Fund. Washington. 2019. doi: 10.5089/9781513507538.087
Grey, K., and Brank, D. (2002). Environmental issues in policy-based competition for investment: a literature review. Ecol. Econ. 11, 71–81.
He, J. (2006). Pollution haven hypothesis and environmental impacts of foreign direct investment: the case of industrial emission of sulfur dioxide (SO2) in Chinese provinces. Ecol. Econ. 60, 228–245. doi: 10.1016/j.ecolecon.2005.12.008
Hoffmann, R., Lee, C. G., Ramasamy, B., and Yeung, M. (2005). FDI and pollution: a granger causality test using panel data. J. Int. Dev. 17, 311–317. doi: 10.1002/jid.1196
Huo, W., Li, J., and Chen, R. (2019). Green development and FDI environmental effects: from "pollution paradise" to "pollution halo". J. Econ. Econ. 4, 106–119. Available at: https://kns.cnki.net/kcms2/article/abstract?v=oWJgMrFo8uceN-rv0Qzs0PfbaYmabcHzCuJ131jFiFzNy3UXCzQjoq7m2eo_c5FrT7bJws6McvMph5VO5deVYlRP0DfDZAsICAKrMxAgOoBlgRk0pwfU1eqTvSN3kjFBwD6XR1HYp8dA_Ta2bPhxD0HR8v9KYpZoKfX4iqSI0srN8wDq0WQiaQ==&uniplatform=NZKPT&language=CHS
Jackson, T. (2009). Prosperity without growth?: The transition to a sustainable economy. London: Sustainable Development Commission.
Jaffe, A. B., Peterson, S. R., Portney, P. R., and Stavins, R. N. (1995). Environmental regulation and the competitiveness of US manufacturing: what does the evidence tell US? J. Econ. Lit. 33, 132–163.
Jayadevappa, R., and Chhatre, S. (2000). International trade and environmental quality: a survey. Ecol. Econ. 32, 175–194. doi: 10.1016/S0921-8009(99)00094-4
Khor, M. (2001). The proposed new issues in the WTO and the interests of developing countries. Malaysia: Third World Network.
Kukla-Gryz, A. (2009). Economic growth, international trade and air pollution: a decomposition analysis. Ecol. Econ. 68, 1329–1339. doi: 10.1016/j.ecolecon.2008.09.005
Le, T. H., Chang, Y., and Park, D. (2016). Trade openness and environmental quality: international evidence. Energy Policy 92, 45–55. doi: 10.1016/j.enpol.2016.01.030
Li, M., and Lu, C. (2023). Spatio-temporal evolution of ecological footprint in Shandong province based on parameter adjustment. J. Southwest Forestry Univ. (Soc. Sci.) 7, 66–74. Available at: https://kns.cnki.net/kcms2/article/abstract?v=oWJgMrFo8ueWIc9su-i0AbFs34IZly90tdjljRgPTK6fc5Mwh5AF6Qyuopvz76gnMDqrGZ_A7H18L7puBMUNv161SREFXNJkDB-42WP27SdDKTxp_f6uU9m5kXIwQh94gCve8OvWhPztBeMOHQD1aZDxz4eE7reV7pcmPSDQeyiTgA7DKinDdw==&uniplatform=NZKPT&language=CHS
Li, Kai, and Qi, Shaozhou. (2011). Trade opening, economic growth and carbon dioxide emissions in China. J. Econ. Res., 46,60–72+102. Available at: https://kns.cnki.net/kcms2/article/abstract?v=oWJgMrFo8uew99cn1qJJoANtFq2LKbv21480SHnOl0IXDfkmNvrs343kMCjmCEdIxJWCIiTNLxrE1IBy1HR3B4GZv97HXb0VtkuMa7S_TG47bas5slw2HH5ES2RN2x-4h2ua1Hd8fPcUxqQVfJ5RvDCvUAyANPfRXg6NUnOcwU0xL_1PwuHngg==&uniplatform=NZKPT&language=CHS
Liang, F. H. (2014). Does foreign direct investment harm the host country’s environment? evidence from china Current topics manag. 17, 105–121.
Liu, Y., Chang, X., and Huang, C. (2022). Analysis of the impact of economic growth, industrial structure, and population structure on carbon emissions in China. Manag. Modernization 42, 15–20. doi: 10.19634/j.cnki.11-1403/c.2022.04.003
Liu, M. C., Wang, B., and Li, W. H. (2010). Scenario analysis of China's future development based on ecological footprint model. Resour Sci 32, 163–170. Available at: https://kns.cnki.net/kcms2/article/abstract?v=oWJgMrFo8ucIKTDvH5EKYRpvgBjGVh076J2lClQh3xoplcgFy96CXZUuXEOK0QWXTmNAARNweWK7KP3xrRiRPBhN_dABAygYP4Zr1YwYETCn5GMrYzrN0AzLKjgmlo6UiM4ekXpi-y7yMg_e-2h5RcCV7MM_61se-45hif0JTKkHhiQX-Lglvg==&uniplatform=NZKPT&language=CHS
Liu, Y. D., and Zhang, J. (2011). Dynamic model analysis of the impact of international trade on environmental pollution in developing countries. Econ. Sci. 3, 79–92. doi: 10.19523/j.jjkx.2011.03.008
Lu, Y. (2012). Environmental pollution from the perspective of open macro: a review. J. Econ. Res. 47, 146–158. Available at: https://kns.cnki.net/kcms2/article/abstract?v=oWJgMrFo8uejfmjfDOxWu9MAMV4yzsLGj9EaHTrcQglgqcEUI98JWz_V-OzLpp9Kx5oAvCPeQGyNAmk0Buhgdm2LfvCztPAy6rA-4sNeXy-xDWMvEhlldRGMkueTB2z71HoZjV7OptJi4C6B7saeHkKR086IfBsVAhizBGJstA0M511qdaCJcA==&uniplatform=NZKPT&language=CHS
Lu, W. C. (2020). The interplay among ecological footprint, real income, energy consumption, and trade openness in 13 Asian countries. Environ. Sci. Pollut. Res. 27, 45148–45160. doi: 10.1007/s11356-020-10399-7
Machado, G., Schaeffer, R., and Worrell, E. (2001). Energy and carbon embodied in the international trade of Brazil: an input–output approach. Ecol. Econ. 39, 409–424. doi: 10.1016/S0921-8009(01)00230-0
Managi, S. (2004). Trade liberalization and the environment: carbon dioxide for 1960-1999. Econ. Bull. 17, 1–5. Available at: https://www.accessecon.com/pubs/eb/2004/volume17/EB-03Q20005A.pdf
Managi, S., Hibiki, A., and Tsurumi, T. (2009). Does trade openness improve environmental quality? J. Environ. Econ. Manag. 58, 346–363. doi: 10.1016/j.jeem.2009.04.008
Mukhopadhyay, K., and Chakraborty, D. (2005). Environmental impacts of trade in India. Int. Trade J. 19, 135–163. doi: 10.1080/08853900590933116
Murshed, M. (2018). Does improvement in trade openness facilitate renewable energy transition? Evidence from selected south Asian economies. South Asia Econ. J. 19, 151–170. doi: 10.1177/1391561418794691
Murshed, M., Apergis, N., Alam, M. S., Khan, U., and Mahmud, S. (2022a). The impacts of renewable energy, financial inclusivity, globalization, economic growth, and urbanization on carbon productivity: evidence from net moderation and mediation effects of energy efficiency gains. Renew. Energy 196, 824–838. doi: 10.1016/j.renene.2022.07.012
Murshed, M., Nurmakhanova, M., Al-Tal, R., Mahmood, H., Elheddad, M., and Ahmed, R. (2022b). Can intra-regional trade, renewable energy use, foreign direct investments, and economic growth mitigate ecological footprints in South Asia? Energy Sources Part B Econ. Plann. Policy 17:2038730. doi: 10.1080/15567249.2022.2038730
Nair, C. (2011). Consumptionomics: Asia's role in reshaping capitalism and saving the planet. Oxford: Infinite Ideas.
Okunol, A. M., Nathaniel, S. P., and Festus, V. B. (2018). Revisiting population growth and food production nexus in Nigeria: an ARDL approach to cointegration. Agric. Resour. Econ. Int. Sci. E-J. 4, 41–51. doi: 10.22004/ag.econ.281759
Organisation for Economic Co-operation and Development. (2012). How's life?: Measuring well-being (M. Hong, M. Liu, & W. He, Trans.). Beijing: Xinhua Publishing House.
Ozkan, O., Coban, M. N., Iortile, I. B., and Usman, O. (2023). Reconsidering the environmental Kuznets curve, pollution haven, and pollution halo hypotheses with carbon efficiency in China: a dynamic ARDL simulations approach. Environ. Sci. Pollut. Res. 30, 68163–68176. doi: 10.1007/s11356-023-26671-5
Pei, J., Sturm, B., and Yu, A. (2021). Are exporters more environmentally friendly? A re-appraisal that uses China’s micro-data. World Econ. 44, 1402–1427. doi: 10.1111/twec.13024
Peng, S., and Zhang, W. (2016). International trade and climate change: a literature review. World Econ. 39, 167–192. doi: 10.19985/j.cnki.cassjwe.2016.02.009
Perkins, R., and Neumayer, E. (2009). Transnational linkages and the spillover of environment-efficiency into developing countries. Glob. Environ. Chang. 19, 375–383. doi: 10.1016/j.gloenvcha.2009.05.003
Polanyi, K. (2001). The great transformation: The political and economic origins of our time. Boston: Beacon press.
Ponce, P., Álvarez-García, J., Álvarez, V., and Irfan, M. (2023). Analysing the influence of foreign direct investment and urbanization on the development of private financial system and its ecological footprint. Environ. Sci. Pollut. Res. 30, 9624–9641. doi: 10.1007/s11356-022-22772-9
Rees, W. E. (1992). Ecological footprints and appropriated carrying capacity: what urban economics leaves out. Environ. Urban. 4, 121–130. doi: 10.1177/095624789200400212
Revesz, R. L. (1992). Rehabilitating interstate competition: rethinking the race-to-the-bottom rationale for federal environmental regulation. NYUL Rev. 67:1210.
Sabir, S., and Gorus, M. S. (2019). The impact of globalization on ecological footprint: empirical evidence from the south Asian countries. Environ. Sci. Pollut. Res. 26, 33387–33398. doi: 10.1007/s11356-019-06458-3
Shapiro, J. S. (2016). Trade costs, CO2, and the environment. Am. Econ. J. Econ. Pol. 8, 220–254. doi: 10.1257/pol.20150168
Sharma, R., Sinha, A., and Kautish, P. (2020). Examining the impacts of economic and demographic aspects on the ecological footprint in south and southeast Asian countries. Environ. Sci. Pollut. Res. 27, 36970–36982. doi: 10.1007/s11356-020-09659-3
Shen, L. S., and Tang, Z. (2008). The impact of foreign trade on pollution emission in China: a case study of sulfur dioxide emission. Manag. World 6, 21–29+187. doi: 10.19744/j.cnki.11-1235/f.2008.06.004
Shi, Z., Shao, J., and Wang, M. (2017). The spatial-temporal conduction effect of foreign direct investment on haze pollution: an empirical analysis based on SpVAR model. Int. Trade Issues, 107–117. doi: 10.13510/j.cnki.jit.2017.09.010
Shui, B., and Harriss, R. C. (2006). The role of CO2 embodiment in US–China trade. Energy Policy 34, 4063–4068. doi: 10.1016/j.enpol.2005.09.010
Solarin, S. A., Al-Mulali, U., Musah, I., and Ozturk, I. (2017). Investigating the pollution haven hypothesis in Ghana: an empirical investigation. Energy 124, 706–719. doi: 10.1016/j.energy.2017.02.089
Tachie, A. K., Xingle, L., Dauda, L., Mensah, C. N., Appiah-Twum, F., and Adjei Mensah, I. (2020). The influence of trade openness on environmental pollution in EU-18 countries. Environ. Sci. Pollut. Res. 27, 35535–35555. doi: 10.1007/s11356-020-09718-9
Udemba, E. N. (2020). Mediation of foreign direct investment and agriculture towards ecological footprint: a shift from single perspective to a more inclusive perspective for India. Environ. Sci. Pollut. Res. 27, 26817–26834. doi: 10.1007/s11356-020-09024-4
Wackernagel, M., and Rees, W. (1998). Our ecological footprint: Reducing human impact on the earth, vol. 9. Philadelphia: New society Publishers.
Wang, H., Dong, C., and Liu, Y. (2019). Beijing direct investment to its neighbors: a pollution haven or pollution halo effect? J. Clean. Prod. 239:118062. doi: 10.1016/j.jclepro.2019.118062
Wang, M., and Xu, K. (2015). The dynamic relationship between trade openness, economic growth and carbon dioxide emissions in China: an empirical study based on global vector autoregressive model. Chin. Popul. Resour. Environ. 25, 52–58. Available at: https://kns.cnki.net/kcms2/article/abstract?v=oWJgMrFo8uc4yR7PteXncDesFvO7NbzDG7-my1dEk4ffU3M-XWzBMbdipKazrK_77Jn19Uk6_Lt3yhEkEI_rh22KhkRSqvosqQ1pGAA7zx3z-tiQxMzARghJF5XKwGECGkD-G4-5_BjpDkNGtd_lztXbmrDpGozLZbPJPZPaqgz6z-GlNxycQg==&uniplatform=NZKPT&language=CHS
Wijayatunga, P. (2013). An overview of energy cooperation in South Asia. Manila: Asian Development bank.
Xu, H. L., and Deng, Y. P. (2012). Economic growth, FDI and environmental pollution: analysis on the spatial heterogeneity model. Financ. Econ. 9, 57–64. Available at: https://kns.cnki.net/kcms2/article/abstract?v=oWJgMrFo8ufg_fFOrjeBTWNsCa2hxe8ijrwXcQKLPSSiZiXXzz06rViTxty5RJJUdxAipm42PUrWd4qv2F471AIhwbsducSzqGeQzqYq6LXFX9t8ok9sdlBXQVfIRjR_Z8Qdv2K-YG8QVbcWpJm8ySAxAritAl-MRcLggEQ0A28AwX73vFWD2g==&uniplatform=NZKPT&language=CHS
Yang, Z., and Tian, L. (2017). An inter-provincial study on the hypothesis of "pollution paradise" and its influencing factors. World Econ. 40, 148–172. doi: 10.19985/j.cnki.cassjwe.2017.05.008
Yang, H., Yu, J., Su, C. H., Chen, M. H., and Zhou, D. (2020). Can China’s aging population sustain its entrepreneurship? Evidence of nonlinear effects. Sustain. For. 12:3434. doi: 10.3390/su12083434
Yu, Y., Deng, Y. R., and Chen, F. F. (2018). Impact of population aging and industrial structure on CO2 emissions and emissions trend prediction in China. Atmos. Pollut. Res. 9, 446–454. doi: 10.1016/j.apr.2017.11.008
Zeng, K., and Eastin, J. (2007). International economic integration and environmental protection: the case of China. Int. Stud. Q. 51, 971–995. doi: 10.1111/j.1468-2478.2007.00485.x
Keywords: Bhutan, international trade, foreign direct investment, demographic structure, ecological footprint
Citation: Ye Z, Wang H, Chen H and Yu Y (2025) The impact of international trade, foreign direct investment, and demographic structure on the environmental quality of human well-being: evidence from Bhutan. Front. Hum. Dyn. 7:1602927. doi: 10.3389/fhumd.2025.1602927
Edited by:
Lei Li, Sophia University, JapanReviewed by:
Irina Georgescu, Bucharest Academy of Economic Studies, RomaniaMustafa Necati Çoban, Gaziosmanpaşa University, Türkiye
Aliasuddin Aliasuddin, Syiah Kuala University, Indonesia
Copyright © 2025 Ye, Wang, Chen and Yu. This is an open-access article distributed under the terms of the Creative Commons Attribution License (CC BY). The use, distribution or reproduction in other forums is permitted, provided the original author(s) and the copyright owner(s) are credited and that the original publication in this journal is cited, in accordance with accepted academic practice. No use, distribution or reproduction is permitted which does not comply with these terms.
*Correspondence: Yong Yu, czIxNTgzMzVAc2lzd2EudW0uZWR1Lm15