- 1School of Business, North Minzu University, Yinchuan, China
- 2School of Mathematics and Information Science, North Minzu University, Yinchuan, China
This study investigates the impact of digital literacy and social interaction on relative poverty among Chinese households, based on the 2020 and 2022 China Family Panel Studies (CFPS) data. Through robust econometric analysis, including quantile regression models and threshold quantile regression models, we examine the direct effects and threshold effects of digital literacy, social interaction on household relative poverty. Our research considers six dimensions, such as income, education, health, living conditions, social security and subjective evaluations, and constructs a household relative poverty index under both national and provincial poverty standards. Our findings indicate that improvements in digital literacy and social interaction contribute to alleviating relative poverty across different poverty lines and quantiles. The enhancement of digital literacy and social interaction significantly supports in improving their relative poverty status, but has a lesser effect on low-poverty-households. There exists a non-linear relationship, with a threshold, between digital literacy and social interaction on household relative poverty. The threshold effect of digital literacy shows a pattern of initial alleviation followed by an increase, while social interaction exhibits an initial increase followed by a decrease. Improvements in education level and marital status, or a reduction in the proportion of children and elderly in a household, can effectively alleviate relative poverty, with a stronger impact on high-poverty-households. These findings highlight the need for understanding of the role of digital literacy and social interaction in relative poverty study, providing empirical evidence for the formulation of more targeted poverty reduction strategies.
1 Introduction
Poverty has long been a persistent challenge in human society, and its eradication remains a paramount aspiration. The United Nations Sustainable Development Goals (SDGs) prioritize the elimination of all forms of poverty worldwide as their foremost objective. China achieved a comprehensive victory in its fight against poverty in 2020, successfully eliminating absolute poverty (Chen and Ravallion, 2021). Relative poverty, as opposed to absolute poverty, poses a more formidable challenge tasks. Relative poverty is characterized by the deprivation that certain groups experience within the context of a society’s specific productive capacities and at various levels of economic development. It is largely a structural issue associated with regional development disparities, unequal access to public services, and constrained development opportunities for certain populations (Royce, 2009).
As digital technology continuous progresses, the extensive deployment of digital tools is assuming an increasingly vital role in dissolving spatial and temporal constraints, improving service accessibility, and fostering equitable access to development opportunities. For groups mired in relative poverty, the utilization of efficient interactive communication and rapid information technologies can diminish information uncertainty, enabling them to make pivotal decisions concerning household income and everyday life. Given the variations in information acquisition and processing capacities among diverse groups, one must ponder: Does this disparity influence the condition of relative poverty? Furthermore, in what ways does it impact relative poverty? This paper aims to explore these queries by investigating the effects of digital literacy—conceived as the internal household capacity for information processing—and social interaction—conceived as the external capacity for information acquisition—on relative poverty, through the lens of information uncertainty.
Handling uncertain information requires describing, characterizing, and measuring the information, as well as analyzing the changes in uncertain information. In this paper, we investigate the impact mechanisms of digital literacy and social interaction on relative poverty among rural households in China, with particular focus on their nonlinear threshold effects, spanning both the pre- and post-comprehensive poverty alleviation periods. This paper conducts an empirical analysis of relative poverty among Chinese households using the China Family Panel Studies (CFPS) data, within the context of information uncertainty. Digital literacy and social interaction are used as proxy variables for a family’s internal information processing capabilities and external information acquisition capabilities, respectively. The study employs quantile regression model and threshold quantile regression model to validate the mitigating effects of digital literacy and social interaction on relative poverty. It also explains the threshold effects of relative poverty in terms of digital literacy and social interaction from a dynamic perspective, providing theoretical support and practical guidance for alleviating relative poverty among Chinese households. The research indicates that improving external information acquisition and internal information processing capabilities can reduce information uncertainty, effectively mitigating relative poverty. Enhancements in digital literacy and social interaction both contribute to reducing relative poverty. The improvements have a greater impact on families with higher poverty levels and a lesser impact on those with lower poverty levels. There is a non-linear relationship between digital literacy, social interaction, and the levels of relative poverty, with a threshold point for different quantiles. The threshold effect of digital literacy shows a pattern of initially mitigating and then increasing relative poverty, while social interaction exhibits a trend of initially increasing and then mitigating poverty.
2 Background of relative poverty, digital literacy, and social interaction
2.1 Relative poverty
In addressing the conceptualization of relative poverty, Townsend (1979) posits that poverty is contextualized within the societal mean, suggesting that a group’s income is insufficient when it drops below a specific fraction of the societal average. This perspective emphasizes the significance of social comparison and the perception of relative deprivation in the conceptualization of poverty. Sen (1999) extends this view by asserting that poverty is multifaceted, involving not just a lack of adequate income but also constraints on individuals’ ability to achieve their full potential, thereby emphasizing the role of personal experiences and the development of capabilities. As China has successfully eliminated absolute poverty, the fundamental living needs of its households are generally met. Nevertheless, a household is deemed to be in relative poverty if it is unable to adhere to the prevailing social norms, traditions, and standards of living in its community (McLachlan, 2007).
In poverty measurement, Sen (1976) introduced a method for identifying the impoverished by establishing a poverty line and compiling the data on the poor into a comprehensive poverty index. Hagenaars (1987) advanced this approach by developing a multidimensional poverty index that incorporates both income and leisure dimensions. Tsui (2002) further delineated the characteristics of the multidimensional poverty index, including its stability. Bourguignon and Chakravarty (2003) suggested establishing distinct poverty thresholds for each sub-dimension, utilizing factors such as income and education to gauge multidimensional poverty. Alkire and Foster (2011) proposed the dual-cutoff method for identifying multidimensional relative poverty, and employing this A-F method, they assessed multidimensional relative poverty across 104 developing countries (Alkire and Santos, 2014). Scholars have initiated the use of the A-F method to identify and measure relative poverty across various dimensions, including income, education, and health (Shen and Li, 2022; Burchi et al., 2022). Empirical research into the determinants of relative poverty has seen scholars like Fritzell et al. (2015) and Wan et al. (2021) examine the primary factors influencing relative poverty and their impacts.
2.2 Digital literacy
The ability to collect, understand, and process digital resources is integral to the concept of digital literacy, which reflects an individual’s capacity to utilize digital technologies to extract clarity from information and derive benefits from it. Digital literacy has garnered growing recognition as a pivotal element in combating relative poverty. Research indicates that digital literacy can enhance individuals’ ability to access information, engage in the digital economy, and improve their economic welfare. For example, Zhou et al. (2024) discovered that digital literacy can reduce the risk of returning back to poverty, with particularly favorable outcomes for vulnerable groups. Wu (2024) illustrated that digital inequality poses a critical socioeconomic challenge in the reduction of relative poverty, with the digital divide substantially increasing the probability of experiencing relative poverty. Furthermore, the impact of digital literacy on alleviating relative poverty extends beyond economic outcomes. Yang et al. (2024) emphasized that digital literacy promotes the subjective well-being of low-income rural populations through increased income and consumption, significantly enhancing their happiness. Zhang et al. (2024) found that higher levels of digital literacy correlate with a decrease in relative poverty, contributing to greater household prosperity overall. Li and Huang (2025) highlighted that digital literacy actively reduces the incidence of relative poverty, with the poverty-alleviating effects being more pronounced for individuals with advanced digital skills, particularly for low-income families and varying across different regions. These insights suggest that digital literacy is a multifaceted instrument capable of addressing both the economic and social aspects of relative poverty.
2.3 Social interaction
Social interaction has been identified as a key factor in understanding and addressing relative poverty. Research indicates that social networks and community engagement can provide individuals with access to resources, information, and support systems that are crucial for escaping poverty. For example, Manski (2000) points out that individual decision-making can be influenced by the information or emotions conveyed by the behaviors of others in their social circles. Households can acquire external information through social interactions, thereby reducing information uncertainty. Li (2006) argues that social interaction is an externality in which individual choices are influenced by the behaviors or characteristics of their reference group members. Individuals acquire information through social interactions, which in turn affects their decision-making behaviors. Jackson (2008) uses social interaction as a proxy variable to measure the acquisition of external information. Zou and Deng (2019) highlights the importance of social interaction, suggesting that individuals may acquire useful information through social networks or be influenced by the behaviors of those around them. Social interaction affects household decision-making through information dissemination and peer effects. Caplin and Dean (2015) and Dewan and Neligh (2020) approach individual decision-making from the perspective of costs, highlighting that limited attention among individuals generates information costs during the acquisition and processing of information. These studies show that social interaction can effectively promote residents’ financial participation and entrepreneurial decision-making. However, there is a lack of research on the impact and underlying mechanisms between social interaction and household relative poverty. This paper, starting from the perspective of the ability to acquire external information, selects social interaction as a proxy variable to explore the relationship between social interaction and household relative poverty. This serves as a valuable supplement to previous studies on relative poverty issues.
Through a summary and analysis of the aforementioned literature, it can be found that scholars have formed a rich body of research on the definition, identification, measurement, and empirical analysis of multidimensional relative poverty, which provides valuable theoretical support for this paper. However, there are still areas in existing research that warrant further exploration and investigation. Firstly, it remains to be examined whether the poverty alleviation effects vary under different poverty lines and whether the impacts of digital literacy and social interaction on alleviating relative poverty differ among families with varying degrees of poverty. The specific extent of these alleviation effects deserves further study. Secondly, research on relative poverty from a single perspective, such as digital literacy or social interaction alone, lacks a scientifically comprehensive framework. By integrating social interaction, which facilitates external information acquisition, and digital literacy, which enhances internal information processing, from the perspective of information uncertainty, this study can more accurately reflect the extent of relative poverty’s impact. Thirdly, there is a lack of empirical evidence on whether the poverty alleviation effects of digital literacy and social interaction remain consistent across different conditions. The study based on the threshold quantile regression model dynamically and nonlinearly explains the threshold effects between digital literacy, social interaction, and relative poverty.
The marginal contributions of this study are mainly reflected in the following three aspects: (1) It compares the relative poverty levels of families with high, medium, and low poverty degrees under two poverty lines, verifying that digital literacy and social interaction are core factors in alleviating relative poverty. (2) It expands the research on household relative poverty from the perspective of information uncertainty, moving beyond the single-perspective studies on digital literacy and relative poverty. The findings based on the quantile regression model are more robust, revealing differences in the effects among families with varying poverty degrees. (3) It extends the static and linear mechanisms of relative poverty impact to dynamic and nonlinear research, identifying and explaining the threshold effects between digital literacy, social interaction, and household relative poverty.
3 Theoretical analysis and research hypothesis
As the focus of this paper lies in exploring the impact of digital literacy and social interaction on the alleviation of relative poverty, only the mechanism by which digital literacy and social interaction affect information processing and resource access is analyzed. Building on established findings that information acquisition (Feng et al., 2019; Wu et al., 2022) and processing efficiency (Caplin and Dean, 2015; Dewan and Neligh, 2020) are pivotal for uncertainty mitigation, the impact mechanism is shown in Figure 1.
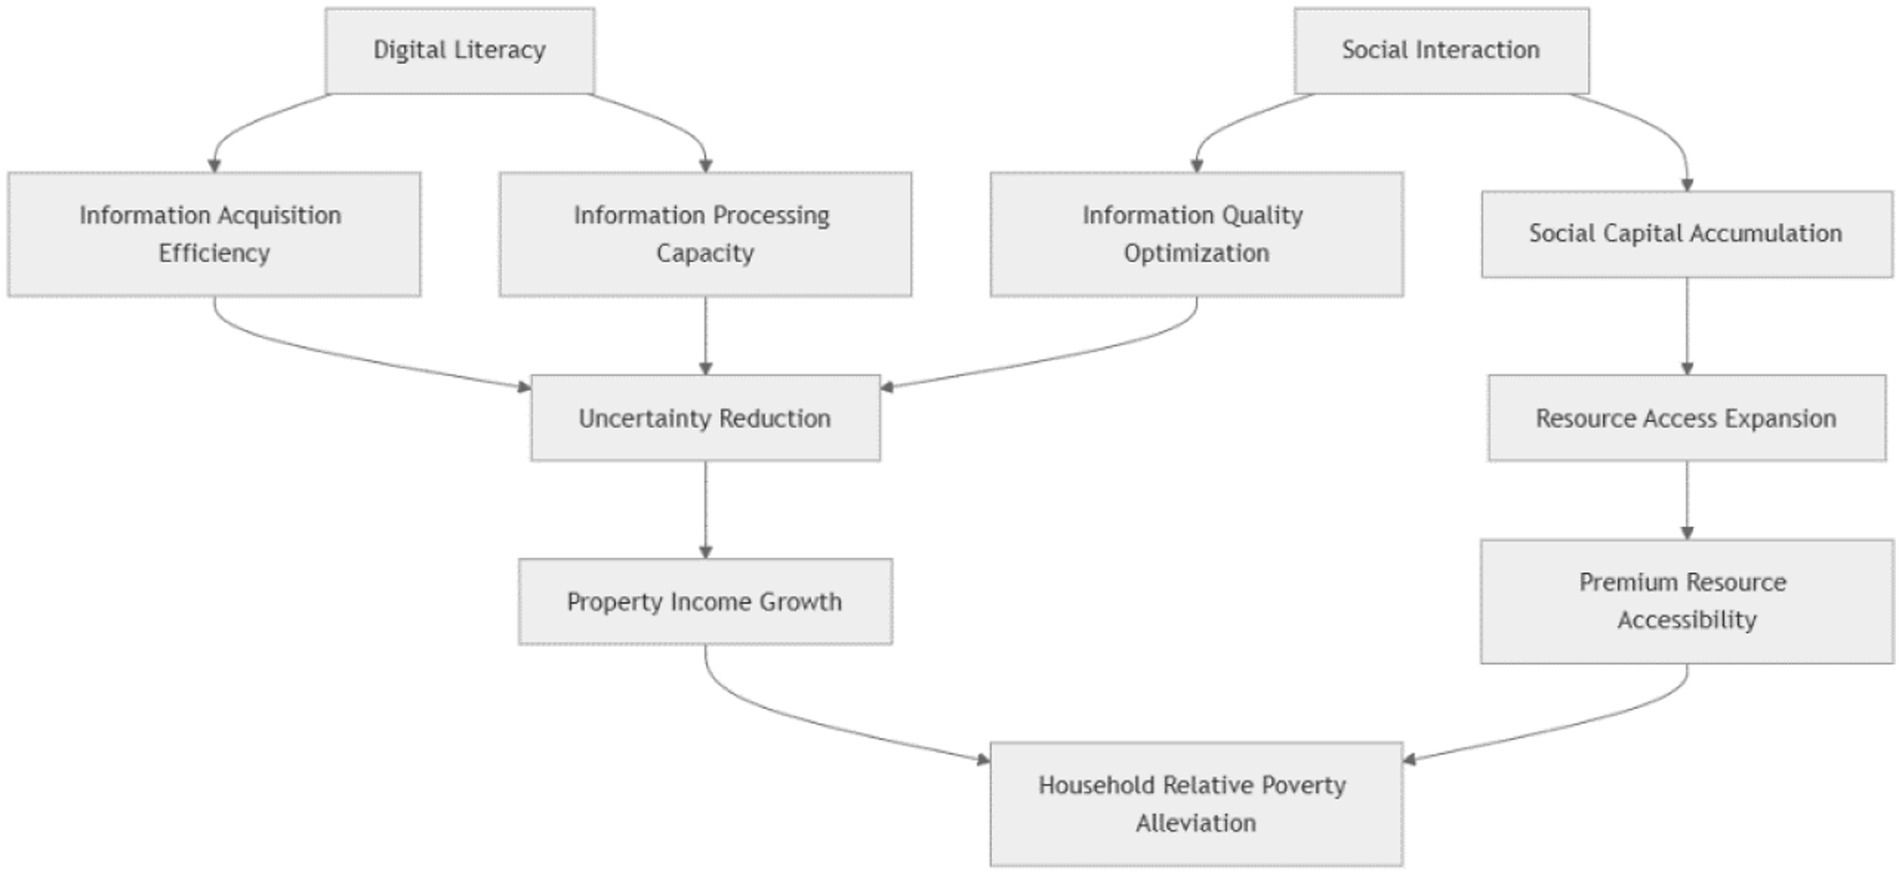
Figure 1. The impact mechanisms of digital literacy and social interaction on relative poverty alleviation.
Digital literacy reduces the poverty level by simultaneously enhancing information acquisition efficiency and information processing capacity. The combined effect of the two can alleviate information uncertainty. This reduction in uncertainty can reduce decision making costs and ultimately promote the growth of property income, this mechanism is consistent with the conclusions of information economics literature (Feng et al., 2019; Caplin and Dean, 2015). Social interaction works through the following channels: (1) optimizing information quality to assist in reducing uncertainty; (2) accumulating social capital to directly expand resource access channels. Crucially, the expansion of access to premium resources creates a complementary effect with income growth, thereby accelerating the process of poverty alleviation. The following hypothesis is advanced in this study:
H1a: Digital literacy can reduce the level of household relative poverty.
H1b: Social interaction can reduce the level of household relative poverty.
Digital literacy and social interaction are important influencing factors in alleviating relative poverty. Digital literacy focuses on the information processing capacity empowered by technology, while social interaction emphasizes the social capital accumulation of interpersonal networks. There are certain differences in their indicator settings (see Section 4.2). Nevertheless, families with high digital literacy may indirectly facilitate the accumulation of social capital by expanding their online social networks. Conversely, high-quality social interactions can also accelerate the enhancement of digital literacy. This paper focuses on addressing the challenge of alleviating relative poverty among families in the post-comprehensive poverty alleviation era. It should be noted that the synergistic effect between digital literacy and social interaction is not the core research content of this paper, and the specific mechanisms through which these two factors influence each other remain to be verified by subsequent empirical studies.
Different families with varying levels of poverty have distinct abilities to acquire and process information, leading to differences in their investments in digital literacy and social interaction. Families with lower levels of relative poverty often have the energy and time to invest more in improving their digital literacy and social interaction, resulting in higher levels of digital literacy and social engagement, and consequently, lower levels of relative poverty, thereby entering a virtuous cycle. Conversely, families with higher levels of relative poverty may not be able or willing to invest more in digital literacy and social interaction, which could lead to even higher poverty levels. Previous research that included families with different poverty levels in the same study was unable to accurately define the differences in the impact of digital literacy and social interaction on relative poverty across different families. To deeply analyze the impact of digital literacy and social interaction on relative poverty for families with different poverty levels, this paper proposes the following hypotheses:
H2a: Digital literacy has a differential impact on families with different levels of household relative poverty.
H2b: Social interaction has a differential impact on families with different levels of household relative poverty.
Both digital literacy and social interaction entail certain costs in the processes of acquiring and processing information. As a household’s ability to acquire and process information improves, information uncertainty decreases, and the marginal benefits of acquiring information also diminish accordingly. Therefore, the impact of digital literacy and social interaction on household relative poverty may not always be alleviating; instead, it could exhibit a nonlinear trend. In other words, the poverty alleviation effects of digital literacy and social interaction may have threshold points. Based on this, the following hypotheses are proposed:
H3a: There exists a threshold between digital literacy and household relative poverty.
H3b: There exists a threshold between social interaction and household relative poverty.
4 Research design
4.1 Response
To examine the disparities before and after the comprehensive poverty alleviation, this study utilizes data from the China Family Panel Studies (CFPS) for the years 2020 and 2022. The CFPS dataset provides reliable and comparable micro-level household data for this study, featuring three distinctive strengths: (1) a nationally representative large sample, (2) a longitudinal panel design across multiple years, and (3) rigorously validated multidimensional variables. These characteristics ensure the data’s robustness for examining the research questions at hand. The research sample is drawn from both the household and individual databases. By horizontally merging data from the individual and household databases and eliminating samples with anomalies or missing values, a final effective sample of 12,080 households was obtained.
Considering that changes in farmers’ income, education, health, living standards, security conditions, and subjective evaluations may lead to situations of opportunity deprivation, capability exclusion, or relative deprivation, thereby altering their relative poverty status, our study constructs a multidimensional relative poverty index system. Since the income dimension is a crucial indicator affecting poverty, numerous scholars have extensively studied different poverty standards for income, such as 50% or 60% of the median household income (Zou et al., 2023), or 40 to 50% of the per capita income (Deininger and Olinto, 2001; Haggblade et al., 2010). Given that income follows a right-skewed distribution, using per capita income may overestimate the non-poor population, and the mean is susceptible to extreme values, leading to unstable results. Therefore, this study adopts 0.4 times the median income as the relative poverty standard for the income dimension. Recognizing that national and provincial standards can yield significant differences, this study establishes two poverty lines based on Decerf's (2021) research: Poverty Line I (0.4 times the national median disposable income for urban and rural households) and Poverty Line II (0.4 times the provincial median disposable income for urban and rural households). For education, adults (family members aged 16 and above) with fewer than 9 years of education are considered relatively poor and assigned a value of 1.
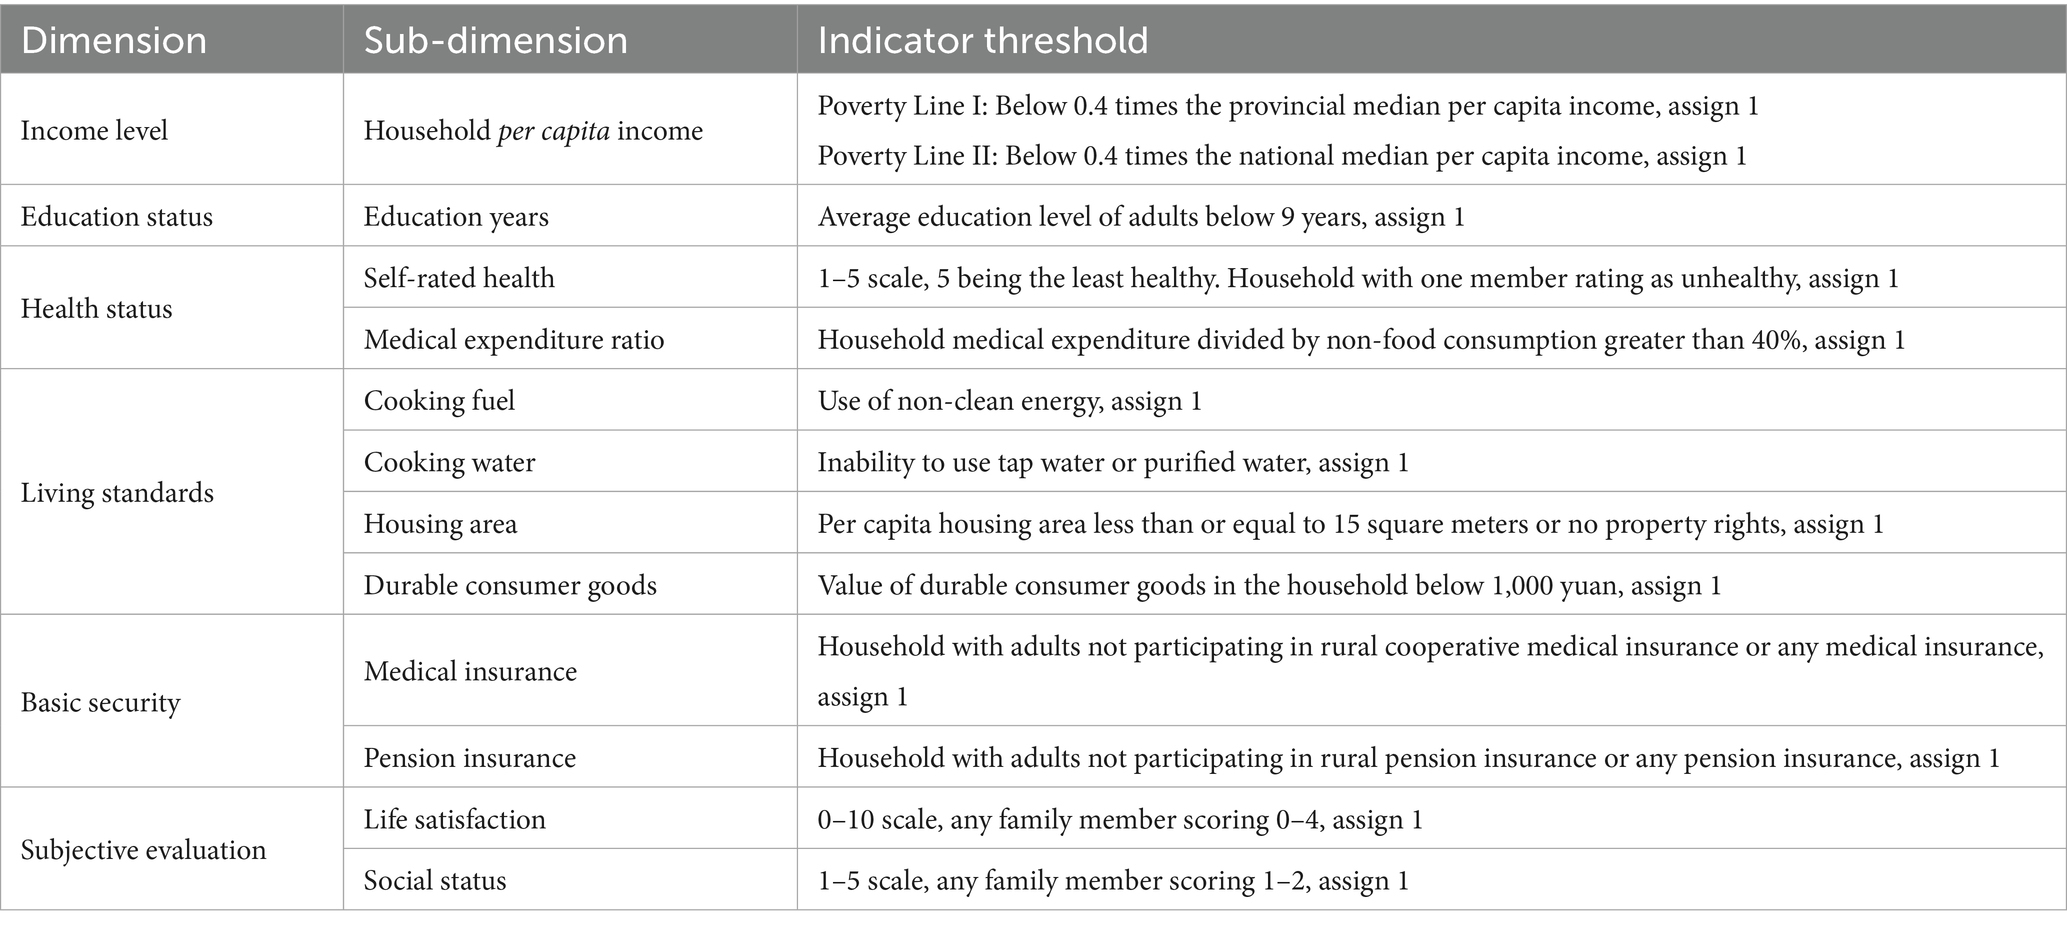
The methodology for constructing the household multidimensional relative poverty index is as follows. For n samples and selected m dimensional indicators, poverty thresholds are set for each dimension (specific thresholds are listed in Table 1), resulting in a household relative poverty matrix. The household relative poverty index is derived using the equal weighting method across dimensions (Alkire and Foster, 2011) and the entropy weight method for sub-dimensions (Njong and Ningaye, 2008). The poverty indicators and thresholds for each dimension are detailed in Table 1.
4.2 The core explanatory variable
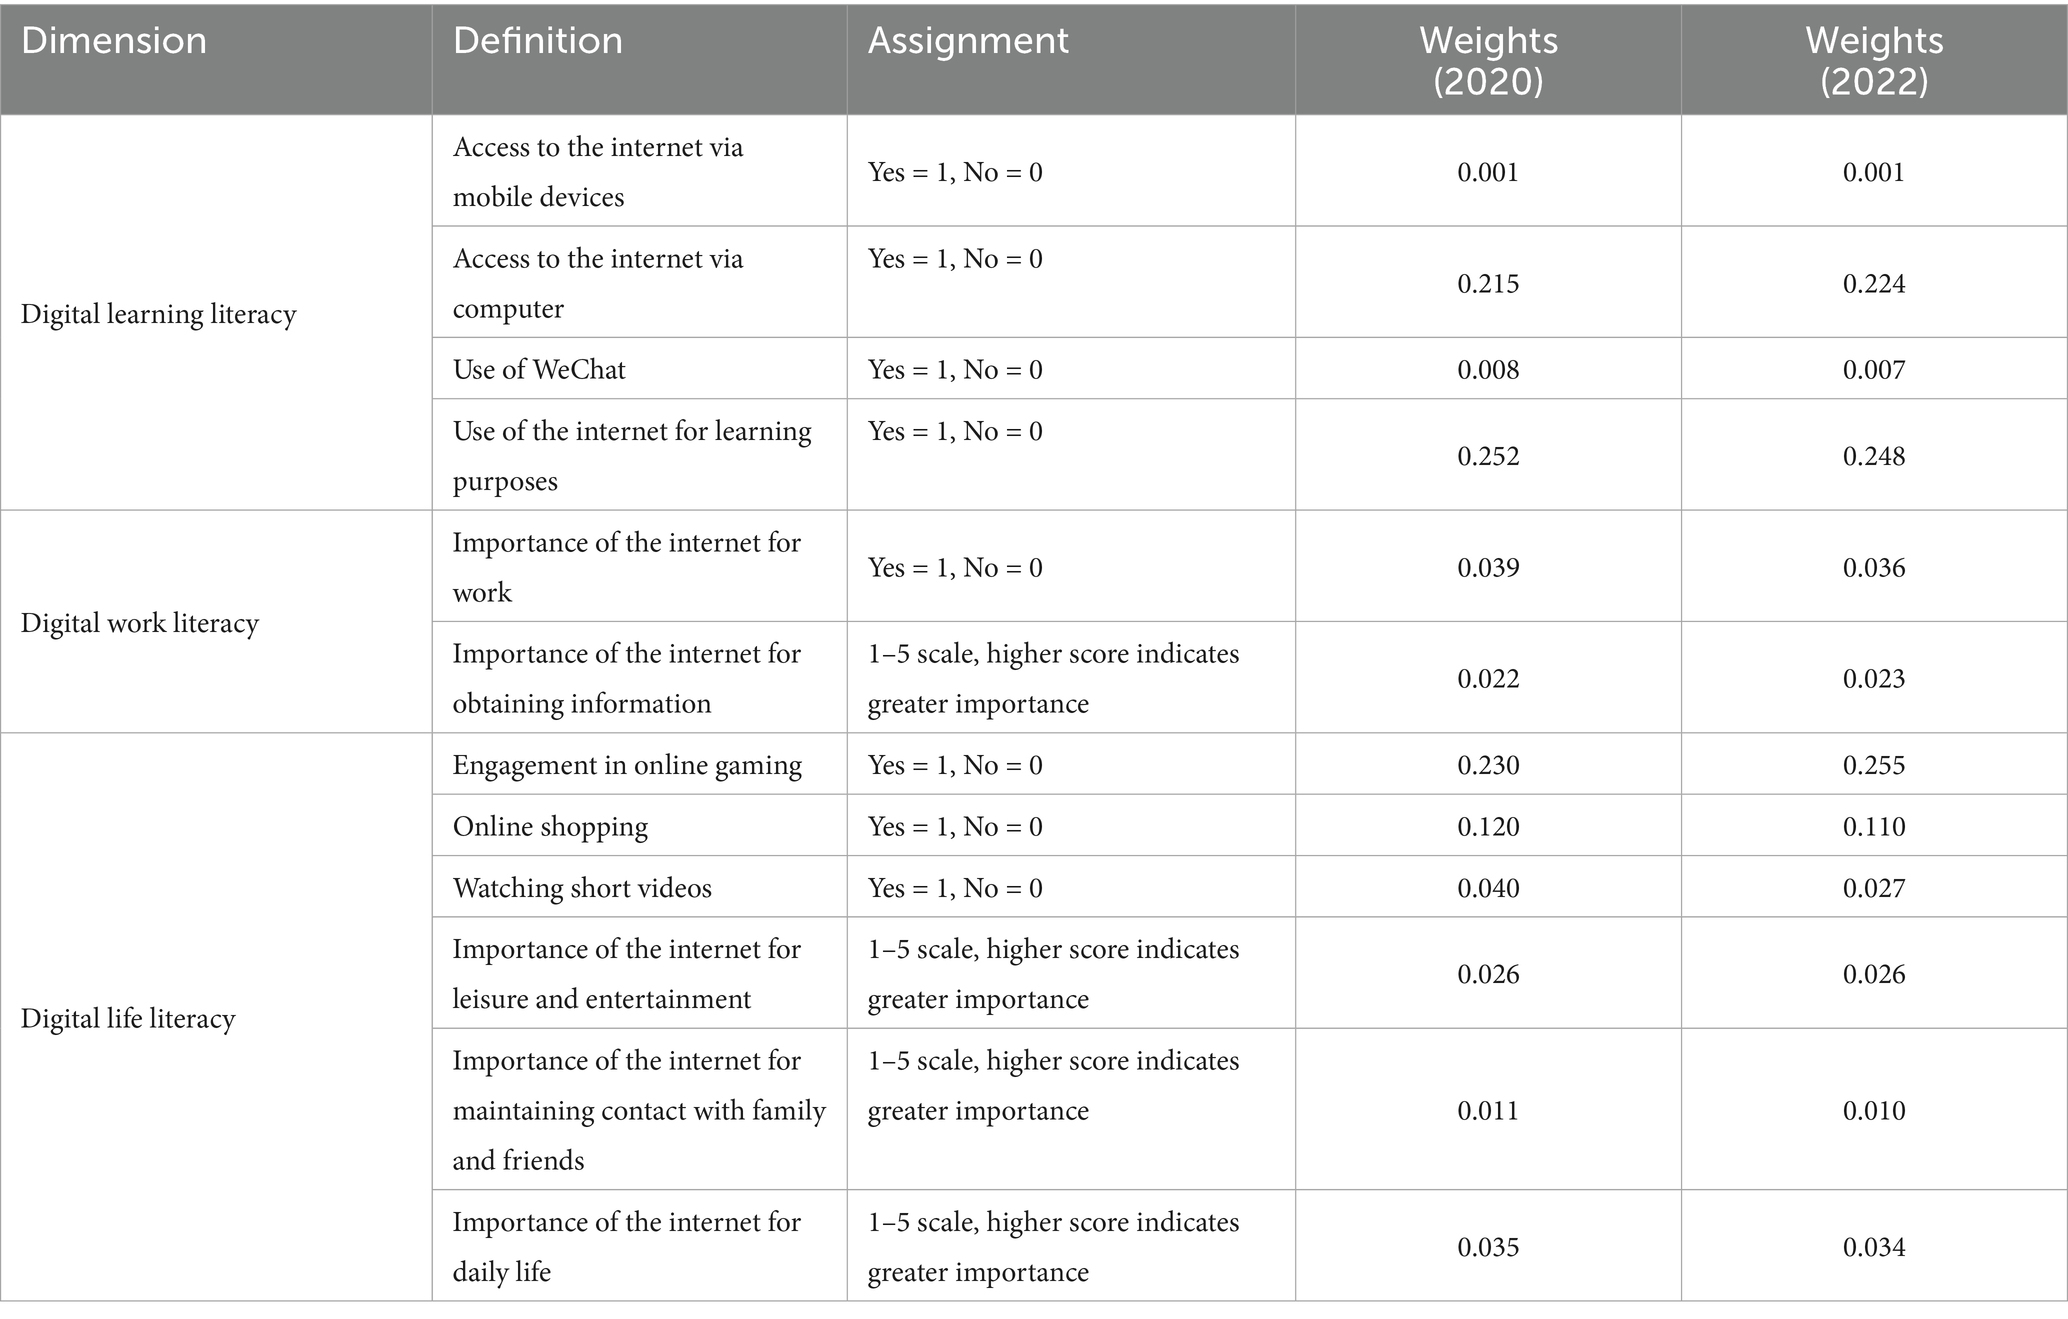
Van Dijk's (2005) established a comprehensive framework for digital literacy, conceptualizing it as a multidimensional construct encompassing motivational factors, material access, skills development, and usage patterns. This foundational model has significantly influenced subsequent research in the field. Warschauer (2003) introduced a social inclusion lens, arguing that true digital literacy must empower individuals to actively participate in society through technology, warning that without such capacity, users may still face significant usage gaps. Further developing this theoretical foundation. Helsper's (2021) research provided critical insights into the intersection between digital and social inequalities, empirically demonstrating the correlation between digital literacy disparities and socioeconomic status. In this study, we operationalize digital literacy through three practical dimensions, digital learning, digital work, and digital life. These dimensions holistically capture the socio-technical aspects highlighted in prior literature: motivation (embedded in work/life dimensions), access (measured via internet connectivity through mobile/computer devices), and skills/usage (reflected in activities like e-learning, shopping, and information-seeking). While our measures are constrained by survey data limitations, they comprehensively address the core facets of digital literacy while ensuring empirical feasibility for rural populations. Our study decomposes digital literacy into three dimensions: digital learning literacy, digital work literacy, and digital life literacy, comprising a total of 12 indicators (Zhou et al., 2024).
The entropy weight method was employed to objectively determine the weights of each indicator, thereby deriving the digital literacy scores for each household. The results are presented in Table 2.
The calculation results indicate that the Cronbach’s alpha of the digital literacy indicator system in 2020 and 2022 are 0.704 and 0.727, respectively, suggesting good reliability. After removing the leisure heavy items, namely the indicators in rows 7–9 of Table 2 (Engagement in online gaming, Online shopping, Watching short videos), the Cronbach’s alpha become 0.708 (in 2020) and 0.731 (in 2022). This shows that the leisure heavy items have little impact on the digital literacy indicators, and the alpha coefficients remain greater than 0.7. From the results of factor loading stability, the maximum differences in the digital literacy indicators before and after removing the leisure heavy items in 2020 and 2022 are 0.057 (in 2020) and 0.108 (in 2022) respectively, both of which are less than 0.15. Moreover, all the loadings are greater than 0.5, indicating that the factor structure is relatively stable.
The essence of social interaction lies in the transmission of information. Previous research has identified key indicators for measuring information transmission, such as communication expenditure, which gauges the extent of social interaction, and gift-giving expenditure, which measures the intensity of social interaction (Zou and Deng, 2019; Dewan and Neligh, 2020; Caplin and Dean, 2015). An increase in communication and gift-giving expenditures typically signifies more active social interactions within households, enabling them to access richer social information. Drawing on the study by Wu et al. (2022), this paper selects communication expenditure as the primary indicator to assess the intensity of household social interaction. For endogeneity testing, gift-giving expenditure is used as an alternative indicator.
4.3 Control variables
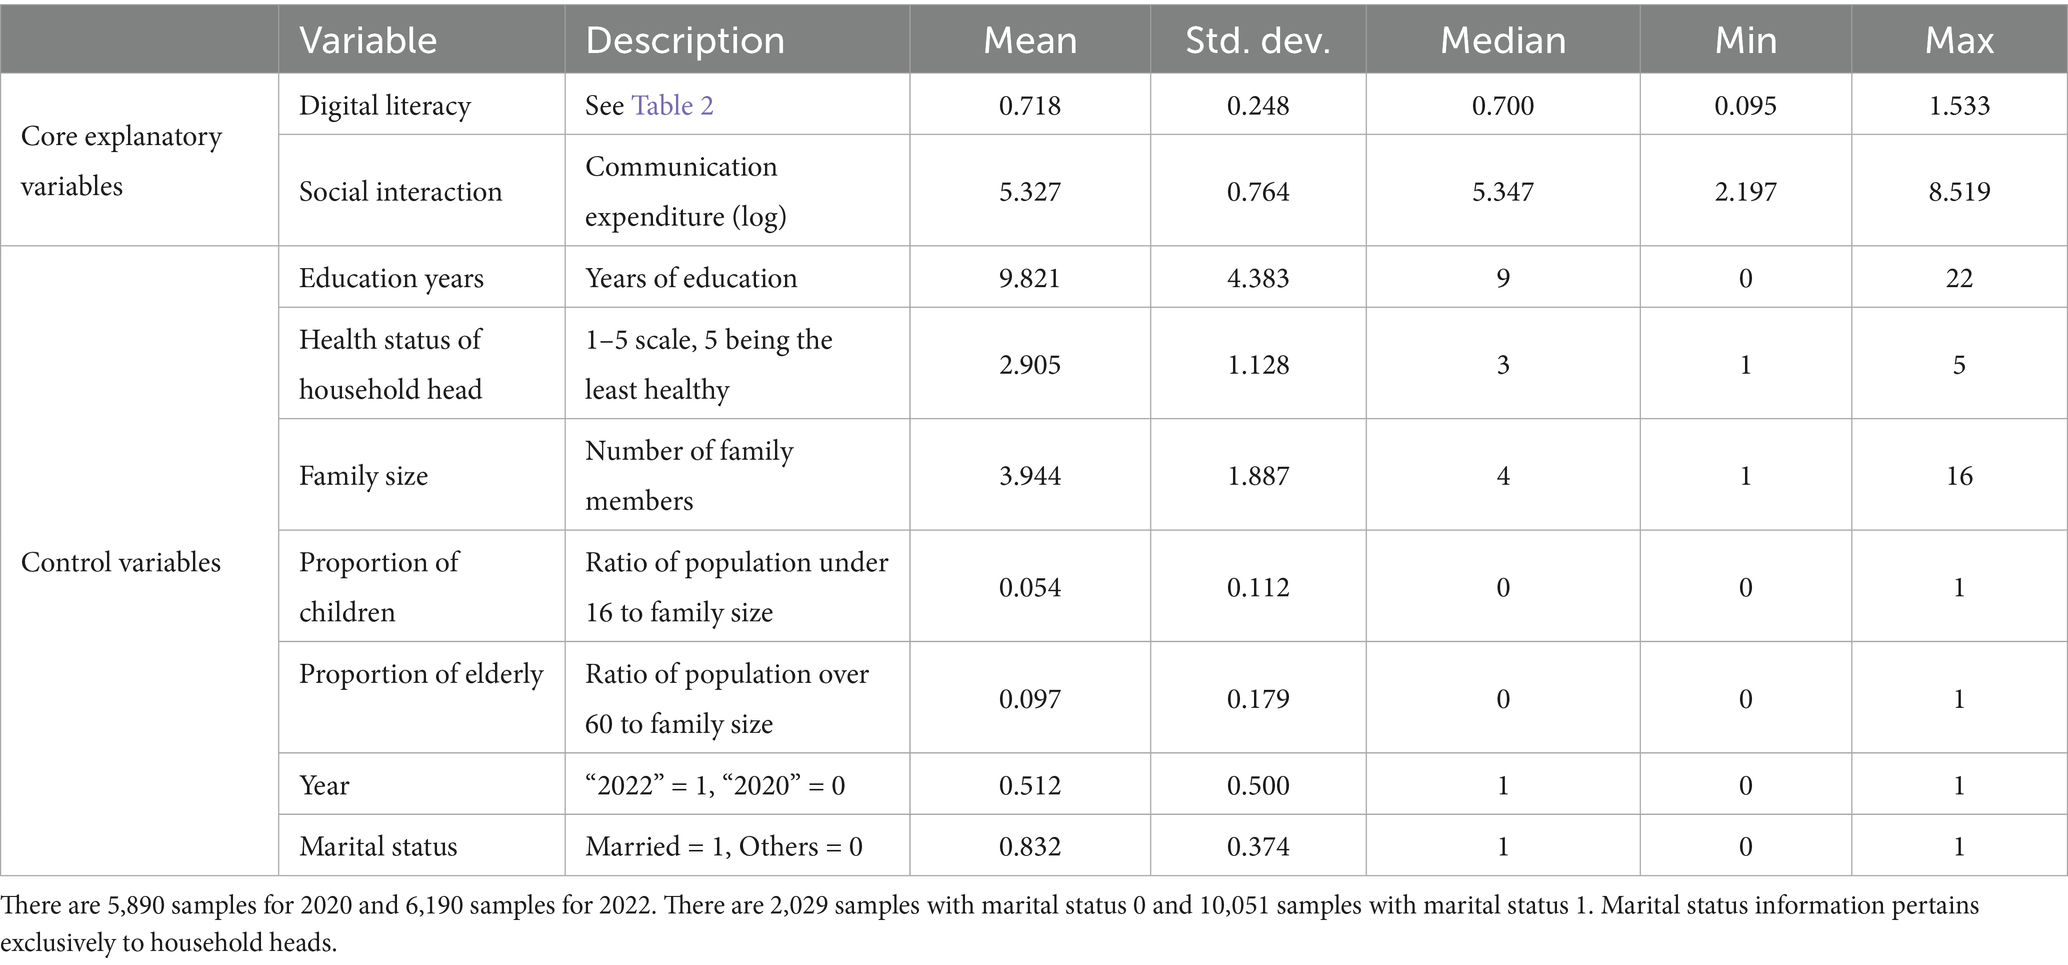
Other control variables include years of education, health status of the household head, family size, child ratio, elderly ratio, year, and marital status. The descriptive statistics are presented in Table 3.
5 Empirical analysis
5.1 Baseline regression analysis
To examine the mechanisms by which digital literacy and social interaction alleviate relative poverty (H1a, H1b) and their differential effects across poverty levels (H2a, H2b), this study employs a quantile regression model. Existing research has primarily used the multidimensional relative poverty index as the response variable and relied on pooled cross-sectional regression models under different poverty standards to verify these mechanisms, but these approaches have limitations. First, mean regression models only reflect average effects, and outliers in the data may lead to unstable results, thereby undermining the reliability of verifying H1a and H1b. Second, such models fail to capture effect heterogeneity across the poverty distribution, making it difficult to determine the validity of H2a and H2b. In contrast, the quantile regression model offers distinct advantages: it accounts for the tail characteristics of relative poverty, facilitating accurate estimation of impact mechanisms across households with varying poverty levels, and it relaxes the strict normality assumption for error terms, enabling robust parameter estimates even in the presence of outliers. Therefore, this study adopts the quantile regression framework proposed by Koenker and Bassett (1978) to address these issues while testing the four hypotheses (H1a, H1b, H2a, and H2b). The specification of the quantile regression model is as follows:
where Povit represents the multidimensional relative poverty index for the i-th household in year t, with DLit and SIit denoting the respective values for digital literacy and social interaction, and Controlsit representing other control variables.
Considering that the sample sizes in the CFPS dataset for the year 2020 and 2022 are inconsistent in this paper, to ensure consistency, a benchmark regression was conducted based on the quantile regression model for the years 2020 and 2022, under different poverty lines and different quantiles, respectively. The regression results are presented in Table 4. The values of τ at 0.25, 0.5, and 0.75 correspond to the low, medium, and high levels of multidimensional relative poverty for households (hereinafter referred to as low-poverty, medium-poverty, and high-poverty households, respectively).
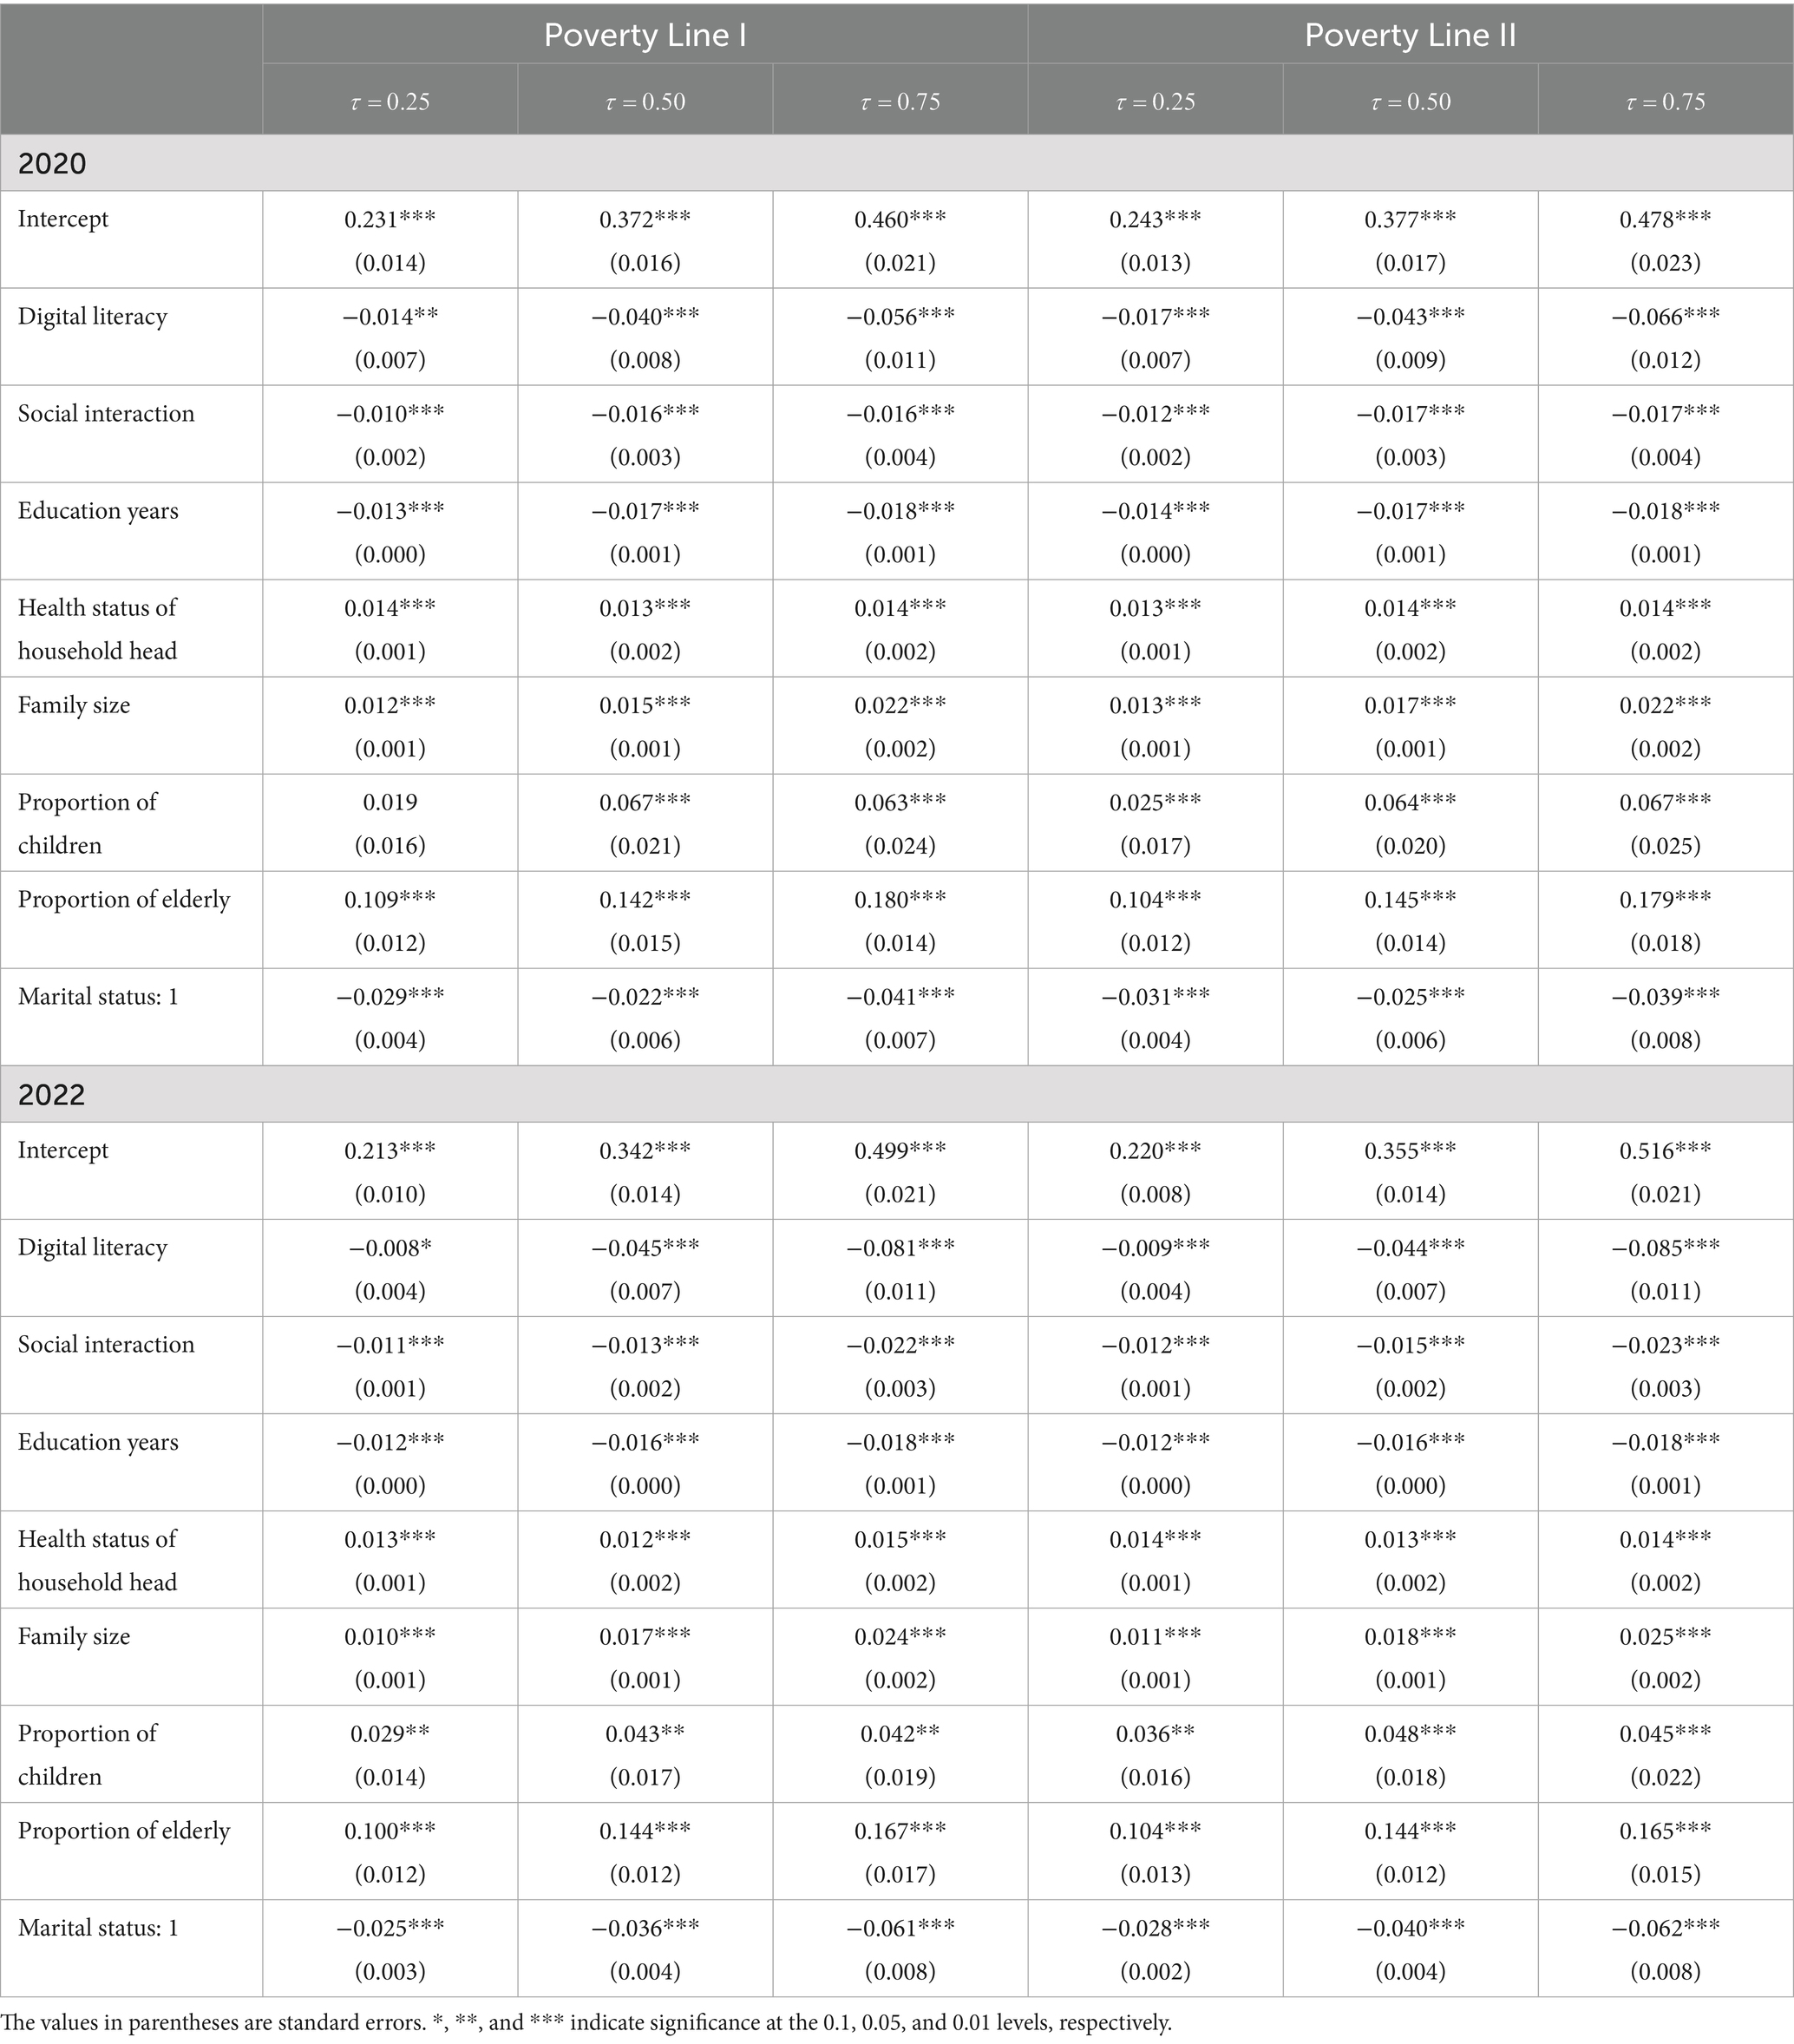
Table 4. Estimation results of quantile regression models at different quantiles under two poverty lines in 2020 and 2022.
In Table 4, the estimated result of “Proportion of Children” at the 0.25 quantile is not significant. “Digital Literacy” is significant at the 0.05 significance level, and all other estimates are significant at the 0.01 level. The following conclusions can be drawn from Table 4. (1) Across different poverty lines, quantile levels, and years, the marginal effect of digital literacy is significantly negative at the 0.01 confidence level, indicating that an improvement in digital literacy can effectively reduce the relative poverty level of households. Digital literacy has the best poverty—reduction effect on high - poverty households, followed by medium—poverty households, and the lowest effect on low—poverty households. Specifically, for high—poverty households (τ = 0.75), when digital literacy increases by one unit, the relative poverty level decreases by 0.056 units under Poverty Line I and 0.066 units under Poverty Line II in 2020, and by 0.081 and 0.085 units, respectively, in 2022. This also confirms that the poverty—reduction effect for high—poverty households in 2022 is better than that in 2020. The reason why the improvement of digital literacy has the highest mitigating effect on high—poverty households may be that the enhancement of digital literacy strengthens the ability of high—poverty households to process information, reduces uncertainty, and thus helps high—poverty households alleviate their poverty situation through the digital economy. (2) To verify the family’s ability to reduce information uncertainty through external channels, we also considered the mitigating effect of social interaction on the poverty level of households. The study finds that increased social interaction can also effectively reduce the relative poverty level of households, and it has a stronger poverty—reduction effect on high—poverty households. However, different from the mitigating effect of digital literacy on households with different poverty levels, the mitigating effect of social interaction on relative poverty is not strong and ranges from 0.010 to 0.023, indicating that the poverty—reduction effect of social interaction is relatively stable across different poverty levels. From the perspective of different years, the poverty—reduction effect for high—poverty households in 2022 is the best, and that for low—poverty households is slightly lower. From the perspective of different poverty lines, the poverty—reduction effect under Poverty Line II is slightly higher than that under Poverty Line I. (3) Regardless of which poverty line is used, improving educational levels and maintaining a stable marital status can effectively alleviate the relative poverty of these three types of households. Higher educational levels and stable marital status have a stronger mitigating effect on high—poverty households, which is consistent with previous research findings. Compared with 2020, the contribution of educational levels to poverty reduction in 2022 is the same as that in 2020, but the poverty—reduction effect of a stable marital status in 2022 is slightly higher than that in 2020. (4) The health status of the household head, family size, proportion of children, and proportion of elderly members all have a negative impact on poverty alleviation. Taking high—poverty households as an example, regardless of which poverty line is used, the marginal effect of the health indicator of the household head is stable at around 0.014 and is significant at the 0.01 level. This means that the worse the health status of the household head (the higher the indicator value), the higher the relative poverty level of the family. Whether it is different poverty lines or different years, the impact of an increase in family size on low -, medium—and high—poverty households increases in turn. For medium—and high—poverty households, an increase in the proportion of children raises the poverty level, and the impact on low—poverty households is relatively small. The marginal effect of the proportion of elderly members is weaker than that of the proportion of children. With the passage of time, the poverty—reduction effect for medium—and high—poverty households with a high proportion of children in 2022 is better than that in 2020. This indicates that China’s poverty—alleviation policies cover households with a high proportion of children, so households with a high proportion of children do not fall into a deeper poverty situation.
These results indicate that as the core explanatory variables of digital literacy and social interaction increase, they enhance the family’s ability to handle uncertain information from both internal and external channels, effectively mitigating the relative poverty level and validating Hypotheses 1a and 1b. Other control variables also affect the poverty level of households, with improvements in educational levels, marital status, and year values contributing to poverty reduction. In particular, a stable marital status has the most significant impact on improving the poverty level of high-poverty households. The health of the household head, family size, proportion of children, and proportion of elderly members can increase the poverty level. Notably, for medium- and high-poverty households, a higher proportion of children significantly increases their relative poverty level, suggesting that it is necessary to enhance policy support for families with a higher proportion of children, providing them with preferential assistance.
5.2 Endogeneity analysis
By setting multiple control variables and employing quantile regression models for estimation, we can address the endogeneity issues arising from omitted variables to some extent. However, it is still necessary to address potential issues such as reverse causality or measurement errors. Firstly, the digital literacy and social interaction of households may also be influenced by their poverty level; that is, in areas with higher poverty levels, digital literacy and social interaction may be lower. Additionally, low-poverty households may expand their social interaction and networking or engage in more digital literacy training and enhancement programs to improve their digital skills, leading to broader information exchange circles and stronger capabilities in processing uncertain information. Therefore, when considering the impact of relative poverty levels, it is necessary to address the endogeneity caused by reverse causality. Secondly, measurement errors in the digital literacy or social interaction variables can also lead to endogeneity issues. This paper selects digital literacy and social interaction as measures of household relative poverty, but there may be some measurement error in the alternative indicators used for constructing the core explanatory variables.
Considering the close relationship between household digital literacy and their living environment, the digital literacy of the surveyed household is likely to be correlated with that of other similar households in the same province and county. However, the digital literacy of other households has almost no impact on the relative poverty level of the surveyed household. Therefore, we constructed “the average digital literacy of other households in the same province and county after excluding the surveyed household (denoted as: IVDL)” as an instrumental variable for digital literacy. For social interaction, referring to the study by Wu et al. (2022), we constructed “the average expenditure on social gifts and donations of other households in the same province and county after excluding the surveyed household (denoted as: IVSI)” as an instrumental variable for social interaction. Since social gift giving is an important social interaction activity in the same province and county, there is a strong correlation between the two, but the gift giving expenditure of other households has little impact on the relative poverty level of the surveyed household.
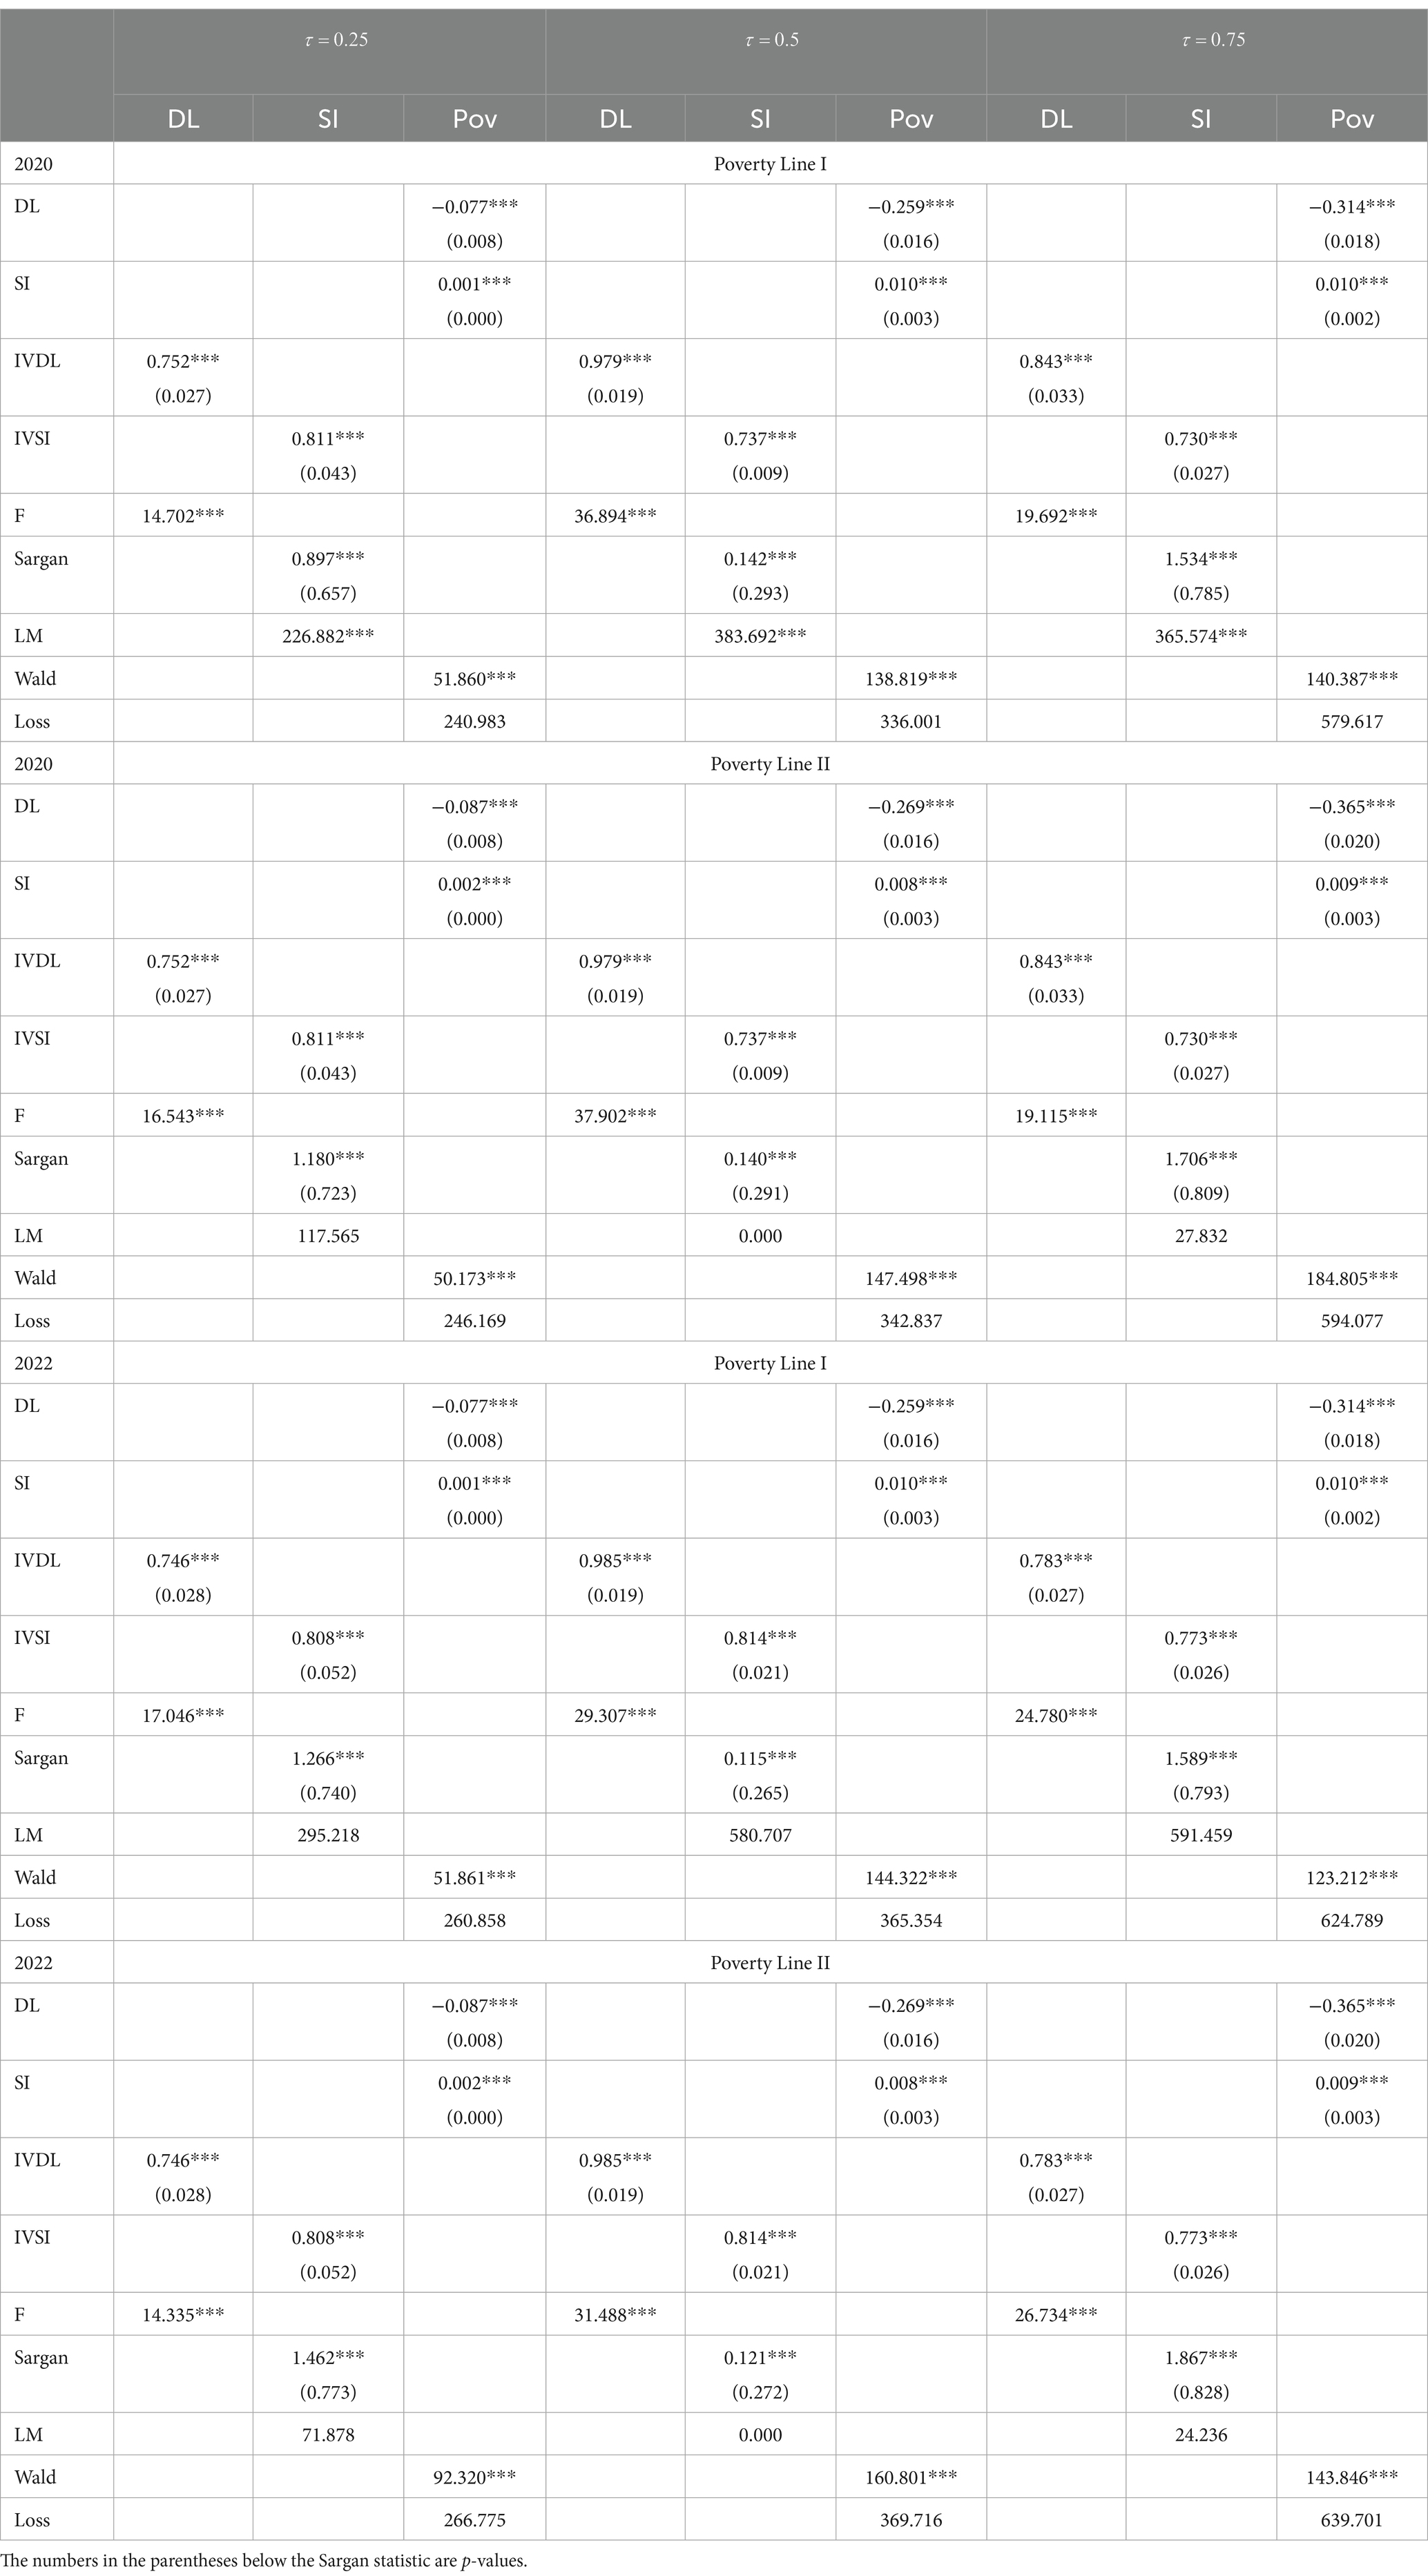
Table 5 presents the instrumental variable regression results under two poverty lines and different quantiles (the estimation results of the intercept term and control variables are not shown due to space limitations).
The results indicate that under different quantiles, the first-stage regression of the instrumental variables IVDL and IVSI on DL (digital literacy) and SI (social interaction) (columns 2, 3, 5, 6, 8, and 9) are all significant at the 0.01 level, satisfying the relevance requirement. The second-stage regression results show that the effect of digital literacy and social interaction on reducing household relative poverty remains significant. The regression equations pass the Wald exogeneity test, satisfying the assumption that the instrumental variables are exogenous, indicating that the two instrumental variables have effectively addressed the endogeneity issues. The F-test statistic in the first stage is greater than 10, which rejects the null hypothesis of weak instrumental variables. Secondly, the Sargan test results indicate that at least one instrumental variable is endogenous, and the results of the LM test statistic also suggest that instrumental variables need to be used except for two relatively small LM statistics at the quantiles of 0.5 and 0.75 below the poverty line II.
Additionally, the results suggest that an increase in digital literacy can reduce the level of relative poverty in households, while the impact of social interaction is smaller, showing a slightly positive driving effect. This implies that digital literacy has a more pronounced impact on poverty alleviation compared to social interaction, according to the findings of this study. The use of instrumental variables has helped to provide more robust and reliable estimates of the effects of digital literacy and social interaction on relative poverty, controlling for the potential endogeneity of these variables.
5.3 Robustness analysis
5.3.1 Replacement of key variables
We recalculated the family’s multidimensional relative poverty level by replacing the entropy weight method for sub-dimensions with an equal-weight method for sub-dimensions. The impact of digital literacy and social interaction on the level of relative poverty was assessed under Poverty Line I and II, and at different quantiles. The results are presented in Table 6.

Table 6. Estimation of quantile regression models under two poverty lines and different quantiles (equal weights).
From Table 6, it can be observed that:
(1) Regardless of whether it is Poverty Line I or Poverty Line II, the improvement of digital literacy and social interaction at different quantiles contributes to the reduction of relative poverty levels, thus revalidating Hypotheses 1a and 1b.
(2) Both digital literacy and social interaction show a higher reduction in high-poverty families compared to middle-poverty families under different poverty lines, with the lowest reduction observed in low-poverty families. This indicates that the mitigating effect of digital literacy and social interaction on families with different poverty levels is indeed different, confirming Hypotheses 2a and 2b. Therefore, diverse family circumstances should be considered when implementing poverty reduction measures.
(3) Across all quantiles and different poverty lines, the poverty reduction effect of digital literacy is higher than that of social interaction. This suggests that the enhancement of digital literacy plays a more significant role in reducing poverty levels.
5.3.2 Changing the measurement model
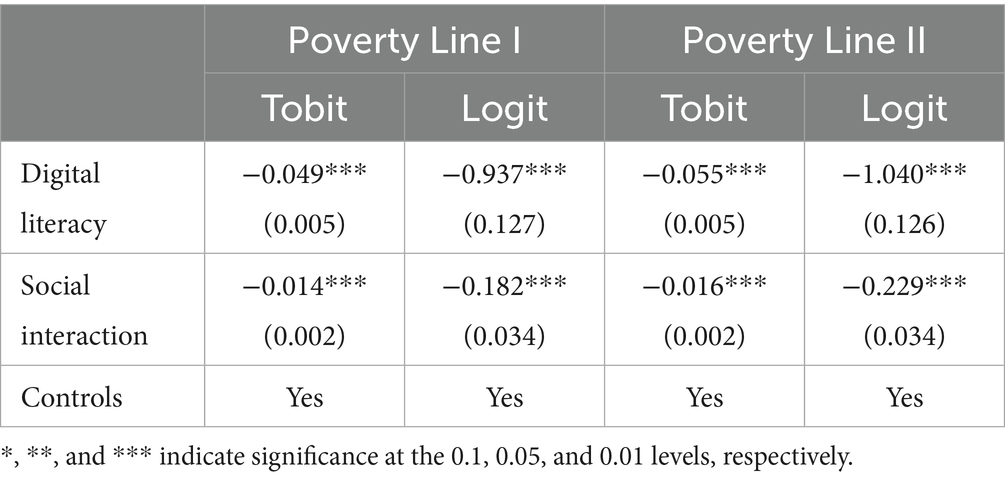
To control for biased estimates caused by data interference and considering that the multidimensional relative poverty indicators range from 0 to 1, a Tobit regression model was used for robustness testing. Additionally, the A-F double threshold method was used to select the critical value k = 1/3. This means that if 1/3 of the 12 multidimensional relative poverty sub-indicators exceed the critical value, the family is considered to be in a state of relative poverty, assigned a value of 1. A Logit regression model was used for robustness testing. The estimation results are presented in Table 7.
Based on Table 7, it can be concluded that under different poverty lines, the mitigating effect of digital literacy and social interaction on relative poverty levels remains significant and exhibits a negative correlation. The impact of digital literacy on relative poverty levels is slightly greater than that of social interaction. The response variable in the Logit regression is a binary variable with values of only 0 or 1. Compared to the Tobit model, which allows for a continuous dependent variable that is censored at some value, the Logit regression contains less information, which can lead to more extreme estimation results. This is because the Logit model is more sensitive to the presence of extreme values in the data, as it is designed to model the probability of a binary outcome, and thus it may exaggerate the effects of the explanatory variables.
5.4 Heterogeneity analysis
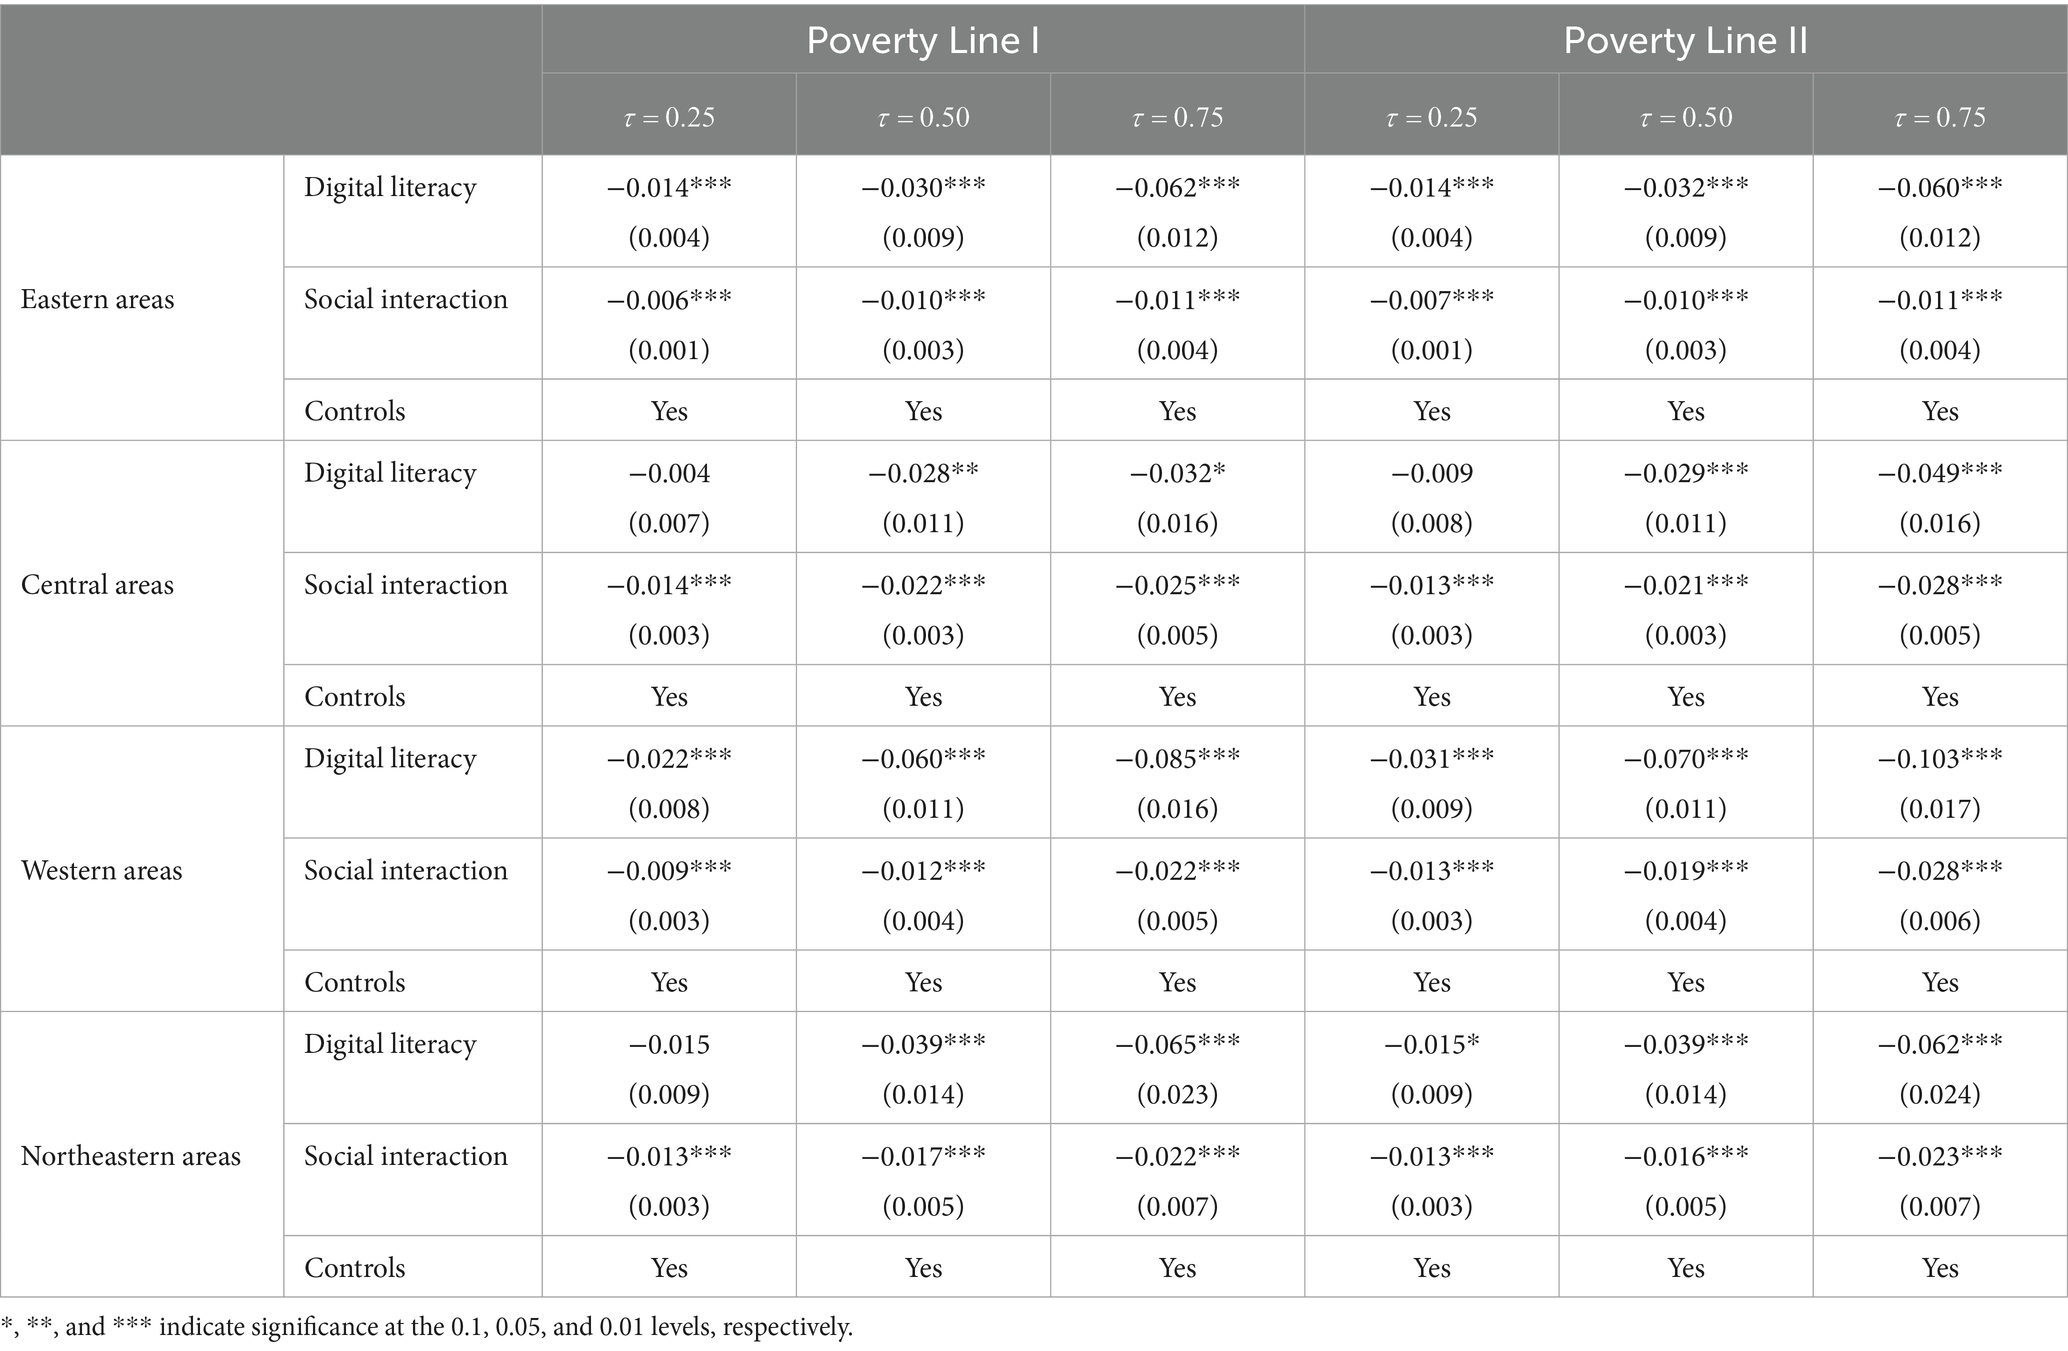
The results from the benchmark regression, endogeneity tests, and robustness checks indicate that digital literacy and social interaction can mitigate relative poverty. This section further investigates whether this mitigating effect is heterogeneous across different regions, urban–rural differences, and the gender of the household head, primarily for the following methodological justifications: First, China’s vast territory exhibits unbalanced regional development. Significant disparities exist between the Eastern, Central, Northwestern, and Northeastern areas in terms of economic development, industrial structure, and social security, leading to distinct regional heterogeneity in relative poverty. Consequently, regional differences must be incorporated into the analytical framework. Second, the urban–rural dual structure is one of the most prominent features of China’s economic and social development. Differences in resource allocation and public services have resulted in fundamental distinctions between urban and rural residents in terms of digital literacy and social interaction, making urban–rural heterogeneity analysis particularly valuable. Finally, gender differences among household heads are particularly pronounced in rural areas, stemming primarily from traditional gender role divisions and gender asymmetry in social resource access. Thus, gender differences hold unique value for understanding the mechanisms of relative poverty. The selection of these three dimensions reflects China’s specific national context and enables a systematic exploration of the heterogeneity in rural households’ relative poverty. Our paper categorizes the regions into the eastern, central, western, and northeastern areas. The analysis is conducted under two poverty lines and across three quantiles to examine the impact of digital literacy and social interaction on relative poverty in each region. The regression results are presented in Table 8.
From Table 8, it can be observed that when τ = 0.25, the estimate of digital literacy in the central region is not significant, and when the poverty line is II and τ = 0.25, the estimate of digital literacy in the northeastern region is not significant; all other estimates are significant. Specifically, under different poverty lines and different quantiles, digital literacy and social interaction in the four regions all have a significant mitigating effect on relative poverty. This indicates that families in different regions will benefit from the increase in digital literacy and social interaction, and this effect has a greater impact on high-poverty families than on medium-poverty families, with the lowest effect on low-poverty families. This further demonstrates that increasing the digital literacy and social interaction of high-poverty families can effectively mitigate the level of relative poverty. In addition, looking at the mitigating effects of the two core explanatory variables, digital literacy still has a stronger poverty reduction effect than social interaction, which is consistent with the conclusions drawn in the previous three sections. Regionally, under different poverty lines and different quantiles, digital literacy has the strongest poverty reduction effect in the western region, followed by the northeastern, eastern, and then the western regions, indicating that increasing digital literacy in the western region can more effectively mitigate relative poverty among families. The poverty reduction effect of social interaction is different, with the strongest effect in the central region, the weakest in the eastern region, and the western and northeastern regions being in the middle, indicating that increasing social interaction has the best poverty reduction effect in the central region, but the effect is weaker in the western and northeastern regions.
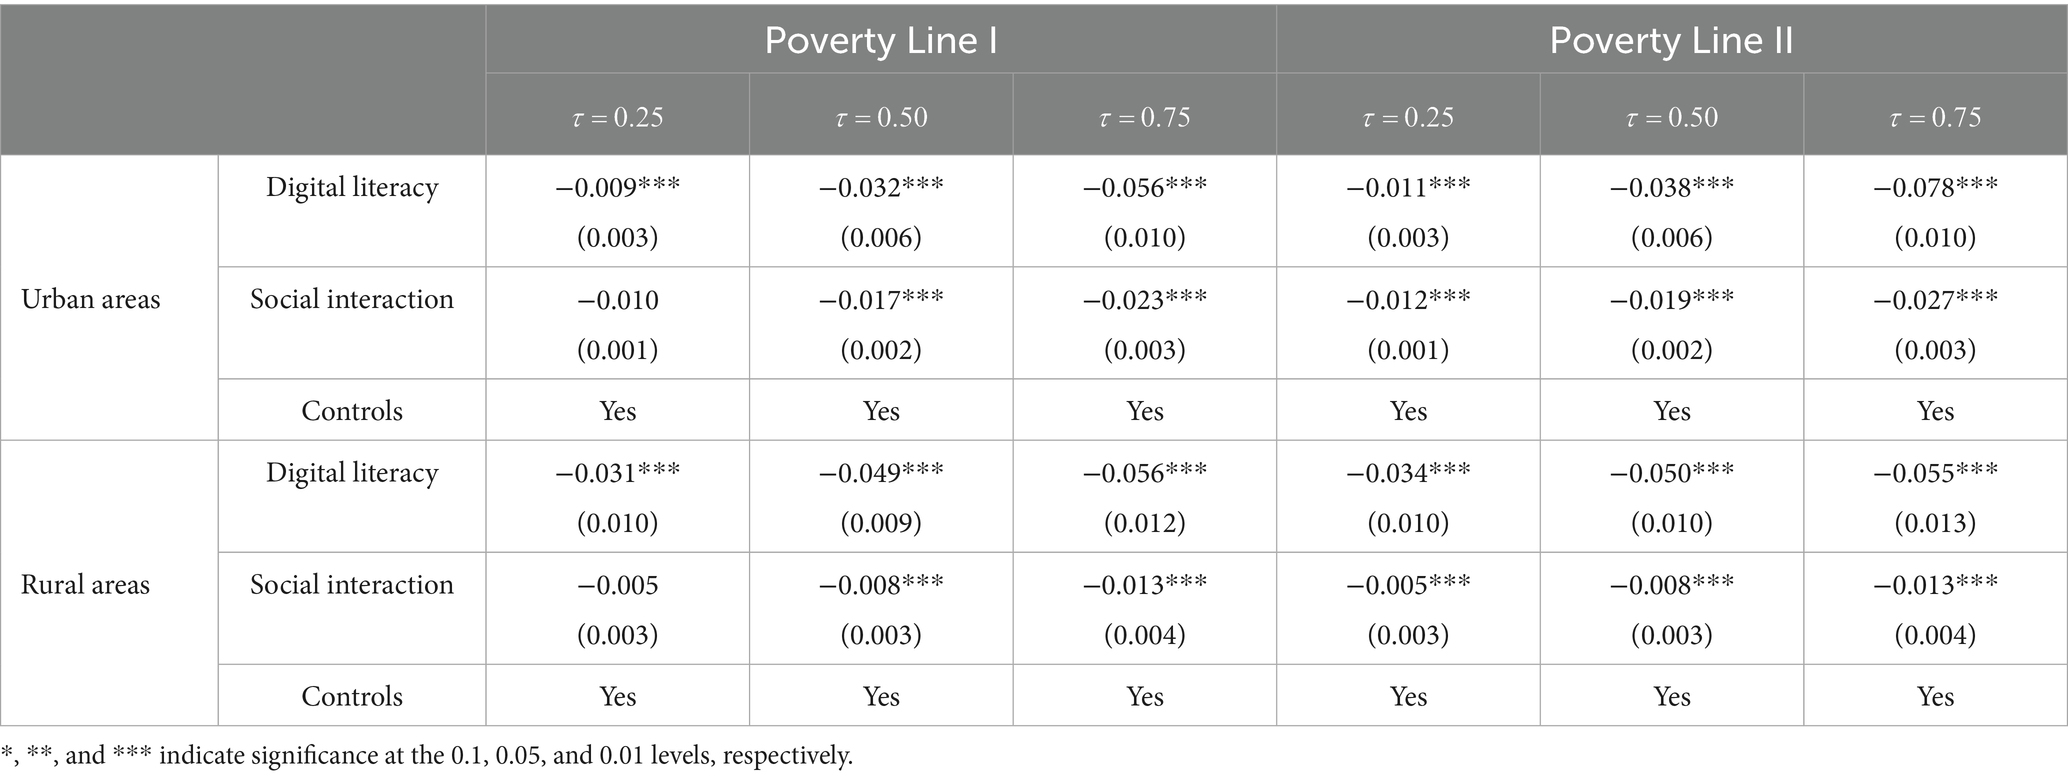
Let us look at the heterogeneity of the urban–rural differences in mitigating relative poverty, as shown in Table 9.
From Table 9, it can be observed that except for the case where the poverty line is I and τ = 0.25, in which the estimate of social interaction in rural areas is not significant, all other estimates are significant. It is not difficult to find that the poverty reduction effect of digital literacy and social interaction remains significant, but the mitigating effects of the two core explanatory variables are not entirely the same. Improving digital literacy has a consistently better poverty reduction effect in rural areas than in urban areas (except for high-poverty families under Poverty Line II). When increasing social interaction, the mitigating effect on relative poverty for urban families is higher than that for rural families. Under different urban–rural differences, the poverty reduction effect of digital literacy and social interaction is greatest for high-poverty families, followed by medium-poverty families, and least for low-poverty families.
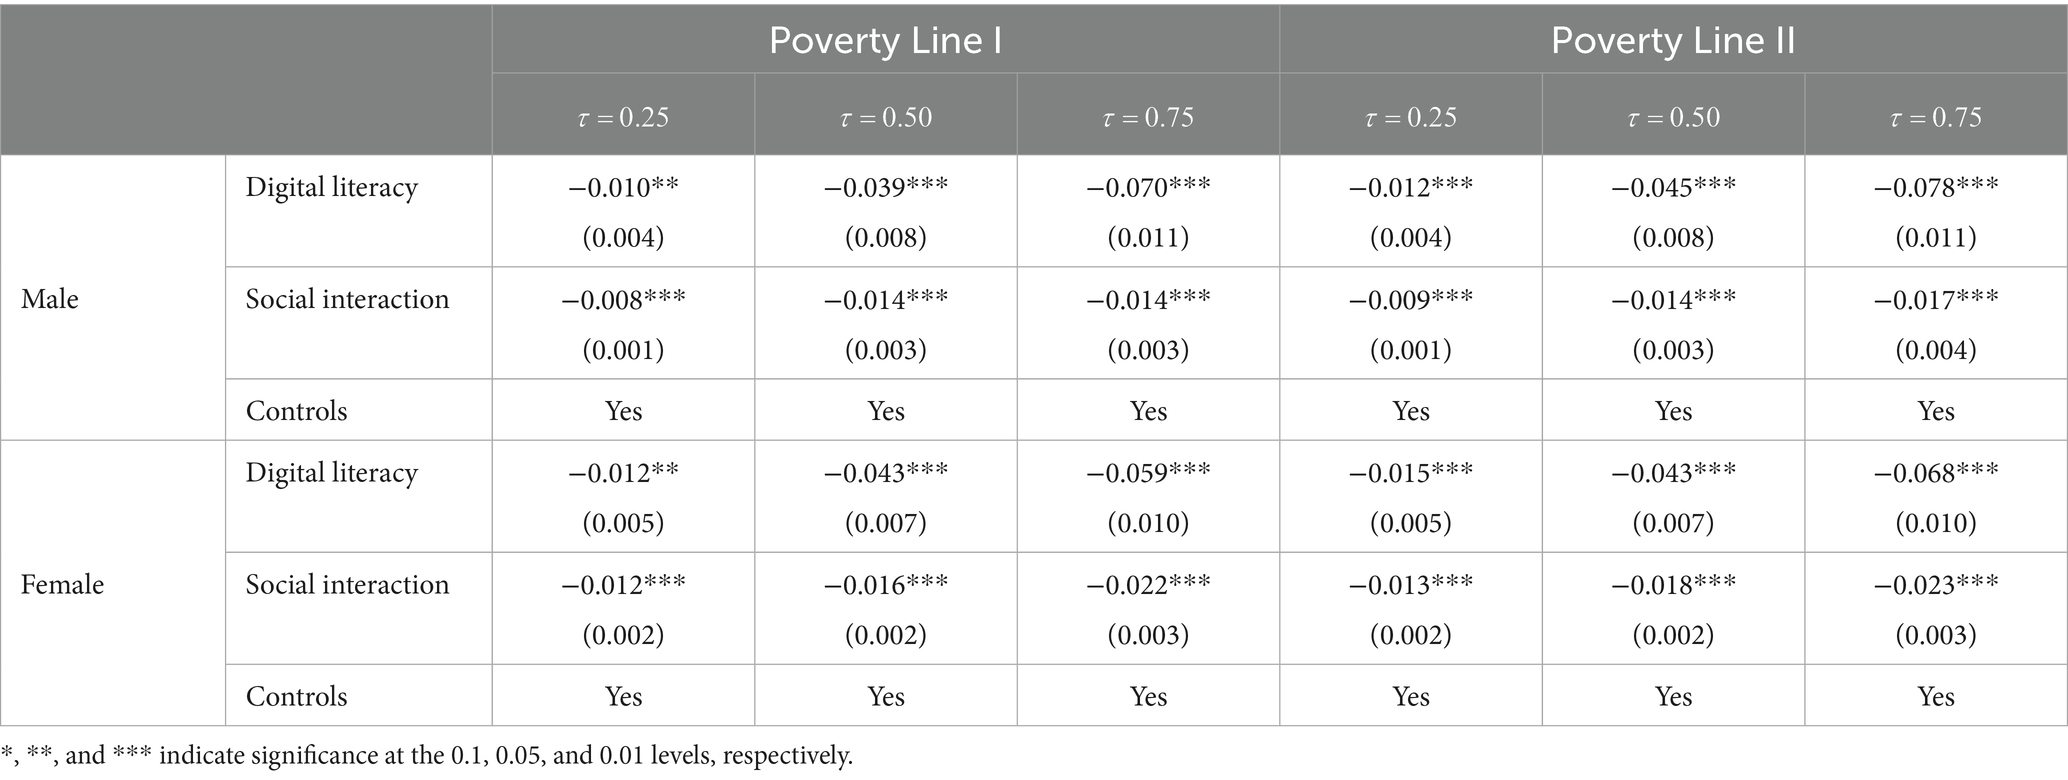
Next, let us examine the heterogeneity analysis of the impact of household head gender on relative poverty, as shown in Table 10.
From Table 10, it can be observed that under different household head genders, both digital literacy and social interaction have a significant mitigating effect on relative poverty within families, with the strongest effect observed in high-poverty families, followed by medium- and low-poverty families. Looking at digital literacy, the increase in digital literacy among male household heads in high-poverty families has a higher mitigating effect on relative poverty than females, whereas for medium- and low-poverty families, the opposite is true—the increase in digital literacy among female household heads has a higher mitigating effect than males. The increase in social interaction among female household heads has a higher mitigating effect on relative poverty than males, which may be due to the fact that the increase in social interaction for females leads to more opportunities to participate in social work and life activities, thereby resulting in a higher mitigating effect.
6 Threshold effect
Based on the previous estimation results, it is known that both digital literacy and social interaction have significant negative effects on the multidimensional relative poverty level of families. However, considering that the impact of digital literacy and social interaction on relative poverty may not always be linear, and that it may show dynamic and nonlinear characteristics at different levels of digital literacy and social interaction, this section aims to deeply analyze whether there exists a nonlinear relationship between the core explanatory variables and multidimensional relative poverty. To do this, the threshold quantile regression model proposed by Zhou and Zhang (2020) is used to estimate the aforementioned nonlinear relationship.
As a widely used nonlinear econometric model, the threshold regression model delves deeper into the dynamic and nonlinear relationships between the dependent variable and some explanatory variables. It measures the dynamic characteristics of the model by examining the different trends before and after the threshold. Quantile regression with a threshold can measure the tail characteristics of the model’s dependent variable, leading to more robust estimation results.
Let be the quantile function of the dependent variable Pov conditional on the explanatory variables W and Controls, and let be the threshold. The thresholdt quantile regression model set in this paper is as follows:
Where is the intercept at quantile , and are the coefficients for the core explanatory variable W (Digital Literacy: DL or Social Interaction: SI) before and after the threshold, respectively. is the coefficient for the other control variables, . Table 11 presents the estimates from the threshold quantile regression model.
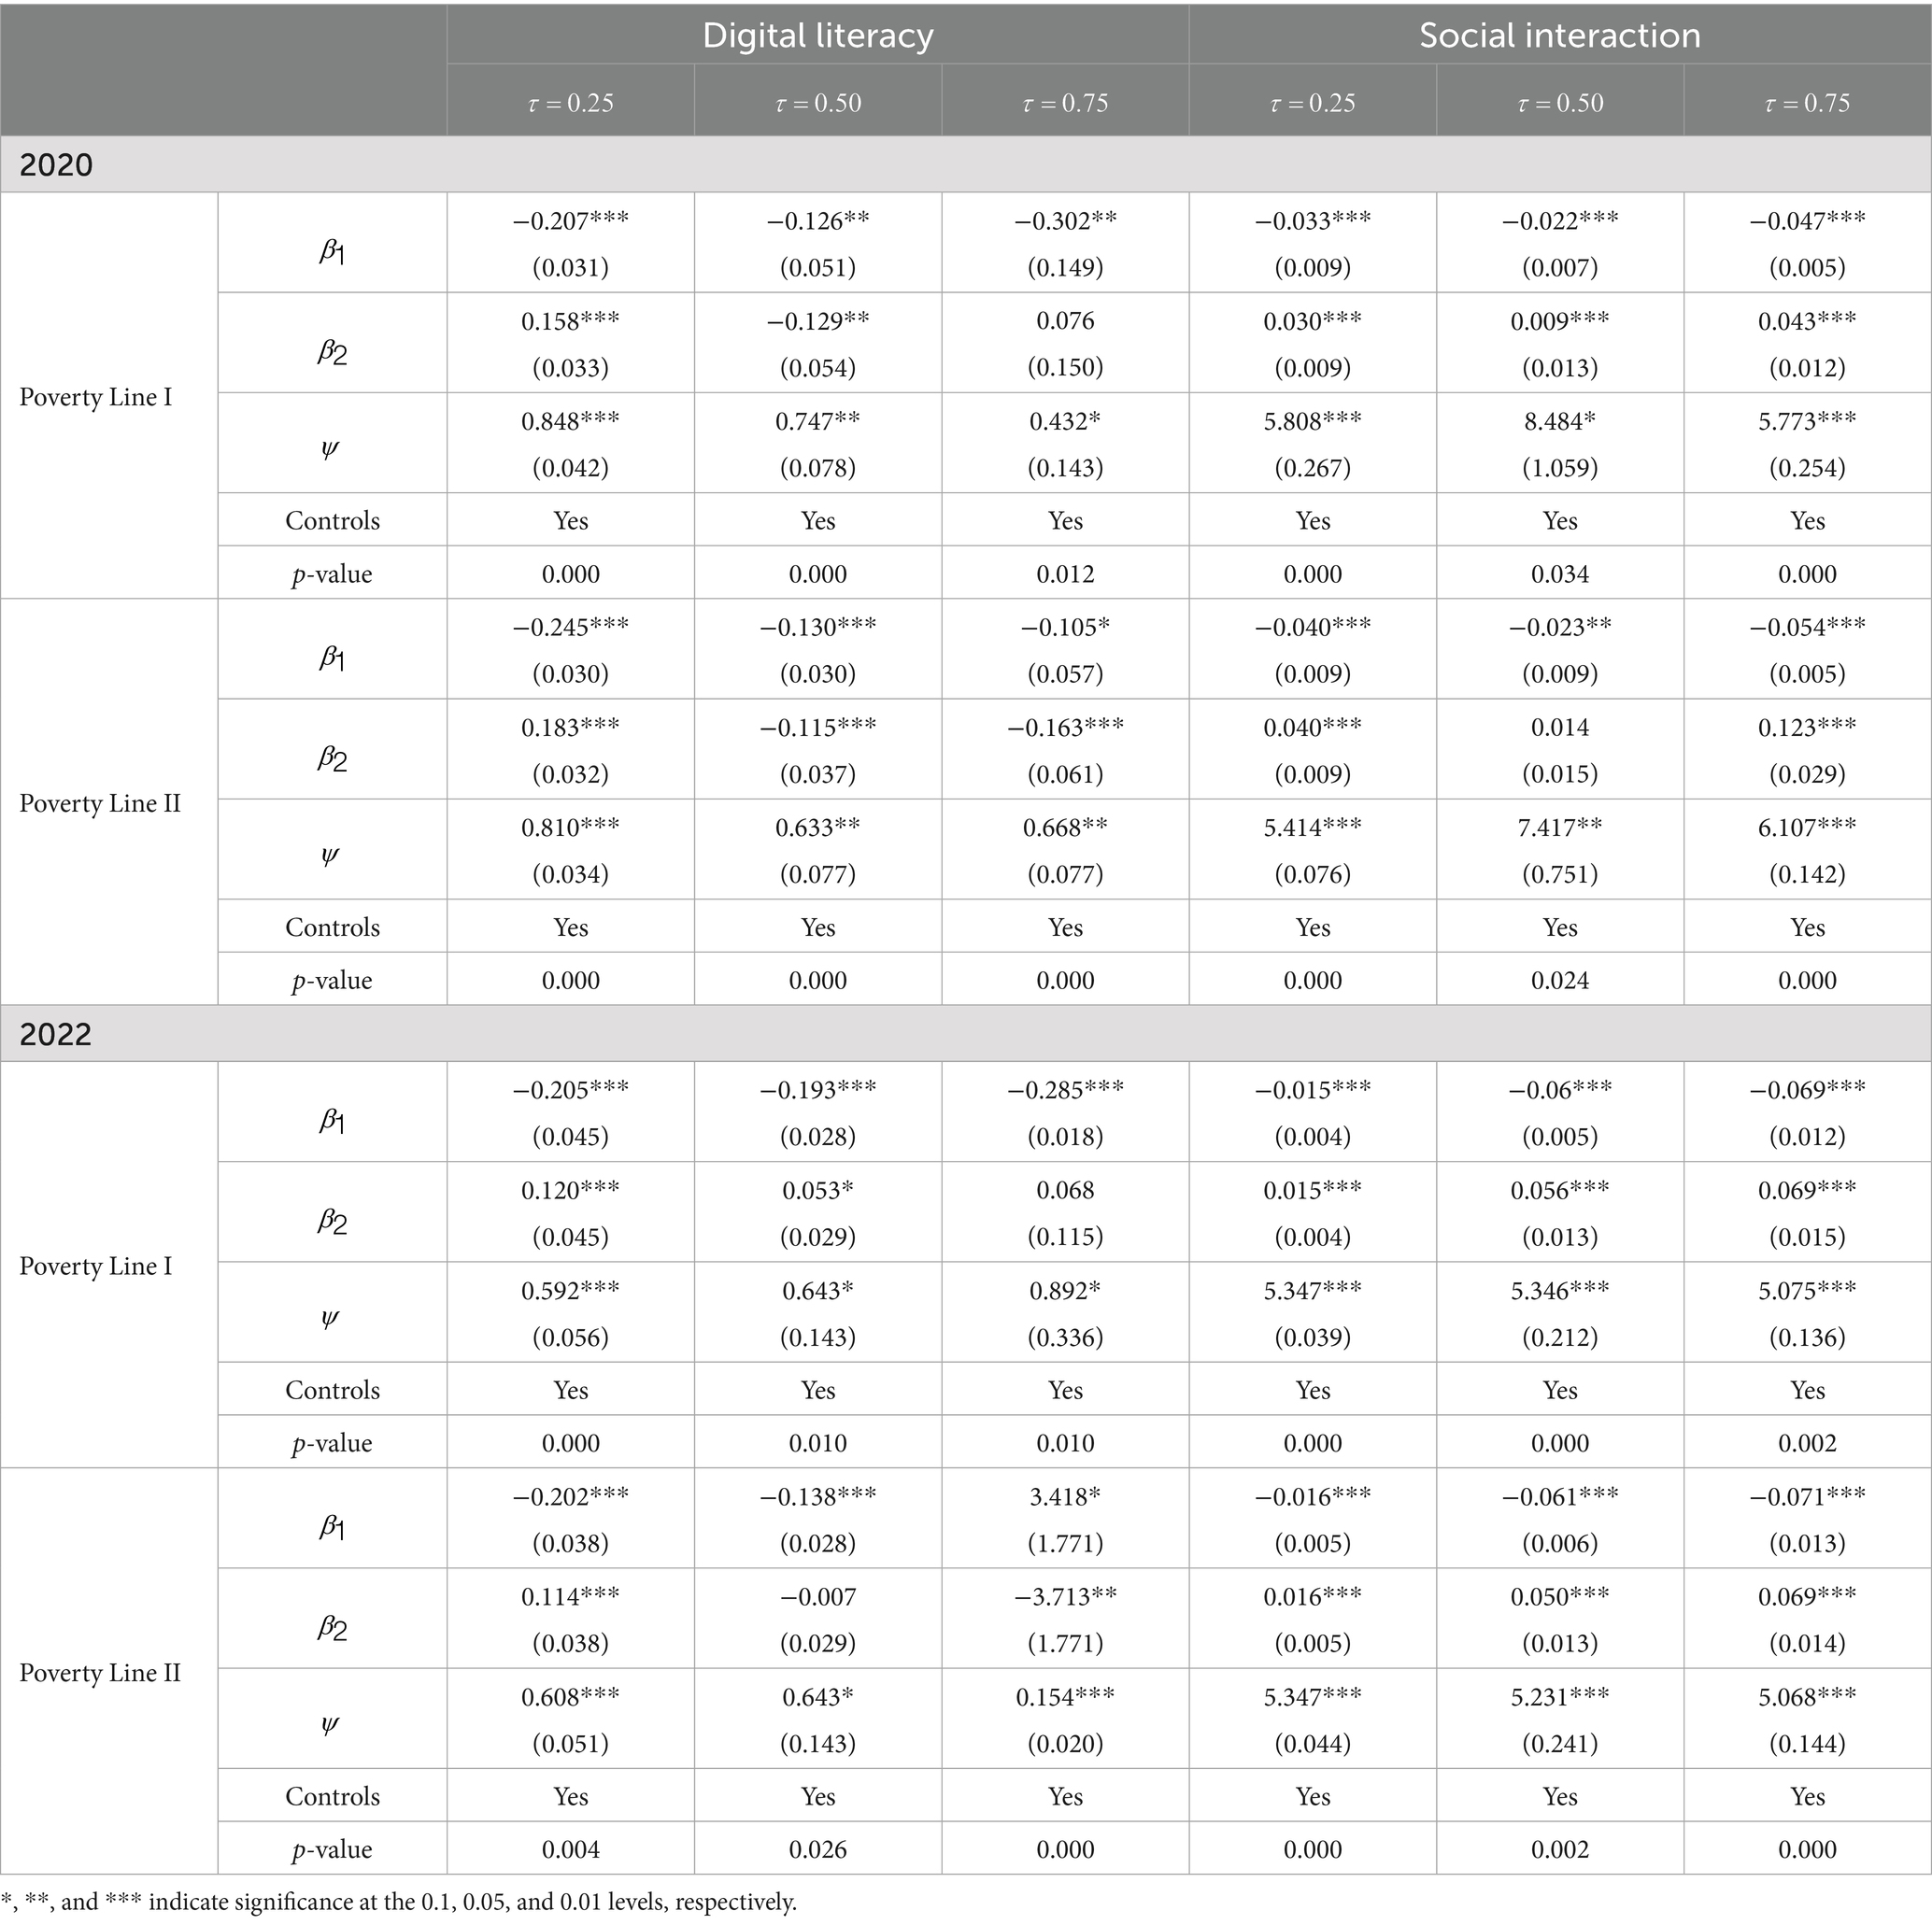
Table 11. Estimation of threshold quantile regression model under two poverty lines and different quantiles in 2020 and 2022.
Based on Table 11, the following conclusions can be drawn:
(1) The QLR test results demonstrate statistically significant threshold effects across all quantiles, with all p-values being below the 0.05 significance level. This provides robust evidence for the existence of distinct regimes in the relationship between digital literacy, social interaction and relative poverty throughout the conditional distribution. The null hypothesis is H0: for any , the alternative hypothesis is H0: , for some . Therefore, the null hypothesis of no threshold is rejected, indicating the rationality of using the threshold quantile regression model in this section. Under different poverty lines and quantiles, there is a threshold for both digital literacy and social interaction. The threshold for digital literacy ranges between 0.726 and 0.883, while the threshold for social interaction ranges between 2.359 and 3.348, confirming the validity of hypotheses 3a and 3b.
(2) Taking Poverty Line I as an example, the poverty reduction effect of digital literacy is significantly negatively correlated before the threshold (at τ = 0.50, the threshold is at 0.720. Since digital literacy is an index from Table 2, the threshold value of 0.720 means that the model structure changes when the value of the index is below or exceeds 0.720.) as indicated in columns 3, 4, and 5. The poverty reduction effect increases with the severity of family poverty, with reductions of 0.049, 0.090, and 0.092, respectively. However, after digital literacy exceeds 0.720, the increase in digital literacy does not reduce poverty levels but shows a trend of increase, with increments of 0.060, 0.073, and 0.053, respectively. This suggests that the poverty reduction effect of digital literacy is not always effective and only works before the threshold. The conclusions for Poverty Line II are similar and are not repeated here.
(3) Looking at social interaction, still using Poverty Line I as an example, the poverty reduction effect of social interaction is significantly positively correlated before the threshold (at τ = 0.50, the threshold is at 2.359, which means that the model structure changes when the communication expenditure is around 10.58 yuan.) as indicated in columns 6, 7, and 8. Only when social interaction exceeds 2.359 does the increase in social interaction effectively reduce relative poverty levels, meaning the poverty reduction effect of social interaction is only effective after the threshold. The strongest poverty reduction effect of social interaction is on middle-poverty families, reaching 0.477 after the threshold, followed by low-poverty families at 0.079, and the weakest effect is on high-poverty families at 0.039. This indicates that while an increase in social interaction can produce a poverty reduction effect after a certain point, the effect is not strong. This also explains the phenomenon from another perspective where the estimation results of social interaction in the baseline regression and robustness regression are significant but close across different quantiles, and the second-stage regression results of the endogeneity test are also close.
7 Conclusions and recommendations
This study investigates the issue of relative poverty among urban and rural households in China before and after the comprehensive poverty alleviation campaign, based on data from the China Family Panel Studies (CFPS) in 2020 and 2022. The study comprehensively considers six dimensions—income, education, health, living conditions, social security, and subjective evaluations—to construct a household relative poverty index under both national and provincial poverty standards. The results from the quantile regression model indicate that improvements in digital literacy and social interaction help alleviate household relative poverty across different quantiles. Enhancing external information access and internal information processing capabilities can reduce information uncertainty, thereby effectively mitigating relative poverty. The improvement of digital literacy and social interaction has a more significant impact on reducing relative poverty for high-poverty households but a lesser effect on low-poverty households. The results are further supported by endogeneity, robustness, and heterogeneity tests. Under different poverty lines, the effects of digital literacy and social interaction on alleviating relative poverty are similar but show minor differences.
The findings from the threshold quantile regression model reveal a nonlinear relationship between digital literacy, social interaction, and household relative poverty. Both factors exhibit a threshold: for digital literacy, the effect shifts from alleviating poverty before the threshold to exacerbating it afterward, while for social interaction, the effect initially increases and then decreases around the threshold. Improvements in education level and marital status effectively reduce relative poverty, with a stronger impact on high-poverty households. In contrast, factors such as a higher proportion of children and elderly in the household exacerbate relative poverty, particularly for high-poverty households.
The policy insights derived from our paper offer far-reaching reference value for developing countries. When it comes to establishing poverty lines, it is highly recommended to institute a multi-dimensional poverty evaluation system that integrates a unified national standard with complementary local standards. This system comprehensively appraises indicators spanning multiple dimensions, including income, education, and health, and incorporates a dynamic adjustment mechanism. Such an approach not only secures the accuracy of poverty identification but also caters to the developmental disparities across different regions, thus presenting a practical way for countries to craft localized poverty criteria.
In view of the variations in family poverty levels, this research introduces an innovative approach of hierarchical intervention. For families mired in high-poverty-households, a comprehensive strategy involving the enhancement of digital literacy and social interaction should be implemented to primarily tackle the issue of inadequate basic development capabilities. For low-poverty-households, the emphasis should pivot towards support such as entrepreneurial facilitation to avoid the diminishing marginal returns of resource allocation. This precisely-targeted intervention methodology can substantially boost the efficiency of poverty alleviation resource utilization, which is of great significance for developing countries with scarce resources.
Regarding the improvement of digital literacy, this research advocates for the execution of a promotion strategy featuring infrastructure universal access and stratified capacity training. Specifically, it is crucial to guarantee the accessibility of network connectivity and terminal devices and offer customized training based on the digital proficiency levels of households to lower the usage cost. The cultivation of social interaction should follow a step-by-step path of expanding its breadth. In the initial stage, the focus should be on nurturing community mutual-assistance and e-commerce platforms. In the subsequent stage, it should shift to skill training and resource matching to establish a self-sustaining social capital accumulation mechanism.
Notably, both digital literacy and social interaction display pronounced threshold effects, which carry profound implications for policy design. The poverty alleviation efficacy of digital literacy will taper off after reaching the threshold value, indicating the necessity of establishing a dynamic evaluation mechanism to promptly modify the training content and support methods. The benefit curve of social interaction takes on an inverted U-shape, demanding a timely realignment of policy priorities at specific junctures. This evidence based non-linear policy mindset can assist countries in steering clear of the “one-size-fits-all” intervention approach and enhancing the precision and effectiveness of poverty alleviation measures.
The policy framework of our paper not only offers novel perspectives for China’s relative poverty governance but also contributes Chinese acumen to surmounting the poverty alleviation challenges faced by developing countries. Especially against the backdrop of the rapid development of the digital economy, the poverty alleviation path that combines digital empowerment and social capital provides a valuable reference for countries to innovate poverty alleviation models. Future research can further explore the combination patterns and implementation prerequisites of policy tools under diverse national contexts to drive high quality development in the global poverty alleviation efforts.
Data availability statement
Publicly available datasets were analyzed in this study. This data can be found here: https://www.isss.pku.edu.cn/cfps/.
Author contributions
XL: Supervision, Conceptualization, Data curation, Investigation, Writing – original draft, Funding acquisition. XW: Methodology, Validation, Software, Formal analysis, Writing – review & editing.
Funding
The author(s) declare that financial support was received for the research and/or publication of this article. This paper was supported by the National Social Science Foundation of China “Measurement and Governance Path of Multidimensional Relative Poverty of Farm Households in the Northwest Regions” (22XMZ059).
Acknowledgments
We are grateful to two referees and the Editor for their helpful comments.
Conflict of interest
The authors declare that the research was conducted in the absence of any commercial or financial relationships that could be construed as a potential conflict of interest.
Generative AI statement
The authors declare that no Gen AI was used in the creation of this manuscript.
Any alternative text (alt text) provided alongside figures in this article has been generated by Frontiers with the support of artificial intelligence and reasonable efforts have been made to ensure accuracy, including review by the authors wherever possible. If you identify any issues, please contact us.
Publisher’s note
All claims expressed in this article are solely those of the authors and do not necessarily represent those of their affiliated organizations, or those of the publisher, the editors and the reviewers. Any product that may be evaluated in this article, or claim that may be made by its manufacturer, is not guaranteed or endorsed by the publisher.
References
Alkire, S., and Foster, J. (2011). Counting and multidimensional poverty measurement. J. Public Econ. 95, 476–487. doi: 10.1016/j.jpubeco.2010.11.006
Alkire, S., and Santos, M. E. (2014). Measuring acute poverty in the developing world: robustness and scope of the multidimensional poverty index. World Dev. 59, 251–274. doi: 10.1016/j.worlddev.2014.01.026
Bourguignon, F., and Chakravarty, S. R. (2003). The measurement of multidimensional poverty. J. Econ. Inequal. 1, 25–49. doi: 10.1023/A:1023913831342
Burchi, F., Malerba, D., Montenegro, C. E., and Rippin, N. (2022). Assessing trends in multidimensional poverty during the MDGs. Rev. Income Wealth 68, 317–S346. doi: 10.1111/roiw.12578
Caplin, A., and Dean, M. (2015). Revealed preference, rational inattention, and costly information acquisition. Am. Econ. Rev. 105, 2183–2203. doi: 10.1257/aer.20140117
Chen, S., and Ravallion, M. (2021). Reconciling the conflicting narratives on poverty in China. J. Dev. Econ. 153:102711. doi: 10.1016/j.jdeveco.2021.10271
Decerf, B. (2021). Combining absolute and relative poverty: income poverty measurement with two poverty lines. Soc. Choice Welfare 56, 325–362. doi: 10.1007/s00355-020-01279-7
Deininger, K., and Olinto, P. (2001). Rural nonfarm employment and income diversification in Colombia. World Dev. 29, 455–465. doi: 10.1016/S0305-750X(00)00106-6
Dewan, A., and Neligh, N. (2020). Estimating information cost functions in models of rational inattention. J. Econ. Theory 187:105011. doi: 10.1016/j.jet.2020.105011
Feng, X. N., Lu, B., Song, X. Y., Feng, X., Song, X., and Ma, S. (2019). Financial literacy and household finances: a Bayesian two-part latent variable modeling approach. J. Empir. Financ. 51, 119–137. doi: 10.1016/j.jempfin.2019.02.002
Fritzell, J., Rehnberg, J., Hertzman, B. J., and Blomgren, J. (2015). Absolute or relative? A comparative analysis of the relationship between poverty and mortality. Int. J. Public Health 60, 101–110. doi: 10.1007/s00038-014-0614-2
Haggblade, S., Hazell, P., and Reardon, T. (2010). The rural non-farm economy: prospects for growth and poverty reduction. World Dev. 38, 1429–1441. doi: 10.1016/j.worlddev.2009.06.008
Helsper, E. J. (2021). The digital disconnect: The social causes and consequences of digital inequalities. London: Sage.
Koenker, R., and Bassett, J. G. (1978). Regression quantiles. Econometrica 46, 33–50. doi: 10.2307/1913643
Li, Y., and Huang, Y. Y. (2025). Social security, digital literacy, and relative poverty in China. Financ. Res. Lett. 71:106446. doi: 10.1016/j.frl.2024.106446
Manski, C. F. (2000). Economic analysis of social interactions. J. Econ. Perspect. 14, 115–136. doi: 10.1257/jep.14.3.115
McLachlan, H. V. (2007). Townsend and the concept of “poverty”. Soc. Policy Adm. 17, 97–105. doi: 10.1111/j.1467-9515.1983.tb00181.x
Njong, A. M., and Ningaye, P. (2008). Characterizing weights in the measurement of multidimensional poverty: an application of data-drive approaches to cameroonian data. OPHI Working paper, No. 21.
Royce, E. (2009). Poverty and power: A structural perspective on American inequality. Washington: Rowman and Littlefield Publishers, Inc.
Sen, A. (1976). Poverty: an ordinal approach to measurement. Econometrica 44:219. doi: 10.2307/1912718
Shen, Y., and Li, S. (2022). Eliminating poverty through development: the dynamic evolution of multidimensional poverty in rural China. Econ. Polit. Stud. 10, 85–104. doi: 10.1080/20954816.2022.2028992
Townsend, P. (1979). Poverty in the United Kingdom:A survey of household resources and standards of living. Berkeley: University of California Press.
Tsui, K. (2002). Multidimensional poverty indices. Soc. Choice Welfare 19, 69–93. doi: 10.1007/s355-002-8326-3
Van Dijk, J. A. G. M. (2005). The deepening divide: Inequality in the information society. Thousand Oaks: Sage.
Wan, G. H., Hu, X. S., and Liu, W. Q. (2021). China's poverty reduction miracle and relative poverty: focusing on the roles of growth and inequality. China Econ. Rev. 68:101643. doi: 10.1016/j.chieco.2021.101643
Warschauer, M. (2003). Demystifying the digital divide. Sci. Am. 289, 42–47. doi: 10.1038/scientificamerican0803-42
Wu, T. (2024). Digital divide, social security, and relative poverty in Chinese households. Int. Rev. Econ. Finance. 96:103716. doi: 10.1016/j.iref.2024.10371
Wu, W. S., Li, S., Tan, C. C., and Sheng, S. J. (2022). The theory and evidence of Chinese household risk asset allocation from the perspective of information uncertainty. Syst. Eng. Theory Pract. 42, 60–75. doi: 10.12011/SETP2020-2867
Yang, N., Wang, Y., Jin, H., Qi, Q., and Yang, Y. (2024). Impacts of internet information literacy on farmers’ relative poverty vulnerability: evidence from CGSS survey data in China. Soc. Indic. Res. 178, 1169–1200. doi: 10.1007/s11205-024-03377-w
Zhang, J., Wang, D. Q., Ji, M., Yu, K., Wang, D., Qi, M., et al. (2024). Digital literacy, relative poverty, and common prosperity for rural households. Int. Rev. Financ. Anal. 96:103739. doi: 10.1016/j.irfa.2024.103739
Zhou, D., Zha, F. J., Qiu, W. Y., Zha, F., Qiu, W., and Zhang, X. (2024). Does digital literacy reduce the risk of returning to poverty? Evidence from China. Telecommun. Policy 48:102768. doi: 10.1016/j.telpol.2024.102768
Zhou, X., and Zhang, F. (2020). Bent line quantile regression via a smoothing technique. Stat. Anal. Data Min. 13, 216–228. doi: 10.1002/sam.11453
Zou, W., Cheng, X., Fan, Z., and Yin, W. (2023). Multidimensional relative poverty in China: identification and decomposition. Sustainability 15:4869. doi: 10.3390/su15064869
Keywords: digital literacy, social interaction, relative poverty, threshold effect, quantile regression model
Citation: Li X and Wang X (2025) Digital literacy, social interaction, and relative poverty in Chinese households. Front. Hum. Dyn. 7:1644928. doi: 10.3389/fhumd.2025.1644928
Edited by:
Juan Sebastián Fernández-Prados, University of Almeria, SpainReviewed by:
Prasongchai Setthasuravich, The University of Tokyo, JapanSensen Jin, Hanjiang Normal University, China
Copyright © 2025 Li and Wang. This is an open-access article distributed under the terms of the Creative Commons Attribution License (CC BY). The use, distribution or reproduction in other forums is permitted, provided the original author(s) and the copyright owner(s) are credited and that the original publication in this journal is cited, in accordance with accepted academic practice. No use, distribution or reproduction is permitted which does not comply with these terms.
*Correspondence: Xiaogang Wang, d2FuZ3hnOTEwMkAxNjMuY29t
 Xuewen Li1
 Xiaogang Wang