 Mingxing Zhong
- School of Tourism, Xinyang Normal University, Xinyang, China
The development of cultural pluralism represents a prevailing global trend, and investigating cultural diversity in China is pivotal for advancing the nation’s cultural prosperity strategy. This study measures aggregate, urban, and rural cultural diversity indices across China from 1990 to 2020, utilizing ethnic composition data from the Fourth to Seventh National Population Censuses of China and applying the Shannon-Wiener Diversity Index. Regional disparities and spatial correlations are further analyzed through the Dagum Gini coefficient, Moran’s I, and a gravity model. Key findings reveal: (1) China’s cultural diversity exhibits a continuous upward trend across all levels, with a consistent regional hierarchy of Western > Northeastern > Central > Eastern. (2) The national Gini coefficient demonstrates a persistent decline at all levels. Subregional variations include: the Eastern region showing the steepest decline; the Northeastern region displaying an increasing trend; the Western region experiencing slight growth in urban areas but minor declines in aggregate and rural measures; and the Central region recording a marginal aggregate decrease alongside continuous rises in urban/rural disparities. These results underscore pronounced interprovincial heterogeneity in cultural diversity distribution. (3) Spatial autocorrelation analysis identifies intensifying clustering patterns, with the Western region forming “high-high” clusters and the Eastern region exhibiting “low-low” agglomerations. (4) Interregional connectivity, as quantified by the gravity model, grows increasingly complex and dense, ultimately evolving into a C-shaped strong linkage network spanning northern-western-southern China. This study provides empirical insights for fostering ethnic cultural integration and supporting China’s cultural power strategy.
1 Introduction
Culture serves as a fundamental pillar for human survival and development, while also acting as a critical determinant of social inclusivity and national competitiveness (Huntington, 1996; Lee et al., 2025; Scott, 2009). Globally, the shift from cultural homogenization to multipolarity and pluralism has emerged as an irreversible trend. The importance of cultural diversity is increasingly recognized by scholars and countries, who are conducting ongoing research on this topic (Klebl et al., 2025; Lee et al., 2025). China exemplifies this transition, as articulated in its “14th Five-Year Plan for Cultural Development”: Culture constitutes the soul of a nation and the cornerstone of governance. Socialist modernization is unattainable without the flourishing development of socialist culture. Accurately assessing cultural integration and diversity, and fostering cultural prosperity in response to contemporary shifts, are imperative for refining ethnic-cultural governance in the new era, consolidating the consciousness of a China’s national community, and advancing the construction of China’s autonomous ethnological knowledge system (He and Zhang, 2024; Xie et al., 2022). Against this backdrop, examining cultural diversity patterns holds significant implications for both the cultural power strategy and high-quality economic development.
Currently, a substantial body of research continues to explore the significant role of cultural diversity in the development of human societies (Eyiah et al., 2025; Liu et al., 2025; Wang et al., 2025). For instance, within a team setting, high cultural diversity has been shown to enhance team dynamics, productivity, and project success (Eyiah et al., 2025), while also positively moderating the perception of organizational team behavior (Eluère et al., 2025). At the corporate level, cultural diversity may increase litigation risks for enterprises (Xia and Song, 2024). However, some studies also indicate that cultural diversity can significantly advance the development of artificial intelligence within companies by fostering innovation (Liu et al., 2025). Moreover, many countries around the world, particularly in Europe, have positioned culture as a critical domain for national stability and development (Farchy and M’Barki, 2024). Currently, cultural diversity has become a focus for many political leaders in Europe and a fundamental objective of any cultural policy. Despite being a political priority, cultural diversity remains an ambiguous term, and efforts are ongoing to identify objective elements that could facilitate its evaluation (Farchy and M’Barki, 2024).
Currently, research on cultural diversity has been burgeoning in academia (He and Zhang, 2024; Dai and Guo, 2025; Zhong and Shi, 2025). This is first reflected in the conceptual underpinnings of cultural diversity. Culture encompasses a rich tapestry of connotations and extensive denotations. As defined by the Mexico City Declaration on Cultural Policies, culture constitutes “a comprehensive whole that embodies the distinctive spiritual, material, intellectual, and emotional features of a society, encompassing not only arts and literature but also lifestyles, fundamental human rights, value systems, traditions, and beliefs” (Qu and Meng, 2014). Consequently, discussions on cultural diversity inevitably encounter challenges in delineating its conceptual boundaries and extensions. The academic community has yet to reach a consensus on a unified definition of “cultural diversity” (Cowen, 2008). In practice, the term embodies multilayered meanings. Cultural diversity encompasses both the plurality of national cultures across nations and the diversity of cultural choices accessible to consumers within a nation (Cowen, 2008). It manifests not only in the expression, promotion, and transmission of rich and varied cultural heritages, but also in the creation, production, dissemination, and consumption of cultural and artistic works through diverse mediums and technologies (UNESCO, 2005). Furthermore, cultural diversity manifests in the coexistence of multiple subcultural groups within specific regions, where intercultural exchange fosters greater social inclusivity (Stouffer, 1955). Synthesizing existing scholarship, we can understand it from two aspects: (1) From the perspective of human civilization development, UNESCO defines cultural diversity as “the various forms in which different groups and societies express their cultures”(Allain and Waelbroeck, 2006; Igartua, 2013; Liu et al., 2025). This approach operationalizes diversity through metrics like: Cultural heritage preservation; Pluralism in cultural products/services. (2) Demographic mobility perspective: Measures diversity through linguistic, ethnic, and religious heterogeneity within nations/regions (Duan et al., 2024; Feng et al., 2021).
Secondly, there is the measurement of cultural diversity. The measurement of cultural diversity has been significantly advanced through interdisciplinary approaches, with economists (Stirling, 1998) drawing upon biological diversity (Weitzman, 1992) and portfolio theory (Markowitz, 1955) to propose a tripartite framework encompassing: richness, evenness and disparity. Richness reflects taxonomic granularity, where greater categorical subdivision indicates higher diversity. Evenness measures distributional equity, with maximum diversity occurring when all categories achieve perfect proportionality. Disparity evaluates inter-category heterogeneity, where greater phenotypic or semantic differentiation enhances diversity metrics. Currently, evenness-based assessments dominate empirical research, employing two principal indices: Simpson Index (Simpson, 1949) - A mathematical metric quantifying evenness through the sum of squared category proportions, reflecting the dispersion of cultural product distributions. However, this index exhibits notable limitations: its quadratic calculation amplifies sensitivity to dominant and marginal categories, potentially distorting true evenness assessments. Shannon-Weiner Index - Developed by Shannon - widely applied in biodiversity and landscape ecology studies (Kratschmer et al., 2019; Shannon, 1997; Zhong et al., 2019). This entropy-based measure demonstrates superior robustness in: Accounting for both category richness and proportional distribution, mitigating bias from extreme proportional values, and enabling cross-system comparability. In the selection of cultural diversity metrics, contemporary research predominantly employs three key analytical dimensions: Ethnic/Racial Composition (Amin and Murshed, 2025; Omorov et al., 2025; Steele et al., 2022), Linguistic Variation (Hu et al., 2022; T. Wang et al., 2025), and Cultural Industries/Products (Allain and Waelbroeck, 2006; Jacoby et al., 2024). These approaches are substantiated by cross-disciplinary validation (Qu and Zeng, 2014; Steele et al., 2022), with each dimension offering distinct methodological advantages for operationalizing UNESCO’s conceptual framework on cultural diversity. However, due to the inherent ambiguity in linguistic boundaries and the challenges in obtaining precise demographic data of language speakers, current measurements of linguistic diversity are largely confined to enumerating the number of distinct languages within a given region (Wang et al., 2025; Xu et al., 2015). This quantitative approach, while methodologically straightforward, fails to capture qualitative dimensions such as language vitality or intergenerational transmission. From the perspective of cultural products and services, traditional media (books, broadcasting) and digital platforms (online content, smart devices) play a pivotal role in showcasing cultural diversity. Nevertheless, the representational adequacy of these mediums in reflecting the nuanced realities, complex dynamics, and temporal variability of cultural diversity remains contested (UNESCO, 2009). Key limitations include: the commodification bias in cultural production, digital divide effects on accessibility, and algorithmic homogenization in content distribution. Ethnic groups encapsulate distinct social structures characterized by shared linguistic systems, religious beliefs, customary practices, territorial affiliations, and subsistence patterns, thereby constituting the foundational stratum of cultural diversity (Steele et al., 2022). The composite nature and inherent pluralism of ethnic identity position cultural diversity as the core manifestation of cultural diversity.
Furthermore, spatiotemporal variations in cultural diversity represent a critical yet underexplored issue in current academic research, while also serving as a key basis for the formulation, implementation, and revision of cultural policies across nations (Farchy and M’Barki, 2024; Lee et al., 2025). For example, an assessment of the spatial distribution of biocultural diversity in Colombia revealed specific locations within the region with significant ecotourism potential (Echeverri et al., 2024). Lee et al. (2025), through a survey and analysis of cultural diversity in urban populations of France, Brazil, and Germany, found that large cities are culturally diverse not only because they aggregate people from different backgrounds, but also because cultural interactions and discoveries create more opportunities. A study of 293 prefecture-level cities in China indicated that cultural diversity has a negative impact on entrepreneurship (Wang et al., 2025). Thus, cultural diversity has become an important foundation for development in other fields. However, these studies are primarily based on spatial variations in cultural diversity, with relatively fewer comparisons across temporal scales.
In summary, current academic research on the spatiotemporal evolution of cultural diversity remains insufficient. This gap stems partly from the complexity of measuring cultural diversity and partly from challenges in obtaining adequate samples. This study attempts to measure the spatial variations of cultural diversity in China using ethnic population data from the Fourth to Seventh National Population Censuses. The advantages of this dataset are as follows: first, it covers all provinces and ethnic populations in China, offering more comprehensive representativeness compared to other cultural product data. Second, the data were collected over four survey rounds (once every decade), allowing not only for horizontal comparisons but also for longitudinal time-series analysis. This holds significant implications for the formulation and adjustment of national cultural policies.
Furthermore, conducting research on cultural diversity in China offers additional advantages. Chinese vast territory encompasses complex geographical gradients and diverse ecosystems, which have fostered distinct regional cultures and ultimately shaped its identity as a multi-ethnic nation comprising 56 officially recognized ethnic groups (Duan et al., 2024; Sun and Gao, 2022). The historical interplay between varied environmental conditions (altitude, climate, and resource availability) and traditional livelihoods (pastoralism, agriculture, hunting-gathering) has generated unique cultural configurations among ethnic communities. These cultural distinctions manifest not only in material practices and customs but also in fundamental cognitive frameworks, including value systems, thought patterns, and behavioral dispositions (Duan et al., 2024; Sun and Gao, 2022). In recent years, China has witnessed accelerated interprovincial population mobility driven by the dual forces of household registration system reforms and rapid urbanization. This large-scale demographic transition has produced two salient spatial effects: significant alterations in regional population magnitudes across administrative units and fundamental restructuring of population compositions. This large-scale population mobility has catalyzed the dissemination of cultural markers embedded within demographic groups, facilitating intercultural convergence between populations of diverse backgrounds (Wang et al., 2021). Consequently, investigating the spatiotemporal dynamics of China’s cultural diversity holds significant implications for regional economic development and cultural integration. Moreover, it provides scientific guidance for designing differentiated regional strategies based on the spatial differentiation of cultural resources, while contributing a Chinese approach to cultural heritage preservation for multi-ethnic nations worldwide. Ultimately, this research advances the construction of the Chinese national community and facilitates high-quality development objectives.
Based on the aforementioned research background, the primary objective of this study is to reveal the spatio-temporal patterns and regional connections of cultural diversity in China. The specific goals are as follows: (1) To evaluate the spatiotemporal distribution patterns of cultural diversity in China; (2) To explore intra-regional and inter-regional variations in China’s cultural diversity; (3) To uncover connections in cultural diversity between provinces in China. The findings will provide a scientific basis for formulating differentiated population mobility policies and cultural diversity conservation measures in China.
2 Materials and methods
2.1 Data sources
The data utilized in this study were primarily sourced from Chinese Fourth (1990), Fifth (2000), Sixth (2010), and Seventh (2020) National Population Censuses. While the Chinese government officially recognizes 56 ethnic groups, the census data also include populations categorized as “unidentified ethnicities” and “foreigners acquiring Chinese citizenship.” Consequently, our analysis encompasses 58 ethnic categories. For methodological rigor, the study scope was constrained to mainland Chinese 31 provincial-level administrative units (municipalities, provinces, and autonomous regions), excluding Hong Kong, Macao, and Taiwan due to data availability limitations and statistical consistency requirements. The census provides ethnic population statistics across four residential dimensions: aggregate provincial totals, urban districts, town, and rural areas. To align with contemporary urbanization research paradigms, we consolidated urban and town populations into a unified “urban settlement” category. This aggregation yielded three distinct analytical dimensions for measuring cultural diversity: aggregate cultural diversity, urban cultural diversity, and rural cultural diversity.
2.2 Methodology
2.2.1 Measurement of cultural diversity
Diversity indices are quantitative metrics widely employed in ecology, economics, and sociology to measure the richness and evenness of distinct categories (e.g., species, genes, or cultural groups) within a system (Eskelinen et al., 2022; Kestemont et al., 2022; Steele et al., 2022). These indices holistically capture the “diversity” characteristics of a given system. Commonly used diversity measures include the Shannon-Weaver index (Shannon, 1997) and the Simpson index (Simpson, 1949). To analyze cultural diversity, this study adopts the Shannon-Weaver index building upon established methodologies (Lee et al., 2025; Loh and Harmon, 2005; Qu and Meng, 2014). The index is applied to measure China’s provincial-level cultural diversity, with the computational formula as follows:
2.2.2 Dagum Gini coefficient and its decomposition method
Moreover, China’s complex geographical gradients and diverse ecosystems have fostered distinct aggregation patterns of multiple ethnic groups. These patterns exhibit differences not only in administrative divisions (such as provinces and cities) but also in geographical spatial distribution (for example, Southwest China is a major concentration area for ethnic minorities like the Miao and Yi, while the Tibetan Plateau is primarily inhabited by Tibetans). Consequently, national policy formulation and implementation must account for both inter-administrative and local variations. To further analyze the internal and external disparities in regional cultural diversity across China, this study employs the Dagum Gini coefficient, developed by Italian statistician Dagum (1997). Originally designed as an enhanced method for measuring inequality in income or wealth distribution (Dagum, 1997), this coefficient decomposes regional differences into three components: intra-group inequality (within-region variation), inter-group inequality (between-region variation), and transvariation density (overlapping distributions across groups). This methodology has demonstrated significant strengths in spatiotemporal research across other disciplines (Dobbs et al., 2017; Xue et al., 2025). Simultaneously, this decomposition approach provides a powerful framework for identifying the sources of regional disparities in cultural diversity within China (Yang, 2021). The computational formula is as follows:
2.2.3 Spatial autocorrelation analysis
The Moran’s I is commonly used to examine the relationships between specific geographic units and their neighboring units within a spatial context, and to analyze the distributional characteristics of these study units across space (Anselin, 1995; Zhang et al., 2025; Zhong et al., 2025). The Global Moran’s I measures the overall spatial correlation relationships. The Local Moran’s I assesses spatial correlations within subsystems. In this study, we first employ the Global Moran’s I to conduct a comprehensive analysis of the regional spatial association patterns of cultural diversity in China from 1990 to 2020. We then apply the Local Moran’s I to investigate the spatial correlation characteristics of cultural diversity, identifying four distinct clustering patterns: High-High (H-H), Low-Low (L-L), High-Low (H-L), and Low-High (L-H). The Moran’s I can quantitatively determine whether cultural diversity is clustered, dispersed, or randomly distributed in space, and precisely identify the specific regions and types of clustering. It shifts the focus of cultural studies from a “single-point” perspective to a “relational” and “network” perspective, profoundly revealing the spatial dependence and interactive nature of cultural phenomena. Consequently, it provides a critical foundation for macro-level scientific, precise, and efficient cultural regional planning and policy formulation. The equations are as follows:
2.2.4 Spatial correlation analysis based on gravity model
The gravity model, originally based on Newton’s law of universal gravitation, is now widely applied in socio-economic spatial interaction research (Li and Li, 2024). In studies of cultural diversity, this model effectively characterizes the intensity of cross-regional flows of cultural diversity by quantifying both the scale effects and spatial attenuation effects between provincial-level diversity measures. The gravity model transforms abstract spatial relationships of cultural diversity into quantifiable and verifiable scientific questions. It not only theoretically reveals the intrinsic structure and dynamics of cultural diversity in China but also provides precise, scientific guidance for governments in formulating regional cultural policies and for businesses in making cultural market decisions. Ultimately, it serves to optimize the allocation of cultural resources, foster the prosperity of cultural industries, and enhance the nation’s overall cultural soft power. Building upon previous research (Li and Li, 2024; Wang et al., 2022), this study employs a modified gravity model to analyze the connectivity characteristics of cultural diversity among Chinese provinces. The equations are as follows:
3 Results
3.1 Overall characteristics of cultural diversity in China
Analysis based on four national population censuses reveals that aggregate cultural diversity demonstrated a consistent upward trend, increasing from 0.51 in 1990 to 0.55 in 2020 (Figure 1). This progression indicates enhanced cultural integration and intensified interethnic exchanges nationwide. From an urban–rural perspective, there are notable disparities in cultural diversity. The rural cultural diversity has shown the fastest growth rate, increasing rapidly from 0.50 in 1990 (slightly below the national average) to 0.74 in 2020, with the most rapid acceleration occurring during 1990–2000. While urban cultural diversity remains relatively lower in absolute terms, its growth rate exceeds the aggregate cultural diversity, rising from 0.32 in 1990 to 0.44 in 2020. Particularly during 2010–2020, the urban cultural diversity increased by 0.08 points, indicating a narrowing gap with the aggregate cultural diversity.
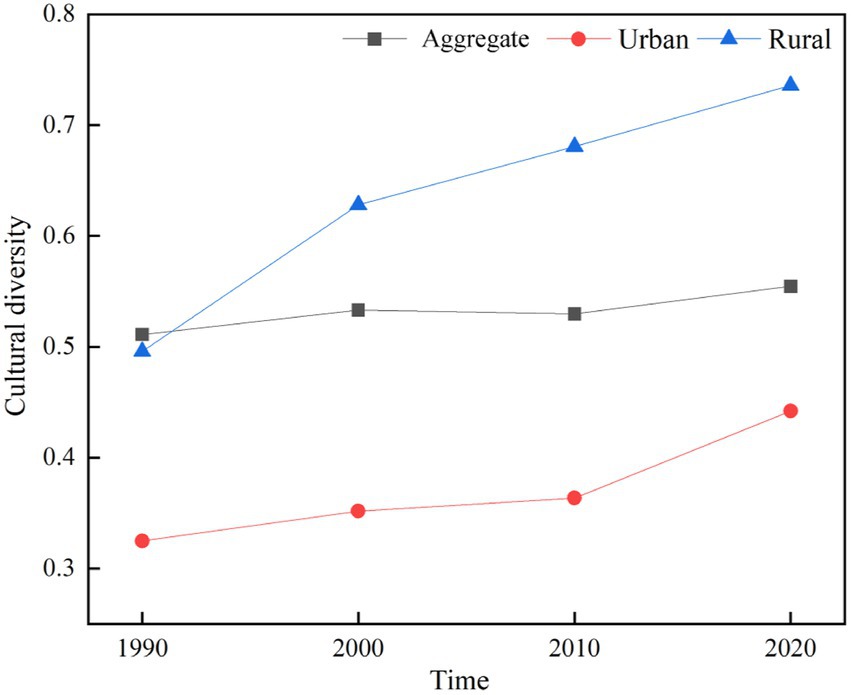
Figure 1. Temporal evolution of cultural diversity in China.
3.2 Regional disparities in cultural diversity in China
Figure 2 illustrates the distribution of cultural diversity indices across Chinese provinces at the aggregate, urban, and rural levels between 1990 and 2020. As shown in Figures 2a,b, the development of aggregate cultural diversity exhibited distinct regional stratification, following a consistent spatial pattern of Western > Northeastern > Central > Eastern regions. The highest diversity levels (aggregate cultural diversity > 1.0) were observed in western provinces including Yunnan, Guizhou, Qinghai, and Xinjiang, where complex topography has fostered multi-ethnic concentrations and consequently higher aggregate cultural diversity. in contrast, eastern and central provinces generally demonstrated lower aggregate cultural diversity, with Shaanxi, Shanxi, Shandong, Henan, Anhui, Jiangsu, Shanghai, Jiangxi, and Fujian persistently maintaining extremely low levels (aggregate cultural diversity < 0.2) due to their predominant Han population concentrations. Temporal analysis revealed notable transitions: between 1990 and 2020, Hebei, Tianjin, Jiangsu, Hubei, and Guangdong progressed from extremely low to relatively low levels (0.2 < aggregate cultural diversity < 0.4), while Gansu, Tibet, and Hunan advanced from relatively low to low levels (0.4 < aggregate cultural diversity < 0.6). Notably, Jilin was the only province exhibiting a decline in diversity ranking. Most provinces demonstrated increasing trends (except Liaoning, Jilin, Heilongjiang, and Xinjiang, see Table 1), though without categorical shifts. The most rapid increases (>0.1) occurred in Tibet, Zhejiang, Guangdong, and Qinghai - with Tibet and Qinghai building upon their already high baseline diversity, while Zhejiang and Guangdong improved from initially low levels. This spatial–temporal pattern suggests that western provinces’ aggregate cultural diversity gains may reflect targeted regional development policies promoting ethnic integration, whereas eastern provinces’ growth likely stems from migration-driven demographic diversification in major population inflow regions like Zhejiang and Guangdong.
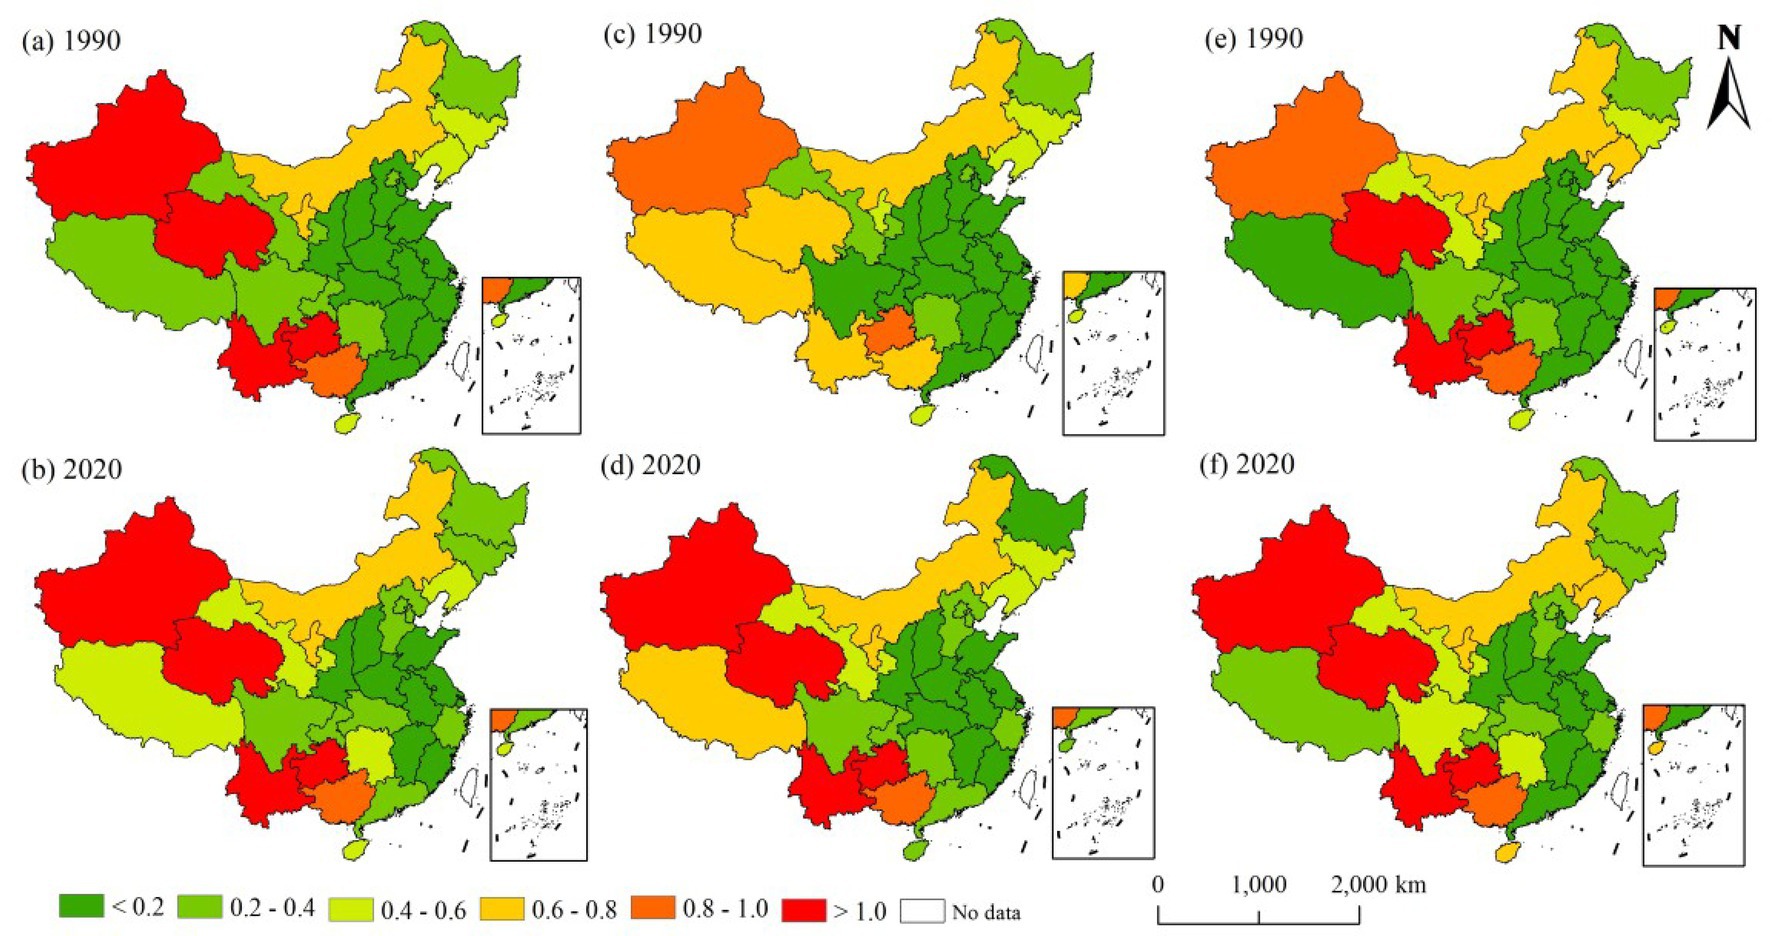
Figure 2. Regional disparities in cultural diversity in China. Aggregate cultural diversity: (a,b), urban cultural diversity: (c,d), and rural cultural diversity: (e,f).
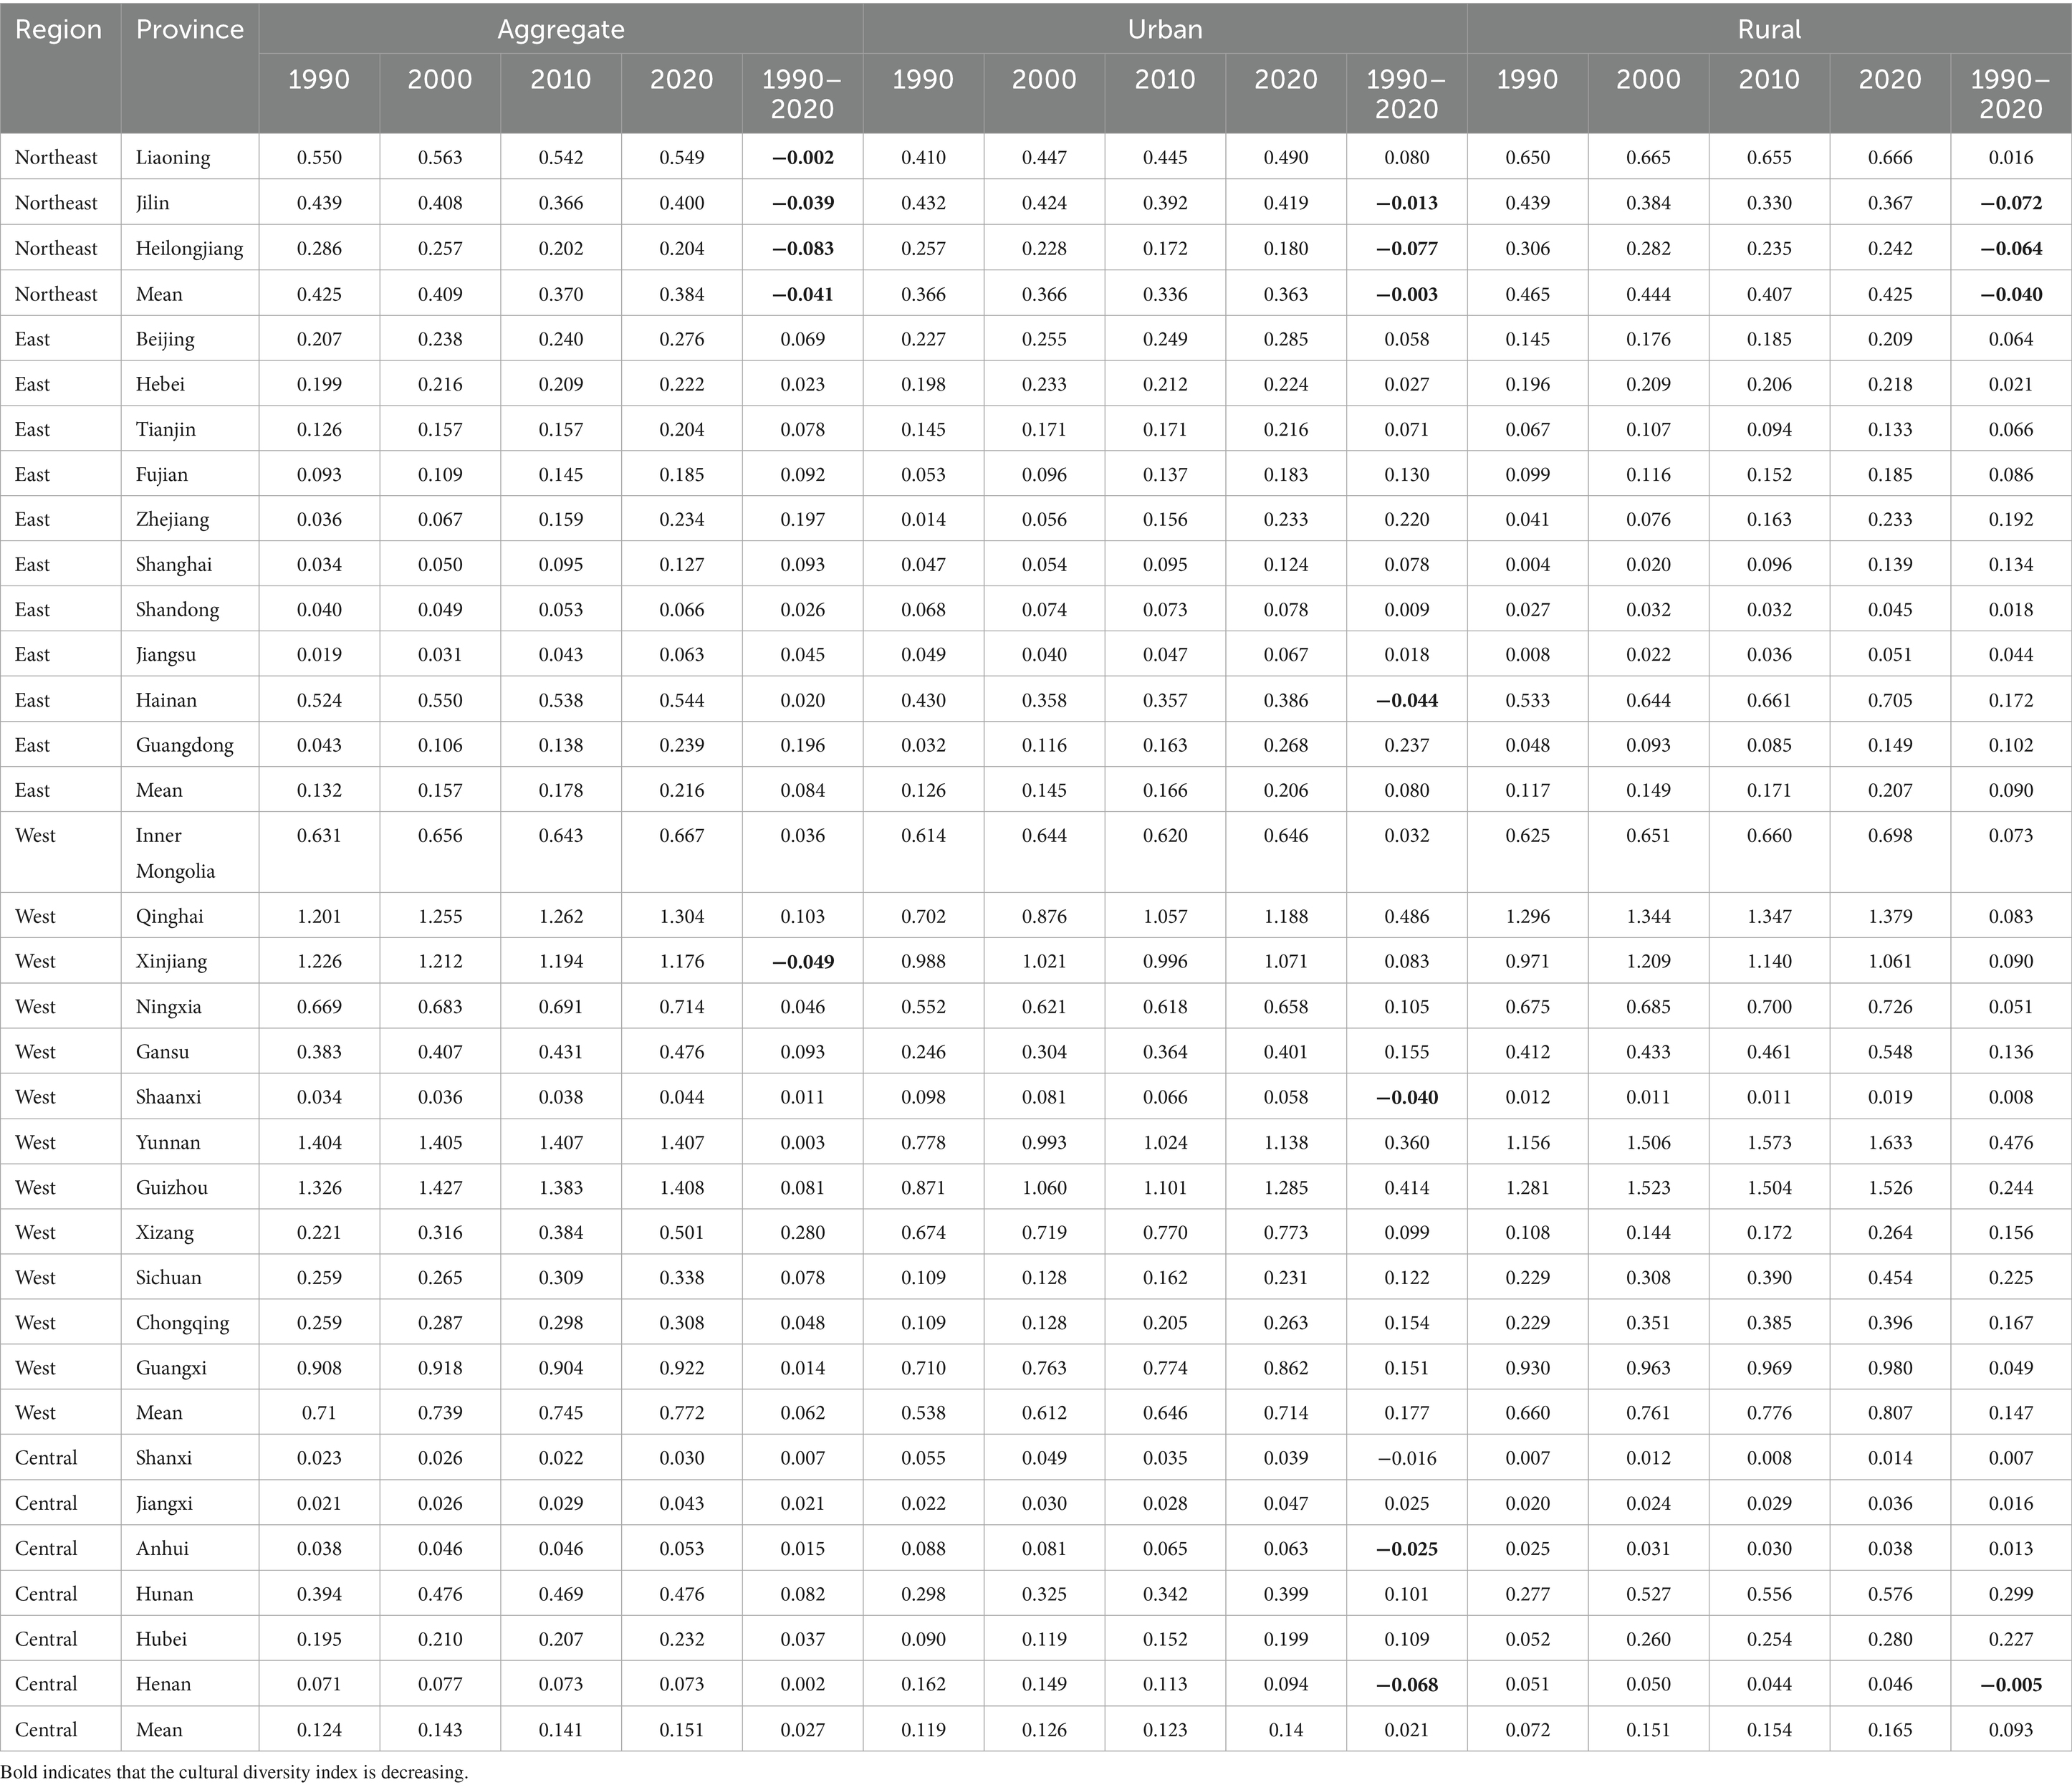
Table 1. Cultural diversity and its changes across Chinese provinces (1990–2020).
Figures 2c,d reveal that the spatial distribution pattern of urban cultural diversity generally aligns with the overall diversity pattern, maintaining the regional hierarchy of Western > Northeastern > Central > Eastern China. However, the number of provinces with high-level urban cultural diversity was lower than the aggregate cultural diversity. In 1990, only Xinjiang and Guizhou reached the highest diversity category, both with indices below 1, while provinces with extremely low urban cultural diversity were markedly more prevalent in urban areas compared to the aggregate cultural diversity pattern. Nevertheless, urban cultural diversity demonstrated faster developmental momentum, as evidenced by the 2020 distribution of highest-level diversity provinces converging with the aggregate cultural diversity pattern and a reduction in extremely low-diversity provinces. The urban cultural diversity trends exhibited greater variation across provinces (Table 1), with more provinces showing declining urban cultural diversity (Jilin, Heilongjiang, Hainan, Shaanxi, Shanxi, Anhui, and Henan) compared to the aggregate cultural diversity trend, suggesting weaker attractiveness to minority populations during these provinces’ urbanization processes. Conversely, eight provinces achieved growth rates exceeding 0.1, reflecting substantial ethnic population migration to urban areas during urbanization. This dual pattern highlights the complex interplay between urban development and ethnic demographic dynamics across different regions.
As shown in Figures 2e,f, the spatial distribution of aggregate cultural diversity similarly follows the regional pattern of Western > Northeastern > Central > Eastern China, yet maintains higher average levels compared to both the aggregate cultural diversity and urban cultural diversity measures. Further analysis of rural cultural diversity (Table 1) reveals that only three provinces - Jilin, Heilongjiang, and Henan - exhibited declining trends, attributable to substantial rural-to-urban migration and population outflow that diminished local diversity. In contrast, 12 provinces demonstrated growth rates exceeding 0.1, a markedly higher proportion than observed in either aggregate cultural diversity and urban cultural diversity, indicating the most pronounced dynamic changes occurring at the rural level. This pattern underscores the heightened sensitivity of rural cultural diversity to demographic shifts, where substantial ethnic population retention and redistribution have driven more rapid diversification compared to urban areas. The differential trends between declining and rapidly growing provinces highlight the complex interplay between rural depopulation and cultural transformation across Chinese regional contexts.
3.3 Spatio-temporal evolution characteristics based on the Gini coefficient
As shown in Figure 3, Gini coefficient of provincial cultural diversity demonstrated a consistent declining trend across aggregate, urban, and rural dimensions from 1990 to 2020, decreasing from 0.558, 0.501, and 0.560 to 0.487, 0.471, and 0.518 respectively, indicating a sustained reduction in cultural diversity disparities at the national level and reflecting progressive integration of multi-ethnic populations. Regional analysis reveals distinct spatial patterns, with regional disparities following the hierarchy of Central > Eastern > Western > Northeastern China. The Eastern region exhibited continuous convergence across all measurement dimensions, suggesting accelerating ethnic integration, while the Northeastern region showed opposite trends with widening disparities throughout the study period. The Central region displayed divergent trajectories - initial increase followed by decrease in aggregate and rural dimensions contrasted with persistent growth in urban areas, whereas the Western region maintained relative stability, with modest reductions in aggregate and rural cultural diversity gaps. These patterns collectively demonstrate the complex, dimension-specific nature of China’s regional cultural diversity evolution during its urbanization process.
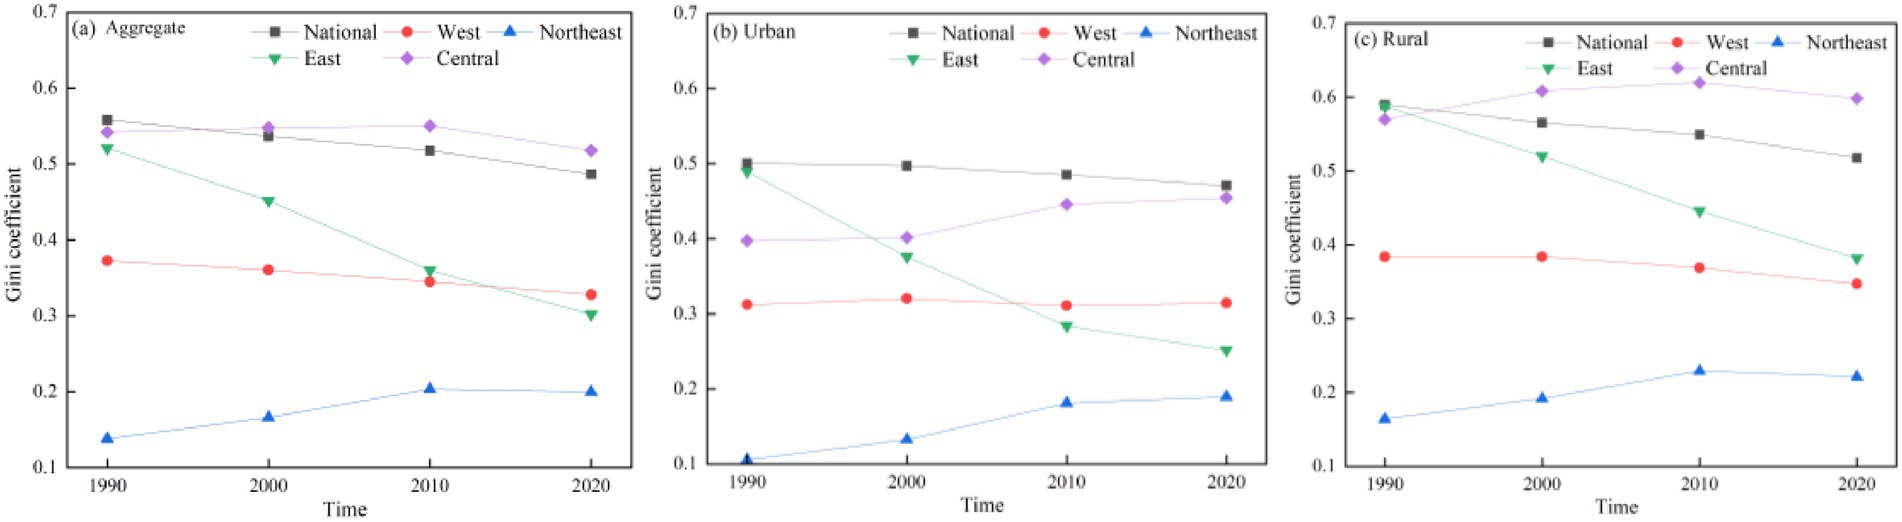
Figure 3. Intra-regional Dagum Gini coefficients for the nation and the four major regions.
Figure 4 presents interregional disparities across aggregate, urban, and rural dimensions, revealing that the greatest differences exist between Eastern and Central China, which exhibit divergent trends across measurement dimensions: while showing decreasing trends at both provincial and rural levels, these disparities demonstrate an increasing pattern in urban areas. The second most pronounced differences occur between Western and Eastern regions, displaying consistent declining trends throughout the study period. Other regional differentials exhibit certain fluctuations, with Northeast-Central and Northeast-East interregional gaps demonstrating decreasing trends across all three dimensions, whereas Northeast-West disparities show persistent increases in aggregate, urban, and rural measurements. This multidimensional analysis highlights the complex spatial–temporal dynamics of China’s regional cultural diversity patterns, where the direction and magnitude of interregional differences vary substantially depending on both geographic pairing and measurement dimension. These results suggest that regional integration processes have progressed unevenly across different spatial scales and sectoral contexts.
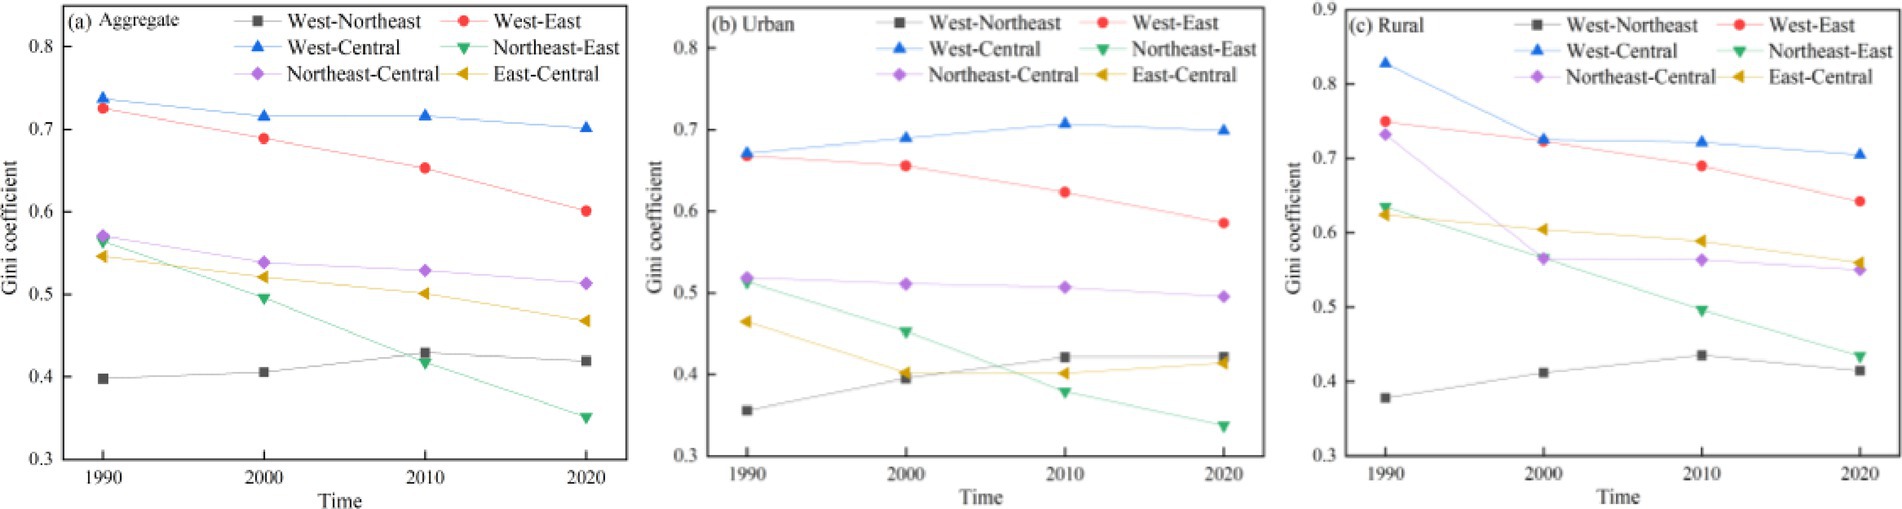
Figure 4. Inter-regional Dagum Gini coefficients among four major regions.
The decomposition results of Dagum Gini coefficients presented in Table 2 demonstrate that inter-regional disparities constitute the primary source of cultural diversity differences in China, accounting for 63.4–70.3% of total variation, followed by intra-regional differences (21.6–23.9%), while the contribution rate of transvariation density remains the lowest (8.1–12.7%). Temporally, the inter-regional disparities exhibit distinct trajectories across dimensions: showing an initial decline followed by an increase at both provincial and rural levels (1990–2000 decrease, 2000–2020 increase), while displaying an opposite pattern of first increasing then slightly decreasing in urban areas (1990–2010 rise, 2010–2020 modest decline), suggesting that reducing inter-regional disparities among the four major geographic divisions should be the focal point for promoting cultural integration in the foreseeable future. Particularly noteworthy is the consistent 10% average contribution rate of transvariation across all three dimensions, which not only confirms the virtual absence of sample overlap but also verifies the evident hierarchical development characteristics of cultural diversity levels among provinces, thereby providing crucial evidence for formulating differentiated regional cultural policies.
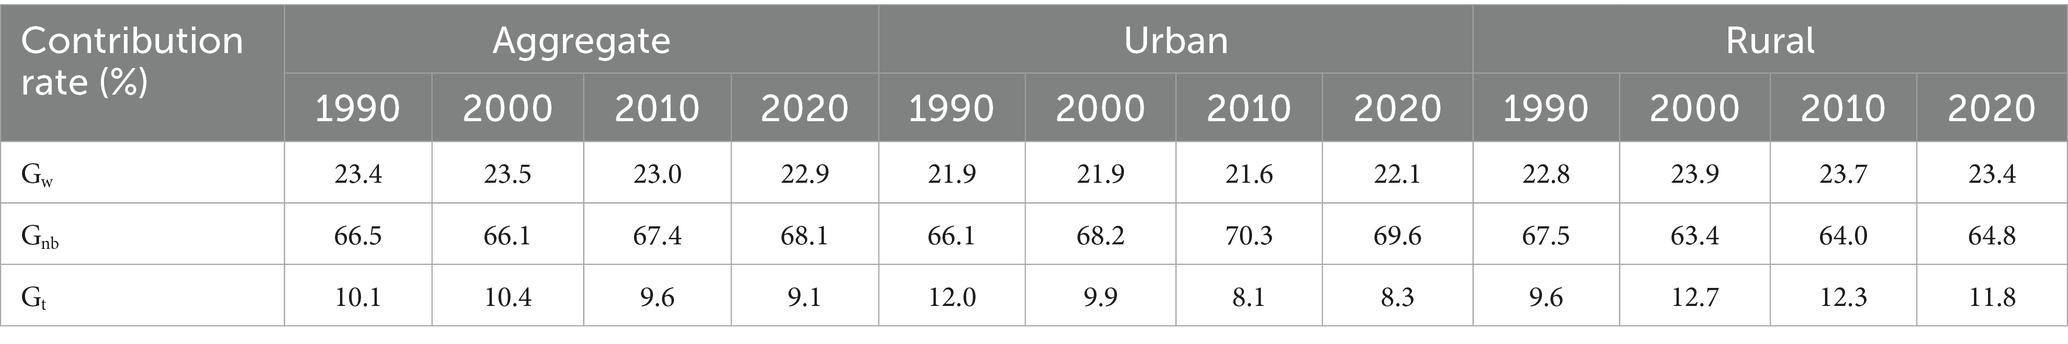
Table 2. Dagum Gini coefficient of cultural diversity and its source in different regions in 1990–2020.
3.4 Spatial autocorrelation analysis based on Moran’s I
As shown in Table 3, the global Moran’s I indices for China’s cultural diversity across all three dimensions (aggregate, urban, and rural) are consistently positive and demonstrate an upward trend, indicating statistically significant spatial autocorrelation with intensifying clustering patterns in the distribution of cultural diversity. Notably, the urban dimension exhibits the highest Moran’s I values, suggesting that urbanization processes have played a particularly influential role in reshaping the spatial configuration of cultural diversity. These results reveal that cultural diversity is not randomly distributed but rather displays increasingly concentrated spatial patterns, with urban areas serving as primary drivers of this spatial reorganization through their capacity to attract and integrate diverse populations. The strengthening spatial dependence highlights the emergence of distinct cultural regions shaped by both historical settlement patterns and contemporary migration flows under rapid urbanization.
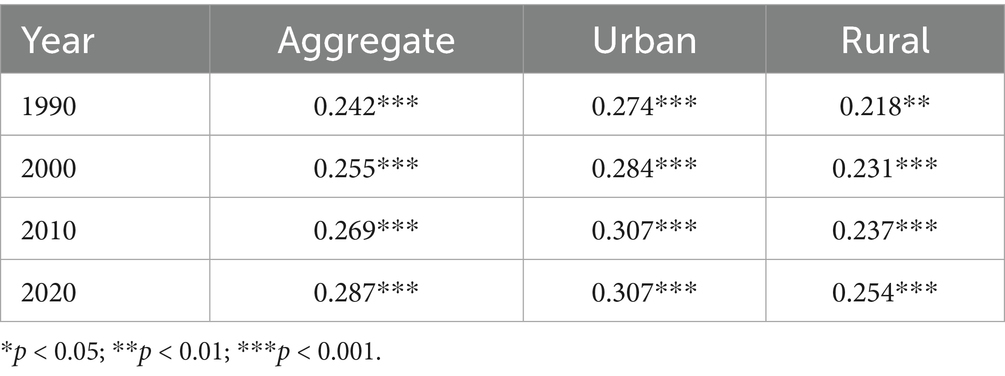
Table 3. Global Moran’s I of cultural diversity during 1990–2020.
Figure 5 presents the local spatial associations of cultural diversity, revealing that provinces with statistically significant local autocorrelation are predominantly clustered in “High-High,” “Low-Low,” and “Low-High” patterns (all p < 0.05), demonstrating pronounced spatial agglomeration effects in the distribution of cultural diversity across Chinese provinces. The spatial clustering patterns exhibit remarkable consistency across aggregate, urban, and rural dimensions, with “High-High” clusters primarily concentrated in western regions and “Low-Low” aggregations predominantly located in central and eastern areas. During the study period, both “High-High” and “Low-Low” clusters showed expansion, while “Low-High” transitional zones experienced contraction, indicating intensifying spatial polarization of cultural diversity characteristics and strengthening path dependence in regional cultural development trajectories. These patterns collectively suggest that cultural diversity is evolving toward more defined spatial demarcations with increasingly homogeneous intra-regional and heterogeneous inter-regional characteristics.
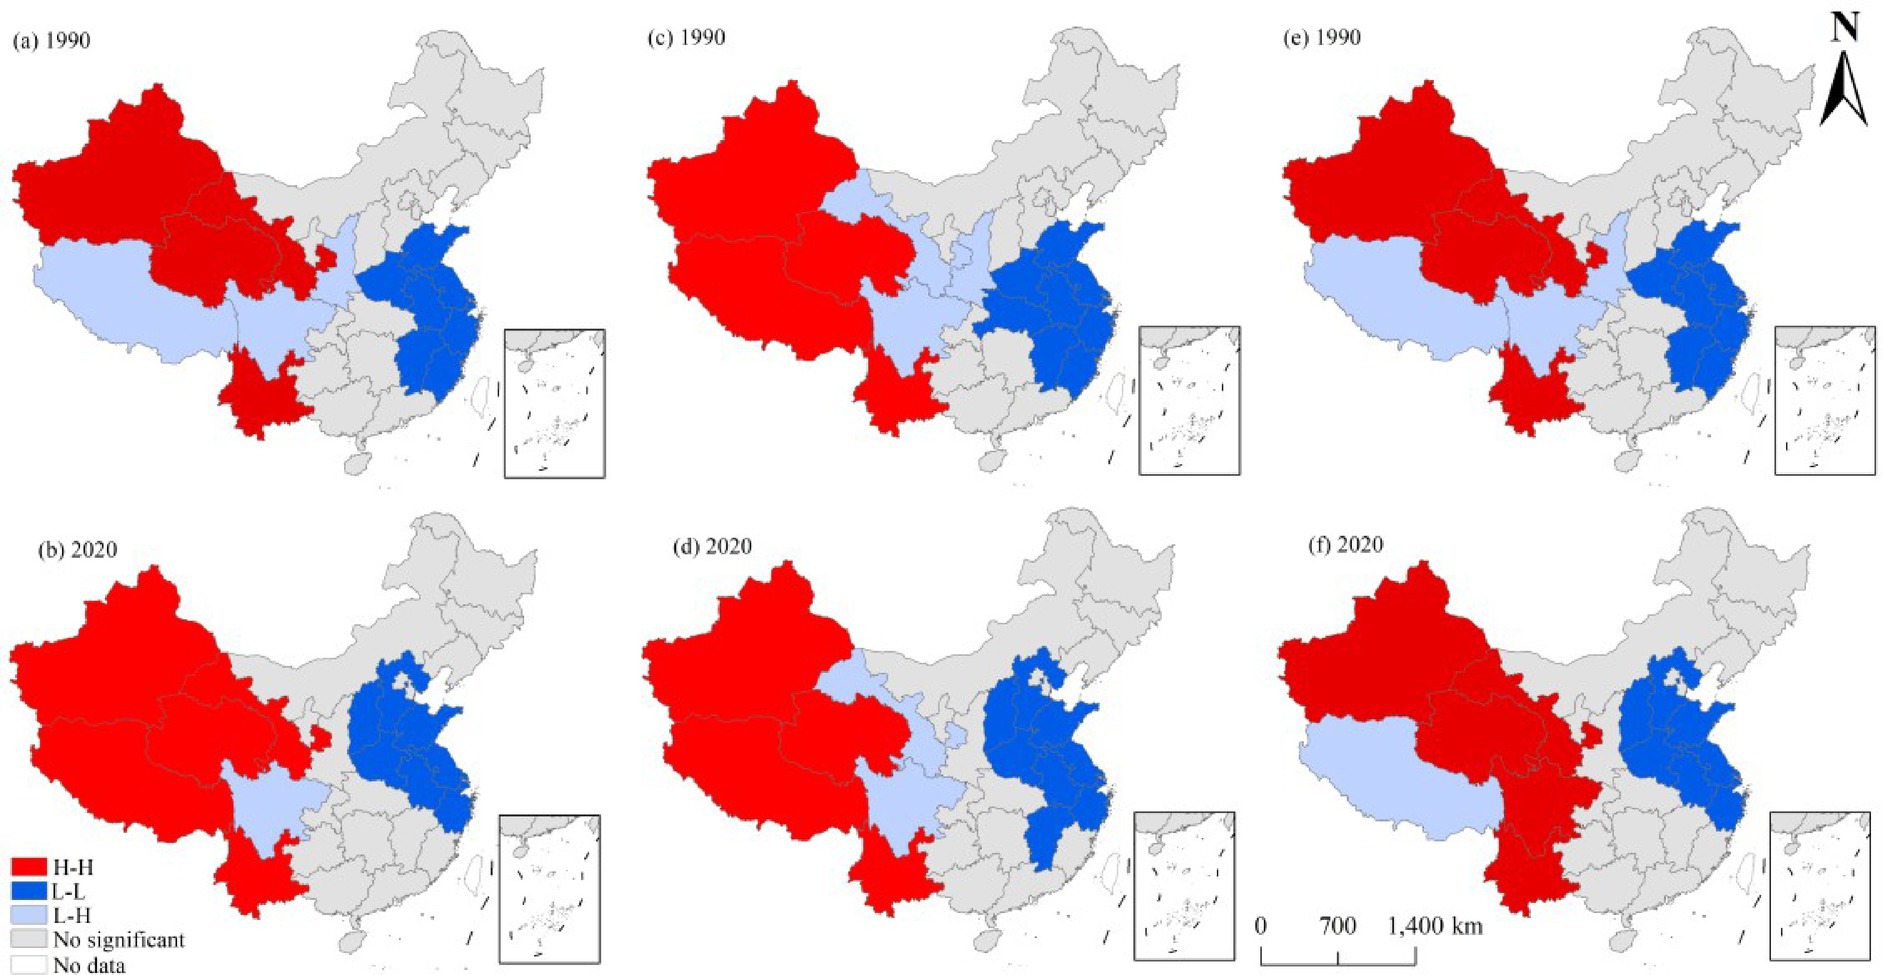
Figure 5. Bivariate LISA cluster maps of cultural diversity in China during 1990–2020. Aggregate cultural diversity: (a,b), urban cultural diversity: (c,d), and rural cultural diversity: (e,f).
3.5 Spatial correlation analysis based on the gravity model
Figure 6 reveals distinct patterns in the gravitational linkage intensity of cultural diversity across aggregate, urban, and rural dimensions, with rural areas exhibiting the strongest interregional connections, followed by the aggregate level, while urban dimensions demonstrate the weakest linkages. Spatially, all three dimensions share similar distribution characteristics: weak gravitational associations predominantly cluster in central and eastern regions characterized by Han-dominant populations with limited ethnic minority distribution, where restricted population mobility during the early reform and opening-up period further constrained cultural integration with other regions. Moderate linkages primarily form a “C-shaped” pattern across northern, western, and southwestern areas, whereas strong and very strong connections concentrate between specific provincial pairs including Gansu-Qinghai, Yunnan-Guizhou, and Guizhou-Guangxi. Temporally, all three dimensions show enhanced gravitational associations among provinces throughout the study period, particularly in northern, western and southern regions, reflecting intensified cultural exchanges and population mobility patterns under Chinese urbanization and regional development policies. These spatial–temporal dynamics collectively demonstrate how historical demographic distributions, contemporary migration trends, and uneven regional development have jointly shaped the evolving network of interprovincial cultural interactions.
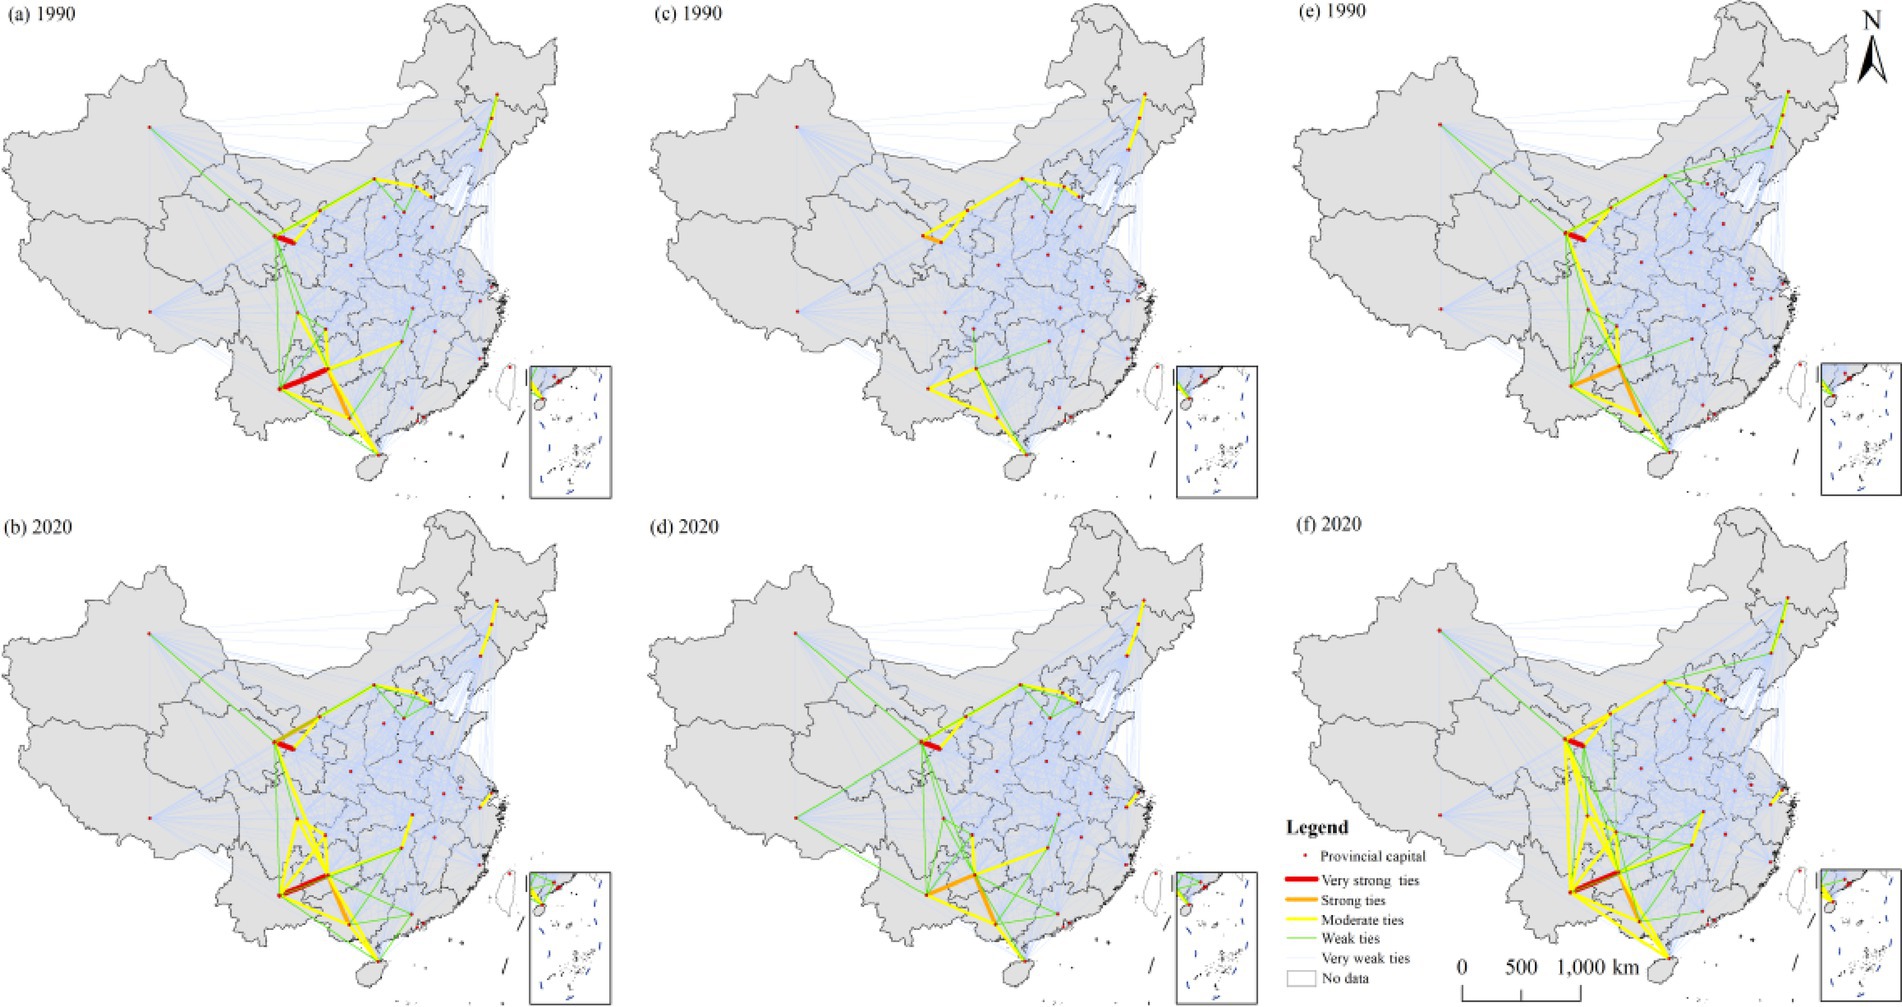
Figure 6. Spatiotemporal evolution of interprovincial cultural diversity linkages in China. Aggregate cultural diversity: (a,b), urban cultural diversity: (c,d), and rural cultural diversity: (e,f).
4 Discussions
4.1 Interpretation of findings
China’s cultural diversity exhibits a distinct spatial pattern characterized by higher levels in western and northeastern regions compared to relatively lower diversity in central and eastern areas, a finding consistent with previous research (Chen, 2023; Qu and Meng, 2014). This spatial differentiation fundamentally stems from the country’s complex natural geography. Topographically, Chinese three-terrace configuration features predominantly plateau and mountainous terrain in the western first and second terraces, where historically these rugged landscapes served as natural barriers that limited ethnic integration and fostered the development of distinct cultural traditions in relatively isolated environments. However, the third terrace’s plains and hills facilitated large-scale agriculture and became the heartland of Han Chinese settlement. Climatically, spanning nearly 50 degrees of latitude with six temperature zones (from cold temperate to tropical) plus the Qinghai-Tibet Plateau vertical climate zone, combined with precipitation gradients, the country has developed diverse ecosystems including northern arid/semi-arid pastoral grasslands, western alpine pastoral regions, and southern humid agricultural areas. It is through this interplay of topographic and climatic factors that China gradually formed its current cultural geography - a low-cultural diversity Han Chinese core in central-eastern regions, grading into high-diversity minority concentration zones extending westward, northward, and southward, exemplifying the profound, long-term interaction between natural environments and socio-cultural development.
From a temporal evolution perspective, China’s cultural diversity has demonstrated a continuous growth trend across aggregate, urban, and rural dimensions, indicating progressive integration of ethnic populations, a phenomenon closely tied to national minority fertility policies. Since the nationwide implementation of family planning policies in the mid-1970s, ethnic autonomous regions in western China successively formulated localized family planning regulations that implemented more lenient childbirth provisions for minority groups compared to the Han majority (Cheng and Chen, 2008; Zhang, 2011). This policy differential has resulted in substantially higher population growth rates in minority regions relative to the national average, with the minority population proportion increasing from 8.04% in 1990 to 8.89% by 2020. The expanding minority population has greatly contributed to ethnic integration and enhanced cultural diversity. Initially, this demographic shift primarily manifested in accelerated rural cultural diversity growth, as minority populations were traditionally concentrated in rural areas. However, with rapid urbanization in recent years, cities have increasingly attracted minority migrants, consequently driving faster development of urban cultural diversity. This dual rural–urban dynamic reflects the complex interplay between demographic policies, migration patterns, and spatial transformation in shaping Chinese evolving cultural landscape.
From a spatial evolution perspective, China’s cultural diversity has shown consistent increasing trends in western, central, and eastern regions, while demonstrating continuous decline in the northeast - a phenomenon attributed to severe negative population growth in this region resulting from both rapidly declining birth rates and accelerated outmigration (Chen and Wu, 2024; Zhang and Wang, 2023). Despite overall growth in other regions, spatial imbalances persist: at the aggregate level, diversity growth rates follow an eastern>western>central pattern; urban dimensions exhibit western>eastern>central progression; while rural areas display western>central>eastern gradients. This spatial heterogeneity reflects Chinese intensifying interprovincial migration patterns, with eastern provinces emerging as primary destinations - the proportion of both Han and minority interprovincial migrants flowing eastward increased dramatically from 54.8 and 49.0% in 1990 to 80.5 and 78.8% by 2010, respectively, (Huang and Duan, 2022), substantially boosting eastern regions’ aggregate cultural diversity. Urban cultural diversity growth primarily stems from rural-to-urban migration, particularly impactful in western cities that receive disproportionate flows from minority-concentrated rural areas (Jiao, 2014). Meanwhile, rural cultural diversity patterns remain fundamentally shaped by the original ethnic distribution, maintaining a distinct west–east decreasing gradient that correlates with historical settlement patterns. These multidimensional dynamics collectively illustrate how migration selectivity, urbanization pressures, and regional development disparities interact to reshape China’s cultural geography.
Since the implementation of reform and opening-up policies, China has witnessed the gradual establishment and improvement of its market economy system, leading to massive population migration from rural to urban areas and from central-western to eastern regions under the pull forces of investment and economic opportunities (Wang et al., 2023). Coastal provinces, in particular, have experienced rapid economic development that enhanced their attractiveness to diverse talents, with Guangdong and Zhejiang emerging as top destinations for minority migrants by 2020 (Xu and Wang, 2022), consequently boosting their cultural diversity levels. Our findings confirm that eastern regions demonstrate the fastest growth rate in average cultural diversity, thereby contributing to reduced interprovincial diversity disparities nationwide. However, regional variations persist - while intra-regional differences continue to decline in eastern areas due to their strong economic performance and capacity to attract diverse migrant populations that help balance local cultural diversity (Ma et al., 2024). Northeastern regions exhibit the opposite trend of increasing intra-regional disparities, likely resulting from differential outmigration patterns among minority groups (Liu et al., 2024) that disrupt previously balanced ethnic distributions. These diverging intra-regional dynamics ultimately contribute to emerging inter-regional differences, collectively shaping the evolving landscape of Chinese provincial cultural diversity patterns. The contrasting regional trajectories highlight how economic development disparities and varying capacities to absorb migrant populations interact to produce complex spatial differentiations in cultural diversity across Chinese provinces.
4.2 Policy implications
Despite China’s continuous improvement in cultural diversity, significant imbalances persist between urban and rural areas and across different regions. To further promote the regional development of cultural diversity and enhance cultural exchange and integration among regions, the following policy recommendations are proposed:
Firstly, sustained encouragement and support should be provided for fertility policies targeting ethnic minorities in western and northeastern regions. Local government support should be strengthened through measures such as childbirth subsidies, tax reductions, and expanded healthcare coverage (Zhang, 2011). For ethnic groups with very small populations, such as the Oroqen and Derung, all restrictions on birth numbers should be lifted to facilitate the preservation of ethnic minority cultures (Yang, 2023).
Secondly, in response to the ongoing regional mobility of ethnic minorities nationwide, active promotion of migration flows from western and northeastern regions to central and eastern areas should be implemented. However, these populations may face challenges such as employment discrimination, housing inequality, limited access to education, and inadequate healthcare (Zhong and Shi, 2025). Therefore, destination governments should prioritize enhancing intercultural integration by implementing comprehensive policy safeguards and social services addressing employment, children’s education, and healthcare for migrant ethnic minority groups.
Thirdly, as cultural diversity constitutes an integral part of regional cultural development, systematic efforts are needed to preserve and disseminate migrant minority cultures. Coordinated actions between local governments and research institutions are required to protect cultural diversity through policies that enhance intercultural connections and integration (Huang et al., 2022; Ning et al., 2025). Consequently, while establishing cultural preservation as a shared social responsibility, it is essential to foster a sense of community belonging and pride. These multidimensional strategies aim to address existing disparities while leveraging opportunities for immigration-oriented cultural exchange and development.
4.3 Limitations and prospects
Based on China’s 1990–2020 census data, this study measured provincial cultural diversity and analyzed its spatiotemporal evolution patterns. Additionally, it explored the strength of interregional cultural diversity connections. While the findings hold significance for promoting cultural integration and development, several limitations remain. First, cultural diversity is a highly complex concept encompassing not only ethnic/racial population diversity but also language, religion, customs, and more. The exclusive use of ethnic population proportions as a proxy indicator presents limitations. Subsequent research should integrate language (e.g., number of regional dialects), religion (e.g., number of regional religions), and cultural practices (e.g., intangible cultural heritage items) to measure cultural diversity more comprehensively. Second, cultural diversity exhibits long-term and dynamic characteristics. This study only measured Chinese cultural diversity at four time points (1990, 2000, 2010, 2020) and analyzed its spatiotemporal evolution solely at the provincial scale, whereas finer scales could capture more regional variations. Therefore, future work could involve analyses at smaller scales and over longer time series to enhance data accuracy and capture more features of regional differences. Third, the spatiotemporal evolution of cultural diversity is influenced by multiple factors, including geographical environment, policy systems, and population mobility. However, due to data accessibility and model complexity, the specific effects of these influencing factors were not quantified. Future research should incorporate more specific variables to explore their quantitative effects, constructing a comprehensive and systematic analytical framework to gain deeper insights into the spatiotemporal evolution of cultural diversity.
5 Conclusion
Building upon a comprehensive understanding of the conceptual dimensions and characteristic features of cultural diversity, this study employs Shannon-Weiner diversity index to measure cultural diversity across Chinese 31 provinces during four census years (1990, 2000, 2010, and 2020), followed by advanced spatial analyses using Dagum Gini coefficient decomposition, kernel density estimation, Moran’s I statistics, and gravity modeling to systematically investigate the spatial patterns and evolutionary characteristics of aggregate cultural diversity. The key findings reveal:
1. During the study period, China’s cultural diversity at the aggregate, urban, and rural scales increased from 0.51, 0.32, and 0.50 in 1990 to 0.55, 0.44, and 0.74 in 2020, respectively, showing an upward trend across all scales. Both urban and rural areas exhibited higher growth rates than the aggregate level. Regionally, a pattern of higher cultural diversity in western areas compared to eastern areas was consistently observed.
2. Chinese national disparities in cultural diversity demonstrate consistent declining trends across aggregate, urban, and rural dimensions. While exhibiting distinct regional patterns: the eastern region shows comprehensive convergence across all three measurement levels, reflecting its advanced stage of cultural integration; the western region maintains moderate diversity gaps with slight reductions in overall and rural dimensions contrasted by minor urban increases; the northeastern region, while displaying the lowest baseline cultural diversity, exhibits concerning upward divergence trends; and the central region presents dimensional variations where rural disparities notably exceed both urban and aggregate measures (rural > urban > aggregate). These differential trajectories highlight how regional development imbalances and varying urbanization processes have collectively shaped the complex spatial–temporal evolution of cultural diversity landscape.
3. China’s interprovincial cultural diversity exhibited significant spatial positive autocorrelation. The spatial distribution pattern demonstrated High-High clusters in western provinces and Low-Low clusters in eastern coastal areas. Gravity model analysis revealed a distinctive C-shaped strong connection network, which both expanded spatially and intensified over the study period.
Data availability statement
The original contributions presented in the study are included in the article/supplementary material, further inquiries can be directed to the corresponding author/s.
Author contributions
MZ: Conceptualization, Data curation, Formal analysis, Funding acquisition, Project administration, Writing – original draft, Writing – review & editing.
Funding
The author(s) declare that financial support was received for the research and/or publication of this article. This research was funded by the Science and Technology Research Projects of Henan Province (No. 242102321157) and Philosophy and Social Science Planning Project of Henan Province (No. 2024BJJ168).
Acknowledgments
The author would like to thank the reviewers for their constructive comments on improving this paper.
Conflict of interest
The author declares that the research was conducted in the absence of any commercial or financial relationships that could be construed as a potential conflict of interest.
Generative AI statement
The author declares that no Gen AI was used in the creation of this manuscript.
Any alternative text (alt text) provided alongside figures in this article has been generated by Frontiers with the support of artificial intelligence and reasonable efforts have been made to ensure accuracy, including review by the authors wherever possible. If you identify any issues, please contact us.
Publisher’s note
All claims expressed in this article are solely those of the authors and do not necessarily represent those of their affiliated organizations, or those of the publisher, the editors and the reviewers. Any product that may be evaluated in this article, or claim that may be made by its manufacturer, is not guaranteed or endorsed by the publisher.
References
Allain, M. L., and Waelbroeck, P. (2006). Music variety and retail concentration. Soc. Sci. Electron. 1:895131. doi: 10.2139/ssrn.895131
Amin, S., and Murshed, S. M. (2025). Diversity matters in the world of finance: does ethnic and religious diversity hinder financial development in developing dountries? Dev. Econ. 23:12434. doi: 10.1111/deve.12434
Anselin, L. (1995). Local indicators of spatial association—LISA. Geogr. Anal. 27, 93–115. doi: 10.1111/j.1538-4632.1995.tb00338.x
Chen, J. (2023). Study on the spatial and temporal pattern of cultural diversity in China: from the perspective of dialect, nationality and origin. Stud. Cul. Soft Power 8, 89–100. doi: 10.19468/j.cnki.2096-1987.2023.02.009
Chen, X., and Wu, Y. (2024). Spatial pattern of out-migrant and its impact mechanism in the three northeastern provinces of China. Popul. J. 46, 108–125. doi: 10.16405/j.cnki.1004-129X.2024.02.007
Cheng, Z., and Chen, Y. (2008). A study for western national minority population policy on stability, adjustment and the strategic way of the legalization. Northwest Popul. 29, 108–110+114. doi: 10.15884/j.cnki.issn.1007-0672
Cowen, T. (2008). Why everything has changed: the recent revolution in cultural economics. J. Cult. Econ. 32, 261–273. doi: 10.1007/s10824-008-9074-y
Dagum, C. (1997). A new approach to the decomposition of the Gini income inequality ratio. Empir. Econ. 22, 515–531. doi: 10.1007/BF01205777
Dai, L., and Guo, J. (2025). Cultural diversity of cognitive methodology: from the perspective of educational practice and psychometrics. Curr. Psychol. 44, 10242–10252. doi: 10.1007/s12144-025-07804-0
Dobbs, C., Nitschke, C., and Kendal, D. (2017). Assessing the drivers shaping global patterns of urban vegetation landscape structure. Sci. Total Environ. 592, 171–177. doi: 10.1016/j.scitotenv.2017.03.058
Duan, H. Y., Cao, X., and Wei, Y. J. (2024). Urbanization, ethnic diversity, and the risk of violence: a case study of China's western frontier. China Rev. 24, 79–119.
Echeverri, A., Batista, N. M., Wolny, S., Herrera-R, G. A., Andrade-Rivas, F., Bailey, A., et al. (2024). Toward sustainable biocultural ecotourism: an integrated spatial analysis of cultural and biodiversity richness in Colombia. People Nat. 7, 194–214. doi: 10.1002/pan3.10755
Eluère, M., Heuzé, J. P., Godfrey, M., Cécé, V., Bartel-Radic, A., and Martin, L. J. (2025). The influence of cultural diversity on organizational citizenship behaviors in professional sport teams: the moderating role of intercultural competence. Int. J. Cross Cult. Manag. 25, 421–442. doi: 10.1177/14705958251332112
Eskelinen, A., Harpole, W. S., Jessen, M. T., Virtanen, R., and Hautier, Y. (2022). Light competition drives herbivore and nutrient effects on plant diversity. Nature 611, 301–305. doi: 10.1038/s41586-022-05383-9
Eyiah, A. K., Bondinuba, F. K., Adu-Gyamfi, L., and Liphadzi, M. (2025). Promoting effective management of cultural diversity in multinational construction project teams. Buildings 15:659. doi: 10.3390/buildings15050659
Farchy, J., and M’Barki, J. (2024). Measuring cultural diversity: policy and methodological issues. Eur. J. Cult. Manag. Pol. 13:12400. doi: 10.3389/ejcmp.2023.12400
Feng, W., Wu, Y. R., and Fu, Y. (2021). Dialect diversity and foreign direct investment in China. China World Econ. 29, 49–72. doi: 10.1111/cwe.12370
He, M., and Zhang, F. (2024). The relationship between cultural diversity and unity: issues in anthropological knowledge production for the modern states focusing on the nation studies of the boas school. Soc. Sci. Yunnan 2024, 80–91.
Hu, H. T., Yu, G. N., Xiong, X. L., Guo, L. J., and Huang, J. S. (2022). Cultural diversity and innovation: an empirical study from dialect. Technol. Soc. 69:10. doi: 10.1016/j.techsoc.2022.101939
Huang, F., and Duan, C. (2022). The development and evolution of the interembedding pattern between population mobility and ethnic space. J. Northwestern Ethnic Stud. 117, 128–142. doi: 10.16486/j.cnki.62-1035/d.20221216.007
Huang, Y., Shen, S., Hu, W., Li, Y., and Li, G. (2022). Construction of cultural heritage tourism corridor for the dissemination of historical culture: a case study of typical mountainous multi-ethnic area in China. Land 12. doi: 10.3390/land12010138
Huntington, S. P. (1996). The clash of civilizations and the remaking of world order. Hong Kong: The University of Hong Kong Libraries.
Igartua, J. J. (2013). Communication media and cultural diversity. Paper presented at the 1st international conference on technological ecosystem for enhancing Multiculturality (TEEM). SPAIN: Univ Salamanca, Salamanca, 14–15.
Jacoby, N., Polak, R., Grahn, J. A., Cameron, D. J., Lee, K. M., Godoy, R., et al. (2024). Commonality and variation in mental representations of music revealed by a cross-cultural comparison of rhythm priors in 15 countries. Nat. Hum. Behav. 8, 846–877. doi: 10.1038/s41562-023-01800-9
Jiao, K. (2014). Minority populations urbanization level and it’s trends in China. Ethno National Stud. 2014, 36–48.
Kestemont, M., Karsdorp, F., de Bruijn, E., Driscoll, M., Kapitan, K. A., Macháin, P. O., et al. (2022). Forgotten books: the application of unseen species models to the survival of culture. Science 375, 765–769. doi: 10.1126/science.abl7655
Klebl, C., Jetten, J., Bastian, B., and Cunningham, J. L. (2025). Biodiversity and cultural diversity are morally valued. Br. J. Soc. Psychol. 64:e12818. doi: 10.1111/bjso.12818
Kratschmer, S., Pachinger, B., Schwantzer, M., Paredes, D., Guzmán, G., Goméz, J. A., et al. (2019). Response of wild bee diversity, abundance, and functional traits to vineyard inter-row management intensity and landscape diversity across Europe. Ecol. Evol. 9, 4103–4115. doi: 10.1002/ece3.5039
Lee, H., Jacoby, N., Hennequin, R., and Moussallam, M. (2025). Mechanisms of cultural diversity in urban populations. Nat. Commun. 16:5192. doi: 10.1038/s41467-025-60538-2
Li, G., and Li, M. (2024). Provincial-level new quality productive forces in China: evaluation, spatial pattern and evolution characteristics. Econ. Geogr. 44, 116–125. doi: 10.15957/j.cnki.jjdl.2024.08.014
Liu, R., Luo, W. Y., and Su, R. Q. (2025). How does cultural diversity influence corporate AI development? Financ. Res. Lett. 81:107506. doi: 10.1016/j.frl.2025.107506
Liu, T., Yang, M., and Peng, R. (2024). Structure and destination choices of out-migrants from Northeast China: based on long-term comparative analysis of census data. Sci. Geogr. Sin. 44, 1016–1025. doi: 10.13249/j.cnki.sgs.20221091
Loh, J., and Harmon, D. (2005). A global index of biocultural diversity. Ecol. Indic. 5, 231–241. doi: 10.1016/j.ecolind.2005.02.005
Ma, N., Zhang, D., and Shen, T. (2024). Spatio-temporal dynamics and determinants of ethnic minority population spatial embedding in China. J. Ethnol. 15, 66–76.
Markowitz, H. M. (1955). Portfolio selection (order no. T-02902; 302020414). Available onine aty: https://www.proquest.com/dissertations-theses/portfolio-selection/docview/302020414/se-2.
Ning, B. Y., Omar, R., and Ye, Y. (2025). Intergenerational transmission or cultural loss? The continuity of ethnic identity among the Yao minority in China. Qual. Res. J. 25:17. doi: 10.1108/qrj-09-2024-0193
Omorov, A., Chokoeva, D., Kalchakeyev, K., Sheripbayev, A., and Kochorova, G. (2025). Interaction of linguistic and literary aspects in the context of the cultural diversity of the Turkic peoples of Central Asia. Open Cult. Stud. 9:20240041. doi: 10.1515/culture-2024-0041
Qu, A., and Meng, Z. (2014). Study on spatial-temporal pattern of cultural diversity and its affected factors in China. Hum. Geogr. 29, 53–59. doi: 10.13959/j.issn.1003-2398.2014.06.009
Qu, R., and Zeng, Y. (2014). Review of research on measuring cultural diversity. Soc. Sci. Heilongjiang 147, 62–66.
Scott, J. C. (2009). The difference: how the power of diversity creates better groups, firms, schools and societies. Soc. Forces 88, 471–473. doi: 10.1353/sof.0.0247
Shannon, C. E. (1997). The mathematical theory of communication (reprinted). Comput. Med. Pract. 14, 306–317. doi: 10.1063/1.3067010
Steele, L. G., Bostic, A., Lynch, S. M., and Abdelaaty, L. (2022). Measuring ethnic diversity. Ann. Rev. Sociol. 48, 43–63. doi: 10.1146/annurev-soc-030420-015435
Stirling, A. (1998). On the economics and analysis of diversity. SPRU Electronic Working Paper Series No. 28. Available online at: http://www.sussex.ac.uk/spru/1-6-1-2-1.html.
Stouffer, S. A. (1955). Communism, conformity, and civil liberties (leadership sample). New York: Doubleday.
Sun, J., and Gao, Y. (2022). Cultural diversity and city entrepreneurship activity. China Soft Sci. 2022, 85–95. doi: 10.3969/j.issn.1002-9753.2022.06.008
UNESCO (2005). Convention on the protection and promotion of the diversity of cultural expressions. Paris: United Nations Educational, Scientific and Cultural Organization.
UNESCO. (2009). United Nations Educational, Scientific and Cultural Organization. UNESCO World Report Investing in Cultural Diversity and Intercultural Dialogue.
Wang, S., Liu, W., and Liu, Y. (2022). Measurement and driving mechanism of regional economic integration in Yangtze River Delta: based on the perspective of high-quality development. Stat. Res. 39, 104–122. doi: 10.19343/j.cnki.11-1302/c.2022.12.007
Wang, J., Zhang, M., and Wang, N. (2023). Spatial pattern and influencing factors of China’s migrant population distribution. Popul. J. 45, 82–96. doi: 10.16405/j.cnki.1004-129X.2023.04.007
Wang, X., Zhao, Z., Cao, W., and Wang, S. (2021). Study of network characteristics and inter-provincial boundary effect of the Yangtze River Delta urban agglomeration: from the perspective of population flow. Geogr. Res. 40, 1621–1636. doi: 10.19343/j.cnki.11–1302/c.2022.12.007
Wang, T., Zhao, L., and Wang, Y. (2025). How does cultural diversity impact entrepreneurship? Evidence from dialect diversity in China. Post-Communist Econ. 37, 365–385. doi: 10.1080/14631377.2025.2463266
Xia, L. L., and Song, J. (2024). Cultural diversity, asset structure, and corporate litigation risk. Financ. Res. Lett. 69:106172. doi: 10.1016/j.frl.2024.106172
Xie, Z., Feng, M., Fang, H., and Ma, S. (2022). A study on the sense of community for the Chinese nation and ethnic cultural diversity. Ethno National Stud. 2022, 21–35.
Xu, X., Liu, Y., and Xiao, Z. (2015). Dialect and economic growt. China J. Econ. 2, 1–32. doi: 10.16513/j.cnki.cje.2015.02.001
Xu, Q., and Wang, Y. (2022). The spatial pattern and influencing factors of the migrant ethnic minorities in China. Popu. Dev. 28, 50–58. doi: 10.27456/d.cnki.gyndu.2020.000548
Xue, J., Yang, Y., Fang, C., Zhang, L., Zhang, H., and Zhang, X. (2025). Urban-rural residential electricity consumption inequality in Guangdong. Acta Geogr. Sin. 80, 1052–1067. doi: 10.11821/dlxb202504012
Yang, X. (2021). The regional difference and convergence of urban population size in China. Popul. J. 43, 5–19. doi: 10.16405/j.cnki.1004-129X.2021.02.001
Yang, J. (2023). Fertility transition of ethnic minority population in China. Popul. Econ. 285, 35–51. doi: 10.3969/j.issn.1000-4149.2023.00.020
Zhang, Y. (2011). Discussion on improving the population and birth policy in western minority areas. J. Ningxia Univ. 33, 131–136. doi: 10.3969/j.issn.1001-5744.2011.01.027
Zhang, L., and Wang, G. (2023). Study on the characteristics and main problems of negative population growth in Northeast China. Soc. Sci. J. 2023, 129–142.
Zhang, X., Wu, J., Yuan, J., and Chen, W. (2025). Can urban compactness improve ecosystem services: evidence from Chinese urban agglomerations. Ecol. Indic. 170:113075. doi: 10.1016/j.ecolind.2025.113075
Zhong, M., Liu, Q., and Hu, X. (2025). Understanding the county-level relationship between population change and ecological environment quality dynamic in China, 2000–2020. Front. Environ. Sci. 13:1513998. doi: 10.3389/fenvs.2025.1513998
Zhong, S., and Shi, E. (2025). The logical relationship between cultural diversity and globalization and its practical path. Contemp. Foreign Lang. Stud., 151–158+169. doi: 10.3969/j.issn.1674-8921.2025.01.014
Keywords: cultural diversity, cultural integration, Dagum Gini coefficient, gravity model, China
Citation: Zhong M (2025) Measuring cultural diversity and its spatiotemporal evolution across Chinese provinces. Front. Hum. Dyn. 7:1653866. doi: 10.3389/fhumd.2025.1653866
Edited by:
Ge Shi, Nanjing Tech University, ChinaCopyright © 2025 Zhong. This is an open-access article distributed under the terms of the Creative Commons Attribution License (CC BY). The use, distribution or reproduction in other forums is permitted, provided the original author(s) and the copyright owner(s) are credited and that the original publication in this journal is cited, in accordance with accepted academic practice. No use, distribution or reproduction is permitted which does not comply with these terms.
*Correspondence: Mingxing Zhong, bWluZ3hpbmdoZW51QDE2My5jb20=